essential reliability services from pv...
TRANSCRIPT

Essential Reliability Services From
PV Plants
Mahesh Morjaria, Ph. D.VP, PV Systems
Enabling a world powered by reliable, affordable
solar electricity.

2
Utility-Scale PV Plants Contribute to Grid Stability & Reliability Like Conventional Generation
Utility-Scale PV Plants Support Grid Stability & Reliability
Source: NERC: 2012 Special Assessment Interconnection Requirements for Variable Generation
Utility-Scale PV Plants Provide Grid Friendly Features Required by NERC:
Voltage regulation
Real power control, ramping, and curtailment
Primary frequency regulation
Frequency droop response
Short circuit duty control
Fault ride through
© C
op
yri
gh
t F
irs
t S
ola
r, I
nc
. 9
Oc
tob
er
20
17
3
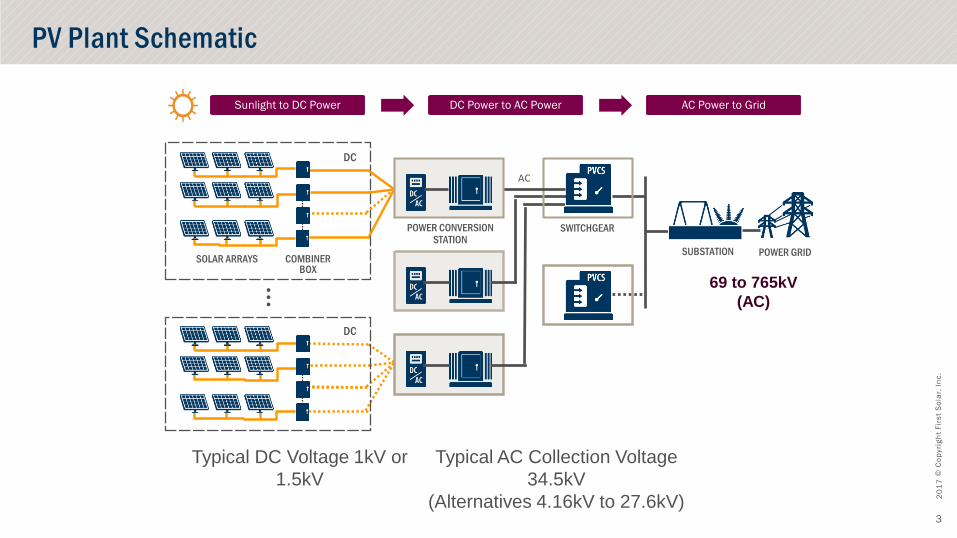
PV Plant Schematic
POWER GRIDSUBSTATION
DC
•••
Sunlight to DC Power DC Power to AC Power AC Power to Grid
SWITCHGEAR
AC
SOLAR ARRAYS COMBINERBOX
DC
POWER CONVERSION STATION
Typical DC Voltage 1kV or
1.5kV
Typical AC Collection Voltage
34.5kV
(Alternatives 4.16kV to 27.6kV)
69 to 765kV
(AC)
© C
op
yri
gh
t F
irs
t S
ola
r, I
nc
. 9
Oc
tob
er
20
17
4
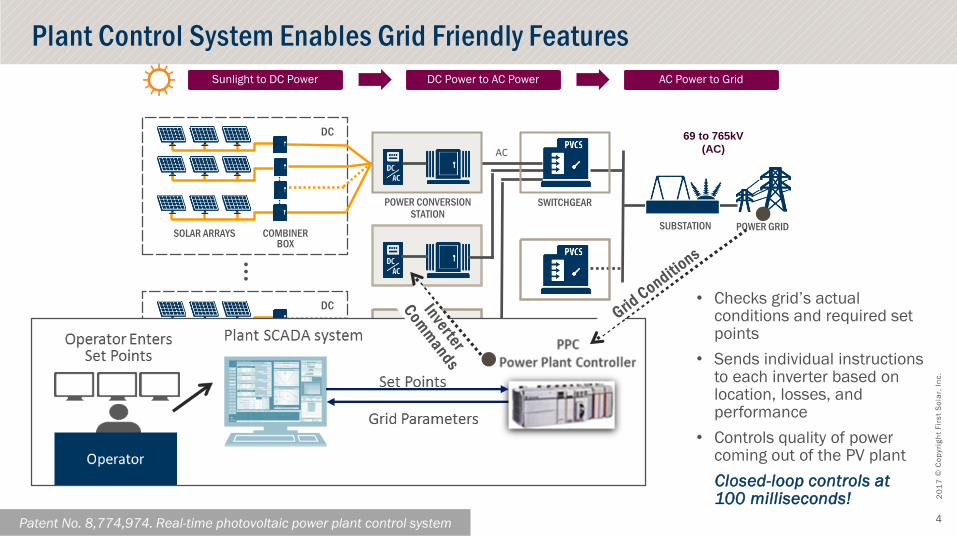
Plant Control System Enables Grid Friendly Features
Patent No. 8,774,974. Real-time photovoltaic power plant control system
POWER GRIDSUBSTATION
DC
•••
Sunlight to DC Power DC Power to AC Power AC Power to Grid
SWITCHGEAR
AC
SOLAR ARRAYS COMBINERBOX
DC
POWER CONVERSION STATION
Typical DC Voltage 1kV or 1.5kV Typical AC Collection Voltage 34.5kV
(Alternatives 4.16kV to 27.6kV)
69 to 765kV
(AC)
• Checks grid’s actual conditions and required set points
• Sends individual instructions to each inverter based on location, losses, and performance
• Controls quality of power coming out of the PV plant
Closed-loop controls at 100 milliseconds!
© C
op
yri
gh
t F
irs
t S
ola
r, I
nc
. 9
Oc
tob
er
20
17
5
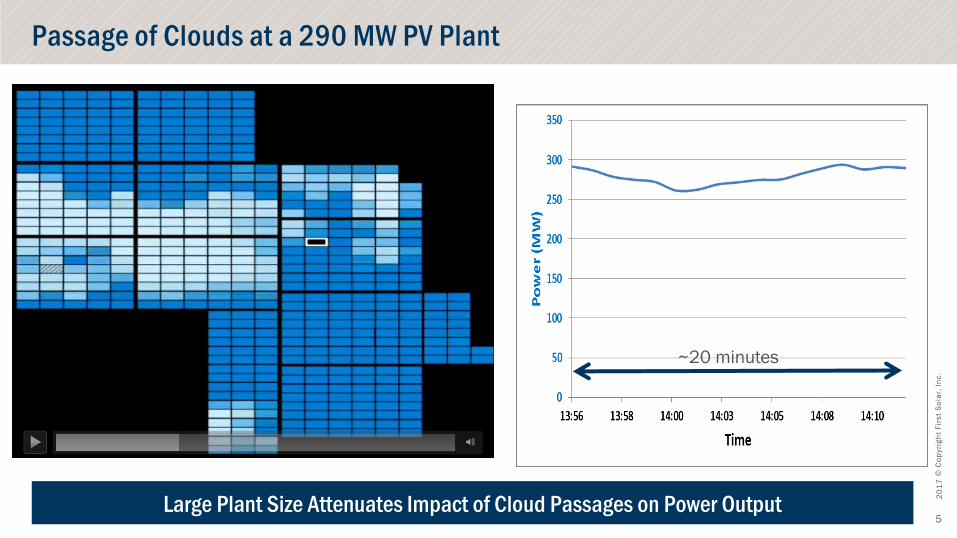
Passage of Clouds at a 290 MW PV Plant
~20 minutes
Large Plant Size Attenuates Impact of Cloud Passages on Power Output
© C
op
yri
gh
t F
irs
t S
ola
r, I
nc
. 9
Oc
tob
er
20
17
6
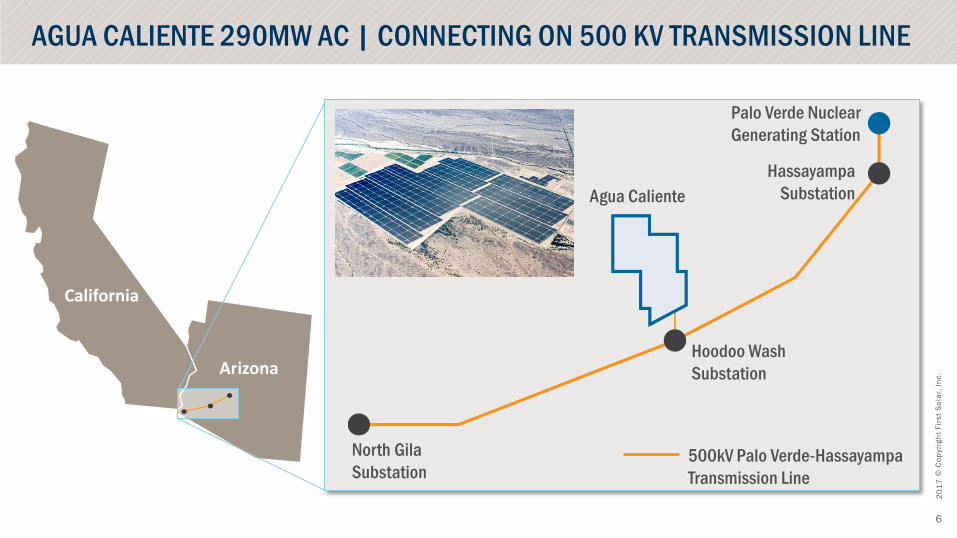
AGUA CALIENTE 290MW AC | CONNECTING ON 500 KV TRANSMISSION LINE
California
Arizona
Palo Verde Nuclear
Generating Station
North Gila
Substation
Hoodoo Wash
Substation
Agua Caliente
500kV Palo Verde-Hassayampa
Transmission Line
Hassayampa
Substation
© C
op
yri
gh
t F
irs
t S
ola
r, I
nc
. 9
Oc
tob
er
20
17
7
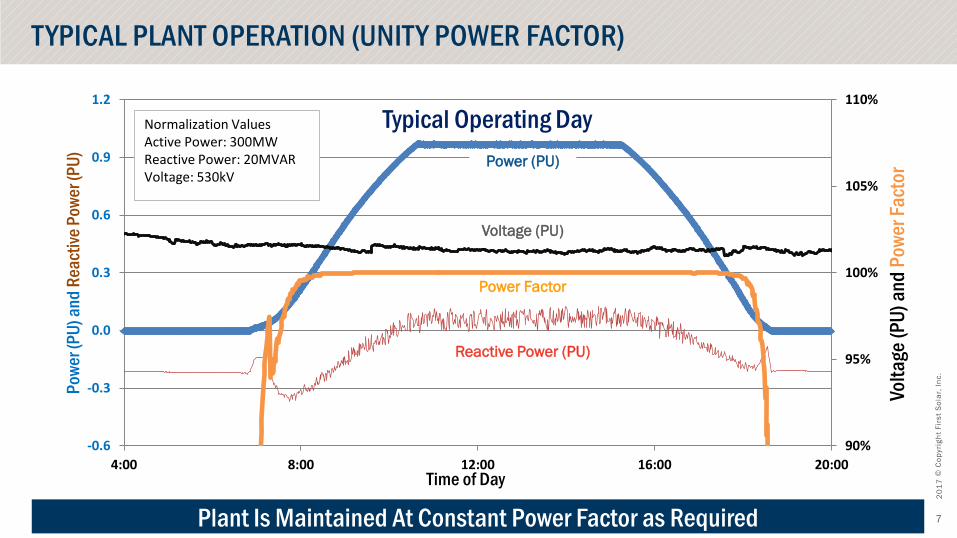
TYPICAL PLANT OPERATION (UNITY POWER FACTOR)
Plant Is Maintained At Constant Power Factor as Required
90%
95%
100%
105%
110%
-0.6
-0.3
0.0
0.3
0.6
0.9
1.2
4:00 8:00 12:00 16:00 20:00
Volt
age
(P
U)
an
d P
ow
er F
act
or
Po
we
r (P
U) a
nd
Rea
ctiv
e P
ow
er (
PU
)
Time of Day
Typical Operating Day
Reactive Power (PU)
Voltage (PU)
Power (PU)
Power Factor
Normalization ValuesActive Power: 300MWReactive Power: 20MVARVoltage: 530kV
© C
op
yri
gh
t F
irs
t S
ola
r, I
nc
. 9
Oc
tob
er
20
17
8
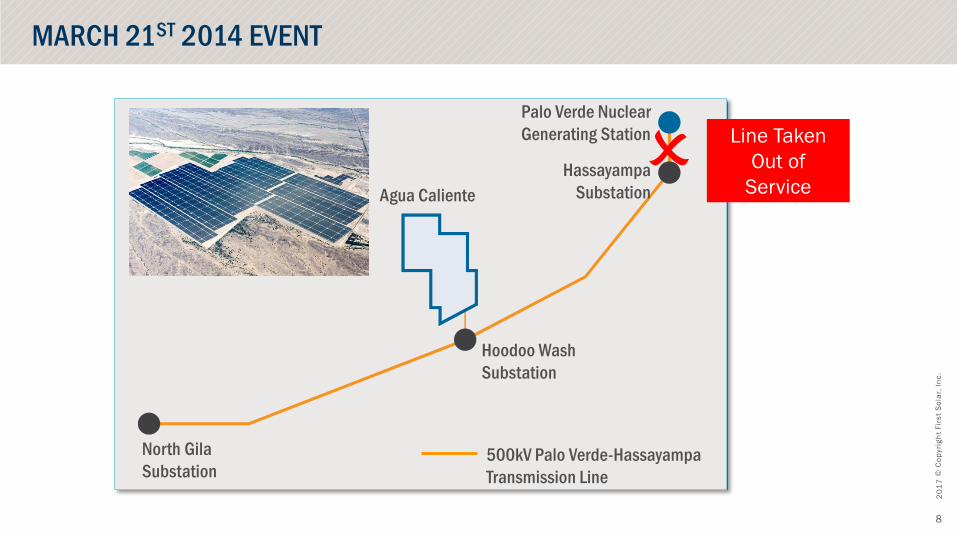
MARCH 21ST 2014 EVENT
Palo Verde Nuclear
Generating Station
North Gila
Substation
Hoodoo Wash
Substation
Agua Caliente
500kV Palo Verde-Hassayampa
Transmission Line
Hassayampa
SubstationO
Line Taken
Out of
Service
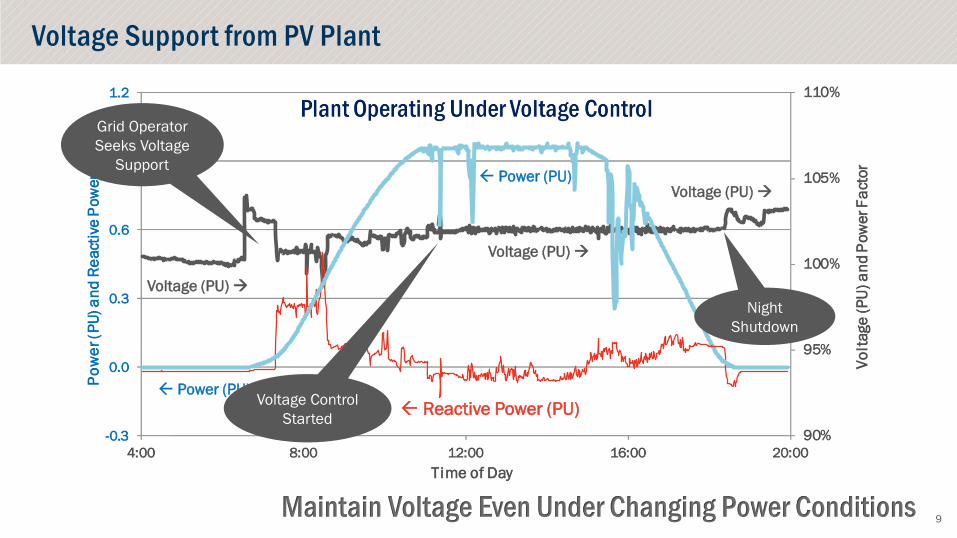
9Maintain Voltage Even Under Changing Power Conditions
Power (PU)
Reactive Power (PU)
Voltage (PU)
Voltage (PU)
Power (PU)
Voltage (PU)
Voltage Support from PV Plant
Grid Operator
Seeks Voltage
Support
Voltage Control
Started
Night
Shutdown

Demonstration of Essential Reliability Services by a 300-MW Solar PV Power Plant
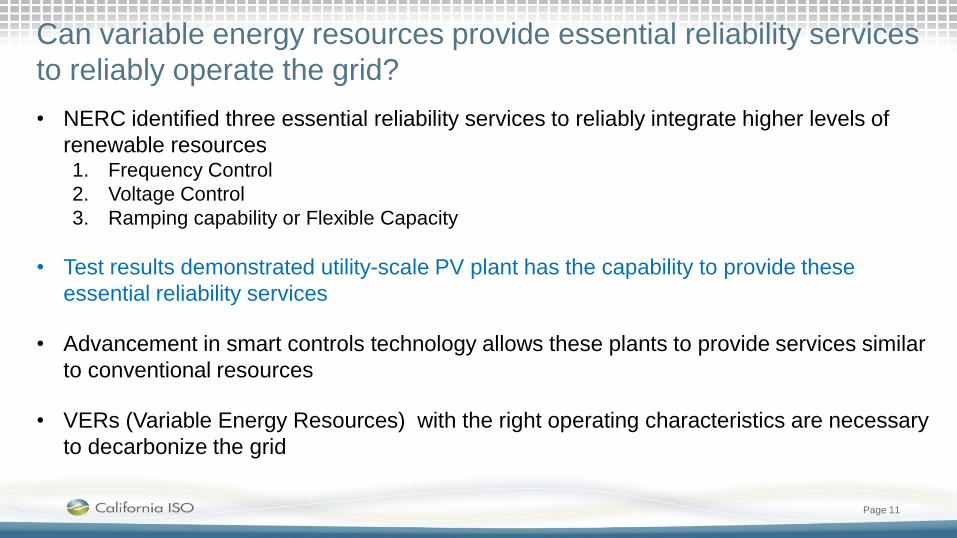
Can variable energy resources provide essential reliability services
to reliably operate the grid?
• NERC identified three essential reliability services to reliably integrate higher levels of
renewable resources1. Frequency Control
2. Voltage Control
3. Ramping capability or Flexible Capacity
• Test results demonstrated utility-scale PV plant has the capability to provide these
essential reliability services
• Advancement in smart controls technology allows these plants to provide services similar
to conventional resources
• VERs (Variable Energy Resources) with the right operating characteristics are necessary
to decarbonize the grid
Page 11

© C
op
yri
gh
t F
irs
t S
ola
r, I
nc
. 9
Oc
tob
er
20
17
12
• First Solar PV modules
• 4 MVA PV inverters
• 8 x 40 MVA blocks
• 34.5 kV collector system
• Two 170 MVA transformers
• Tie with 230 kV transmission line
• PMUs collecting data on 230 kV side
PV Power Plant Description
40 MVA Block
34.5 kV
Collection
170 MVA
Transformer
230 kV
Transmission
PMU4MVA Inverter
© C
op
yri
gh
t F
irs
t S
ola
r, I
nc
. 9
Oc
tob
er
20
17
13
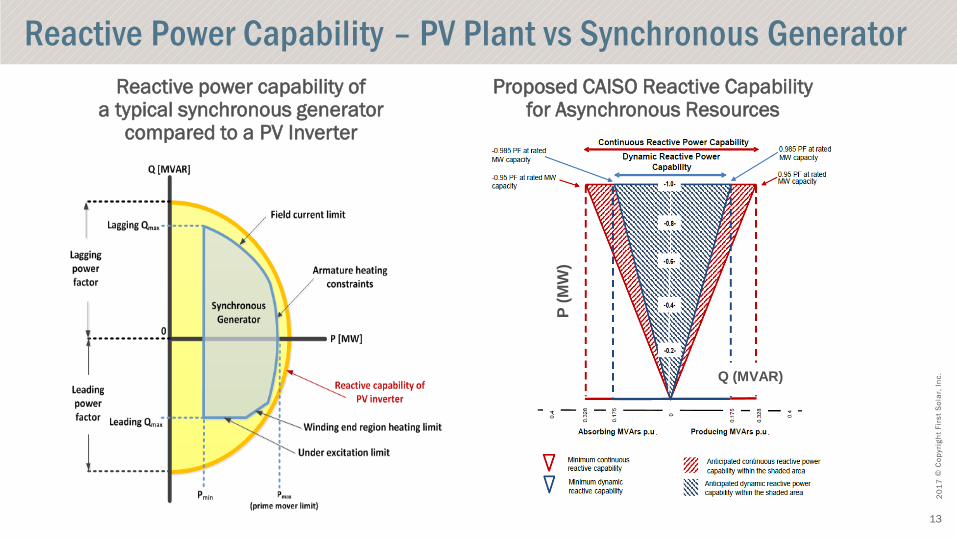
Reactive power capability of a typical synchronous generator
compared to a PV Inverter
Proposed CAISO Reactive Capability for Asynchronous Resources
Q (MVAR)
P (
MW
)
Reactive Power Capability – PV Plant vs Synchronous Generator
© C
op
yri
gh
t F
irs
t S
ola
r, I
nc
. 9
Oc
tob
er
20
17
14
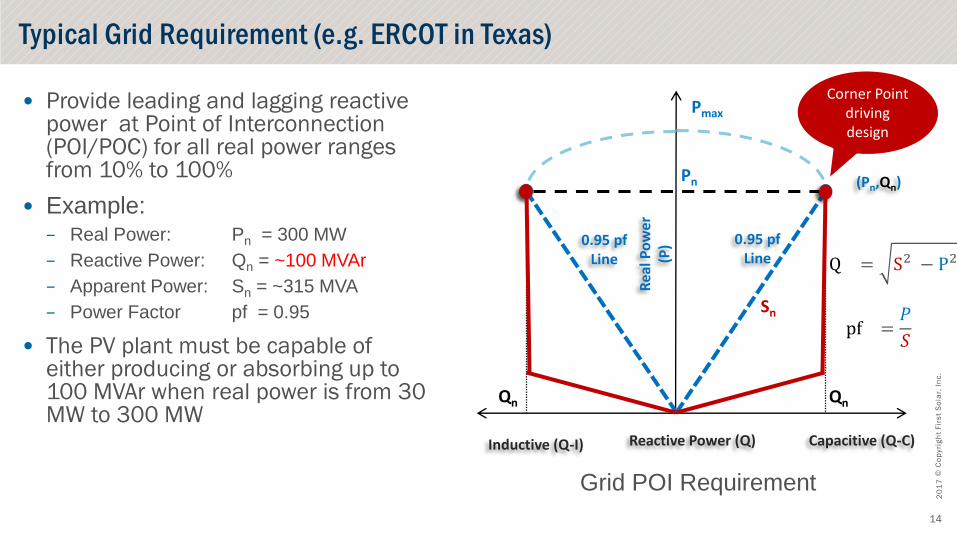
Typical Grid Requirement (e.g. ERCOT in Texas)
Reactive Power (Q)
Rea
l Po
wer
(P)
Inductive (Q-I) Capacitive (Q-C)
(Pn,Qn)
0.95 pf Line
Grid POI Requirement
• Provide leading and lagging reactive power at Point of Interconnection (POI/POC) for all real power ranges from 10% to 100%
• Example: − Real Power: Pn = 300 MW
− Reactive Power: Qn = ~100 MVAr
− Apparent Power: Sn = ~315 MVA
− Power Factor pf = 0.95
• The PV plant must be capable of either producing or absorbing up to 100 MVAr when real power is from 30 MW to 300 MW
0.95 pf Line
Pn
QnQn
Sn
Pmax
Q = S2 − P2
pf =𝑃
𝑆
Corner Point driving design
© C
op
yri
gh
t F
irs
t S
ola
r, I
nc
. 9
Oc
tob
er
20
17
15
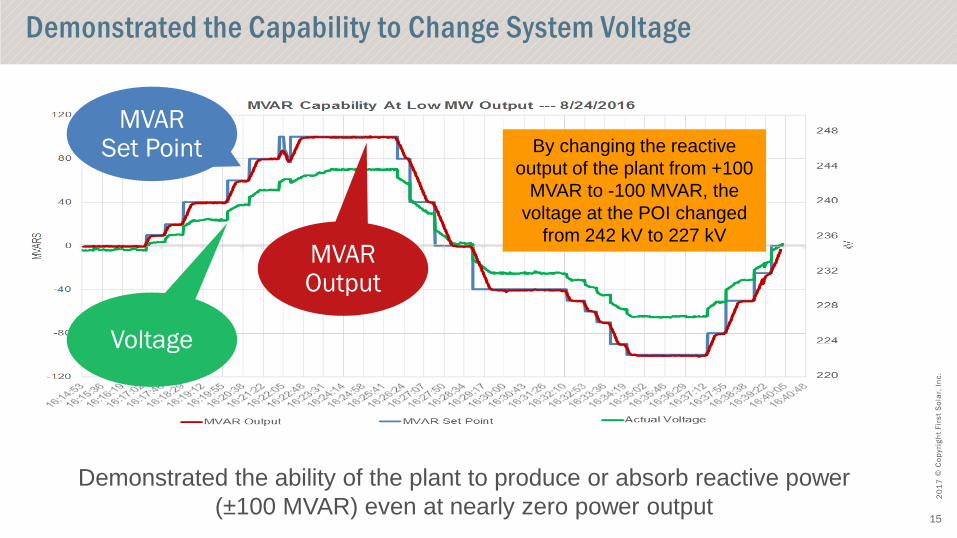
Demonstrated the Capability to Change System Voltage
By changing the reactive
output of the plant from +100
MVAR to -100 MVAR, the
voltage at the POI changed
from 242 kV to 227 kV
Voltage
MVAR Output
MVAR Set Point
Demonstrated the ability of the plant to produce or absorb reactive power
(±100 MVAR) even at nearly zero power output
© C
op
yri
gh
t F
irs
t S
ola
r, I
nc
. 9
Oc
tob
er
20
17
16
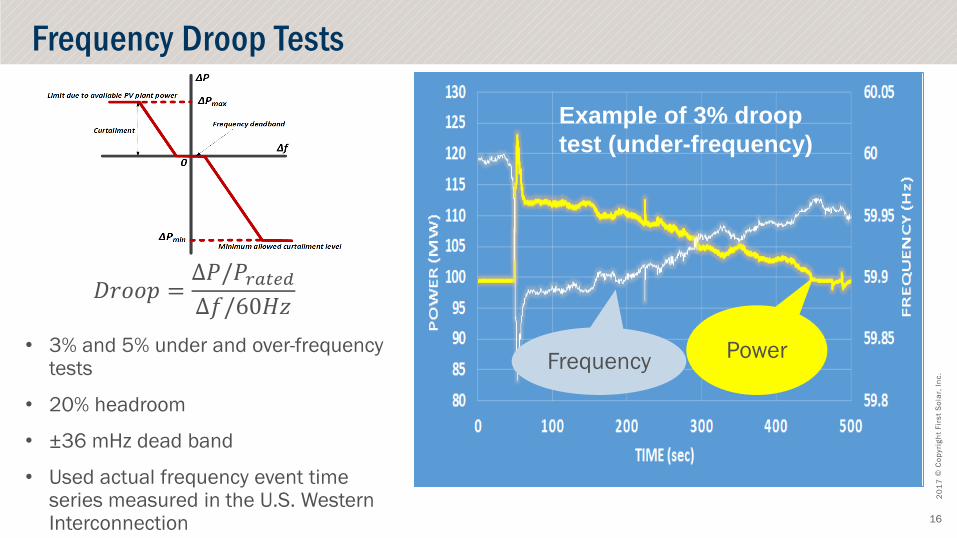
• 3% and 5% under and over-frequency tests
• 20% headroom
• ±36 mHz dead band
• Used actual frequency event time series measured in the U.S. Western Interconnection
Frequency Droop Tests
𝐷𝑟𝑜𝑜𝑝 =∆𝑃/𝑃𝑟𝑎𝑡𝑒𝑑∆𝑓/60𝐻𝑧
Example of 3% droop
test (under-frequency)
PowerFrequency

© C
op
yri
gh
t F
irs
t S
ola
r, I
nc
. 9
Oc
tob
er
20
17
17
Examples of Over-Frequency Droop Tests
Example of 5% droop test (over-frequency)
Measured droop
response – 5%
Measured droop
response – 3%
PowerFrequency
Measured droop
response – 5%
Measured droop
response – 3%
© C
op
yri
gh
t F
irs
t S
ola
r, I
nc
. 9
Oc
tob
er
20
17
18
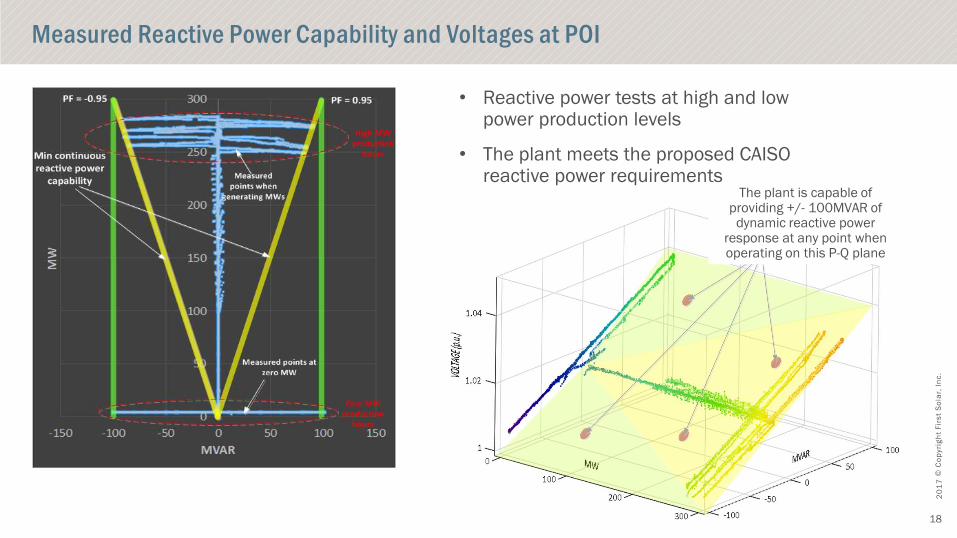
• Reactive power tests at high and low power production levels
• The plant meets the proposed CAISO reactive power requirements
Measured Reactive Power Capability and Voltages at POI
The plant is capable of providing +/- 100MVAR of dynamic reactive power
response at any point when operating on this P-Q plane

© C
op
yri
gh
t F
irs
t S
ola
r, I
nc
. 9
Oc
tob
er
20
17
19
Active Power Curtailment Test
Active Power
Active Power
Set Point
© C
op
yri
gh
t F
irs
t S
ola
r, I
nc
. 9
Oc
tob
er
20
17
20
170
180
190
200
210
220
230
0 200 400 600 800 1000 1200 1400
RELATIVE TIME (sec)
Available MW Min allowed MW Commanded MW Measured MW
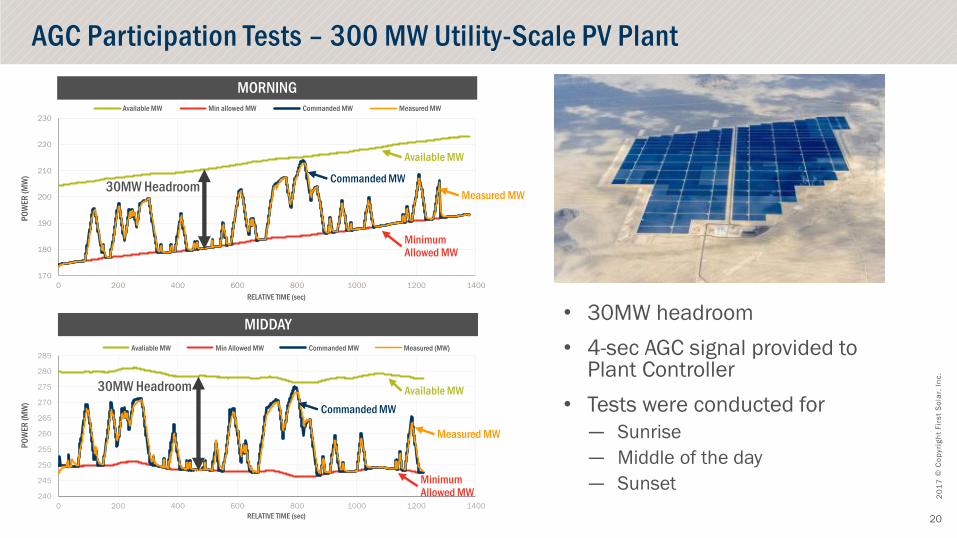
• 30MW headroom
• 4-sec AGC signal provided to Plant Controller
• Tests were conducted for
— Sunrise
— Middle of the day
— Sunset240
245
250
255
260
265
270
275
280
285
0 200 400 600 800 1000 1200 1400
RELATIVE TIME (sec)
Avaliable MW Min Allowed MW Commanded MW Measured (MW)
AGC Participation Tests – 300 MW Utility-Scale PV PlantP
OW
ER
(M
W)
PO
WE
R (
MW
)
MORNING
MIDDAY
30MW Headroom
30MW Headroom
Available MW
Available MW
MinimumAllowed MW
MinimumAllowed MW
Measured MW
Measured MW
Commanded MW
Commanded MW
© C
op
yri
gh
t F
irs
t S
ola
r, I
nc
. 9
Oc
tob
er
20
17
21
SteamTurbine
PumpTurbine
Hydro CombinedCycle
LimitedEnergyStorage
GasTurbine
0%
10%
20%
30%
40%
50%
60%
70%
80%
90%
100%
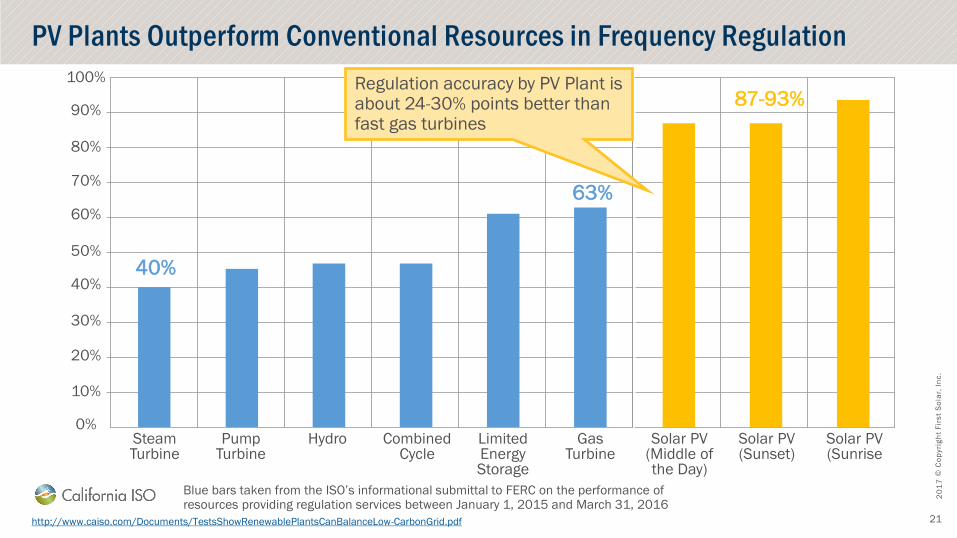
PV Plants Outperform Conventional Resources in Frequency Regulation
http://www.caiso.com/Documents/TestsShowRenewablePlantsCanBalanceLow-CarbonGrid.pdf
Blue bars taken from the ISO’s informational submittal to FERC on the performance ofresources providing regulation services between January 1, 2015 and March 31, 2016
Solar PV(Middle ofthe Day)
Solar PV(Sunset)
Solar PV(Sunrise
Regulation accuracy by PV Plant is about 24-30% points better than fast gas turbines
40%
63%
87-93%

© C
op
yri
gh
t F
irs
t S
ola
r, I
nc
. 9
Oc
tob
er
20
17
22
—Regulation-up and regulation-down, or AGC tests during
sunrise, middle of the day, and sunset
—Frequency response tests with 3% and 5% droop settings
for over- frequency and under- frequency conditions
—Curtailment and APC tests to verify plant performance to
decrease or increase its output while maintaining specific
ramp rates
—Voltage and reactive power control tests
—Voltage control at near zero active power levels (nighttime
control)
Summary of Conducted Tests
© C
op
yri
gh
t F
irs
t S
ola
r, I
nc
. 9
Oc
tob
er
20
17
23
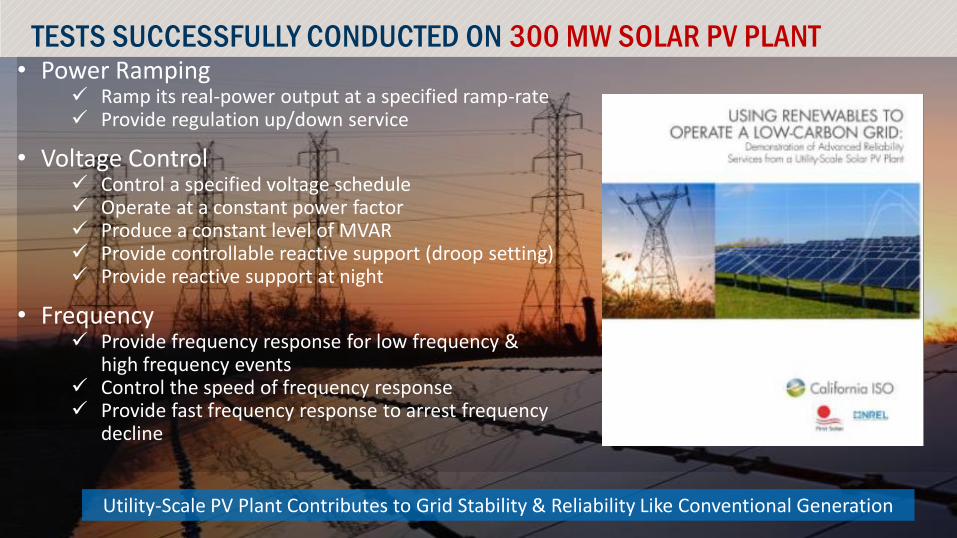
TESTS SUCCESSFULLY CONDUCTED ON 300 MW SOLAR PV PLANT• Power Ramping
Ramp its real-power output at a specified ramp-rate Provide regulation up/down service
• Voltage Control Control a specified voltage schedule Operate at a constant power factor Produce a constant level of MVAR Provide controllable reactive support (droop setting) Provide reactive support at night
• Frequency Provide frequency response for low frequency &
high frequency events Control the speed of frequency response Provide fast frequency response to arrest frequency
decline
Utility-Scale PV Plant Contributes to Grid Stability & Reliability Like Conventional Generation
© C
op
yri
gh
t F
irs
t S
ola
r, I
nc
. 9
Oc
tob
er
20
17
24
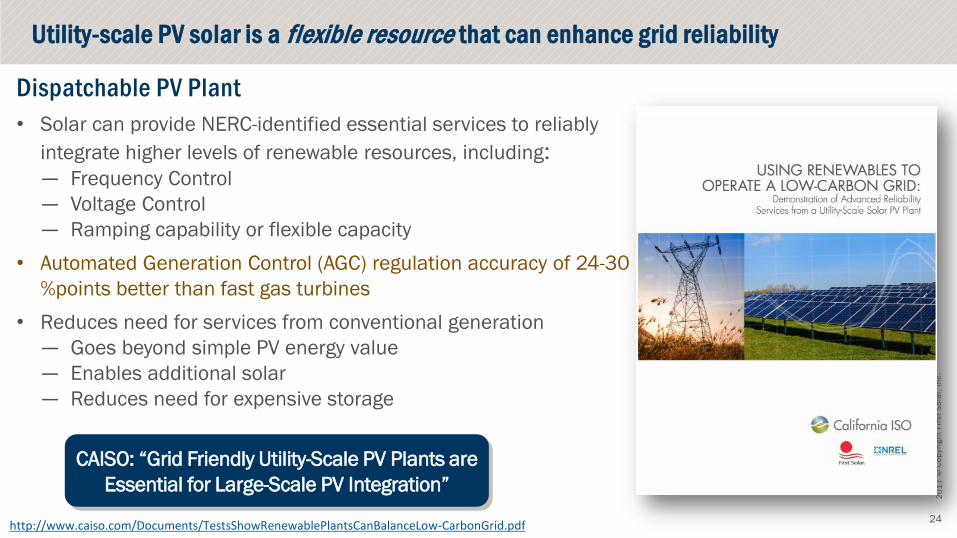
Utility-scale PV solar is a flexible resource that can enhance grid reliability
Dispatchable PV Plant
• Solar can provide NERC-identified essential services to reliably
integrate higher levels of renewable resources, including: — Frequency Control
— Voltage Control
— Ramping capability or flexible capacity
• Automated Generation Control (AGC) regulation accuracy of 24-30
%points better than fast gas turbines
• Reduces need for services from conventional generation
— Goes beyond simple PV energy value
— Enables additional solar
— Reduces need for expensive storage
CAISO: “Grid Friendly Utility-Scale PV Plants are
Essential for Large-Scale PV Integration”
http://www.caiso.com/Documents/TestsShowRenewablePlantsCanBalanceLow-CarbonGrid.pdf