essentials of meteorology an invitation to the atmosphere
TRANSCRIPT

176
© D
avid
McN
ew
/Gett
y Im
ag
es N
ew
s
A small circulation of swirling air — a dust devil — lifts small particles high above the dry surface.
ContentsScales of Atmospheric Motion
Eddies—Big and Small
Local Wind Systems
Global Winds
Global Wind Patterns and the Oceans
Summary
Key Terms
Questions for Review
Questions for Thought and Exploration
49331_07_ch7_p176-211.indd 17649331_07_ch7_p176-211.indd 176 15/11/10 11:27 AM15/11/10 11:27 AM
Copyright 2010 Cengage Learning. All Rights Reserved. May not be copied, scanned, or duplicated, in whole or in part. Due to electronic rights, some third party content may be suppressed from the eBook and/or eChapter(s). Editorial review has deemed that any suppressed content does not materially affect the overall learning experience. Cengage Learning reserves the right to remove additional content at any time if subsequent rights restrictions require it.

Atmospheric Circulations
49331_07_ch7_p176-211.indd 17749331_07_ch7_p176-211.indd 177 15/11/10 11:28 AM15/11/10 11:28 AM
Copyright 2010 Cengage Learning. All Rights Reserved. May not be copied, scanned, or duplicated, in whole or in part. Due to electronic rights, some third party content may be suppressed from the eBook and/or eChapter(s). Editorial review has deemed that any suppressed content does not materially affect the overall learning experience. Cengage Learning reserves the right to remove additional content at any time if subsequent rights restrictions require it.

178 Chapter 7 Atmospheric Circulations
The aircraft in our opener encountered a turbulent eddy—an “air pocket”—in perfectly clear weather. Such eddies are not uncommon, especially in the
vicinity of jet streams. In this chapter, we will examine a variety of eddy circulations. First, we will look at the formation of small-scale winds. Th en, we will examine slightly larger circulations—local wind—such as the sea breeze and the chinook, describing how they form and the type of weather they generally bring. Finally, we will look at the general wind-fl ow pattern around the world.
Scales of Atmospheric MotionTh e air in motion—what we commonly call wind—is invisible, yet we see evidence of it nearly everywhere we look. It sculptures rocks, moves leaves, blows smoke, and lift s water vapor upward to where it can condense into clouds. Th e wind is with us wherever we go. On a
hot day, it can cool us off ; on a cold day, it can make us shiver. A breeze can sharpen our appetite when it blows the aroma from the local bakery in our direction. Th e wind is a powerful element. Th e workhorse of weather, it moves storms and large fair-weather systems around the globe. It transports heat, moisture, dust, insects, bacteria, and pollens from one area to another.
Circulations of all sizes exist within the atmosphere. Little whirls form inside bigger whirls, which encom-pass even larger whirls—one huge mass of turbulent, twisting eddies.* For clarity, meteorologists arrange cir-culations according to their size. Th is hierarchy of mo-tion from tiny gusts to giant storms is called the scales of motion.
Consider smoke rising into the otherwise clean air from a chimney in the industrial section of a large city (see ◗ Fig. 7.1a). Within the smoke, small chaotic motions—tiny eddies—cause it to tumble and turn. Th ese eddies constitute the smallest scale of motion—the microscale. At the microscale, eddies with diam-eters of a few meters or less not only disperse smoke, they also sway branches and swirl dust and papers into the air. Th ey form by convection or by the wind blow-ing past obstructions and are usually short-lived, lasting only a few minutes at best.
In Fig. 7.1b, observe that, as the smoke rises, it drift s many kilometers downwind. Th is circulation of city air constitutes the next larger scale—the mesoscale (mean-ing middle scale). Typical mesoscale winds range from a few kilometers to about a hundred kilometers in di-ameter. Generally, they last longer than microscale mo-tions, oft en many minutes, hours, or in some cases as long as a day. Mesoscale circulations include local winds (which form along shorelines and mountains), as well as thunderstorms, tornadoes, and small tropical storms.
When we look for the smokestack on a surface weather map (Fig. 7.1c), neither the smokestack nor the circulation of city air shows up. All that we see are the circulations around high- and low-pressure areas—the cyclones and anticyclones of the middle latitude. We are now looking at the macroscale, or weather map scale, which is also called the synoptic scale. Circulations of this magnitude dominate regions of hundreds to even thousands of square kilometers and, although the life spans of these features vary, they typically last for days and sometimes weeks. When we look at wind patterns over the entire earth, we are looking at the planetary or global scale. ◗ Figure.7.2 summarizes the various scales of motion and their average life span.
On December 30, 1997, a United Airlines’ Boeing
747 carrying 374 passengers was en route to Hawaii
from Japan. Dinner had just been served, and the
aircraft had reached a cruising altitude of 33,000
feet. Suddenly, east of Tokyo and over the Pacifi c
Ocean, this routine, uneventful fl ight turned tragic.
Without warning, the aircraft entered a region of
severe air turbulence, and a vibration ran through
the aircraft. The plane nosed upward, then plunged
toward the earth for about 1000 feet before stabiliz-
ing. Screaming, terrifi ed passengers not fastened
to their seats were fl ung against the walls of the
aircraft, then dropped. Bags, serving trays, and
luggage that slipped out from under the seats were
fl ying about inside the plane. Within seconds, the
entire ordeal was over. At least 110 people were
injured, 12 seriously. Tragically, there was one
fatality—a 32-year-old woman, who had been hurled
against the ceiling of the plane, died of severe head
injuries. What sort of atmospheric phenomenon
could cause such turbulence?
*Eddies are spinning globs of air that have a life history of their own.
49331_07_ch7_p176-211.indd 17849331_07_ch7_p176-211.indd 178 15/11/10 11:28 AM15/11/10 11:28 AM
Copyright 2010 Cengage Learning. All Rights Reserved. May not be copied, scanned, or duplicated, in whole or in part. Due to electronic rights, some third party content may be suppressed from the eBook and/or eChapter(s). Editorial review has deemed that any suppressed content does not materially affect the overall learning experience. Cengage Learning reserves the right to remove additional content at any time if subsequent rights restrictions require it.

Scales of Atmospheric Motion 179
◗ FIGURE 7.1 Scales of atmospheric motion. The tiny microscale motions constitute a part of the larger mesoscale motions, which, in turn, are part of the much larger macroscale. Notice that as the scale becomes larger, motions observed at the smaller scale are no longer visible.
◗ FIGURE 7.2 The scales of atmospheric motion with the phenomenon’s average size and life span. (Because the actual size of certain features may vary, some of the features fall into more than one category.)
49331_07_ch7_p176-211.indd 17949331_07_ch7_p176-211.indd 179 15/11/10 11:28 AM15/11/10 11:28 AM
Copyright 2010 Cengage Learning. All Rights Reserved. May not be copied, scanned, or duplicated, in whole or in part. Due to electronic rights, some third party content may be suppressed from the eBook and/or eChapter(s). Editorial review has deemed that any suppressed content does not materially affect the overall learning experience. Cengage Learning reserves the right to remove additional content at any time if subsequent rights restrictions require it.

180 Chapter 7 Atmospheric Circulations
Eddies—Big and SmallWhen the wind encounters a solid object, a whirl of air—or eddy—forms on the object’s downwind side.* Th e size and shape of the eddy oft en depend upon the size and shape of the obstacle and on the speed of the wind. Light winds produce small stationary eddies. Wind moving past trees, shrubs, and even your body produces small eddies. (You may have had the experience of dropping a piece of paper on a windy day only to have it carried away by a swirling eddy as you bend down to pick it up.) Air fl owing over a building produces larger eddies that will, at best, be about the size of the building. Strong winds blowing past an open sports stadium can produce eddies that may rotate in such a way as to create surface winds on the playing fi eld that move in a direction op-posite to the wind fl ow above the stadium. Wind blow-ing over a fairly smooth surface produces few eddies, but when the surface is rough, many eddies form.
Th e eddies that form downwind from obstacles can produce a variety of interesting eff ects. For instance, wind moving over a mountain range in stable air with a speed greater than 40 knots usually produces waves and eddies, such as those shown in ◗ Fig. 7.3. We can see that eddies form both close to the mountain and be-neath each wave crest. Th ese so-called rotors have vio-lent vertical motions that produce extreme turbulence and hazardous fl ying conditions. Strong winds blowing
over a mountain in stable air may produce a mountain wave eddy on the downwind side, with a reverse fl ow near the ground. On a much smaller scale, the howling of wind on a blustery night is believed to be caused by eddies that are constantly being shed around obstruc-tions, such as chimneys and roof corners.
Turbulent eddies form aloft as well as near the sur-face. Turbulence aloft can occur suddenly and unex-pectedly, especially where the wind changes its speed or direction (or both) abruptly. Such a change is called wind shear. Th e shearing creates forces that produce eddies along a mixing zone. If the eddies form in clear air, this form of turbulence is called clear air turbu-lence, or CAT. When fl ying in an airplane through such turbulence, the bumpiness may range from small vibra-tions to violent up and down motions that force passen-gers against their seats and toss objects throughout the cabin. (Additional information on this topic is given in the Focus section on p. 181.)
Local Wind SystemsEvery summer, millions of people fl ock to the New Jer-sey shore, hoping to escape the oppressive heat and hu-midity of the inland region. On hot, humid aft ernoons, these travelers oft en encounter thunderstorms about twenty miles or so from the ocean, thunderstorms that invariably last for only a few minutes. In fact, by the time the vacationers arrive at the beach, skies are gener-ally clear and air temperatures are much lower, as cool ocean breezes greet them. If the travelers return home in the aft ernoon, these “mysterious” showers oft en oc-cur at just about the same location as before.
Th e showers are not really mysterious. Actually, they are caused by a local wind system—the sea breeze. As cooler ocean air pours inland, it forces the warmer, un-stable humid air to rise and condense, producing majes-tic clouds and rain showers along a line where the air of contrasting temperatures meets.
Th e sea breeze forms as part of a thermally driven circulation. Consequently, we will begin our study of local winds by examining the formation of thermal circulations.
THERMAL CIRCULATIONS Consider the vertical distribution of pressure shown in ◗ Fig. 7.4a. Th e iso-bars* all lie parallel to the earth’s surface; thus, there is no horizontal variation in pressure (or temperature),
DID YOU KNOW?On a blustery night, the howling of the wind can be caused by eddies. As the wind blows past chimneys and roof corners, small eddies form. These tiny swirls act like pulses of com-pressed air that ultimately reach your eardrum and produce the sound of howling winds.
◗ FIGURE 7.3 Under stable conditions, air fl owing past a mountain range can create eddies many kilometers down-wind from the mountain itself.
*Th e irregular, disturbed fl ow of gusty winds and eddies is called turbulence.
*Th e isobars depicted here actually represent a surface of constant pressure (an isobaric surface), rather than a line, or isobar. Information on isobaric surfaces is given in the Focus section in Chapter 6 on p. 157.
49331_07_ch7_p176-211.indd 18049331_07_ch7_p176-211.indd 180 15/11/10 11:28 AM15/11/10 11:28 AM
Copyright 2010 Cengage Learning. All Rights Reserved. May not be copied, scanned, or duplicated, in whole or in part. Due to electronic rights, some third party content may be suppressed from the eBook and/or eChapter(s). Editorial review has deemed that any suppressed content does not materially affect the overall learning experience. Cengage Learning reserves the right to remove additional content at any time if subsequent rights restrictions require it.

Local Wind Systems 181
FOCUS ON AN OBSERVATION
Eddies and “Air Pockets”To better understand how eddies form along a zone of wind shear, imagine that, high in the atmosphere, there is a stable layer of air having vertical wind speed shear (changing wind speed with height) as depicted in Fig. 1a. The top half of the layer slowly slides over the bottom half, and the relative speed of both halves is low. As long as the wind shear between the top and bottom of the layer is small, few if any eddies form. However, if the shear and the corresponding relative speed of these layers increases (Figs. 1b and 1c), wavelike undulations may form. When the shearing exceeds a certain value, the waves break into large swirls, with signifi cant vertical movement (Fig. 1d). Eddies such as these often form in the upper troposphere near jet streams, where large wind speed shears exist. If wavelike clouds form in the region of
wind shear, they are often called billow clouds (see Fig. 2). Turbulent eddies also occur in conjunction with mountain waves, which may extend upward into the stratosphere. As we learned earlier, when these huge eddies develop in clear air, this form of turbulence is re-ferred to as clear air turbulence, or CAT.
The eddies that form in clear air may have diameters ranging from a couple of meters to several hundred meters. An unsuspecting aircraft entering such a region may be in for more than just a bumpy ride. If the aircraft fl ies into a zone of descending air, it may drop suddenly, producing the sensation that there is no air to support the wings. Consequently, these regions have come to be known as air pockets.
Commercial aircraft entering an air pocket have dropped hundreds of me-ters, injuring passengers and fl ight at-
tendants not strapped into their seats. For example, a DC-10 jetliner fl ying at 11,300 m (37,000 ft) over central Illinois during April, 1981, encountered a region of severe clear air turbulence and reportedly plunged about 600 m (2000 ft) toward the earth before stabilizing. Twenty-one of the 154 people aboard were injured; one person sustained a fractured hip and another person, after hitting the ceiling, jabbed himself in the nose with a fork, then landed in the seat in front of him.* Clear air turbu-lence has occasionally caused structural damage to aircraft by breaking off vertical stabilizers and tail structures. Fortunately, the eff ects are usually not this dramatic.
*Another example of an aircraft that experienced severe turbulence as it fl ew into an air pocket is given in the opening vignette on p. 178.
FIGURE 2 Billow clouds forming in a region of rapidly changing wind speed, called wind shear.
FIGURE 1 The formation of clear air turbulence (CAT) along a boundary of increasing wind speed shear. The wind in the top layer increases in speed from (a) through (d) as it fl ows over the bottom layer.
© C
. D
on
ald
Ah
ren
s
49331_07_ch7_p176-211.indd 18149331_07_ch7_p176-211.indd 181 15/11/10 11:28 AM15/11/10 11:28 AM
Copyright 2010 Cengage Learning. All Rights Reserved. May not be copied, scanned, or duplicated, in whole or in part. Due to electronic rights, some third party content may be suppressed from the eBook and/or eChapter(s). Editorial review has deemed that any suppressed content does not materially affect the overall learning experience. Cengage Learning reserves the right to remove additional content at any time if subsequent rights restrictions require it.

182 Chapter 7 Atmospheric Circulations
and there is no pressure gradient and no wind. Suppose in Fig. 7.4b the atmosphere is cooled to the north and warmed to the south. In the cold, dense air above the surface, the isobars bunch closer together, while in the warm, less-dense air, they spread farther apart. Th is dip-ping of the isobars produces a horizontal pressure gra-dient force (PGF) aloft that causes the air to move from higher pressure toward lower pressure.
At the surface, the air pressure remains unchanged until the air aloft begins to move. As the air aloft moves from south to north, air leaves the southern area and “piles up” above the northern area. Th is redistribution of air reduces the surface air pressure to the south and raises it to the north. Consequently, a pressure gradient force is established at the earth’s surface from north to south and, hence, surface winds begin to blow from north to south.
We now have a distribution of pressure and temper-ature and a circulation of air, as shown in Fig. 7.4c. As the cool surface air fl ows southward, it warms and be-comes less dense. In the region of surface low pressure, the warm air slowly rises, expands, cools, and fl ows out the top at an elevation of about 1 km (3300 ft ) above the
surface. At this level, the air fl ows horizontally north-ward toward lower pressure, where it completes the cir-culation by slowly sinking and fl owing out the bottom of the surface high. Circulations brought on by changes in air temperature, in which warmer air rises and colder air sinks, are termed thermal circulations.
Th e regions of surface high and low atmospheric pres-sure created as the atmosphere either cools or warms are called thermal (cold core) highs and thermal (warm core) lows. In general, they are shallow systems, usually extend-ing no more than a few kilometers above the ground.
SEA AND LAND BREEZES Th e sea breeze is a type of thermal circulation. Th e uneven heating rates of land and water (described in Chapter 3) cause these meso-scale coastal winds. During the day, the land heats more quickly than the adjacent water, and the intensive heat-ing of the air above produces a shallow thermal low. Th e air over the water remains cooler than the air over the land; hence, a shallow thermal high exists above the water. Th e overall eff ect of this pressure distribution is a sea breeze that blows from the sea toward the land as illustrated in ◗ Fig. 7.5. Since the strongest gradients of temperature and pressure occur near the land-water boundary, the strongest winds typically occur right near the beach and diminish inland. Further, since the great-est contrast in temperature between land and water usu-ally occurs in the aft ernoon, sea breezes are strongest at this time. (Th e same type of breeze that develops along the shore of a large lake is called a lake breeze.)
At night, the land cools more quickly than the wa-ter, and the air above the land becomes cooler than the air over the water, producing a distribution of pres-sure, such as the one shown in Fig. 7.5b. With higher surface pressure now over the land, the wind reverses itself and becomes a land breeze—a breeze that fl ows from the land toward the water. Temperature contrasts between land and water are generally much smaller at night; hence, land breezes are usually weaker than their daytime counterpart, the sea breeze. In regions where greater nighttime temperature contrasts exist, stronger land breezes occur over the water, off the coast. Th ey are not usually noticed much on shore, but are frequently observed by ships in coastal waters.
Look at Fig. 7.5 again and observe that the rising air is over the land during the day and over the water dur-ing the night. Th erefore, along the humid east coast of the United States, daytime clouds tend to form over land and nighttime clouds over water. Th is explains why, at night, distant lightning fl ashes are sometimes seen over the ocean.
Th e leading edge of the sea breeze is called the sea breeze front. As the front moves inland, a rapid drop in
◗ FIGURE 7.4 A thermal circulation produced by the heating and cooling of the atmosphere near the ground. The H’s and L’s refer to atmospheric pressure. The lines represent surfaces of constant pressure (isobaric surfaces), where 1000 is 1000 millibars.
49331_07_ch7_p176-211.indd 18249331_07_ch7_p176-211.indd 182 15/11/10 11:28 AM15/11/10 11:28 AM
Copyright 2010 Cengage Learning. All Rights Reserved. May not be copied, scanned, or duplicated, in whole or in part. Due to electronic rights, some third party content may be suppressed from the eBook and/or eChapter(s). Editorial review has deemed that any suppressed content does not materially affect the overall learning experience. Cengage Learning reserves the right to remove additional content at any time if subsequent rights restrictions require it.

Local Wind Systems 183
temperature usually occurs just behind it. In some lo-cations, this temperature change may be 5°C (9°F) or more during the fi rst hours—a refreshing experience on a hot, sultry day. In regions where the water temperature is warm, the cooling eff ect of the sea breeze is hardly ev-ident. Since cities near the ocean usually experience the sea breeze by noon, their highest temperature usually occurs much earlier than in inland cities. Along the east coast of North America, the passage of the sea breeze front is marked by a wind shift , usually from west to east. In the cool ocean air, the relative humidity rises as the temperature drops. If the relative humidity increas-es to above 70 percent, water vapor begins to condense upon particles of sea salt or industrial smoke, producing haze. When the ocean air is highly concentrated with pollutants, the sea breeze front may meet relatively clear air and thus appear as a smoke front, or a smog front. If the ocean air becomes saturated, a mass of low clouds and fog will mark the leading edge of the marine air.
When there is a sharp contrast in air temperature across the frontal boundary, the warmer, lighter air will
converge and rise. In many regions, this makes for good sea breeze glider soaring. If this rising air is suffi ciently moist, a line of cumulus clouds will form along the sea breeze front, and, if the air is also conditionally unstable, thunderstorms may form. As previously mentioned, on a hot, humid day one can drive toward the shore, encounter heavy showers several miles from the ocean, and arrive at the beach to fi nd it sunny with a steady onshore breeze.
When cool, dense, stable marine air encounters an obstacle, such as a row of hills, the heavy air tends to fl ow around them rather than over them. When the op-posing breezes meet on the opposite side of the obstruc-tion, they form what is called a sea breeze convergence zone. Such conditions are common along the Pacifi c coast of North America.
Sea breezes in Florida help produce that state’s abun-dant summertime rainfall. On the Atlantic side of the state, the sea breeze blows in from the east; on the Gulf shore, it moves in from the west (see ◗ Fig. 7.6). Th e con-vergence of these two moist wind systems, coupled with daytime convection, produces cloudy conditions and
◗ FIGURE 7.5 Development of a sea breeze and a land breeze. (a) At the surface, a sea breeze blows from the water onto the land, whereas (b) the land breeze blows from the land out over the water. Notice that the pressure at the surface changes more rapidly with the sea breeze. This situation indi-cates a stronger pressure gradient force and higher winds with a sea breeze.
49331_07_ch7_p176-211.indd 18349331_07_ch7_p176-211.indd 183 15/11/10 11:28 AM15/11/10 11:28 AM
Copyright 2010 Cengage Learning. All Rights Reserved. May not be copied, scanned, or duplicated, in whole or in part. Due to electronic rights, some third party content may be suppressed from the eBook and/or eChapter(s). Editorial review has deemed that any suppressed content does not materially affect the overall learning experience. Cengage Learning reserves the right to remove additional content at any time if subsequent rights restrictions require it.

184 Chapter 7 Atmospheric Circulations
showery weather over the land (see ◗ Fig. 7.7). Over the water (where cooler, more stable air lies close to the sur-face), skies oft en remain cloud-free. On many days dur-ing June and July of 1998, however, Florida’s converging wind system did not materialize. Th e lack of converg-ing surface air and its accompanying showers left much of the state parched. Huge fi res broke out over north-ern and central Florida, which left hundreds of people
homeless and burned many thousands of acres of grass and woodlands. A weakened sea breeze and dry condi-tions produced wild fi res on numerous other occasions, including the spring of 2006.
Convergence of coastal breezes is not restricted to ocean areas. Both Lake Michigan and Lake Superior are capable of producing well-defi ned lake breezes. In up-per Michigan, where these large bodies of water are sep-arated by a narrow strip of land, the two breezes push inland and converge near the center of the peninsula, creating aft ernoon clouds and showers, while the lake-shore area remains sunny, pleasantly cool, and dry.
SEASONALLY CHANGING WINDS—THE MON-SOON Th e word monsoon derives from the Arabic mausim, which means seasons. A monsoon wind sys-tem is one that changes direction seasonally, blowing from one direction in summer and from the opposite direction in winter. Th is seasonal reversal of winds is especially well developed in eastern and southern Asia.
In some ways, the monsoon is similar to a large-scale sea breeze. During the winter, the air over the continent becomes much colder than the air over the ocean. A large, shallow high-pressure area develops over conti-nental Siberia, producing a clockwise circulation of air that fl ows out over the Indian Ocean and South China Sea (see ◗ Fig. 7.8a). Subsiding air of the anticyclone and the downslope movement of northeasterly winds from the inland plateau provide eastern and southern Asia
◗ FIGURE 7.6 Typically, during the summer over Florida, converging sea breezes in the afternoon produce uplift that enhances thunderstorm development and rainfall. However, when westerly surface winds dominate and a ridge of high pressure forms over the area, thunderstorm activity dimin-ishes, and dry conditions prevail.
◗ FIGURE 7.7 Surface heating and lifting of air along converging sea breezes combine to form thunderstorms almost daily dur-ing the summer in southern Florida.
© T. A
nsel T
on
ey
49331_07_ch7_p176-211.indd 18449331_07_ch7_p176-211.indd 184 15/11/10 11:28 AM15/11/10 11:28 AM
Copyright 2010 Cengage Learning. All Rights Reserved. May not be copied, scanned, or duplicated, in whole or in part. Due to electronic rights, some third party content may be suppressed from the eBook and/or eChapter(s). Editorial review has deemed that any suppressed content does not materially affect the overall learning experience. Cengage Learning reserves the right to remove additional content at any time if subsequent rights restrictions require it.

Local Wind Systems 185
with generally fair weather and the dry season. Hence, the winter monsoon means clear skies, with surface winds that blow from land to sea.
In summer, the wind-fl ow pattern reverses itself as air over the continents becomes warmer than air above the water. A shallow thermal low develops over the con-tinental interior. Th e heated air within the low rises, and the surrounding air responds by fl owing counterclock-wise into the low center. Th is condition results in mois-ture-bearing winds sweeping into the continent from the ocean. Th e humid air converges with a drier west-erly fl ow, causing it to rise; further lift ing is provided by hills and mountains. Lift ing cools the air to its saturation point, resulting in heavy showers and thunderstorms. Th us, the summer monsoon of southeastern Asia, which lasts from about June through September, means wet, rainy weather (wet season) with surface winds that blow from sea to land (see Fig. 7.8b). Although the majority of rain falls during the wet season, it does not rain all the time. In fact, rainy periods of between 15 to 40 days are oft en followed by several weeks of hot, sunny weather.
Th e strength of the Indian monsoon appears to be related to the reversal of surface air pressure that occurs at irregular intervals about every two to seven years at opposite ends of the tropical South Pacifi c Ocean. As we will see later in this chapter, this reversal of pressure (which is known as the Southern Oscillation) is linked to an ocean warming phenomenon known as El Niño. During a major El Niño event, surface water near the equator becomes much warmer over the central and eastern Pacifi c. Over the region of warm water we fi nd rising air, huge convective clouds, and heavy rain. Meanwhile, to the west of the warm water (over the re-gion infl uenced by the summer monsoon), sinking air inhibits cloud formation and convection. Hence, during El Niño years, monsoon rainfall is likely to be defi cient.
Summer monsoon rains over southern Asia can reach record amounts. Located about 200 miles inland on the southern slopes of the Khasi Hills in northeastern India, Cherrapunji receives an average of 1080 cm (425 in.) of rainfall each year, most of it during the summer monsoon between April and October (see ◗ Fig. 7.9). Th e summer monsoon rains are essential to the agriculture of that
◗ FIGURE 7.8 Changing annual surface wind-fl ow patterns associated with the winter and summer Asian monsoon.
◗ FIGURE 7.9 Average annual precipitation for Cherrapunji, India. Note the abundant rainfall during the summer mon-soon (April through October) and the lack of rainfall during the winter monsoon (November through March).
49331_07_ch7_p176-211.indd 18549331_07_ch7_p176-211.indd 185 15/11/10 11:29 AM15/11/10 11:29 AM
Copyright 2010 Cengage Learning. All Rights Reserved. May not be copied, scanned, or duplicated, in whole or in part. Due to electronic rights, some third party content may be suppressed from the eBook and/or eChapter(s). Editorial review has deemed that any suppressed content does not materially affect the overall learning experience. Cengage Learning reserves the right to remove additional content at any time if subsequent rights restrictions require it.

186 Chapter 7 Atmospheric Circulations
part of the world. With a population of over 900 million people, India depends heavily on the summer rains so that food crops will grow. Th e people also depend on the rains for drinking water. Unfortunately, the monsoon can be unreliable in both duration and intensity. Since the monsoon is vital to the survival of so many people,
it is no wonder that meteorologists have investigated it extensively. Th ey have tried to develop methods of ac-curately forecasting the intensity and duration of the monsoon. With the aid of current research projects and the latest climate models (which tie in the interaction of ocean and atmosphere), there is hope that monsoon forecasts will begin to improve in accuracy.
Monsoon wind systems exist in other regions of the world, such as in Australia, Africa, and North and South America, where large contrasts in temperature develop between oceans and continents. (Usually, however, these systems are not as pronounced as in southeast Asia.) For example, a monsoonlike circulation exists in the southwestern United States, especially in Arizona, New Mexico, Nevada, and the southern part of Califor-nia, where spring and early summer are normally dry, as warm westerly winds sweep over the region. By mid-July, however, southerly or southeasterly winds are more common, and so are aft ernoon showers and thunder-storms (see ◗ Fig. 7.10 and ◗ Fig. 7.11).
MOUNTAIN AND VALLEY BREEZES Mountain and valley breezes develop along mountain slopes. Ob-serve in ◗ Fig. 7.12 that, during the day, sunlight warms the valley walls, which in turn warm the air in contact with them. Th e heated air, being less dense than the air of the same altitude above the valley, rises as a gentle upslope wind known as a valley breeze. At night, the fl ow reverses. Th e mountain slopes cool quickly, chill-ing the air in contact with them. Th e cooler, more-dense air glides downslope into the valley, providing a moun-tain breeze. (Because gravity is the force that directs these winds downhill, they are also referred to as gravity winds, or nocturnal drainage winds.) Th is daily cycle of
◗ FIGURE 7.10 Enhanced infrared satellite image with heavy arrow showing strong monsoonal circulation. Moist, south-erly winds are causing showers and thunderstorms (yellow and red areas) to form over the southwestern section of the United States during July, 2001.
◗ FIGURE 7.11 Clouds and thun-derstorms forming over Arizona, as humid monsoonal air fl ows northward over the region during July, 2007.
© C
. D
on
ald
Ah
ren
s
NO
AA
49331_07_ch7_p176-211.indd 18649331_07_ch7_p176-211.indd 186 15/11/10 11:29 AM15/11/10 11:29 AM
Copyright 2010 Cengage Learning. All Rights Reserved. May not be copied, scanned, or duplicated, in whole or in part. Due to electronic rights, some third party content may be suppressed from the eBook and/or eChapter(s). Editorial review has deemed that any suppressed content does not materially affect the overall learning experience. Cengage Learning reserves the right to remove additional content at any time if subsequent rights restrictions require it.

Local Wind Systems 187
wind fl ow is best developed in clear, summer weather when prevailing winds are light.
When the upslope valley winds are well developed and have suffi cient moisture, they can reveal themselves as building cumulus clouds above mountain summits (see ◗ Fig. 7.13). Since valley breezes usually reach their maximum strength in the early aft ernoon, cloudiness, showers, and even thunderstorms are common over mountains during the warmest part of the day—a fact well known to climbers, hikers, and seasoned mountain picnickers.
KATABATIC WINDS Although any downslope wind is technically a katabatic wind, the name is usually reserved for downslope winds that are much stronger than mountain breezes. Katabatic (or fall) winds can rush down elevated slopes at hurricane speeds, but most are not that intense and many are on the order of 10 knots or less.
Th e ideal setting for a katabatic wind is an elevat-ed plateau surrounded by mountains, with an open-ing that slopes rapidly downhill (see ◗ Fig. 7.14). When winter snows accumulate on the plateau, the overlying
◗ FIGURE 7.12 Valley breezes blow uphill during the day; mountain breezes blow downhill at night. (The L’s and H’s represent pressure, whereas the purple lines represent surfaces of constant pressure.)
◗ FIGURE 7.13 As mountain slopes warm during the day, air rises and often condenses into cumuliform clouds, such as these.
© C
. D
on
ald
Ah
ren
s
49331_07_ch7_p176-211.indd 18749331_07_ch7_p176-211.indd 187 15/11/10 11:29 AM15/11/10 11:29 AM
Copyright 2010 Cengage Learning. All Rights Reserved. May not be copied, scanned, or duplicated, in whole or in part. Due to electronic rights, some third party content may be suppressed from the eBook and/or eChapter(s). Editorial review has deemed that any suppressed content does not materially affect the overall learning experience. Cengage Learning reserves the right to remove additional content at any time if subsequent rights restrictions require it.

188 Chapter 7 Atmospheric Circulations
air grows extremely cold. Along the edge of the plateau the cold, dense air begins to descend through gaps and saddles in the hills, usually as a gentle or moderate cold breeze. If the breeze, however, is confi ned to a narrow canyon or channel, the fl ow of air can increase, oft en destructively, as cold air rushes downslope like water fl owing over a fall.
Katabatic winds are observed in various regions of the world. For example, along the northern Adriatic coast in the former Yugoslavia, a polar invasion of cold air from Russia descends the slopes from a high plateau and reaches the lowlands as the bora—a cold, gusty, northeasterly wind with speeds sometimes in excess of 100 knots. A similar, but oft en less violent, cold wind known as the mistral descends the western mountains into the Rhone Valley of France, and then out over the Mediterranean Sea. It frequently causes frost damage to exposed vineyards and makes people bundle up in the otherwise mild climate along the Riviera. Strong, cold katabatic winds also blow downslope off the icecaps in Greenland and Antarctica, occasionally with speeds greater than 100 knots.
In North America, when cold air accumulates over the Columbia plateau,* it may fl ow westward through the Columbia River Gorge as a strong, gusty, and some-times violent wind. Even though the sinking air warms by compression, it is so cold to begin with that it reaches the ocean side of the Cascade Mountains much colder than the marine air it replaces. Th e Columbia Gorge wind (called the coho) is oft en the harbinger of a pro-longed cold spell.
Strong downslope katabatic-type winds funneled through a mountain canyon can do extensive damage. During January, 1984, a ferocious down slope wind blew through Yosemite National Park in California at speeds estimated at 100 knots. Th e wind toppled trees and, un-fortunately, caused a fatality when a tree fell on a park employee sleeping in a tent.
CHINOOK (FOEHN) WINDS Th e chinook wind is a warm, dry wind that descends the eastern slope of the Rocky Mountains. Th e region of the chinook is rather nar-row and extends from northeastern New Mexico north-ward into Canada. Similar winds occur along the leeward slopes of mountains in other regions of the world. In the European Alps, for example, such a wind is called a foehn. When these winds move through an area, the tempera-ture rises sharply, sometimes 20°C (36°F) or more in one hour, and a corresponding sharp drop in the relative hu-midity occurs, occasionally to less than 5 percent. (More information on temperature changes associated with chi-nooks is given in the Focus section on p. 189.)
Chinooks occur when strong westerly winds aloft fl ow over a north-south–trending mountain range, such as the Rockies and Cascades. Such conditions can pro-duce a trough of low pressure on the mountain’s eastern side, a trough that tends to force the air downslope. As the air descends, it is compressed and warms. So the main source of warmth for a chinook is compressional heating, as potentially warmer (and drier) air is brought down from aloft .
When clouds and precipitation occur on the moun-tain’s windward side, they can enhance the chinook. For example, as the cloud forms on the upwind side of the mountain in ◗ Fig. 7.15, the release of latent heat inside the cloud supplements the compressional heating on the downwind side. Th is phenomenon makes the descend-
◗ FIGURE 7.14 Strong katabatic winds can form where cold winds rush downhill from an elevated plateau covered with snow.
*Information on geographic features and their location in North America is provided at the back of the book.
Active ◗ FIGURE 7.15 A chinook wind can be enhanced when clouds form on the mountain’s windward side. Heat added and moisture lost on the upwind side produce warmer and drier air on the downwind side.
49331_07_ch7_p176-211.indd 18849331_07_ch7_p176-211.indd 188 15/11/10 11:29 AM15/11/10 11:29 AM
Copyright 2010 Cengage Learning. All Rights Reserved. May not be copied, scanned, or duplicated, in whole or in part. Due to electronic rights, some third party content may be suppressed from the eBook and/or eChapter(s). Editorial review has deemed that any suppressed content does not materially affect the overall learning experience. Cengage Learning reserves the right to remove additional content at any time if subsequent rights restrictions require it.

Local Wind Systems 189
ing air at the base of the mountain on the downwind side warmer than it was before it started its upward journey on the windward side. Th e air is also drier, since much of its moisture was removed as precipitation on the windward side.
Along the front range of the Rockies, a bank of clouds forming over the mountains is a telltale sign of an im-
pending chinook. Th is chinook wall cloud (which looks like a wall of clouds) usually remains stationary as air rises, condenses, and then rapidly descends the leeward slopes, oft en causing strong winds in foothill communi-ties. In fact, these strong winds are especially notorious in winter in Boulder, Colorado, where the average year-ly windstorm damage is about $1 million. ◗ Figure 7.16 shows how a chinook wall cloud appears as one looks west toward the Rockies from the Colorado plains. Th e photograph was taken on a winter aft ernoon with the air temperature about –7°C (20°F). Th at evening, the chi-
View this concept in action at the CourseMate website at www.cengage.com/login
FOCUS ON A SPECIAL TOPIC
Snow Eaters and Rapid Temperature ChangesChinooks are thirsty winds. As they move over a heavy snow cover, they can melt and evaporate a foot of snow in less than a day. This situation has led to some tall tales about these so-called "snow eaters." Canadian folklore has it that a sled-driving traveler once tried to outrun a chinook. During the entire ordeal his front runners were in snow while his back runners were on bare soil.
Actually, the chinook is important economically. It not only brings relief from the winter cold, but it uncovers prairie grass, so that livestock can graze on the open range. Also, these warm winds have kept railroad tracks clear of snow, so that trains can keep running. On the other hand, the drying eff ect of a chinook can create an extreme fi re hazard. And when a chinook follows spring planting, the seeds may die in the parched soil. Along with the dry air comes a buildup of static electricity, making a simple handshake a shock-ing experience. These warm, dry winds have sometimes adversely aff ected human behavior. During periods of chi-nook winds some people feel irritable and depressed and others become ill. The exact reason for this phenomenon is not clearly understood.
Chinook winds have been associated with rapid temperature changes. In fact, on January 11, 1980, due to a chinook wind, the air temperature in Great Falls, Montana, rose from –32°F to 17°F (a 49°F rise in temperature) in just seven minutes. How such rapid changes in temperature can occur is illustrated in Fig. 3. Notice that a shallow layer of extremely cold air has moved out of Canada and is now resting against the Rocky Mountains.
The cold air behaves just as any fl uid, and, in some cases, atmospheric condi-tions may cause the air to move up and down much like water does when a bowl is rocked back and forth. This rocking motion can cause extreme tem-
perature variations for cities located at the base of the hills along the periphery of the cold air– warm air boundary, as they are alternately in and then out of the cold air.
Such a situation is held to be respon-sible for the extremely rapid two-minute temperature change of 49°F recorded at Spearfi sh, South Dakota, during the morning of January 22, 1943. On the same morning, in nearby Rapid City, the temperature fl uctuated from –4°F at 5:30 a.m. to 54°F at 9:40 a.m., then down to 11°F at 10:30 a.m. and up to 55°F just 15 minutes later. At nearby cities, the undulating cold air produced similar temperature variations that lasted for several hours.
FIGURE 3 Cities near the warm air–cold air boundary can experience sharp temperature changes if cold air should rock up and down like water in a bowl.
49331_07_ch7_p176-211.indd 18949331_07_ch7_p176-211.indd 189 15/11/10 11:29 AM15/11/10 11:29 AM
Copyright 2010 Cengage Learning. All Rights Reserved. May not be copied, scanned, or duplicated, in whole or in part. Due to electronic rights, some third party content may be suppressed from the eBook and/or eChapter(s). Editorial review has deemed that any suppressed content does not materially affect the overall learning experience. Cengage Learning reserves the right to remove additional content at any time if subsequent rights restrictions require it.

190 Chapter 7 Atmospheric Circulations
nook moved downslope at high speeds through foothill valleys, picking up sand and pebbles (which dented cars and cracked windshields). Th e chinook spread out over the plains like a warm blanket, raising the air temperature the following day to a mild 15°C (59°F). Th e chinook and its wall of clouds remained for several days, bringing with it a welcomed break from the cold grasp of winter.
SANTA ANA WINDS A warm, dry wind that blows from the east or northeast into southern California is the Santa Ana wind. As the air descends from the elevated desert plateau, it funnels through mountain canyons in the San Gabriel and San Bernardino Mountains, fi nally spreading over the Los Angeles Basin and San Fernando Valley and out over the Pacifi c Ocean (see ◗ Fig. 7.17). Th e wind oft en blows with exceptional speed—occasionally over 90 knots—in the Santa Ana Canyon (the canyon from which it derives its name).
Th ese warm, dry winds develop as a region of high pressure builds over the Great Basin. Th e clockwise cir-culation around the anticyclone forces air downslope from the high plateau. Th us, compressional heating pro-vides the primary source of warming. Th e air is dry, since it originated in the desert, and it dries out even more as it is heated. ◗ Figure 7.18 shows a typical winter-time Santa Ana situation.
As the wind rushes through canyon passes, it lift s dust and sand and dries out vegetation, which sets the stage for serious brush fi res, especially in autumn, when chaparral-covered hills are already parched from the dry summer.* One such fi re in November of 1961—the infamous Bel Air fi re—burned for three days, de-stroying 484 homes and causing over $25 million in
◗ FIGURE 7.17 Warm, dry Santa Ana winds sweep downhill through mountain canyons into Southern California. The large H represents higher air pressure over the elevated desert.
*Chaparral denotes a shrubby environment, in which many of the plant spe-cies contain highly fl ammable oils.
◗ FIGURE 7.16 A chinook wall cloud forming over the Colorado Rockies (viewed from the plains).
© C
. D
on
ald
Ah
ren
s
49331_07_ch7_p176-211.indd 19049331_07_ch7_p176-211.indd 190 15/11/10 11:29 AM15/11/10 11:29 AM
Copyright 2010 Cengage Learning. All Rights Reserved. May not be copied, scanned, or duplicated, in whole or in part. Due to electronic rights, some third party content may be suppressed from the eBook and/or eChapter(s). Editorial review has deemed that any suppressed content does not materially affect the overall learning experience. Cengage Learning reserves the right to remove additional content at any time if subsequent rights restrictions require it.

Local Wind Systems 191
damage. During October, 2003, massive wildfi res driv-en by strong Santa Ana winds swept through Southern California. Th e fi res charred more than 740,000 acres, destroyed over 2800 homes, took 20 lives, and caused over $1 billion in property damage. Only four years later (and aft er one of the driest years on record) in October, 2007, wildfi res broke out again in Southern California. Pushed on by hellacious Santa Ana winds that gusted to over 80 knots, the fi res raced through dry vegetation, scorching everything in their paths. Th e fi res, which extended from north of Los Angeles to the Mexican border (see ◗ Fig. 7.19), burned over 500,000 acres, de-stroyed more than 1800 homes, and took 8 lives. Th e total costs of the fi res exceeded $1.5 billion.
Four hundred miles to the north in Oakland, Cali-fornia, a ferocious Santa Ana–type wind was responsi-ble for the disastrous Oakland hills fi re during October, 1991, that damaged or destroyed over 3000 dwellings, caused almost $5 billion in damage, and took 25 lives. With the protective vegetation cover removed, the land is ripe for erosion, as winter rains may wash away top-soil and, in some areas, create serious mudslides. Th e adverse eff ects of a wind-driven Santa Ana fi re may be felt long aft er the fi re itself has been put out.
DESERT WINDS Winds of all sizes develop over the desert. Huge duststorms form in dry regions, where strong winds are able to lift and fi ll the air with particles of fi ne dust. An exceptionally large duststorm (about the size of Spain) during February, 2001, formed over the African Sahara, then swept westward off the Afri-can coast, then northeastward for thousands of miles. During the drought years of the 1930s, large duststorms formed over the Great Plains of the United States. Some individual storms lasted for three days and spread dust for hundreds of miles over the Atlantic Ocean. In desert areas where loose sand is more prevalent, sandstorms develop, as high winds enhanced by surface heating rap-idly carry sand particles close to the ground.
A spectacular example of a storm composed of dust or sand is the haboob (from Arabic hebbe: blown). Th e haboob forms as cold downdraft s along the leading edge of a thunderstorm lift dust or sand into a huge, tum-bling dark cloud that may extend horizontally for over a hundred kilometers and rise vertically to the base of the
thunderstorm (see ◗ Fig. 7.20). Haboobs are most com-mon in the African Sudan (where about twenty-four oc-cur each year) and in the desert southwest of the United States, especially in southern Arizona.
On a smaller scale, in dry areas, the wind may also produce rising, spinning columns of air that pick up dust
DID YOU KNOW?The huge wildfi res during October, 2007, caused the largest evacuation in California history, forcing more than 500,000 people to fl ee their homes. The fi res charred over 800 square miles, an area about three-fourths the size of Rhode Island.
◗ FIGURE 7.18 Surface weather map showing Santa Ana conditions in January. Maximum temperatures for this par-ticular day are given in °F. Observe that the downslope winds blowing into southern California raised temperatures into the upper 80s, while elsewhere temperature readings were much lower.
◗ FIGURE 7.19 Strong northeasterly Santa Ana winds on October 23, 2007, blew the smoke from massive wild fi res (red dots) across southern California out over the Pacifi c Ocean.
49331_07_ch7_p176-211.indd 19149331_07_ch7_p176-211.indd 191 15/11/10 11:29 AM15/11/10 11:29 AM
Copyright 2010 Cengage Learning. All Rights Reserved. May not be copied, scanned, or duplicated, in whole or in part. Due to electronic rights, some third party content may be suppressed from the eBook and/or eChapter(s). Editorial review has deemed that any suppressed content does not materially affect the overall learning experience. Cengage Learning reserves the right to remove additional content at any time if subsequent rights restrictions require it.

192 Chapter 7 Atmospheric Circulations
or sand from the ground. Called dust devils or whirl-winds,* these rotating vortices generally form on clear, hot days over a dry surface where most of the sunlight goes into heating the surface, rather than evaporating water from vegetation. Th e atmosphere directly above the hot surface becomes unstable, convection sets in, and the heated air rises. Wind, oft en defl ected by small topo-graphic barriers, fl ows into this region, rotating the rising
air as depicted in ◗ Fig. 7.21. Depending on the nature of the topographic feature, the spin of a dust devil around its central core may be cyclonic or anticyclonic, and both directions occur with about equal frequency.
Having diameters of usually less than 10 feet and heights of less than 300 feet (see ◗ Fig. 7.22), most dust devils are small and last only a short time. Th ere are, however, some dust devils of sizable dimension, extend-ing upward from the surface for many hundreds of feet. Such whirlwinds are capable of considerable damage;
◗ FIGURE 7.20 An haboob approaching Phoenix, Arizona. The dust cloud is rising to a height of about 450 m (1475 ft) above the valley fl oor.
NO
AA
Active ◗ FIGURE 7.21 The formation of a dust devil. On a hot, dry day, the atmosphere next to the ground becomes unstable. As the heated air rises, wind blowing past an obstruction twists the rising air, forming a rotating column, or dust devil. Air from the sides rushes into the rising column, lifting sand, dust, leaves, or any other loose material from the surface.
*In Australia, the Aboriginal word willy-willy refers to a dust devil.
49331_07_ch7_p176-211.indd 19249331_07_ch7_p176-211.indd 192 15/11/10 11:29 AM15/11/10 11:29 AM
Copyright 2010 Cengage Learning. All Rights Reserved. May not be copied, scanned, or duplicated, in whole or in part. Due to electronic rights, some third party content may be suppressed from the eBook and/or eChapter(s). Editorial review has deemed that any suppressed content does not materially affect the overall learning experience. Cengage Learning reserves the right to remove additional content at any time if subsequent rights restrictions require it.

Global Winds 193
winds exceeding 75 knots may overturn mobile homes and tear the roofs off buildings. Fortunately, the major-ity of dust devils are small. Also keep in mind that dust devils are not tornadoes. Th e circulation of many tor-nadoes (as we will see in Chapter 10) usually descends downward from the base of a thunderstorm, whereas the circulation of a dust devil begins at the surface, nor-mally in sunny weather, although some form beneath convective-type clouds.
Desert winds are not confi ned to planet Earth; they form on the planet Mars as well. Most of the Martian duststorms are small, and only cover a relatively small portion of that planet. However, during 2001 an enor-mous duststorm developed that actually wrapped itself around the entire planet. Dust devils also form on Mars when high winds sweep over uneven terrain.
Global WindsUp to now, we have seen that local winds vary consid-erably from day to day and from season to season. As you may suspect, these winds are part of a much larger circulation—the little whirls within larger whirls that we spoke of earlier in this chapter. Indeed, if the rotat-ing high- and low-pressure areas in our atmosphere are like spinning eddies in a huge river, then the fl ow of air around the globe is like the meandering river itself. When winds throughout the world are averaged over a long period of time, the local wind patterns vanish, and what we see is a picture of the winds on a global scale—what is commonly called the general circulation of the atmosphere.
GENERAL CIRCULATION OF THE ATMOSPHERE Before we study the general circulation, we must re-member that it only represents the average air fl ow around the world. Actual winds at any one place and at any given time may vary considerably from this average. Nevertheless, the average can answer why and how the winds blow around the world the way they do—why, for example, prevailing surface winds are northeasterly in Honolulu, Hawaii, and westerly in New York City. Th e average can also give a picture of the driving mechanism behind these winds, as well as a model of how heat is transported from equatorial regions poleward, keeping the climate in middle latitudes tolerable.
Th e underlying cause of the general circulation is the unequal heating of the earth’s surface. We learned in Chapter 2 that, averaged over the entire earth, incoming solar radiation is roughly equal to outgoing earth radia-tion. However, we also know that this energy balance is
not maintained for each latitude, since the tropics expe-rience a net gain in energy, while polar regions suff er a net loss. To balance these inequities, the atmosphere transports warm air poleward and cool air equatorward. Although seemingly simple, the actual fl ow of air is com-plex; certainly not everything is known about it. In order to better understand it, we will fi rst look at some models (that is, artifi cially constructed analogies) that eliminate some of the complexities of the general circulation.
SINGLE-CELL MODEL Th e fi rst model is the single-cell model, in which we assume that:
1. Th e earth’s surface is uniformly covered with water (so that diff erential heating between land and water does not come into play).
2. Th e sun is always directly over the equator (so that the winds will not shift seasonally).
3. Th e earth does not rotate (so that the only force we need deal with is the pressure gradient force).
With these assumptions, the general circula-tion of the atmosphere on the side of the earth facing the sun would look much like the representation in
◗ FIGURE 7.22 A well-developed dust devil forms over a hot desert landscape on a clear summer day.
© N
ilto
n R
en
no
49331_07_ch7_p176-211.indd 19349331_07_ch7_p176-211.indd 193 15/11/10 11:29 AM15/11/10 11:29 AM
Copyright 2010 Cengage Learning. All Rights Reserved. May not be copied, scanned, or duplicated, in whole or in part. Due to electronic rights, some third party content may be suppressed from the eBook and/or eChapter(s). Editorial review has deemed that any suppressed content does not materially affect the overall learning experience. Cengage Learning reserves the right to remove additional content at any time if subsequent rights restrictions require it.

194 Chapter 7 Atmospheric Circulations
◗ Fig. 7.23a—a huge thermally driven convection cell in each hemisphere. (For reference, the names of the dif-ferent regions of the world and their approximate lati-tudes are given in Figure 7.23b.)
Th e circulation of air described in Fig. 7.23a is the Hadley cell (named aft er the eighteenth-century English meteorologist George Hadley, who fi rst proposed the idea). It is driven by energy from the sun. Excessive heating of the equatorial area produces a broad region of surface low pressure, while at the poles excessive cooling creates a region of surface high pressure. In response to the horizontal pressure gradient, cold surface polar air fl ows equatorward, while at higher levels air fl ows toward the poles. Th e entire circulation consists of a closed loop with rising air near the equator, sinking air over the poles, an equatorward fl ow of air near the surface, and a return fl ow aloft . In this manner, some of the excess energy of the tropics is transported as sensible and latent heat to the regions of energy defi cit at the poles.
Such a simple cellular circulation as this does not actually exist on the earth. For one thing, the earth ro-tates, so the Coriolis force would defl ect the southward-moving surface air in the Northern Hemisphere to the right, producing easterly surface winds at practically all latitudes. Th ese winds would be moving in a direction opposite to that of the earth’s rotation and, due to friction with the surface, would slow down the earth’s spin. We know that this does not happen and that prevailing winds in middle latitudes actually blow from the west. Th ere-
fore, observations alone tell us that a closed circulation of air between the equator and the poles is not the proper model for a rotating earth. But this model does show us how a non-rotating planet would balance an excess of en-ergy at the equator and a defi cit at the poles. How, then, does the wind blow on a rotating planet? To answer, we will keep our model simple by retaining our fi rst two as-sumptions—that is, that the earth is covered with water and that the sun is always directly above the equator.
THREE-CELL MODEL If we allow the earth to spin, the simple convection system breaks into a series of cells as shown in ◗ Fig. 7.24. Although this model is consid-erably more complex than the single-cell model, there are some similarities. Th e tropical regions still receive an excess of heat and the poles a defi cit. In each hemi-sphere, three cells instead of one have the task of energy redistribution. A surface high-pressure area is located at the poles, and a broad trough of surface low pressure still exists at the equator. From the equator to latitude 30°, the circulation is the Hadley cell. Let’s look at this model more closely by examining what happens to the air above the equator. (Refer to Fig. 7.24 as you read the following section.)
Over equatorial waters, the air is warm, horizontal pressure gradients are weak, and winds are light. Th is re-gion is referred to as the doldrums. (Th e monotony of the weather in this area has given rise to the expression “down in the doldrums.”) Here, warm air rises, oft en condensing
◗ FIGURE 7.23 Diagram (a) shows the general circulation of air on the side of the earth facing the sun on a nonrotating earth uniformly covered with water and with the sun directly above the equator. (Vertical air motions are highly exag-gerated in the vertical.) Diagram (b) shows the names that apply to the diff erent regions of the world and their approxi-mate latitudes.
49331_07_ch7_p176-211.indd 19449331_07_ch7_p176-211.indd 194 15/11/10 11:30 AM15/11/10 11:30 AM
Copyright 2010 Cengage Learning. All Rights Reserved. May not be copied, scanned, or duplicated, in whole or in part. Due to electronic rights, some third party content may be suppressed from the eBook and/or eChapter(s). Editorial review has deemed that any suppressed content does not materially affect the overall learning experience. Cengage Learning reserves the right to remove additional content at any time if subsequent rights restrictions require it.

Global Winds 195
into huge cumulus clouds and thunderstorms that liber-ate an enormous amount of latent heat. Th is heat makes the air more buoyant and provides energy to drive the Hadley cell. Th e rising air reaches the tropopause, which acts like a barrier, causing the air to move laterally toward the poles. Th e Coriolis force defl ects this poleward fl ow toward the right in the Northern Hemisphere and to the left in the Southern Hemisphere, providing westerly winds aloft in both hemispheres. (We will see later that these westerly winds reach maximum velocity and pro-duce jet streams near 30° latitude and 60° latitude.)
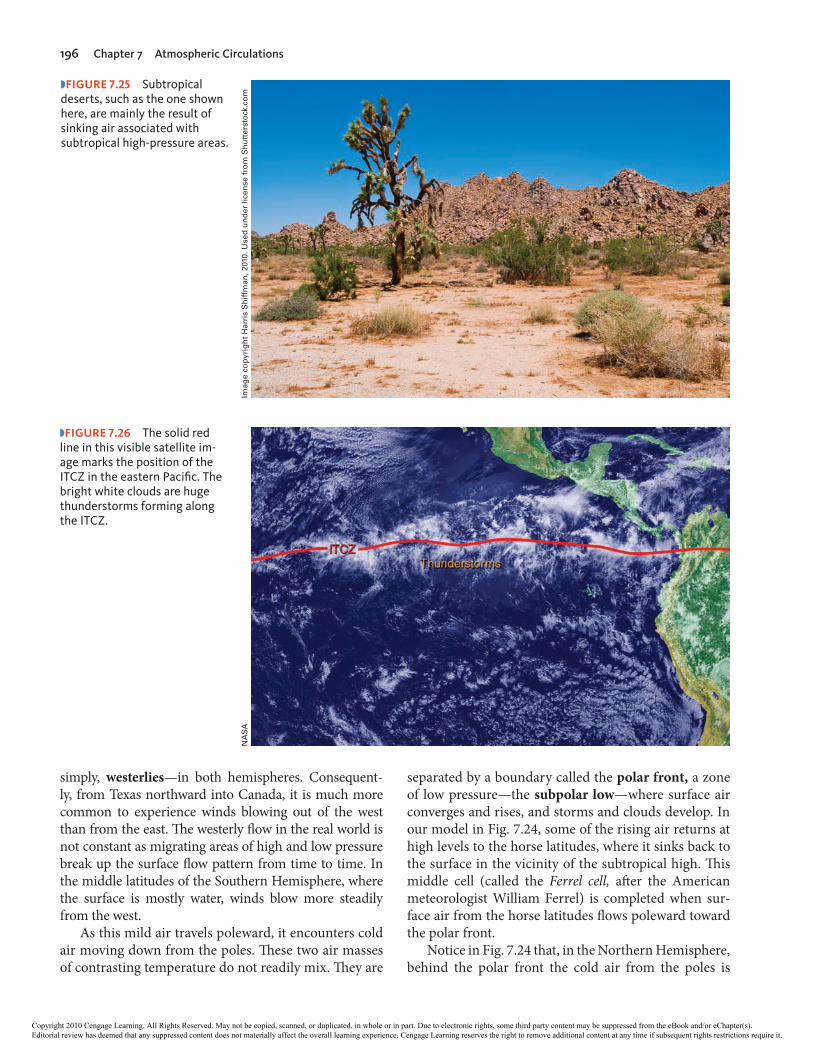
Air aloft moving poleward from the tropics constant-ly cools by giving up infrared radiation, and at the same time it also begins to converge, especially as it approaches the middle latitudes.* Th is convergence (piling up) of air aloft increases the mass of air above the surface, which in turn causes the air pressure at the surface to increase. Hence, at latitudes near 30°, the convergence of air aloft produces belts of high pressure called subtropical highs (or anticyclones). As the converging, relatively dry air above the highs slowly descends, it warms by compres-sion. Th is subsiding air produces generally clear skies and warm surface temperatures; hence, on earth it is here that we fi nd the major deserts of the world, such as the
Sahara of Africa and the Sonoran of North America (see ◗ Fig. 7.25).
Over the ocean, the weak pressure gradients in the center of the high produce only weak winds. According to legend, sailing ships traveling to the New World were frequently becalmed in this region; and, as food and sup-plies dwindled, horses were either thrown overboard or eaten. As a consequence, this region is sometimes called the horse latitudes.
From the horse latitudes near latitude 30°, some of the surface air moves back toward the equator. It does not fl ow straight back, however, because the Coriolis force defl ects the air, causing it to blow from the northeast in the Northern Hemisphere and from the southeast in the Southern Hemisphere. Th ese steady winds provided sail-ing ships with an ocean route to the New World; hence, these winds are called the trade winds. Near the equator, the northeast trades converge with the southeast trades along a boundary called the intertropical convergence zone (ITCZ). In this region of surface convergence, air rises and continues its cellular journey. Along the ITCZ, it is usually very wet as the rising air develops into huge thunderstorms that drop copious amounts of rain in the form of heavy showers (see ◗ Fig. 7.26).
Meanwhile, at latitude 30°, not all of the surface air moves equatorward. Some air moves toward the poles and defl ects toward the east, resulting in a more or less westerly air fl ow—called the prevailing westerlies, or,
Active ◗ FIGURE 7.24 The idealized wind and surface-pressure distribution over a uniformly water-covered rotating earth.
*You can see why the air converges if you have a globe of the world. Put your fi ngers on meridian lines at the equator and then follow the merid-ians poleward. Notice how the lines and your fi ngers bunch together in the middle latitudes.
49331_07_ch7_p176-211.indd 19549331_07_ch7_p176-211.indd 195 15/11/10 11:30 AM15/11/10 11:30 AM
Copyright 2010 Cengage Learning. All Rights Reserved. May not be copied, scanned, or duplicated, in whole or in part. Due to electronic rights, some third party content may be suppressed from the eBook and/or eChapter(s). Editorial review has deemed that any suppressed content does not materially affect the overall learning experience. Cengage Learning reserves the right to remove additional content at any time if subsequent rights restrictions require it.
196 Chapter 7 Atmospheric Circulations
simply, westerlies—in both hemispheres. Consequent-ly, from Texas northward into Canada, it is much more common to experience winds blowing out of the west than from the east. Th e westerly fl ow in the real world is not constant as migrating areas of high and low pressure break up the surface fl ow pattern from time to time. In the middle latitudes of the Southern Hemisphere, where the surface is mostly water, winds blow more steadily from the west.
As this mild air travels poleward, it encounters cold air moving down from the poles. Th ese two air masses of contrasting temperature do not readily mix. Th ey are
separated by a boundary called the polar front, a zone of low pressure—the subpolar low—where surface air converges and rises, and storms and clouds develop. In our model in Fig. 7.24, some of the rising air returns at high levels to the horse latitudes, where it sinks back to the surface in the vicinity of the subtropical high. Th is middle cell (called the Ferrel cell, aft er the American meteorologist William Ferrel) is completed when sur-face air from the horse latitudes fl ows poleward toward the polar front.
Notice in Fig. 7.24 that, in the Northern Hemisphere, behind the polar front the cold air from the poles is
◗ FIGURE 7.25 Subtropical deserts, such as the one shown here, are mainly the result of sinking air associated with subtropical high-pressure areas.
◗ FIGURE 7.26 The solid red line in this visible satellite im-age marks the position of the ITCZ in the eastern Pacifi c. The bright white clouds are huge thunderstorms forming along the ITCZ.
Imag
e c
op
yri
gh
t H
arr
is S
hif
fman
, 2010.
Used
un
der
licen
se f
rom
Sh
utt
ers
tock
.co
mN
AS
A
49331_07_ch7_p176-211.indd 19649331_07_ch7_p176-211.indd 196 15/11/10 11:30 AM15/11/10 11:30 AM
Copyright 2010 Cengage Learning. All Rights Reserved. May not be copied, scanned, or duplicated, in whole or in part. Due to electronic rights, some third party content may be suppressed from the eBook and/or eChapter(s). Editorial review has deemed that any suppressed content does not materially affect the overall learning experience. Cengage Learning reserves the right to remove additional content at any time if subsequent rights restrictions require it.

Global Winds 197
defl ected by the Coriolis force, so that the general fl ow of air is from the northeast. Hence, this is the region of the polar easterlies. In winter, the polar front, with its cold air, can move into middle and subtropical latitudes, producing a cold polar outbreak. Along the front, a por-tion of the rising air moves poleward, and the Coriolis force defl ects the air into a westerly wind at high levels. Air aloft eventually reaches the poles, slowly sinks to the surface, and fl ows back toward the polar front, complet-ing the weak polar cell.
We can summarize all of this by referring back to Fig. 7.24 on p. 195 and noting that, at the surface, there are two major areas of high pressure and two major ar-eas of low pressure. Areas of high pressure exist near lat-itude 30° and the poles; areas of low pressure exist over the equator and near 60° latitude in the vicinity of the polar front. Knowing the way the surface winds blow around these pressure systems on the three-cell model, gives us a generalized picture of how surface winds blow throughout the world. Th e trade winds extend from the subtropical high to the equator, the westerlies from the subtropical high to the polar front, and the polar easter-lies from the poles to the polar front.
How does this three-cell model compare with actual observations of winds and pressure in the real world? We know, for example, that upper-level winds at middle latitudes generally blow from the west. Th e middle cell in our model, however, suggests an east wind aloft as air fl ows equatorward. Hence, discrepancies exist between this model and atmospheric observations. Th is model does, however, agree closely with the winds and pres-sure distribution at the surface, and so we will examine this next.
AVERAGE SURFACE WINDS AND PRESSURE: THE REAL WORLD When we examine the real world with its continents and oceans, mountains and ice fi elds, we obtain an average distribution of sea-level pressure and winds for January and July, as shown in ◗ Figs. 7.27a and 7.27b. Look closely at both maps and observe that there are regions where pressure systems appear to persist throughout the year. Th ese systems are referred to as semipermanent highs and lows because they move only slightly during the course of a year.
In Fig. 7.27a, we can see that there are four semiper-manent pressure systems in the Northern Hemisphere during January. In the eastern Atlantic, between lati-tudes 25° and 35°N is the Bermuda-Azores high, oft en called the Bermuda high, and, in the Pacifi c Ocean, its counterpart, the Pacifi c high. Th ese are the subtropi-cal anticyclones that develop in response to the conver-gence of air aloft . Since surface winds blow clockwise
around these systems, we fi nd the trade winds to the south and the prevailing westerlies to the north. In the Southern Hemisphere, where there is relatively less land area, there is less contrast between land and water, and the subtropical highs show up as well-developed sys-tems with a clearly defi ned circulation.
Where we would expect to observe the polar front (between latitudes 40° and 65°), there are two semiper-manent subpolar lows. In the North Atlantic, there is the Greenland-Icelandic low, or simply Icelandic low, which covers Iceland and southern Greenland, while the Aleu-tian low sits over the Gulf of Alaska and the Bering Sea near the Aleutian Islands in the North Pacifi c. Th ese zones of cyclonic activity actually represent regions where numerous storms, having traveled eastward, tend to converge, especially in winter. In the Southern Hemi-sphere, the subpolar low forms a continuous trough that completely encircles the globe.
On the January map (Fig. 7.27a), there are other pres-sure systems, which are not semipermanent in nature. Over Asia, for example, there is a huge (but shallow) ther-mal anticyclone called the Siberian high, which forms because of the intense cooling of the land. South of this system, the winter monsoon shows up clearly, as air fl ows away from the high across Asia and out over the ocean. A similar (but less intense) anticyclone (called the Canadian high) is evident over North America.
As summer approaches, the land warms and the cold, shallow highs disappear. In some regions, areas of surface low pressure replace areas of high pressure. Th e lows that form over the warm land are shallow thermal lows. On the July map (Fig. 7.27b), warm thermal lows are found over the desert southwest of the United States, over the plateau of Iran, and north of India. As the ther-mal low over India intensifi es, warm, moist air from the ocean is drawn into it, producing the wet summer mon-soon so characteristic of India and Southeast Asia.
When we compare the January and July maps, we can see several changes in the semipermanent pressure systems. Th e strong subpolar lows so well developed in January over the Northern Hemisphere are hard-ly discernible on the July map. Th e subtropical highs,
DID YOU KNOW?Christopher Columbus was a lucky man. The year he set sail for the New World, the trade winds had edged unusually far north, and a steady northeast wind glided his ships along. Only for about ten days did he encounter the light and vari-able wind, more typical of this notorious region (30°N)—the horse latitudes.
49331_07_ch7_p176-211.indd 19749331_07_ch7_p176-211.indd 197 15/11/10 11:30 AM15/11/10 11:30 AM
Copyright 2010 Cengage Learning. All Rights Reserved. May not be copied, scanned, or duplicated, in whole or in part. Due to electronic rights, some third party content may be suppressed from the eBook and/or eChapter(s). Editorial review has deemed that any suppressed content does not materially affect the overall learning experience. Cengage Learning reserves the right to remove additional content at any time if subsequent rights restrictions require it.

198 Chapter 7 Atmospheric Circulations
◗ FIGURE 7.27 Average sea-level pressure distribution and surface wind-fl ow patterns for January (a) and for July (b). The solid red line represents the position of the ITCZ.
49331_07_ch7_p176-211.indd 19849331_07_ch7_p176-211.indd 198 15/11/10 11:30 AM15/11/10 11:30 AM
Copyright 2010 Cengage Learning. All Rights Reserved. May not be copied, scanned, or duplicated, in whole or in part. Due to electronic rights, some third party content may be suppressed from the eBook and/or eChapter(s). Editorial review has deemed that any suppressed content does not materially affect the overall learning experience. Cengage Learning reserves the right to remove additional content at any time if subsequent rights restrictions require it.

Global Winds 199
however, remain dominant in both seasons. Because the sun is overhead in the Northern Hemisphere in July and overhead in the Southern Hemisphere in January, the zone of maximum surface heating shift s seasonally. In response to this shift , the major pressure systems, wind belts, and ITCZ (heavy red line in Fig. 7.27) shift toward the north in July and toward the south in January.*
THE GENERAL CIRCULATION AND PRECIPITA-TION PATTERNS Th e position of the major features of the general circulation and their latitudinal displace-ment (which annually averages about 10° to 15°) strongly infl uence the climate of many areas. For example, on the global scale, we would expect abundant rainfall where the air rises and very little where the air sinks. Consequently, areas of high rainfall exist in the tropics, where humid air rises in conjunction with the ITCZ, and between 40° and 55° latitude, where middle-latitude storms and the polar front force air upward. Areas of low rainfall are found near 30° latitude in the vicinity of the subtropical highs and in polar regions where the air is cold and dry (see ◗ Fig. 7.28).
During the summer, the Pacifi c high drift s north-ward to a position off the California coast (see ◗ Fig. 7.29). Sinking air on its eastern side produces a strong upper-level subsidence inversion, which tends to keep summer weather along the West Coast relatively dry. Th e rainy season typically occurs in winter when the high moves south and storms are able to penetrate the region. Observe in Fig. 7.29 that along the East Coast, the clockwise circulation of winds around the Bermuda high brings warm, tropical air northward into the United States and southern Canada from the Gulf of Mexico and the Atlantic Ocean. Because sinking air is not as well developed on this side of the high, the humid
air can rise and condense into towering cumulus clouds and thunderstorms. So, in part, it is the air motions as-sociated with the subtropical highs that keep summer weather dry in California and moist in Georgia. (Com-pare the rainfall patterns for Los Angeles, California, and Atlanta, Georgia, in ◗ Fig. 7.30.)
WESTERLY WINDS AND THE JET STREAM In Chapter 6, we learned that the winds above the middle latitudes in both hemispheres blow in a wavy west-to-east direction. Th e reason for these westerly winds is that, aloft , we generally fi nd higher pressure over equa-torial regions and lower pressures over polar regions. Where these upper-level winds tend to concentrate into
*An easy way to remember the seasonal shift of surface pressure systems is to think of birds—in the Northern Hemisphere, they migrate south in the winter and north in the summer.
◗ FIGURE 7.28 Rising and sinking air associated with the major pressure systems of the earth’s general circulation. Where the air rises, precipitation tends to be abundant (blue shade); where the air sinks, drier regions prevail (tan shade). Note that the sinking air of the subtropical highs produces the major desert regions of the world.
◗ FIGURE 7.29 During the summer, the Pacifi c high moves northward. Sinking air along its eastern margin (over Cali-fornia) produces a strong subsidence inversion, which causes relatively dry weather to prevail. Along the western margin of the Bermuda high, southerly winds bring in humid air, which rises, condenses, and produces abundant rainfall.
49331_07_ch7_p176-211.indd 19949331_07_ch7_p176-211.indd 199 15/11/10 11:30 AM15/11/10 11:30 AM
Copyright 2010 Cengage Learning. All Rights Reserved. May not be copied, scanned, or duplicated, in whole or in part. Due to electronic rights, some third party content may be suppressed from the eBook and/or eChapter(s). Editorial review has deemed that any suppressed content does not materially affect the overall learning experience. Cengage Learning reserves the right to remove additional content at any time if subsequent rights restrictions require it.
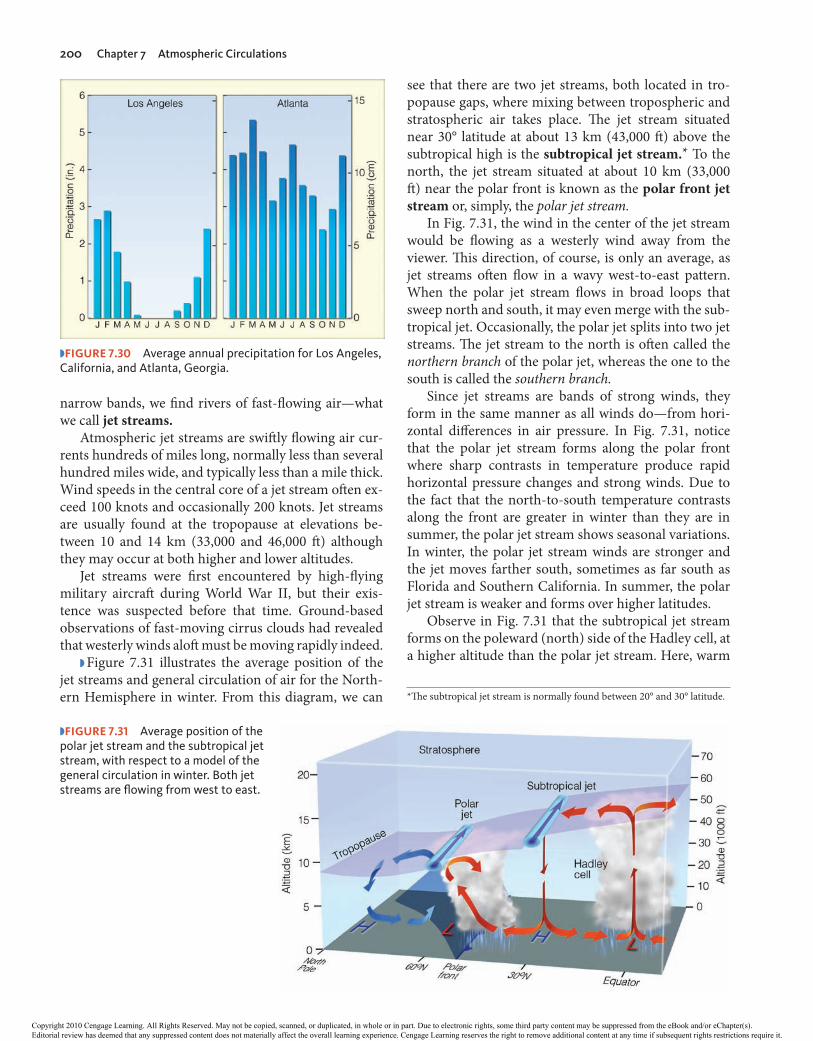
200 Chapter 7 Atmospheric Circulations
narrow bands, we fi nd rivers of fast-fl owing air—what we call jet streams.
Atmospheric jet streams are swift ly fl owing air cur-rents hundreds of miles long, normally less than several hundred miles wide, and typically less than a mile thick. Wind speeds in the central core of a jet stream oft en ex-ceed 100 knots and occasionally 200 knots. Jet streams are usually found at the tropopause at elevations be-tween 10 and 14 km (33,000 and 46,000 ft ) although they may occur at both higher and lower altitudes.
Jet streams were fi rst encountered by high-fl ying military aircraft during World War II, but their exis-tence was suspected before that time. Ground-based observations of fast-moving cirrus clouds had revealed that westerly winds aloft must be moving rapidly indeed.
◗ Figure 7.31 illustrates the average position of the jet streams and general circulation of air for the North-ern Hemisphere in winter. From this diagram, we can
see that there are two jet streams, both located in tro-popause gaps, where mixing between tropospheric and stratospheric air takes place. Th e jet stream situated near 30° latitude at about 13 km (43,000 ft ) above the subtropical high is the subtropical jet stream.* To the north, the jet stream situated at about 10 km (33,000 ft ) near the polar front is known as the polar front jet stream or, simply, the polar jet stream.
In Fig. 7.31, the wind in the center of the jet stream would be fl owing as a westerly wind away from the viewer. Th is direction, of course, is only an average, as jet streams oft en fl ow in a wavy west-to-east pattern. When the polar jet stream fl ows in broad loops that sweep north and south, it may even merge with the sub-tropical jet. Occasionally, the polar jet splits into two jet streams. Th e jet stream to the north is oft en called the northern branch of the polar jet, whereas the one to the south is called the southern branch.
Since jet streams are bands of strong winds, they form in the same manner as all winds do—from hori-zontal diff erences in air pressure. In Fig. 7.31, notice that the polar jet stream forms along the polar front where sharp contrasts in temperature produce rapid horizontal pressure changes and strong winds. Due to the fact that the north-to-south temperature contrasts along the front are greater in winter than they are in summer, the polar jet stream shows seasonal variations. In winter, the polar jet stream winds are stronger and the jet moves farther south, sometimes as far south as Florida and Southern California. In summer, the polar jet stream is weaker and forms over higher latitudes.
Observe in Fig. 7.31 that the subtropical jet stream forms on the poleward (north) side of the Hadley cell, at a higher altitude than the polar jet stream. Here, warm
◗ FIGURE 7.30 Average annual precipitation for Los Angeles, California, and Atlanta, Georgia.
◗ FIGURE 7.31 Average position of the polar jet stream and the subtropical jet stream, with respect to a model of the general circulation in winter. Both jet streams are fl owing from west to east.
*Th e subtropical jet stream is normally found between 20° and 30° latitude.
49331_07_ch7_p176-211.indd 20049331_07_ch7_p176-211.indd 200 15/11/10 11:30 AM15/11/10 11:30 AM
Copyright 2010 Cengage Learning. All Rights Reserved. May not be copied, scanned, or duplicated, in whole or in part. Due to electronic rights, some third party content may be suppressed from the eBook and/or eChapter(s). Editorial review has deemed that any suppressed content does not materially affect the overall learning experience. Cengage Learning reserves the right to remove additional content at any time if subsequent rights restrictions require it.

Global Winds 201
air aloft carried poleward by the Hadley cell produces sharp temperature diff erences, strong pressure gradi-ents, and high winds. ◗ Figure 7.32 illustrates how the polar jet stream and the subtropical jet stream might ap-pear as they sweep around the earth in winter.
We can better see the looping pattern of the jet by studying ◗ Fig. 7.33a, which shows the position of the polar jet stream and the subtropical jet stream at the 300-mb level (near 9 km or 30,000 ft ) on March 9, 2005. Th e fastest fl owing air, or jet core, is represented by the heavy dark arrows. Th e map shows a strong polar jet stream sweeping south over the Great Plains with an equally strong subtropical jet over the Gulf states. Notice that the polar jet has a number of loops, with one off the west coast of North America and another over eastern Canada. Observe in the satellite image (Fig. 7.33b) that the polar jet stream (blue arrow) is di-recting cold, polar air into the Plains States, while the subtropical jet stream (orange arrow) is sweeping sub-tropical moisture, in the form of a dense cloud cover, over the southeastern states.
Th e looping pattern of the polar jet stream has an important function. In the Northern Hemisphere, where the air fl ows southward, swift ly moving air di-
rects cold air equatorward; where the air fl ows north-ward, warm air is carried toward the poles. Jet streams, therefore, play a major role in the global transfer of heat. Moreover, since jet streams tend to meander around the world, we can easily understand how pollutants or vol-canic ash injected into the atmosphere in one part of the globe could eventually settle to the ground many thou-sands of kilometers downwind. And, as we will see in
DID YOU KNOW?Strong upper-level winds during April, 2010, blew tons of dust and ash from an Icelandic volcano over much of western Europe. The ash cloud closed most of the continent’s airports for a week, which in turn aff ected more than a million passen-gers a day, and cost the airline industry more than $1.7 billion in lost revenues.
Active ◗ FIGURE 7.32 Jet streams are swiftly fl owing cur-rents of air that move in a wavy west-to-east direction. The fi gure shows the position of the polar jet stream and subtrop-ical jet stream in winter. Although jet streams are shown as one continuous river of air, in reality they are discontinuous, with their position varying from one day to the next.
◗ FIGURE 7.33 (a) Position of the polar jet stream (blue arrows) and the subtropical jet stream (orange arrows) at the 300-mb level (about 9 km or 30,000 ft above sea level) on March 9, 2005. Solid lines are lines of equal wind speed (isotachs) in knots. (b) Satellite image showing clouds and positions of the jet streams for the same day.
49331_07_ch7_p176-211.indd 20149331_07_ch7_p176-211.indd 201 15/11/10 11:30 AM15/11/10 11:30 AM
Copyright 2010 Cengage Learning. All Rights Reserved. May not be copied, scanned, or duplicated, in whole or in part. Due to electronic rights, some third party content may be suppressed from the eBook and/or eChapter(s). Editorial review has deemed that any suppressed content does not materially affect the overall learning experience. Cengage Learning reserves the right to remove additional content at any time if subsequent rights restrictions require it.

202 Chapter 7 Atmospheric Circulations
Chapter 8, the looping nature of the polar jet stream has an important role in the development of mid-latitude cyclonic storms.
Although the polar and subtropical jets are the two most frequently in the news, there are other jet streams that deserve mentioning. For example, there is a low-level jet stream that forms just above the Central Plains of the United States. During the summer, this jet (which usually has peak winds of less than 60 knots) oft en con-tributes to the formation of nighttime thunderstorms by transporting moisture and warm air northward. Higher up in the atmosphere, over the subtropics, a summer-time easterly jet called the tropical easterly jet forms at the base of the tropopause. And during the dark polar winter, a strato spheric polar jet forms near the top of the stratosphere.
BRIEF REVIEWBefore going on to the next section, which describes the many interactions between the atmosphere and the ocean, here is a review of some of the important concepts presented so far:
◗ The two major semipermanent subtropical highs that infl u-ence the weather of North America are the Pacifi c high situated off the west coast and the Bermuda high situated off the southeast coast.
◗ The polar front is a zone of low pressure where cyclonic storms often form. It separates the mild westerlies of the middle latitudes from the cold, polar easterlies of the high latitudes.
◗ In equatorial regions, the intertropical convergence zone (ITCZ) is a boundary where air rises in response to the con-vergence of the northeast trades and the southeast trades. Along the ITCZ huge thunderstorms produce heavy rain showers.
◗ In the Northern Hemisphere, the major global pressure systems and wind belts shift northward in summer and southward in winter.
◗ The northward movement of the Pacifi c high in summer tends to keep summer weather along the west coast of North America relatively dry.
◗ Jet streams exist where strong winds become concentrated in narrow bands. The polar-front jet stream is associated with the polar front. The polar jet meanders in a wavy west-to-east pattern, becoming strongest in winter when the contrast in temperature along the front is greatest.
◗ The subtropical jet stream is found on the poleward side of the Hadley cell, between 20° and 30° latitude. It is normally observed at a higher altitude than the polar jet stream.
Global Wind Patterns and the OceansAlthough scientifi c understanding of all the interac-tions between the oceans and the atmosphere is far from complete, there are some relationships that deserve mentioning here.
As the wind blows over the oceans, it causes the surface water to drift along with it. Th e moving water gradually piles up, creating pressure diff erences within the water itself. Th is leads to further motion several hundreds of meters down into the water. In this man-ner, the general wind fl ow around the globe starts the major surface ocean currents moving. Th e relationship between the general circulation and ocean currents can be seen by comparing Figs. 7.27a and b (p. 198) and ◗ Fig. 7.34 (p. 203).
Because of the larger frictional drag in water, ocean currents move more slowly than the prevailing winds above. Typically, they range in speed from several ki-lometers per day to several kilometers per hour. In Fig. 7.34, we can see that ocean currents tend to spiral in semi-closed whirls. On the eastern edge of continents there is usually a warm current that fl ows from the equa-tor to the pole. For example, in the North Atlantic, fl ow-ing northward along the east coast of the United States, is a tremendous warm water current called the Gulf Stream, which carries vast quantities of warm, tropical water into higher latitudes. Off the coast of North Caro-lina, the Gulf Stream provides warmth and moisture for developing mid- latitude cyclonic storms.
Notice in Fig. 7.34 that as the Gulf Stream moves northward, the prevailing westerlies steer it away from the coast of North America and eastward toward Eu-
DID YOU KNOW?The jet stream is in part responsible for the only American casualties by enemy attack on the continental United States in World War II. During the war, when the existence of the jet stream was fi rst confi rmed, the Japanese attempted to drop bombs on the United States mainland by launching balloons that carried explosives and incendiary devices. The hydrogen-fi lled balloons drifted from Japan for thousands of miles across the Pacifi c Ocean at an altitude above 30,000 feet. Unfortunately, a group of six picnickers in Oregon found a balloon bomb in the woods and attempted to move it, which caused it to explode, killing all six people. Estimates are that as many as 300 balloon bombs may still be scattered throughout regions of the western United States.
49331_07_ch7_p176-211.indd 20249331_07_ch7_p176-211.indd 202 15/11/10 11:30 AM15/11/10 11:30 AM
Copyright 2010 Cengage Learning. All Rights Reserved. May not be copied, scanned, or duplicated, in whole or in part. Due to electronic rights, some third party content may be suppressed from the eBook and/or eChapter(s). Editorial review has deemed that any suppressed content does not materially affect the overall learning experience. Cengage Learning reserves the right to remove additional content at any time if subsequent rights restrictions require it.

Global Wind Patterns and the Oceans 203
rope. Generally, it widens and slows as it merges into the broader North Atlantic Drift . As this current approaches Europe, part of it fl ows northward along the coasts of Great Britain and Norway, bringing with it warm water (which helps keep winter temperatures much warmer than one would expect this far north). Th e other part fl ows southward as the Canary Current, which trans-ports cool, northern water equatorward. In the Pacifi c Ocean, the counterpart to the Canary Current is the California Current that carries cool water southward along the coastline of the western United States. Hence, on the western edge of major continents, there is usu-ally a cool current that fl ows from the pole toward the equator.
Up to now, we have seen that atmospheric circula-tions and ocean circulations are closely linked; wind blowing over the oceans produces surface ocean cur-rents. Th e currents, along with the wind, transfer heat from tropical areas, where there is a surplus of energy, to polar regions, where there is a defi cit. Th is helps to
equalize the latitudinal energy imbalance with about 40 percent of the total heat transport in the Northern Hemisphere coming from surface ocean currents. Th e environmental implications of this heat transfer are tremendous. If the energy imbalance were to go un-checked, yearly temperature diff erences between low and high latitudes would increase greatly, and the cli-mate would gradually change.
WINDS AND UPWELLING Earlier, we saw that the cool California Current fl ows roughly parallel to the west coast of North America. From this, we might con-clude that summer surface water temperatures would be cool along the coast of Washington and gradually warm as we move south. A quick glance at the water tempera-tures along the west coast of the United States during Au-gust (see ◗ Fig. 7.35) quickly alters that notion. Th e cold-est water is observed along the northern California coast near Cape Mendocino. Th e reason for the cold, coastal water is upwelling—the rising of cold water from below.
◗ FIGURE 7.34 Average position and extent of the major surface ocean currents. Cold currents are shown in blue; warm cur-rents are shown in red.
49331_07_ch7_p176-211.indd 20349331_07_ch7_p176-211.indd 203 15/11/10 11:30 AM15/11/10 11:30 AM
Copyright 2010 Cengage Learning. All Rights Reserved. May not be copied, scanned, or duplicated, in whole or in part. Due to electronic rights, some third party content may be suppressed from the eBook and/or eChapter(s). Editorial review has deemed that any suppressed content does not materially affect the overall learning experience. Cengage Learning reserves the right to remove additional content at any time if subsequent rights restrictions require it.

204 Chapter 7 Atmospheric Circulations
For upwelling to occur, the wind must fl ow more or less parallel to the coastline. Notice in ◗ Fig. 7.36 that summer winds tend to parallel the coastline of Califor-nia. As the wind blows over the ocean, the surface water beneath it is set in motion. As the surface water moves, it bends slightly to its right due to the Coriolis eff ect. (Remember, it would bend to the left in the Southern Hemisphere.) Th e water beneath the surface also moves, and it too bends slightly to its right. Th e net eff ect of this phenomenon is that a rather shallow layer of surface wa-ter moves at right angles to the surface wind and heads seaward. As the surface water drift s away from the coast, cold, nutrient-rich water from below rises (upwells) to re-place it. Upwelling is strongest and surface water is cool-est where the wind parallels the coast, such as it does in summer along the coast of northern California.
Because of the cold coastal water, summertime weather along the West Coast oft en consists of low clouds and fog, as the air over the water is chilled to its saturation point. On the brighter side, upwelling pro-duces good fi shing, as higher concentrations of nutri-ents are brought to the surface. But swimming is only for the hardiest of souls as the average surface water temperature along the coast of northern California in summer is nearly 10°C (18°F) colder than the average coastal water temperature found at the same latitude along the Atlantic coast.
Between the ocean surface and the atmosphere, there is an exchange of heat and moisture that depends, in part, on temperature diff erences between water and air. In winter, when air-water temperature contrasts are greatest, there is a substantial transfer of sensible and latent heat from the ocean surface into the atmosphere. Th is energy helps to maintain the global airfl ow. Conse-quently, even a relatively small change in surface ocean temperatures could modify atmospheric circulations and have far-reaching eff ects on global weather pat-terns. Th e next section describes how weather events can be linked to surface ocean temperature changes in the tropical Pacifi c.
EL NIÑO AND THE SOUTHERN OSCILLATION Along the west coast of South America, where the cool Peru Current sweeps northward, southerly winds pro-mote upwelling of cold, nutrient-rich water that gives rise to large fi sh populations, especially anchovies. Th e abundance of fi sh supports a large population of sea birds whose droppings (called guano) produce huge phosphate-rich deposits, which support the fertilizer in-dustry. Near the end of the calendar year, a warm current of nutrient-poor tropical water oft en moves southward, replacing the cold, nutrient-rich surface water. Because
◗ FIGURE 7.35 Average sea surface temperatures (°F) along the west coast of North America during August.
◗ FIGURE 7.36 As winds blow parallel to the west coast of North America, surface water is transported to the right (out to sea). Cold water moves up from below (upwells) to replace the surface water. The large H repre-sents the position of the Pacifi c High in summer. Blue arrows show the movement of water.
49331_07_ch7_p176-211.indd 20449331_07_ch7_p176-211.indd 204 15/11/10 11:30 AM15/11/10 11:30 AM
Copyright 2010 Cengage Learning. All Rights Reserved. May not be copied, scanned, or duplicated, in whole or in part. Due to electronic rights, some third party content may be suppressed from the eBook and/or eChapter(s). Editorial review has deemed that any suppressed content does not materially affect the overall learning experience. Cengage Learning reserves the right to remove additional content at any time if subsequent rights restrictions require it.

Global Wind Patterns and the Oceans 205
this condition frequently occurs around Christmas, lo-cal residents call it El Niño (Spanish for boy child), re-ferring to the Christ child.
In most years, the warming lasts for only a few weeks to a month or more, aft er which weather patterns usually return to normal and fi shing improves. However, when El Niño conditions last for many months, and a more ex-tensive ocean warming occurs, the economic results can be catastrophic. Th is extremely warm episode, which oc-curs at irregular intervals of two to seven years and covers a large area of the tropical Pacifi c Ocean, is now referred to as a major El Niño event, or simply El Niño.*
During a major El Niño event, large numbers of fi sh and marine plants may die. Dead fi sh and birds may lit-ter the water and beaches of Peru; their decomposing carcasses deplete the water’s oxygen supply, which leads to the bacterial production of huge amounts of smelly hydrogen sulfi de. Th e El Niño of 1972–1973 reduced
the annual Peruvian anchovy catch from 10.3 million metric tons in 1971 to 4.6 million metric tons in 1972. Since much of the harvest of this fi sh is converted into fi sh meal and exported for use in feeding livestock and poultry, the world’s fi sh meal production in 1972 was greatly reduced. Countries such as the United States that rely on fi sh meal for animal feed had to use soybeans as an alternative. Th is raised poultry prices in the United States by more than 40 percent.
Why does the ocean become so warm over the east-ern tropical Pacifi c? Normally, in the tropical Pacifi c Ocean, the trades are persistent winds that blow west-ward from a region of higher pressure over the eastern Pacifi c toward a region of lower pressure centered near Indonesia (see ◗ Fig. 7.37). Th e trades create upwelling that brings cold water to the surface. As this water moves westward, it is heated by sunlight and the atmosphere. Consequently, in the Pacifi c Ocean, surface water along the equator usually is cool in the east and warm in the west. In addition, the dragging of surface water by the trades raises sea level in the western Pacifi c and lowers it in the eastern Pacifi c, which produces a thick layer of
*It was thought that El Niño was a local event that occurs along the west coast of Peru and Ecuador. It is now known that the ocean-warming associ-ated with a major El Niño can cover an area of the tropical Pacifi c much larger than the continental United States.
Active ◗ FIGURE 7.37 In diagram (a), under ordinary conditions higher pressure over the southeastern Pacifi c and lower pressure near Indonesia produce easterly trade winds along the equator. These winds promote upwelling and cooler ocean water in the eastern Pacifi c, while warmer water prevails in the western Pacifi c. The trades are part of a circulation (called the Walker circulation) that typically fi nds rising air and heavy rain over the western Pacifi c and sinking air and generally dry weather over the eastern Pacifi c. When the trades are exceptionally strong, water along the equator in the eastern Pacifi c becomes quite cool. This cool event is called La Niña. During El Niño conditions—diagram (b)—atmospheric pressure decreases over the eastern Pacifi c and rises over the western Pacifi c. This change in pressure causes the trades to weaken or reverse direc-tion. This situation enhances the countercurrent that carries warm water from the west over a vast region of the eastern tropical Pacifi c. The thermocline, which separates the warm water of the upper ocean from the cold water below, changes as the ocean conditions change from non-El Niño to El Niño.
49331_07_ch7_p176-211.indd 20549331_07_ch7_p176-211.indd 205 15/11/10 11:31 AM15/11/10 11:31 AM
Copyright 2010 Cengage Learning. All Rights Reserved. May not be copied, scanned, or duplicated, in whole or in part. Due to electronic rights, some third party content may be suppressed from the eBook and/or eChapter(s). Editorial review has deemed that any suppressed content does not materially affect the overall learning experience. Cengage Learning reserves the right to remove additional content at any time if subsequent rights restrictions require it.

206 Chapter 7 Atmospheric Circulations
warm water over the tropical western Pacifi c Ocean and a weak ocean current (called the countercurrent) that fl ows slowly eastward toward South America.
Every few years, the surface atmospheric pressure patterns break down, as air pressure rises over the re-gion of the western Pacifi c and falls over the eastern Pacifi c (see Fig. 7.37b). Th is change in pressure weak-ens the trades, and, during strong pressure reversals, east winds are replaced by west winds. Th e west winds strengthen the countercurrent, causing warm water to head eastward toward South America over broad areas of the tropical Pacifi c. Toward the end of the warming period, which may last between one and two years, at-mospheric pressure over the eastern Pacifi c reverses and begins to rise, whereas, over the western Pacifi c, it falls. Th is seesaw pattern of reversing surface air pressure at opposite ends of the Pacifi c Ocean is called the South-
ern Oscillation. Because the pressure reversals and ocean warming are more or less simultaneous, scientists call this phenomenon the El Niño/Southern Oscillation or ENSO for short. Although most ENSO episodes fol-low a similar evolution, each event has its own personal-ity, diff ering in both strength and behavior.
During especially strong ENSO events (such as in 1982–1983 and 1997–1998) the easterly trades may ac-tually become westerly winds, as illustrated in Fig. 7.37b. As these winds push eastward, they drag surface water with them. Th is dragging raises sea level in the eastern Pacifi c and lowers sea level in the western Pacifi c. Th e eastward-moving water gradually warms under the tropical sun, becoming as much as 6°C (11°F) warmer than normal in the eastern equatorial Pacifi c. Gradually, a thick layer of warm water pushes into coastal areas of Ecuador and Peru, choking off the upwelling that sup-plies cold, nutrient-rich water to South America’s coast-al region. Th e unusually warm water may extend from South America’s coastal region for many thousands of kilometers westward along the equator (see ◗ Fig. 7.38).
Such a large area of abnormally warm water can have an eff ect on global wind patterns. Th e warm tropical water fuels the atmosphere with additional warmth and mois-ture, which the atmosphere turns into additional stormi-ness and rainfall. Th e added warmth from the oceans and the release of latent heat during condensation apparently infl uence the westerly winds aloft in such a way that cer-tain regions of the world experience too much rainfall, whereas others have too little. Meanwhile, over the warm tropical central Pacifi c, the frequency of typhoons usually increases. However, over the tropical Atlantic, between Africa and Central America, the winds aloft tend to dis-rupt the organization of thunderstorms that is necessary for hurricane development; hence, there are fewer hur-ricanes in this region during strong El Niño events. And, as we saw earlier in this chapter, during a strong El Niño, summer monsoon conditions tend to weaken over In-dia, although this weakening did not happen during the strong El Niño of 1997.
Although the actual mechanism by which changes in surface ocean temperatures infl uence global wind patterns is not fully understood, the by-products are plain to see. For example, during exceptionally warm El Niños, drought is normally felt in Indonesia, south-ern Africa, and Australia, while heavy rains and fl ood-ing oft en occur in Ecuador and Peru. In the Northern Hemisphere, a strong subtropical westerly jet stream normally directs storms into California and heavy rain into the Gulf Coast states. Th e total damage worldwide due to fl ooding, winds, and drought may exceed many billions of dollars.
◗ FIGURE 7.38 (a) Average sea surface temperature depar-tures from normal as measured by satellite. During El Niño conditions, upwelling is greatly diminished and warmer than normal water (deep red color) extends from the coast of South America westward, across the Pacifi c. (b) During La Niña conditions, strong trade winds promote upwelling, and cooler than normal water (dark blue color) extends over the eastern and central Pacifi c. (NOAA/PHEL/TAO)
49331_07_ch7_p176-211.indd 20649331_07_ch7_p176-211.indd 206 15/11/10 11:31 AM15/11/10 11:31 AM
Copyright 2010 Cengage Learning. All Rights Reserved. May not be copied, scanned, or duplicated, in whole or in part. Due to electronic rights, some third party content may be suppressed from the eBook and/or eChapter(s). Editorial review has deemed that any suppressed content does not materially affect the overall learning experience. Cengage Learning reserves the right to remove additional content at any time if subsequent rights restrictions require it.

Global Wind Patterns and the Oceans 207
Following an ENSO event, the trade winds usually return to normal. However, if the trades are exception-ally strong, unusually cold surface water moves over the central and eastern Pacifi c, as shown in Fig. 7.38b. Warm water and rainy weather is confi ned mainly to the western tropical Pacifi c. Th is cold-water episode, which is the opposite of El Niño conditions, has been termed La Niña (the girl child).
As we have seen, El Niño and the Southern Oscilla-tion are part of a large-scale ocean-atmosphere interac-tion that can take several years to run its course. During this time, there are certain regions in the world where signifi cant climatic responses to an ENSO event are likely. ◗ Figure 7.39 shows how typical winter weather patterns over North America will change between El Niño conditions and La Niña conditions. Such ocean-atmosphere interactions, where a warmer or colder ocean surface can infl uence weather patterns in distant parts of the world, are called teleconnections.
Some scientists feel that the trigger necessary to start an ENSO event lies within the changing of the seasons, especially the transition periods of spring and fall. Oth-ers feel that the winter monsoon plays a major role in triggering a major El Niño event. As noted earlier, it appears that an ENSO episode and the monsoon sys-tem are intricately linked, so that a change in one brings about a change in the other.
Presently, scientists (with the aid of coupled general circulation models) are trying to simulate atmospheric and oceanic conditions, so that El Niño and the South-ern Oscillation can be anticipated. At this point, several models have been formulated that show promise in pre-dicting the onset and life history of an ENSO event. In addition, in-depth studies of the tropical Pacifi c Ocean
are providing scientists with valuable information about the interactions that occur between the ocean and the atmosphere. Th e primary aim of these ocean studies is to provide enough scientifi c information so that re-searchers can better predict climatic fl uctuations (such as ENSO) that occur over periods of months and years. Th e hope is that a better understanding of El Niño and the Southern Oscillation will provide improved long-range forecasts of weather and climate.
Up to this point, we have looked at El Niño and the Southern Oscillation, as well as how the reversal of sur-face ocean temperatures and atmospheric pressure com-bine to infl uence regional and global weather and climate patterns. Th ere are other atmosphere-ocean inter actions that can have an eff ect on large-scale weather patterns. Some of these are described in the following section.
OTHER ATMOSPHERE-OCEAN INTERACTIONS Is there a similar pattern in the Atlantic that compares to the Southern Oscillation in the Pacifi c? Over the Atlantic there is a reversal of pressure (called the North Atlantic Oscilla-tion, or NAO) that has an eff ect on the weather in Europe and along the east coast of North America. For example, in winter if the atmospheric pressure in the vicinity of the Ice-landic low drops, and the pressure in the region of the Ber-muda-Azores high rises, there is a corresponding large dif-ference in atmospheric pressure between these two regions that strengthens the westerlies. Th e strong westerlies in turn direct strong storms on a more northerly track into north-ern Europe, where winters tend to be wet and mild. During this positive phase of the NAO, winters in the eastern Unit-ed States tend to be wet and relatively mild, while north-ern Canada and Greenland are usually cold and dry (see ◗ Fig. 7.40a).
◗ FIGURE 7.39 Typical winter weather patterns across North America during an El Niño warm event (a) and during a La Niña cold event (b). During El Niño conditions, a persistent trough of low pressure forms over the north Pacifi c and, to the south of the low, the jet stream (from off the Pacifi c) steers wet weather and storms into California and the southern part of the United States. During La Niña conditions, a persistent high-pressure area forms south of Alaska forcing the polar jet stream and accom-panying cold air over much of western North America. The southern branch of the polar jet stream directs moist air from the ocean into the Pacifi c Northwest, producing a wet winter for that region.
49331_07_ch7_p176-211.indd 20749331_07_ch7_p176-211.indd 207 15/11/10 11:31 AM15/11/10 11:31 AM
Copyright 2010 Cengage Learning. All Rights Reserved. May not be copied, scanned, or duplicated, in whole or in part. Due to electronic rights, some third party content may be suppressed from the eBook and/or eChapter(s). Editorial review has deemed that any suppressed content does not materially affect the overall learning experience. Cengage Learning reserves the right to remove additional content at any time if subsequent rights restrictions require it.

208 Chapter 7 Atmospheric Circulations
Th e negative phase of the NAO occurs when the at-mospheric pressure in the vicinity of the Icelandic low rises, while the pressure drops in the region of the Ber-muda high (see Fig. 7.40b). Th is pressure change results in a reduced pressure gradient and weaker westerlies that steer fewer and weaker winter storms across the At-lantic in a more westerly path. Th ese storms bring wet weather to southern Europe and to the region around the Mediterranean Sea. Meanwhile, winters in northern Europe are usually cold and dry, as are the winters along the east coast of North America. Greenland and north-ern Canada usually experience mild winters.
Closely related to the North Atlantic Oscillation is the Arctic Oscillation (AO), where changes in atmo-spheric pressure between the Arctic and regions to the south cause changes in the upper-level westerly winds. During the positive warm phase of the AO, strong pres-sure diff erences produce strong westerly winds aloft that prevent cold arctic air from invading the United States, and so winters in this region tend to be warmer than normal. With cold arctic air in place to the north, win-ters over Newfoundland and Greenland tend to be very cold. Meanwhile, strong winds over the Atlantic direct storms into northern Europe, bringing with them wet, mild weather.
During the negative cold phase of the AO, small pres-sure diff erences between the arctic and regions to the south produce weaker westerly winds aloft . Cold arc-tic air is now able to penetrate farther south, produc-ing colder than normal winters over much of the United States. Cold air also invades northern Europe and Asia,
while Newfoundland and Greenland normally experi-ence warmer than normal winters.
So, when Greenland has mild winters, northern Europe has cold winters and vice versa. Th is seesaw in winter temperatures between Greenland and northern Europe has been known for many years. What was not known until recently is that, during the warm Arctic Oscillation phase, relatively warm, salty water from the Atlantic is able to move into the Arctic Ocean, where it melts sea ice, causing it to thin by more than 40 centime-ters. During the cold phase surface winds tend to keep warmer Atlantic water to the south, which promotes thicker sea ice. Although the Arctic Oscillation switches from one phase to another on an irregular basis, one phase may persist for several years in a row, bringing with it a succession of either cold or mild winters.
Over the Pacifi c Ocean, changes in surface ocean tem-peratures appear to infl uence winter weather along the west coast of North America. In the mid 1990s, scientists at the University of Washington, while researching con-nections between Alaskan salmon production and Pacifi c climate, identifi ed a long-term Pacifi c Ocean temperature fl uctuation, which they called the Pacifi c Decadal Oscil-lation (PDO) because the ocean surface temperature re-verses every 20 to 30 years. Th e Pacifi c Decadal Oscilla-tion is like ENSO in that it has a warm phase and a cool phase, but its temperature behavior is much diff erent from that of El Niño in the tropical Pacifi c.
During the warm (or positive) phase, unusually warm surface water exists along the west coast of North America, while over the central North Pacifi c, cooler
◗ FIGURE 7.40 Change in surface atmospheric pressure and typical winter weather patterns associated with the (a) positive phase and (b) negative phase of the North Atlantic Oscillation.
49331_07_ch7_p176-211.indd 20849331_07_ch7_p176-211.indd 208 15/11/10 11:31 AM15/11/10 11:31 AM
Copyright 2010 Cengage Learning. All Rights Reserved. May not be copied, scanned, or duplicated, in whole or in part. Due to electronic rights, some third party content may be suppressed from the eBook and/or eChapter(s). Editorial review has deemed that any suppressed content does not materially affect the overall learning experience. Cengage Learning reserves the right to remove additional content at any time if subsequent rights restrictions require it.

Global Wind Patterns and the Oceans 209
than normal surface water prevails (see ◗ Fig. 7.41a). At the same time, the Aleutian low in the Gulf of Alaska strengthens, which causes more Pacifi c storms to move into Alaska and California. Th is situation causes win-ters, as a whole, to be warmer and drier over north-western North America. Elsewhere, winters tend to be drier over the Great Lakes, and cooler and wetter in the southern United States.
Th e present cool (or negative) phase fi nds cooler-than-average surface water along the west coast of North America and an area of warmer-than-normal surface
water extending from Japan into the central North Pa-cifi c (see Fig. 7.41b). Winters in the cool phase tend to be cooler and wetter than average over northwestern North America, wetter over the Great Lakes, and warm-er and drier in the southern United States.
Th e climate patterns described so far only represent average conditions, as individual years within either phase may vary considerably. Hopefully, as our un-derstanding of the interactions between the ocean and atmosphere improves, climate forecasts across North America and elsewhere will improve as well.
◗ FIGURE 7.41 Typical winter sea surface temperature departure from normal in °C during the Pacifi c Decadal Oscillation’s warm phase (a) and cool phase (b). (Source: JISAO, University of Washington, obtained via http://jisao.washington.edu/pdo. Used with permission of N. Mantua.)
SUMMARY
In this chapter, we examined a variety of atmospheric circulations. We looked at small-scale winds and found that eddies can form in a region of strong wind shear, especially in the vicinity of a jet stream. On a slightly larger scale, land and sea breezes blow in response to local pressure diff erences created by the uneven heat-ing and cooling rates of land and water. Monsoon winds change direction seasonally, while mountain and valley winds change direction daily.
A warm, dry wind that descends the eastern side of the Rocky Mountains is the chinook. Th e same type of wind in the Alps is the foehn. A warm, dry downslope wind that blows into southern California is the Santa Ana wind. Local intense heating of the surface can pro-duce small rotating winds, such as the dust devil, while
downdraft s in a thunderstorm are responsible for the desert haboob.
Th e largest pattern of winds that persists around the globe is called the general circulation. At the surface in both hemispheres, winds tend to blow from the east in the tropics, from the west in the middle latitudes, and from the east in polar regions. Where upper-level west-erly winds tend to concentrate into narrow bands, we fi nd jet streams. Th e annual shift ing of the major pres-sure systems and wind belts—northward in July and southward in January—strongly infl uences the annual precipitation of many regions.
Toward the end of the chapter we examined the in-teraction between the atmosphere and oceans. Here we found the interaction to be an ongoing process where
49331_07_ch7_p176-211.indd 20949331_07_ch7_p176-211.indd 209 15/11/10 11:31 AM15/11/10 11:31 AM
Copyright 2010 Cengage Learning. All Rights Reserved. May not be copied, scanned, or duplicated, in whole or in part. Due to electronic rights, some third party content may be suppressed from the eBook and/or eChapter(s). Editorial review has deemed that any suppressed content does not materially affect the overall learning experience. Cengage Learning reserves the right to remove additional content at any time if subsequent rights restrictions require it.

210 Chapter 7 Atmospheric Circulations
KEY TERMS
Th e following terms are listed (with page numbers) in the order they appear in the text. Defi ne each. Doing so will aid you in reviewing the material covered in this chapter.
scales of motion, 178microscale, 178mesoscale, 178macroscale, 178rotor, 180wind shear, 180clear air turbulence (CAT),
180thermal circulation, 182sea breeze, 182land breeze, 182monsoon wind system, 184valley breeze, 186
mountain breeze, 186katabatic wind, 187chinook wind, 188Santa Ana wind, 190haboob, 191dust devils (whirlwinds),
192general circulation of the
atmosphere, 193Hadley cell, 194doldrums, 194subtropical highs, 195trade winds, 195
intertropical convergence zone (ITCZ), 195
westerlies, 196polar front, 196subpolar low, 196polar easterlies, 197Bermuda high, 197Pacifi c high, 197Icelandic low, 197Aleutian low, 197Siberian high, 197jet stream, 200subtropical jet stream, 200
polar front jet stream, 200Gulf Stream, 202upwelling, 203El Niño, 205Southern Oscillation, 206ENSO, 206La Niña, 207teleconnections, 207North Atlantic Oscillation
(NAO), 207Arctic Oscillation (AO), 208Pacifi c Decadal Oscillation
(PDO), 208
QUESTIONS FOR REVIEW
1. Describe the various scales of motion and give an example of each.
2. What is wind shear and how does it relate to clear air turbu-lence?
3. Using a diagram, explain how a thermal circulation develops.
4. Why does a sea breeze blow from sea to land and a land breeze from land to sea?
5. (a) Briefl y explain how the monsoon wind system devel-ops over eastern and southern Asia.
(b) Why in India is the sum-mer monsoon wet and the winter monsoon dry?
6. Which wind will produce clouds: a valley breeze or a mountain breeze? Why?
7. What are katabatic winds? How do they form?
8. Explain why chinook winds are warm and dry.
9. (a) What is the primary source of warmth for a Santa Ana wind?
(b) What atmospheric condi-tions contribute to the devel-opment of a strong Santa Ana wind?
10. Describe how dust devils usu-ally form.
everything, in one way or another, seems to infl uence everything else. On a large scale, winds blowing over the surface of the water drive the major ocean currents; the oceans, in turn, release energy to the atmosphere, which helps to maintain the general circulation of winds.
When atmospheric circulation patterns change over the Tropical Pacifi c, and the trade winds weaken or reverse direction, warm tropical water is able to fl ow eastward toward South America where it chokes off up-welling and produces disastrous economic conditions. When the warm water extends over a vast area of the Tropical Pacifi c, the warming is called a major El Niño event, and the associated reversal of pressure over the Pacifi c Ocean is called the Southern Oscillation. Th e large-scale interaction between the atmosphere and the ocean during El Niño and the Southern Oscillation
(ENSO) aff ects global atmospheric circulation patterns. Th e sweeping winds aloft provide too much rain in some areas and not enough in others.
Over the Atlantic Ocean there is a reversal of air pressure called the North Atlantic Oscillation that infl u-ences weather in various regions of the world. Atmos-pheric pressure changes over the Arctic produce the Arctic Oscillation that causes winter weather patterns to change across the United States, Greenland, and Eu-rope. Over the northern central Pacifi c and along the west coast of North America there is a reversal of sur-face water temperature that occurs every 20 to 30 years, called the Pacifi c Decadal Oscillation (PDO). Studies now in progress are designed to determine how the in-terchange between atmosphere and ocean can produce such events.
49331_07_ch7_p176-211.indd 21049331_07_ch7_p176-211.indd 210 15/11/10 11:31 AM15/11/10 11:31 AM
Copyright 2010 Cengage Learning. All Rights Reserved. May not be copied, scanned, or duplicated, in whole or in part. Due to electronic rights, some third party content may be suppressed from the eBook and/or eChapter(s). Editorial review has deemed that any suppressed content does not materially affect the overall learning experience. Cengage Learning reserves the right to remove additional content at any time if subsequent rights restrictions require it.

Questions for Thought and Exploration 211
11. Draw a large circle. Now, place the major surface semi-permanent pressure systems and the wind belts of the world at their appropriate latitudes.
12. According to Fig. 7.24 (p. 195), most of the United States is located in what wind belt?
13. Explain how and why the aver-age surface pressure features shift from summer to winter.
14. Explain why summers along the West Coast of the United States tend to be dry, whereas along the East Coast summers tend to be wet.
15. How does the polar front infl u-ence the development of the polar front jet stream?
16. Why is the polar jet stream more strongly developed in winter?
17. Explain the relationship be-tween the general circulation of air and the circulation of ocean currents.
18. Describe how the winds along the west coast of North America produce upwelling.
19. (a) What is a major El Niño event?
(b) What happens to the sur-face pressure at opposite ends of the Pacifi c Ocean during the Southern Oscillation?
(c) Describe how an ENSO event may infl uence the weather in diff erent parts of the world.
20. What are the conditions over the tropical eastern and central Pacifi c Ocean during the phe-nomenon known as La Niña?
21. How does the positive phase of the Northern Atlantic Oscil-lation diff er from the negative phase?
22. During the negative cold phase of the Arctic Oscillation when Greenland is experiencing mild winters, what type of win-ters (cold or mild) is Northern Europe usually experiencing?
23. Describe the ocean surface temperatures associated with the Pacifi c Decadal Oscillation.
QUESTIONS FOR THOUGHT AND EXPLORATION
1. Suppose you are fi shing in a mountain stream during the early morning. Is the wind more likely to be blowing upstream or downstream? Explain why.
2. Why, in Antarctica, are winds on the high plateaus usually lighter than winds in steep, coastal valleys?
3. What atmospheric condi-tions must change so that the westerly fl owing polar front jet stream reverses direction and becomes an easterly fl owing jet stream?
4. Aft er a winter snowstorm, Cheyenne, Wyoming, reports a total snow accumulation of 48 cm (19 in.), while the
maximum depth in the sur-rounding countryside is only 28 cm (11 in.). If the storm’s in-tensity and duration were prac-tically the same for a radius of 50 km around Cheyenne, ex-plain why Cheyenne received so much more snow.
5. Th e prevailing winds in southern Florida are north-easterly. Knowing this, would you expect the strongest sea breezes to be along the east or west coast of southern Florida? What about the strongest land breezes?
6. Explain why icebergs tend to move at right angles to the direction of the wind.
7. Give two reasons why pilots would prefer to fl y in the core of a jet stream rather than just above or below it.
8. Why do the major ocean currents in the North Indian Ocean reverse direction be-tween summer and winter?
9. Explain why the surface water temperature along the north-ern California coast is warmer in winter than it is in summer.
10. Th e Coriolis force defl ects moving water to the right of its intended path in the Northern Hemisphere and to the left of its intended path in the South-ern Hemisphere. Why, then, does upwelling tend to occur along the western margin of continents in both hemi-spheres?
ONLINE RESOURCES
Log in to the CourseMate website at: www.cengagebrain.com to view the active fi gures and concept animations as noted in the text, as well as additional resources, including video exercises, practice quizzes, an interactive eBook, and more.
49331_07_ch7_p176-211.indd 21149331_07_ch7_p176-211.indd 211 15/11/10 11:31 AM15/11/10 11:31 AM
Copyright 2010 Cengage Learning. All Rights Reserved. May not be copied, scanned, or duplicated, in whole or in part. Due to electronic rights, some third party content may be suppressed from the eBook and/or eChapter(s). Editorial review has deemed that any suppressed content does not materially affect the overall learning experience. Cengage Learning reserves the right to remove additional content at any time if subsequent rights restrictions require it.