est-ce que les régimes amaigrissants font grossir · est-ce que les régimes amaigrissants font...
TRANSCRIPT

DPCP CHUV Lausanne, Oct
2013
Abdul G. Dulloo
Department of Medicine / PhysiologyUniversity of Fribourg
Switzerland
Est-ce que les régimes amaigrissants font
grossir
?

TraitementTraitement de de ll’’obobéésitsitéé
““ Eat less & Exercise more Eat less & Exercise more ””
Les conseils d’Hippocrate 400 BC
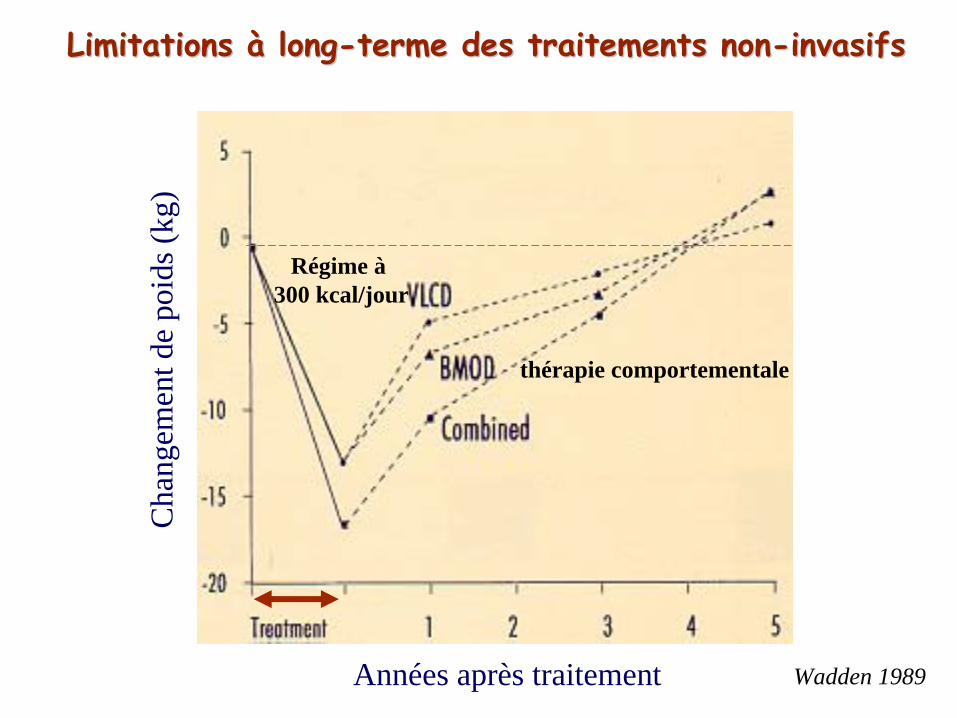
Limitations Limitations àà
longlong--termeterme
des des traitementstraitements
nonnon--invasifsinvasifs
Cha
ngem
entd
e po
ids(
kg)
thérapie comportementale
Régime à300 kcal/jour
Années après traitement Wadden 1989
Cha
nge
in w
eigh
t(kg
)
Years
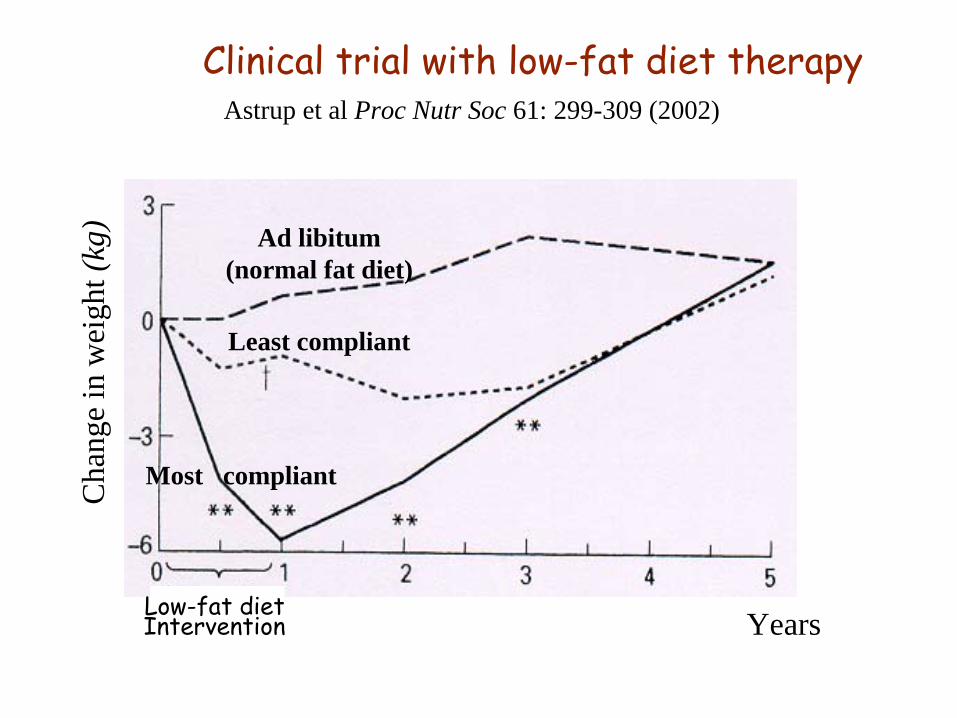
Ad libitum (normal fat diet)
Least compliant
Most compliant
Clinical trial with
low-fat diet
therapyAstrup et al Proc Nutr Soc 61: 299-309 (2002)
Low-fat diet
Intervention
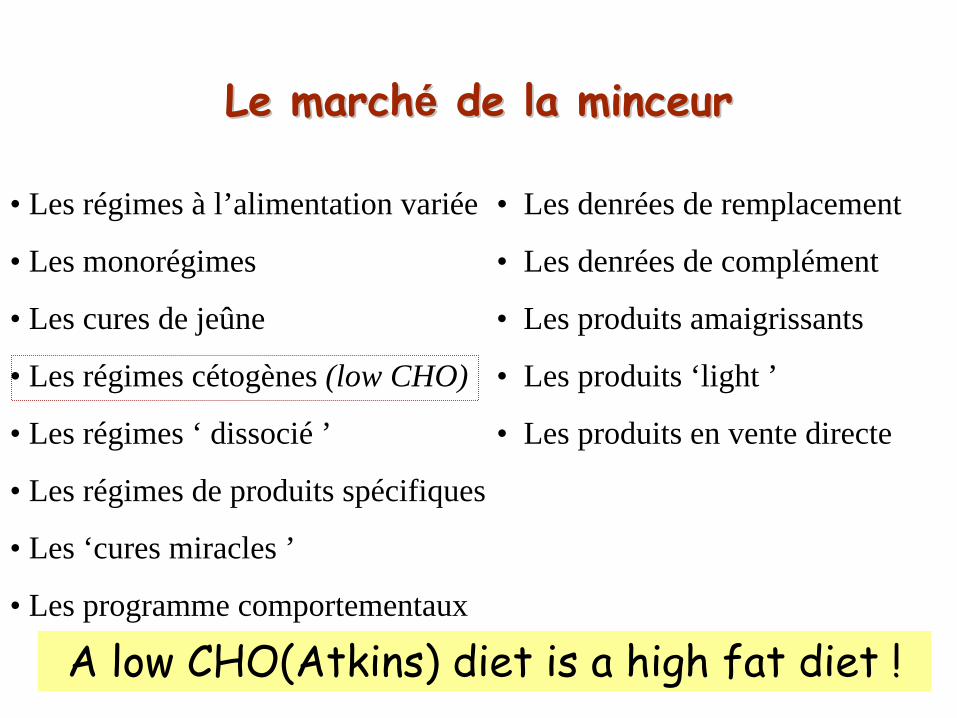
Le Le marchmarchéé
de la de la minceurminceur
• Les régimes à l’alimentation variée • Les denrées de remplacement
• Les monorégimes • Les denrées de complément
• Les cures de jeûne • Les produits amaigrissants
• Les régimes cétogènes (low CHO) • Les produits ‘light ’
• Les régimes ‘ dissocié ’ • Les produits en vente directe
• Les régimes de produits spécifiques
• Les ‘cures miracles ’
• Les programme comportementaux
A low
CHO(Atkins) diet
is
a high
fat diet
!

2003
(Low-moderate
fat)
(Atkins diet
/High fat )

Albert Stunkard (1958)
La plupart
des personnes
obèses
ne resteront
pas en traitement.
La plupart
de ceux
qui resteront
en traitement ne perdront
pas de poids.
La plupart
de ceux
qui réussiront
à
perdre du poids, reprendront
ce
poids.
TraitementTraitement de de ll’’obobéésitsitééFacts

Counter-acting factors(Psychological & Metabolic)
Spontaneous weight setting
Maintenance
Restoration
Rebound
Constraint-ve energy balance
Relaxingor Escape
Evolution of body weight in response to dieting Evolution of body weight in response to dieting (Adapted from Guy(Adapted from Guy--Grand, 1988)Grand, 1988)
New weight setting
Weight
(Fat) overshoot
?
hunger driveslowed metabolism
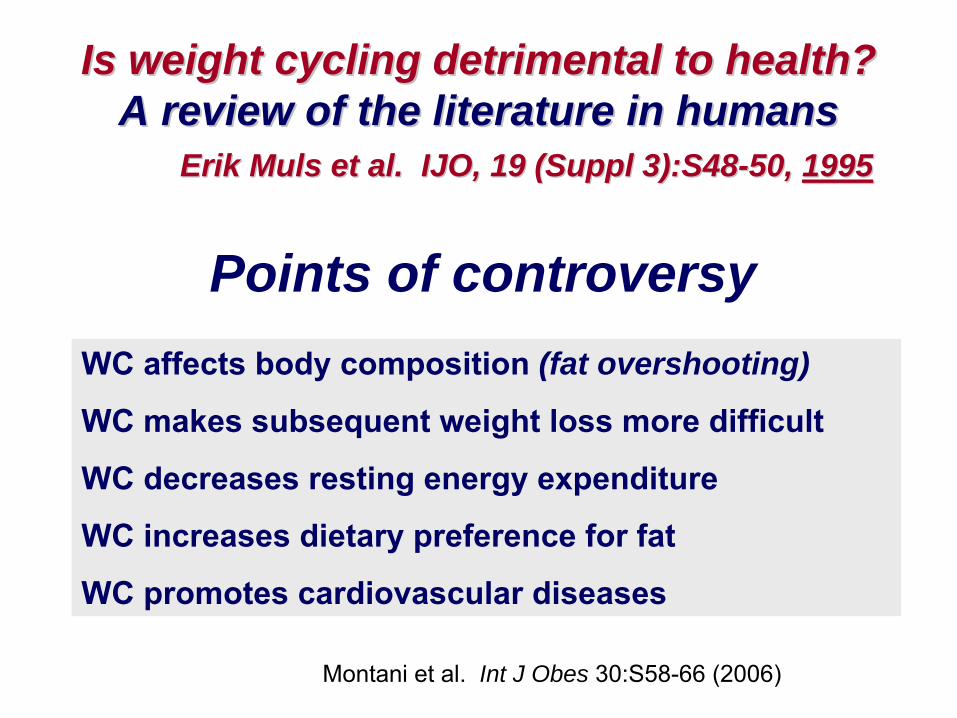
Is weight cycling detrimental to health? Is weight cycling detrimental to health? A review of the literature in humansA review of the literature in humans
Erik Erik MulsMuls et al. IJO, 19 (et al. IJO, 19 (SupplSuppl 3):S483):S48--50, 50, 19951995
WC affects body composition (fat overshooting)
WC makes subsequent weight loss more difficult
WC decreases resting energy expenditure
WC increases dietary preference for fat
WC promotes cardiovascular diseases
Points of controversy
Montani
et al. Int J Obes 30:S58-66 (2006)
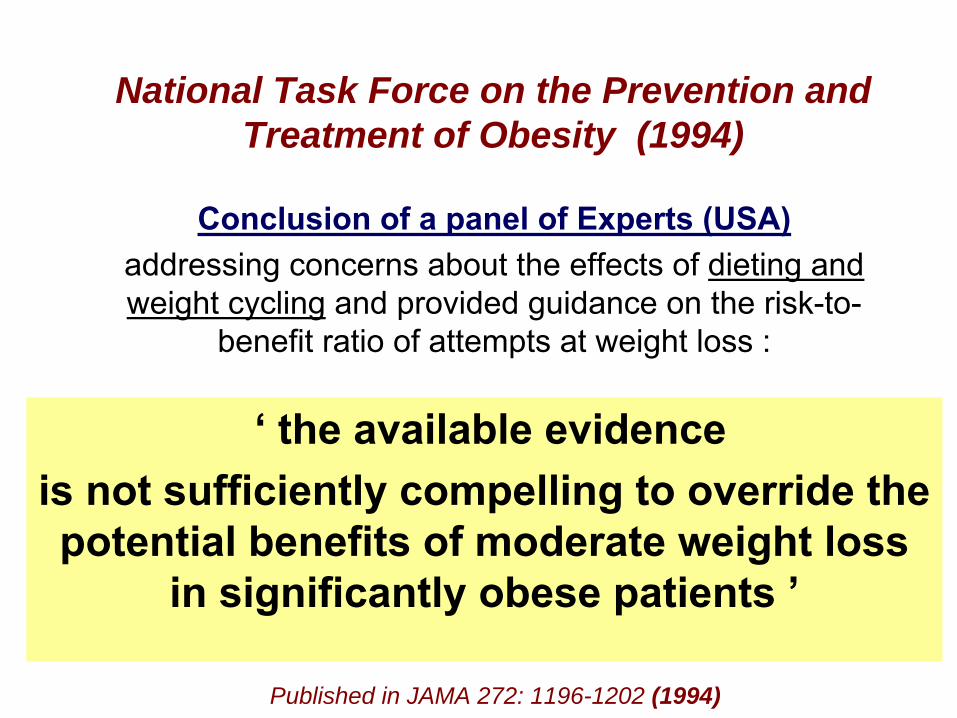
National Task Force on the Prevention and Treatment of Obesity (1994)
Conclusion of a panel of Experts (USA)addressing concerns about the effects of dieting and weight cycling
and provided guidance on the risk-to-
benefit ratio of attempts at weight loss :
‘
the available evidence is not sufficiently compelling to override the potential benefits of moderate weight loss
in significantly obese patients ’
Published in JAMA 272: 1196-1202 (1994)

DefinitionDieting
(e.g., self-reported
weight
loss
dieting
in the past
year) Dietary
restraint
(e.g., the Cognitive Restraint
scale
from
the Three-Factor Eating
Questionnaire)
•
Prospective studies
reviewed25 prospective studies
containing
40 relevant comparisons. Only
non-obese participants (mean
BMI between
18.5 and 30) and averaged
at
least 12 years
old.
Results•
Neither
Dieting
nor
restrained
eating
predicted
future weight
loss. •
15 of the 20 comparisons
(75%) that
examined
measures
of dieting
significantly
predicted
future weight
gain•
only
1 of 20 (5%) that
examined
restrained
eating
measures
did
so.
Two
plausible explanations(1) Dieters
and restrained
eaters
do not differ
in terms
of an underlying
proneness
toward
weight
gain, but restrained
eating
represents
a more effective means
of preventing
it; and
(2) normal weight
individuals
who
diet
do so
because
they
are resisting
a powerful
predisposition
toward
weight
gain which
dieting
ultimately
fails
to prevent.
Dieting
and restrained
eating
as prospective predictors of weight
gain
Lowe et al. Frontiers in Psychology (sept 2013)

Conclusions• Dieters may be more prone to future weight gain
• Dieters have a genetic propensity for obesity
•
Dieting per se may promote subsequent weight gain, independent of genetic factors, in an essentially normal-
weight cohort (90% of normal weight as adolescents)
Design Association between dieting & weight gain in 4129 individual twins whose weight & height were obtained from longitudinal surveys at 16, 17, 18 and 25 years & examined in relation to the number of lifetime intentional weight loss (IWL) episodes of > 5 kg at 25 yrs
Does
dieting
make
you
fat? A twin
studyPietiläinen
et al. Int J Obes 2012;36:456-64

Gain in BMI from 16 to 25 years by lifetime Intentional Weight Loss (IWL) frequency
& baseline BMI percentile at 16 yrs Pietiläinen
et al. Int J Obesity (2012) 36,
456–464
Lower normal BMI
Higher Normal BMI
Dieting promote subsequent weight gain to a greater extent in those initially normal weight
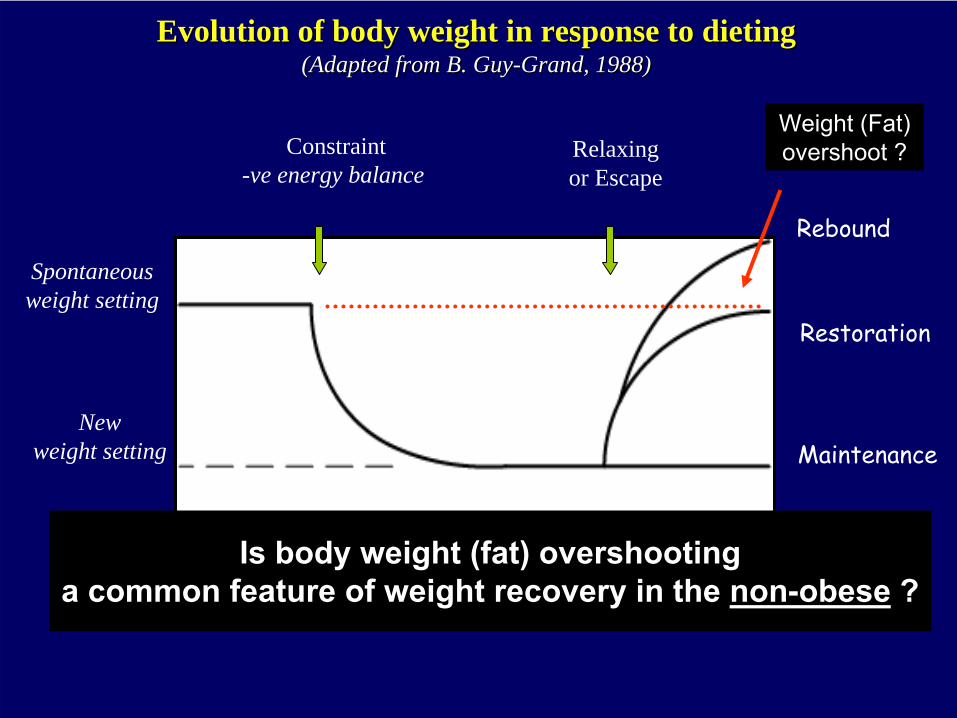
Counter-acting factors(metabolic and psychological)
Spontaneous weight setting
Maintenance
Restoration
Rebound
Constraint-ve energy balance
Relaxingor Escape
Evolution of body weight in response to dietingEvolution of body weight in response to dieting(Adapted from B. Guy(Adapted from B. Guy--Grand, 1988)Grand, 1988)
New weight setting
Weight
(Fat) overshoot
?
Is body weight
(fat) overshooting a common
feature
of weight
recovery
in the non-obese
?

Body weight(kg)
Semistarvation Refeeding
Energy intakeEnergy intake (kcal/d x 1000 )
Minnesota ExperimentMinnesota Experiment(Keys et al. 1950)(Keys et al. 1950)
3.3 kg of
wt
overshoot
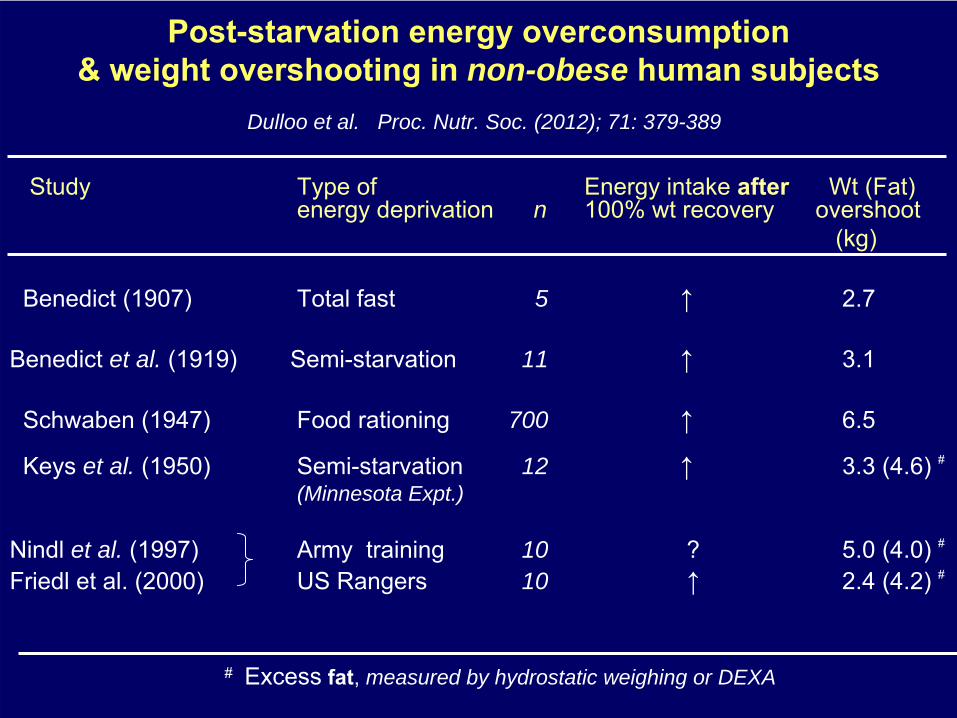
Post-starvation
energy
overconsumption & weight
overshooting
in non-obese human
subjects
Study
Type of Energy
intake
after
Wt
(Fat) energy
deprivation
n 100% wt
recovery
overshoot
(kg)
Benedict (1907)
Total fast
5 ↑
2.7
Benedict et al. (1919)
Semi-starvation
11 ↑
3.1
Schwaben (1947) Food rationing
700 ↑
6.5
Keys
et al. (1950) Semi-starvation
12 ↑
3.3 (4.6) #
(Minnesota Expt.)
Nindl
et al. (1997)
Army
training 10 ? 5.0 (4.0) #
Friedl
et al. (2000) US Rangers
10 ↑
2.4 (4.2) #
#
Excess
fat, measured by hydrostatic weighing or DEXA
Dulloo et al. Proc. Nutr. Soc. (2012); 71: 379-389

Post-starvation caloric
overcompensation
& fat overshooting
:
what could be driving it ?
•
Feedback signals
from
adipose tissue stores (sensing fat depletion) on food
intake
!
but caloric overcompensation is persisting well after 100% recovery of body fat
•
Psychobiological
response
to food
deprivation
?
•
Feedback signals
from
lean
tissue (sensing lean tissue depletion) on appetite
control ?
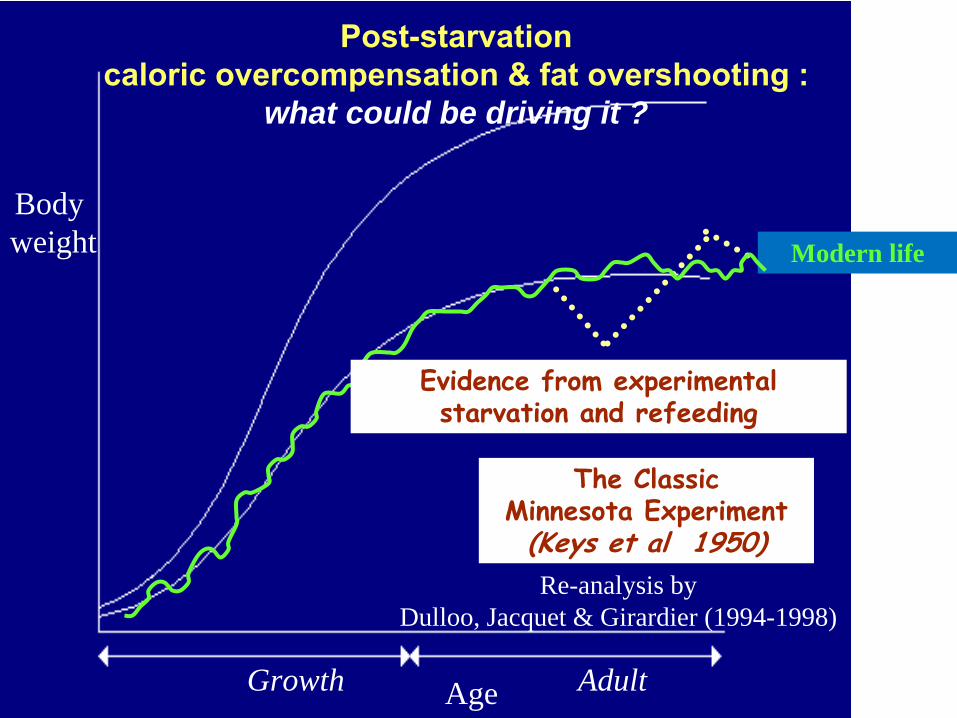
AgeGrowth Adult
Body weight Modern life
Evidence from
experimental starvation
and refeeding
The Classic Minnesota Experiment
(Keys et al 1950)Re-analysis by
Dulloo, Jacquet & Girardier (1994-1998)
Post-starvation caloric
overcompensation
& fat overshooting
:
what could be driving it ?

The Minnesota Experiment (directed by Ancel Keys )
Aim: 1944: Quantitative information for relief program rehabilitating starvation victims of World War II
Subjects: Caucasians-Americans (conscientious objectors of war, priests) 34 out of 100 volunteers were selected
Selection : On basis of physical, biochemical, criteria physiological, psychological examinations
Site of study: Under the University Memorial Stadium (Gate 27)

Bodyweight
Control Semistarvation
Refeeding
Refeedingperiod restricted ad libitum
Weeks Weeks No hyperphagia Low fat intake 20% by energy
Food intake ++++++++++++++++++++++++++++++++++++++++++++++++BMR + + + + + + +Body composition + + + + +
Hyperphagia High fat intake 35% by energy
Design of the Minnesota ExperimentDesign of the Minnesota Experiment (Keys et al. 1950)(Keys et al. 1950)
n = 32 (normal weight healthy men)
Weight
loss: 25-29%
2650 MJ/ d
3000 MJ/ d
3350 MJ/ d
2300 kcal/d
3500 kcal/d
1500-1700 kcal/d
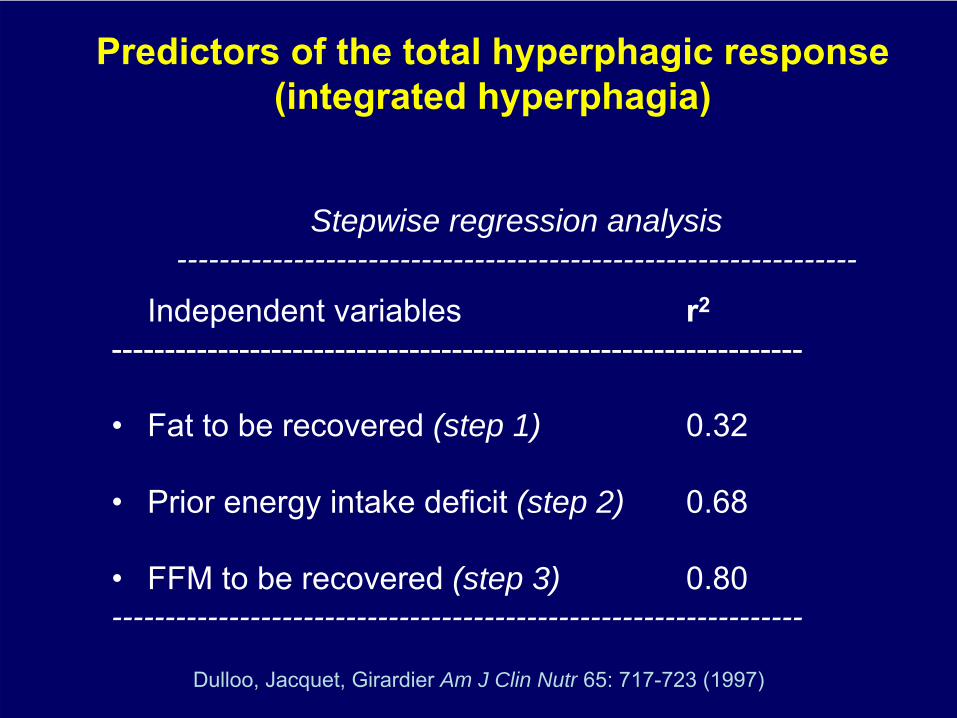
Predictors
of the total hyperphagic
response (integrated
hyperphagia)
Independent variables
r2
-----------------------------------------------------------------
•
Fat to be
recovered
(step 1) 0.32
•
Prior energy
intake
deficit
(step 2) 0.68
•
FFM to be
recovered
(step 3) 0.80-----------------------------------------------------------------
Stepwise regression analysis ----------------------------------------------------------------
Dulloo, Jacquet, Girardier
Am J Clin Nutr 65: 717-723 (1997)

Pattern of changes fat mass & FFM in Minnesota Experiment (Dulloo, Jacquet, Girardier
Am J Clin Nutr 65: 717-723 (1997)
Fat massFFM
% Control values
% Control values
Catch-up fat in part driven
by
suppressed
thermogenesis
?
Recovery
rate Fat > FFM, even
before
hyperphagia

Body weight(kg)
Semistarvation Refeeding
Energy intakeEnergy intake(kcal/d x 1000 )
20100
-10-
20
Suppressed Suppressed ThermogenesisThermogenesis (
adjusted BMR
% initial BMR% initial BMR)
‘‘Minnesota ExperimentMinnesota Experiment’’ Revisited Revisited Adapted from Dulloo, Girardier & Jacquet (IJO 1996), AJCN 1998)
-10% - 20%
-10%
- 25%
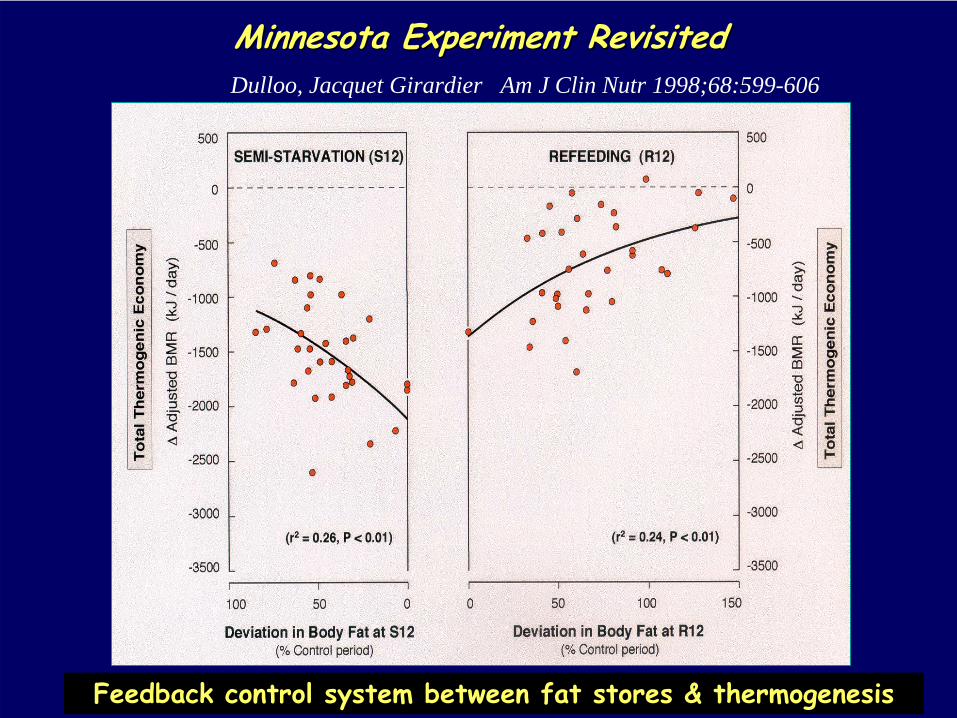
Minnesota Experiment RevisitedMinnesota Experiment RevisitedDulloo, Jacquet Girardier Am J Clin Nutr 1998;68:599-606
Feedback control system between
fat stores & thermogenesis

Concept of dual-adaptive thermogenesisDulloo et al. Int J Obesity 25 (Suppl. 5):S22-S29. (2001)
Leptin-SNS- Thyroid
axis
Starvation Refeeding
Energy
intake
Non-specificThermogenesis
adipose-specificThermogenesis
Suppressed
thermogenesis specific
for 'catch-up fat'
50% 100%
Body fat(% initial value)
Thermogenesis
(Down) (Down)
100% 50% 0%

40
60
2200
2600
2000
7 14 210Semi
starvation Refeeding
Days
of refeeding
RefedControl
** **
5
25
45
Body fat(g)
Body protein (g)
Energy intake(kJ wk-1 )
Energyexpenditure
(kJ wk-1)
***
****
1200Suppressed
thermogenesis
specific
for 'catch-up fat'
catch-up fat
Catch-up
fat
resulting
only
from
suppressed
thermogenesis: a rat model
Adapted from Dulloo et al.(1991)

Suppressed Suppressed thermogenesisthermogenesis
favouringfavouring
catchcatch--up fat up fat (on a low(on a low--fat diet): fat diet): Glucose redistributionGlucose redistribution
Adiposetissue
Skeletal muscle
Fat
Thermogenesis
Decreased Glucose utilisationIncreased Glucose
utilisation for lipogenesis catch-up fat
HyperinsulinemiaInsulin
Hyperresponsiveness
Insulin resistance
Euglycemia
Adipostat
Signal(s) ?
↑
AdipogenesisLimits
adipocyte hypertrophy(Summermatter et al. Diabetes 2011)
(Marcelino et al. Diabetes 2012)
↓ PI3K activity(Summermatter et al. FASEB J (2008)
↓
Subsarcolemmal mitochondria(Crescenzo et al. Diabetes (2006)
↓
Muscle relaxation time

Pattern of changes fat mass & FFM in Minnesota Experiment (Dulloo, Jacquet, Girardier
Am J Clin Nutr 65: 717-723 (1997)
Fat massFFM
% Control values
% Control values
Catch-up fat in part driven
by
suppressed
thermogenesis
Recovery
rate Fat > FFM, even
before
hyperphagia
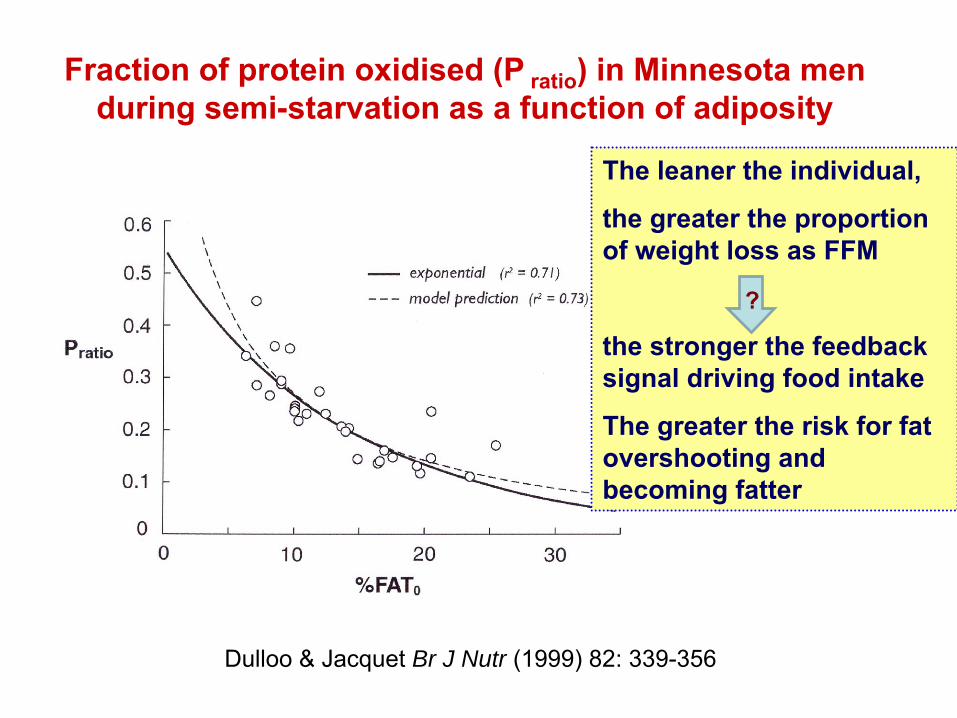
Fraction of protein
oxidised
(P
ratio
) in Minnesota men during
semi-starvation
as a function
of adiposity
Dulloo
& Jacquet Br J Nutr (1999) 82: 339-356
The leaner
the individual,
the greater
the proportion of weight
loss
as FFM
the stronger
the feedback signal driving
food
intake
The greater
the risk
for fat overshooting
and
becoming
fatter
?

y = 88.514x-1.1577
R2 = 0.4759
0.0
2.0
4.0
6.0
8.0
10.0
12.0
5.0 10.0 15.0 20.0 25.0 30.0
Initial % body fat
Fat O
vers
hoot
(kg)
r = 0.70
♦
Minnesota Experiment
◊
Army
Ranger Experiments
◊◊
Dulloo
et al. Proc Nutr Soc (2012);71:379-389
Inverse relationship
between
post-caloric
restriction fat overshooting
and initial adiposity
The leaner
the individual
before
caloric
restriction,
the greater
the fat overshot
after
weight
regain
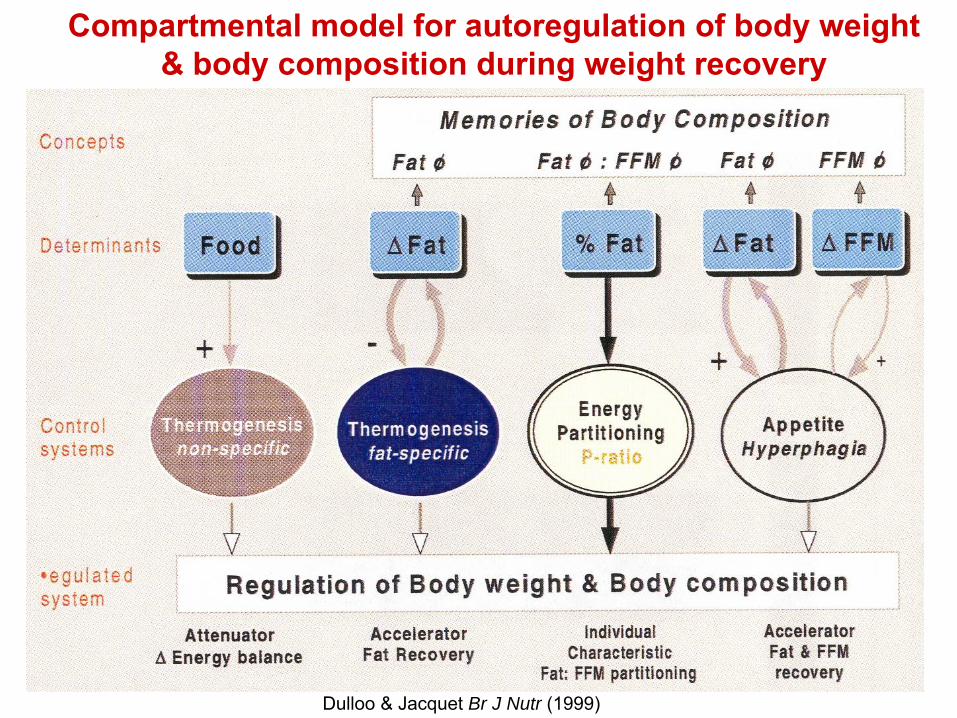
Compartmental
model for autoregulation
of body weight & body composition during
weight
recovery
Dulloo
& Jacquet Br J Nutr (1999)
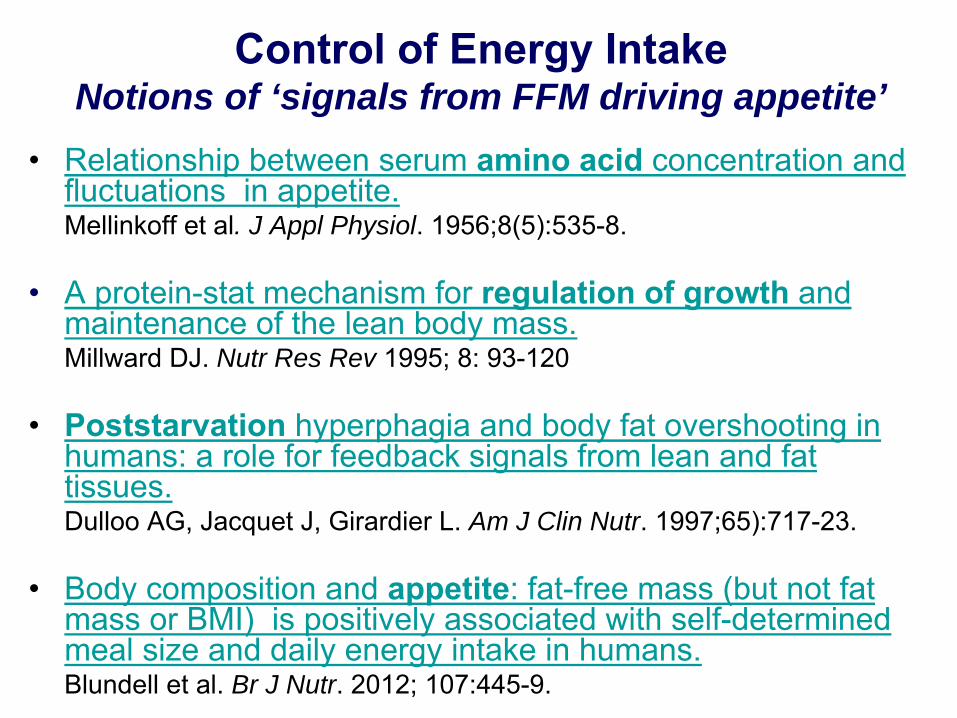
Control of Energy
Intake Notions of ‘signals from FFM driving appetite’
•
Relationship between
serum
amino
acid
concentration and fluctuations in appetite.Mellinkoff
et al. J Appl Physiol. 1956;8(5):535-8.
•
A protein-stat mechanism
for regulation
of growth
and maintenance of the lean
body mass.
Millward
DJ. Nutr Res Rev 1995; 8: 93-120
•
Poststarvation
hyperphagia
and body fat overshooting
in humans: a role
for feedback signals
from
lean
and fat
tissues.Dulloo
AG, Jacquet J, Girardier
L. Am J Clin Nutr. 1997;65):717-23.
•
Body composition and appetite: fat-free mass (but not fat mass or BMI) is
positively
associated
with
self-determined
meal
size and daily
energy
intake
in humans.Blundell et al. Br J Nutr. 2012; 107:445-9.
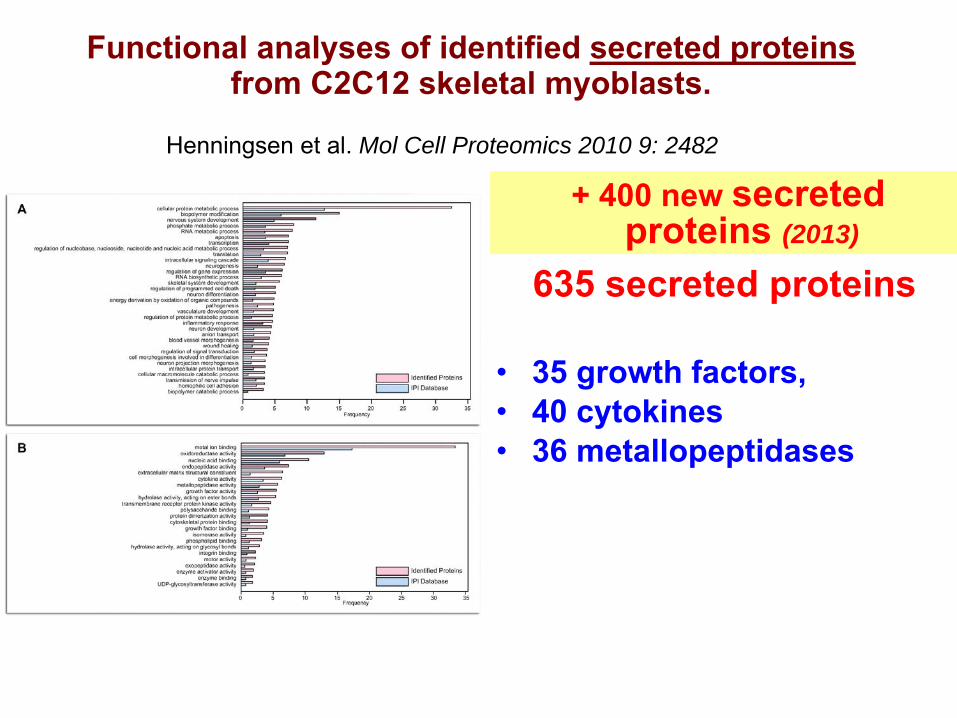
Functional analyses of identified secreted proteins from C2C12 skeletal myoblasts.
Henningsen
et al. Mol Cell Proteomics 2010 9: 2482
635 secreted
proteins
•
35 growth
factors, •
40 cytokines
•
36 metallopeptidases
+ 400 new secreted proteins
(2013)

How dieting makes some fatter ..? Dulloo
et al.
Proc Nutr Soc (2012) 71:379-389
•
A common
feature
of weight
regain in non-obese
•
A consequence
of differential
rates of protein
vs fat repletion
(which can be faster as a result of suppressed
thermogenesis specific for fat stores replenishment)
•
Non-obese individuals
are more likely
to deplete
protein and fat mass (as % of initial levels) –
and hence
trigger
feedback signals
from
fat and lean
tissues that
operate on food
intake
and thermogenesis.
•
To-date, these
feedback signals
(adipostats
and protein- stats
remain
undefined)
Fat overshooting
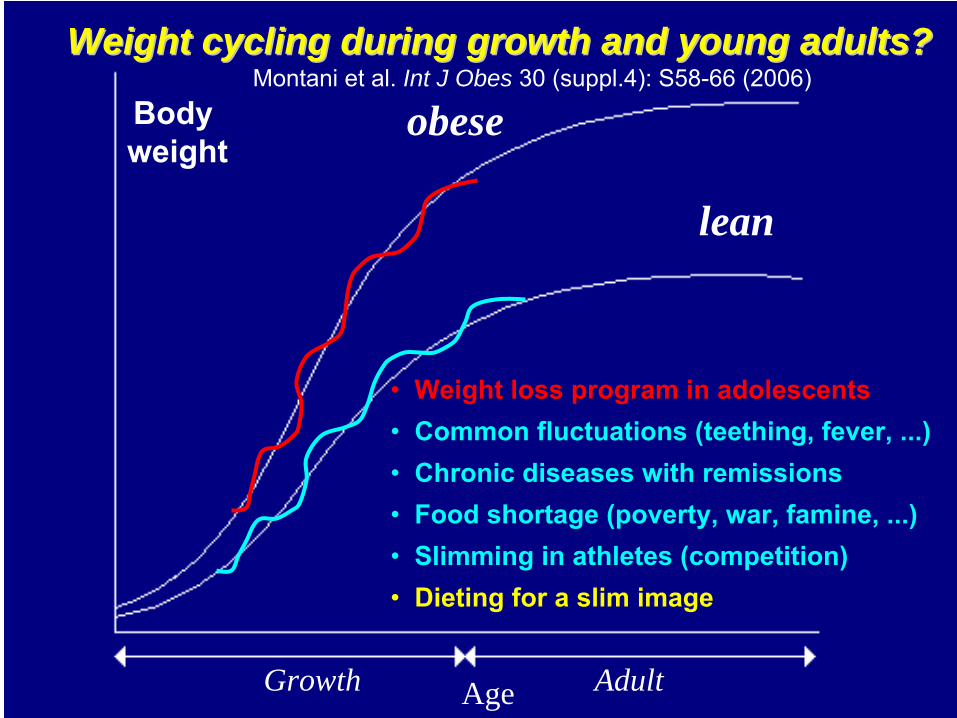
AgeGrowth Adult
Body weight
obese
lean
Weight cycling during growth and young adults?Weight cycling during growth and young adults?
• Weight loss program in adolescents• Common fluctuations (teething, fever, ...) • Chronic diseases with remissions• Food shortage (poverty, war, famine, ...)• Slimming in athletes (competition)• Dieting for a slim image
Montani
et al. Int J Obes 30 (suppl.4): S58-66 (2006)

Comparison
with
media models
Underweight
Normal
Overweight
Obese
Body Mass Index (BMI) From
Dittmar
(2006)
Body dissatisfaction Unhealthy
body-shaping
behaviours
(vomiting, pills, smoking)

Girls prevalence (%)
BoysPrevalence
(%)
USA 56 28Canada 53 22Belgium 40 14Estonia 49 15Finland 45 10Greece 60 34Latvia 45 22Poland 54 19
Prevalence
of weight
control behaviour
during
last 12 months
in
non-overweight
adolescents
Ojala
et al. Int J Behav Nutr Phys Act (2007) 4: 50.

1990’s‘Hales & Barker’ theory
Developmental Origins of Health and Disease
Maternal stress Infection, Undernutrition
Placental dysfunction Smoking, Alcohol
Small babies Large babies
Gestational diabetes
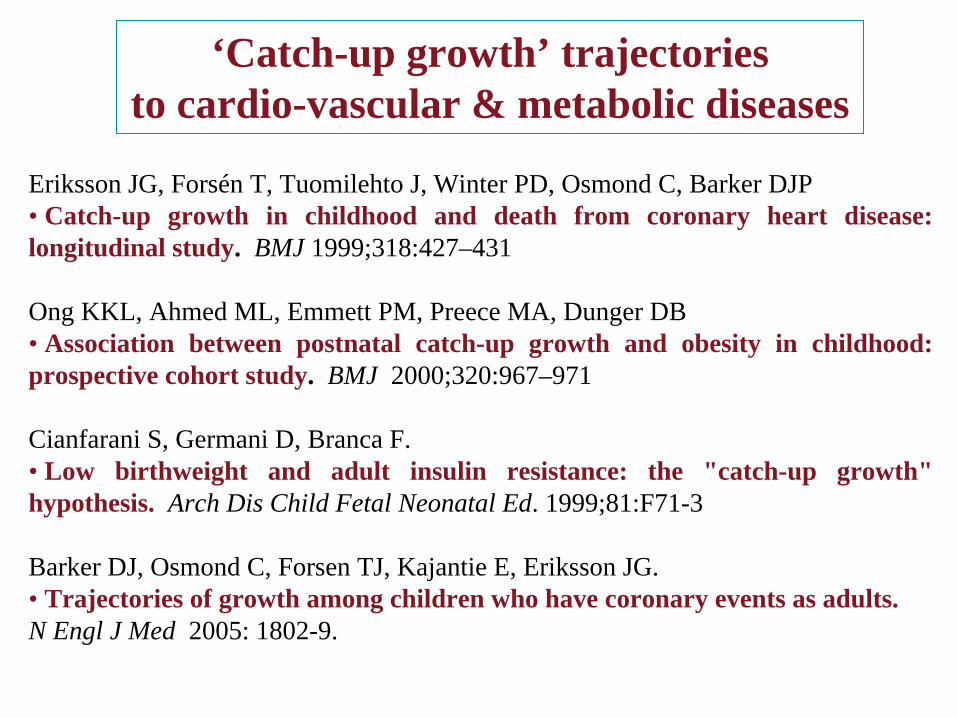
‘Catch-up growth’ trajectories to cardio-vascular & metabolic diseases
Eriksson JG, Forsén T, Tuomilehto J, Winter PD, Osmond C, Barker DJP• Catch-up growth in childhood and death from coronary heart disease: longitudinal study. BMJ 1999;318:427–431
Ong KKL, Ahmed ML, Emmett PM, Preece MA, Dunger DB• Association between postnatal catch-up growth and obesity in childhood: prospective cohort study. BMJ 2000;320:967–971
Cianfarani S, Germani D, Branca F.• Low birthweight and adult insulin resistance: the "catch-up growth" hypothesis. Arch Dis Child Fetal Neonatal Ed. 1999;81:F71-3
Barker DJ, Osmond C, Forsen TJ, Kajantie E, Eriksson JG. • Trajectories of growth among children who have coronary events as adults. N Engl J Med 2005: 1802-9.

catchcatch--upup of linear growthof linear growth
CatchCatch--up growthup growth
State of hyperinsulinemia
ThinThin--short short babies/infants babies/infants
Later CV &Later CV &metabolic diseasesmetabolic diseases
catchcatch--upup of fat tissue of fat tissue catchcatch--upup of lean tissue of lean tissue
Dulloo AG, Jacquet J, Montani JP. Pathways from weight fluctuations to metabolic diseases: focus on maladaptive thermogenesis during catch-up fat.
Int J Obes Relat Metab Disord 2002; 26 (Suppl 2):S46-57

2
3
4
2 3 4
○●
●○○
●
10
12
□■
□
□
■
■
9
11
(Small for gestational
age, n=29)
AGA
SGAAGA
Lean
mas
s (k
g)Fa
t mas
s (k
g)
Age (yrs)
The 1st
longitudinal study
of body composition (by DEXA scanning) in human
infants born
small
for gestational
age
(SGA)
0.20
0.25□■
□□
■
■ SGA
Fat
mas
s/lean
mas
s ra
tio
0.30
AGA Figure built from a reanalysis of raw data derived from Ibanez et al. JCEM (2006) and published in:
Dulloo et al. Int J Obesity 30 (suppl. 4): S23-S35 (2006)
(Appropriate
for gestational
age, n= 22))
Infants born
small
show hyperinsulinemia
& lower
insulin
sensitivity
(HOMA index)
SGA
But also preferential catch-up fat
Ibanez et al. JCEM (2006)

AgeGrowth Adult
Body
wei
ght
thin/short at
birth
Increased risks for later obesity, type 2 diabetes,
CV diseases+ Catch-up growth
obese
lean
Impaired
growth during
infancy
and childhood
Dietary
restraint/weight
cyclingBMI <30 Higher CV
risks,
Higher
obesity risks
Unintentional
weight
loss/recovery
Dulloo et al. Int J Obesity 30 (suppl. 4): S23-S35 (2006)
Large epidemiological studies
Catch-up fat
Catch-up fat
From From weightfluctuationsweightfluctuations to obesity & chronic metabolic diseasesto obesity & chronic metabolic diseases

From Fernandez_Twinn & Ozanne. Physiol Behav (2006)Adapted from Hales & Barker Br Med Bull (2001)
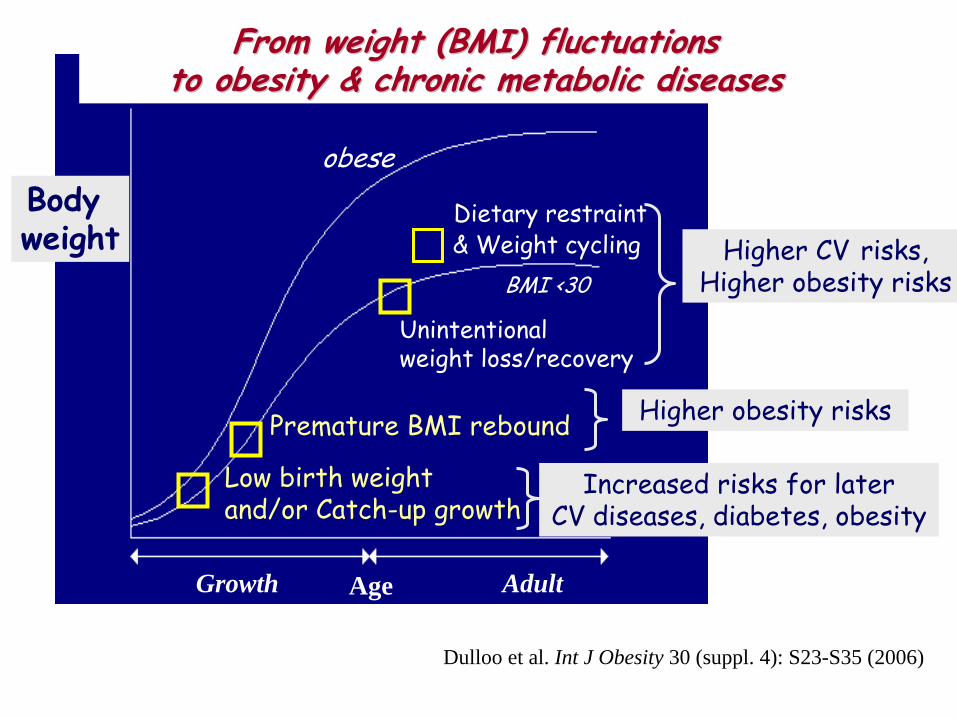
AgeGrowth Adult
Body weight
From weight (BMI) fluctuations From weight (BMI) fluctuations to obesity & chronic metabolic diseasesto obesity & chronic metabolic diseases
Low
birth
weight and/or Catch-up growth
Unintentional weight
loss/recovery
Dietary
restraint & Weight
cycling
BMI <30Higher CV
risks,
Higher
obesity
risks
Increased risks for laterCV diseases, diabetes, obesity
obese
Higher
obesity
risksPremature
BMI rebound
Dulloo et al. Int J Obesity 30 (suppl. 4): S23-S35 (2006)