estabilidad financiera 05/2012 n.º 22 - bde.es · Índice comparing risk-weighted assets: the...
TRANSCRIPT

ESTABILIDAD FINANCIERA
N.º 22
05/2012


ESTABILIDAD FINANCIERA MAYO 2012


ESTABILIDAD FINANCIERA MAYO 2012
Número 22
Se permite la reproducción para fines docentes
o sin ánimo de lucro, siempre que se cite la fuente.
© Banco de España, Madrid, 2012
© Autores colaboradores externos:
Óscar Arce
Gerald A. Edwards Jr.
Nick Greenwood
Anna Ispierto
Alejandra Kindelán
Rosario Martín
ISSN: 1579-3621 (edición electrónica)
ESTABILIDAD FINANCIERA es una revista semestral que tiene como
objetivo servir de plataforma de comunicación y diálogo sobre cualquier aspecto
relativo a la estabilidad financiera, con especial dedicación a las cuestiones
de regulación y supervisión prudenciales.
ESTABILIDAD FINANCIERA es una publicación abierta, en la que, junto
a contenidos institucionales, tienen cabida colaboraciones personales
de investigadores y profesionales del sector financiero, que serán sometidas
a un proceso de evaluación anónima. Los trabajos y comentarios sobre la revista
deberán enviarse a la dirección de correo electrónico ([email protected]).
Consejo Editorial de ESTABILIDAD FINANCIERA: Javier Aríztegui (Banco de España),
Santiago Carbó (Universidad de Granada), Gonzalo Gil,
Rafael Repullo (CEMFI), José María Roldán (Banco de España),
Vicente Salas (Universidad de Zaragoza) y Julio Segura (CNMV).
Secretario del Consejo: Ricardo Fernández (Banco de España).
Los artículos firmados son responsabilidad exclusiva
de sus autores y no reflejan necesariamente la opinión
del Banco de España.

ÍNDICE
Comparing risk-weighted assets: the importance of supervisory validation processes 9
José María Arroyo, Ignacio Colomer, Raúl García-Baena and Luis González-Mosquera
An overview of the independent commission on banking reforms – motivations, measures
and likely impact 31
Alejandra Kindelán and Nick Greenwood
FSB transparency initiatives 53
Gerald A. Edwards Jr.
Hacia mercados secundarios de titulización líquidos y eficientes 75
Óscar Arce, Anna Ispierto y Rosario Martín
Business models of international banks in the wake of the 2007-2009 global financial crisis 97
Manuel Merck, Adrian van Rixtel and Emiliano González Mota
Identificación y evolución de los ciclos de crédito en las economías avanzadas 123
Rebeca Anguren Martín

.

(*) José María Arroyo, Ignacio Colomer, Raúl García-Baena and Luis González-Mosquera belong to the Directorate
General Banking Supervision of the Banco de España. The authors acknowledge the valuable comments and
suggestions made by Jorge Martínez, Rafael Repullo and Fernando Vargas. This article has also benefitted from
contributions and discussions in previous related works by Jaime Esteban, M.ª Jesús Lobato and Esther Moral. This
article is the exclusive responsibility of the authors and does not necessarily reflect the opinion of the Banco de España.
José María Arroyo, Ignacio Colomer, Raúl García-Baena and Luis González-Mosquera (*)
COMPARING RISK-WEIGHTED ASSETS: THE IMPORTANCE OF SUPERVISORY
VALIDATION PROCESSES


BANCO DE ESPAÑA 11 ESTABILIDAD FINANCIERA, NÚM. 22
COMPARING RISK-WEIGHTED ASSETS: THE IMPORTANCE OF SUPERVISORY
VALIDATION PROCESSES
This article analyses the problems of using the risk-weighted assets (RWA) density ratio
– defined as the ratio of RWA to total assets – to make comparisons across banks, as is
frequently done by banks themselves and analysts. An international comparison is made of
16 European banks, based on public information, from which it is concluded that a significant
part of the differences in RWA density are a consequence of differences in the type of
business involved. In particular, the greater the weight of credit risk in a bank’s balance
sheet the higher will be its RWA density. We propose alternative RWA density ratios and
illustrate them with the results for Spanish banks using confidential data. We show that
public information cannot be sufficiently detailed to enable differences across banks arising
from their risk profiles to be distinguished from others attributable, for example, to different
interpretations of solvency rules by banks or supervisors. Therefore, the supervisory review
process and the progress in its inter-jurisdictional harmonisation are especially important.
The paper concludes with a review of the process used by the Banco de España for the
supervisory validation of Internal Ratings Based (IRB) approaches for credit risk.
The recent crisis and the discussions on Basel III have focused attention on the need to
improve the quality of banks’ capital and to increase their capital ratios, relegating some
of the objectives of Basel II to the background. However, in our view an appropriate
combination of Basel II and III is a necessary condition for avoiding future crises.
It is worth briefly reviewing the transition from Basel I (1988) to Basel III (2010), through
Basel II (2004), to understand what the current situation is and to reflect on what it should
be. Basel I managed to establish minimum solvency requirements at the international
level and a level playing field that did not previously exist. The requirements took the form
of a minimum solvency ratio of 8%, the result of dividing eligible capital by the so-called
risk-weighted assets (RWA).1 However, their lack of sensitivity to risk led to regulatory
arbitrage2, which is why Basel II focused on improving the calculation of the risk to which
banks are exposed, i.e. the denominator of the solvency ratio (RWA), on the assumption
that the system’s capital was appropriate. Indeed, Basel II was calibrated so that this level
of capital would not vary for the system as a whole. The experience following the
implementation of Basel I appeared to support the view that this volume of capital was
sufficient to withstand potential crises.
The full emphasis of Basel II was placed on providing incentives to enhance banks’ risk
management under the premise that capital can never be a substitute for good management
and appropriate risk control. The aim was to draw regulatory capital closer to economic
capital with more risk-sensitive capital requirements calculation systems, including the
use of internal models.3 Unfortunately, just as Basel II (2007-2008) was entering into force,
1 Introduction
1 RWA were the result of multiplying exposures by weighting coefficients. One of the following four weighting
factors was applied to each type of exposure: 0%, 20%, 50% or 100%. Thus, for example, public debt issued
by sovereign States would be weighted at 0% if they belonged to the OECD, and a weight of 100% would be
applied to corporate and retail exposures (except mortgages, which would be weighted at 50%).
2 The difference between regulatory capital and economic capital encouraged banks to take lower-risk exposures
off their balance sheets.
3 In the specific case of credit risk, Basel II envisages two alternatives for calculating minimum capital requirements.
The first is the standardised approach which, using external ratings and extending the number of weightings,
allows for better assessment of borrower creditworthiness than Basel I. The other method, the Internal Ratings
Based approach, draws as its name suggests on the use of internal ratings.

BANCO DE ESPAÑA 12 ESTABILIDAD FINANCIERA, NÚM. 22
the biggest financial crisis of recent history broke. Clearly, this had little to do with Basel II;
rather, it was the result of what Basel II was seeking to correct, i.e. the poor assessment
and management of the risks to which banks were exposed. The crisis highlighted the fact
that there was a lack of high quality capital. All these developments speeded up the
preparation of Basel III, this time under the premise that it was necessary to require more
capital and of better quality, and that trading book requirements had to be tightened so
that the system was better prepared for future crises.
Crises almost always start on the side of the solvency ratio denominator (RWA), i.e. due to
inappropriate risk management and measurement. In this crisis a major role was played by
the pressure on banks to attain high returns. Such returns were relatively unsustainable
over the long run and, in many cases, were achieved with products which, under a halo of
“financial innovation”, offered a very high return/risk ratio as a result of the inappropriate
valuation of their risks and, therefore, of their price. The denominator is the most complex
part of the solvency ratio, posing most calculation difficulties (it must reflect the risks to
which a bank is exposed), and the most costly to supervise.
In short, Basel II focused on the denominator of the solvency ratio, seeking to have capital
requirements that reflect more accurately the risks taken by banks (for more risk, more
capital). Basel III changes none of the foregoing, simply adding to it; but, by focusing on
the numerator of the ratio, it may give the impression that Basel II has been superseded
and that it suffices to have more capital. Yet one of the guiding principles of Basel II,
namely that capital cannot replace the sound management and proper control of risks,
remains fully valid. A denominator that were not sensitive to risk would again be the
precursor of a fresh crisis. Risk-insensitive measures can only lead to greater regulatory
arbitrage and competitive distortions. In this respect, internal models continue to play an
essential role, bearing in mind - as always - their limitations.
One of the main uncertainties surrounding Basel III is knowing the impact it will have
on banks’ behaviour. The perception is that this impact will not be insignificant, and much of
it will be through the solvency ratio denominator, i.e. via risk management. The greater
the pressure to increase the numerator, the greater will be the pressure to reduce the
denominator by various means. Ultimately what counts is the ratio itself.
Basel III mainly alters the numerator of the solvency ratio, and requires more capital and of
greater quality, but what banks must initially comply with is a now-familiar ratio, of 8%.
How can the 8% solvency ratio be achieved under Basel III? There are several alternatives.
The most desirable one would be to increase capital in absolute terms, but other
possibilities exist: to change the risk profile (for example, moving from private debt to high
quality sovereign debt, increasing the levels of collateral on operations, lending less,
selling assets...) or to attempt to reduce the estimate of RWA. In this latter case, banks
with internal models will now have more incentives to make changes that reduce their
requirements, and standardised-approach banks are expected to develop to a greater
extent the risk mitigation techniques that they have not so far fully exploited.
In this setting, there has been a proliferation of the comparisons that banks themselves
and other market participants make in terms of what they call “density of RWA”, that is,
the ratio of RWA to total assets. This simple measure, which – applied using public
information – shows a range of variation that fluctuates from 15% to almost 60% for
European international IRB banks, is used to support widely different conclusions. Banks
in the lower range usually attribute this result to differences in risk profile, while those in
BANCO DE ESPAÑA 13 ESTABILIDAD FINANCIERA, NÚM. 22
the upper segment (Spanish banks among them) attribute the difference mainly to inter-
jurisdictional divergences in the calculation of RWA.
As is usually the case, neither of the two extremes is right. But it does re-open an old
debate on the extent to which the RWA of different banks are comparable. In this case, the
focus falls particularly on the calculations of banks with approved models for their
regulatory use. The variability seen in these calculations offers support to proposals such
as a return to Basel I or even to simpler measures, such as leverage ratios, forgetting, as
previously discussed, that Basel II arose to avoid the lack of comparability “in terms of
risk” of RWA under Basel I. There is also a tendency to forget that the dispersion of the
density of RWA, if it were ever really informative, is also very high at standardised-approach
banks, fluctuating in a way depending on the type of activity from values close to 0% in
some cases to 150% in others, which are the two extremes of weights under the
standardised approach. The question that needs answering is whether matters are better
or worse in terms of the comparability of capital requirements with Basel II. This article
addresses this issue for the particular case of credit risk.
While not the aim of this paper, it is worth remarking that the measurement of the soundness
of a bank is often confused with the measurement of its capital ratio. However, although
this ratio has a role to play in the measurement of the soundness of banks, other relevant
factors are occasionally overlooked, such as risk management and internal control
capabilities, recurrence and diversification of results, accessibility to capital markets, the
sustainability of funding structures, operating markets, etc. In short, all the factors that
make up a bank’s risk profile.
The article comprises six sections. The following section discusses some of the problems
posed by the density ratio of RWA frequently used by analysts and banks to make
comparisons across banks, and some alternatives in the field of credit risk are proposed.
Two comparisons between banks then follow, the first at the international level, using public
information, and the second at the national level, based on confidential data. The fifth
section sets out the process followed by the Banco de España in the supervisory validation
of IRB credit risk approaches. Finally, the main conclusions of the paper are drawn.
There has been growing concern for some time among banks and supervisors about
cross-bank and cross-country consistency in the calculation of risk-weighted assets
(RWA) in the context of solvency regulations. There is interest in this matter because, as is
known, RWA are used in the denominator of the various capital ratios4 set in different
solvency regulations, thus acting as a yardstick for deciding whether banks’ eligible own
funds are sufficient.5 Accordingly, if there are unwarranted differences in the calculation of
2 Problems with the
RWA density ratio
and alternatives
4 Capital ratios with RWA as their denominator are occasionally called risk-based ratios so as to distinguish them
from leverage ratios, whose denominator basically consists of the book value of total assets, with certain
adjustments and additions.
5 It should be pointed out here that, as the current status of the solvency regulations stands, the concept of “risk-
weighted assets” is perhaps being overemphasised, and may occasionally lead to some confusion. True, under
Basel I and the Basel II standardised approach to credit risk, a weighting of “assets” – actually, exposures,
including certain off-balance sheet items – is made as a prior step to calculating capital requirements, defined as
8% of weighted assets (the minimum value required for the total capital ratio). However, in many cases (the IRB
approach for credit risk, market risk, operational risk...) such prior weighting is not carried out; rather, the capital
requirements are calculated following different procedures, and the RWA are derived – a posteriori – by multiplying
them by a factor, 12.5, directly related to the total capital ratio required (12.5 is the inverse of 8% or 0.08). Given that,
moreover, several capital ratios have at present been explicitly defined in respect of solvency regulations, with
different minimum percentages depending on the capital aggregate considered, it is natural to enquire about the
suitability of the RWA concept, which in the best of cases is an intermediate variable, and at worst a purely
conventional calculation.

BANCO DE ESPAÑA 14 ESTABILIDAD FINANCIERA, NÚM. 22
RWA, distortions will arise in the measurement of banks’ solvency, which will be to the
detriment of a level playing field for banks and their competitiveness.
In order to analyse the consistency of RWA in the context of solvency regulations, certain
agents – chiefly international banks and analysts – have been using the Risk-Weighted
Assets/Total Assets (RWA/TA) or density ratio. This ratio compares total regulatory
weighted assets with banks’ total balance sheet, and it may be interpreted as a measure
of the average relative risk – according to regulatory criteria – of a bank’s overall
operations. The disclosure of notable differences in the value of this ratio from bank to
bank and from country to country has led some to conclude – to denounce, it might be
said – that the calculation of RWA is not carried out consistently, and that there must
be significant and unwarranted differences in banks’ calculation methodologies and
in supervisors’ criteria.
This section examines whether this conclusion is warranted. Also, adopting a broader
perspective, the section reflects on what would be the appropriate use that could be given
to this type of ratio, in which a measure of risk and a measure of exposure are related, and
a ratio that might be useful is proposed.
Focusing on the RWA/TA ratio, it should be said there are good reasons why this measure
should differ from bank to bank, without having to resort to undesirable differences in the
methodologies or criteria applied (which cannot be ruled out either). Among such reasons
are the following:
– Regarding the numerator (Risk-Weighted Assets):
– It should not be forgotten that regulatory RWA are derived from the
application of a solvency framework that seeks to be risk-sensitive:
the greater the risk taken by banks, the greater RWA should be in relation
to their “assets”.6
Thus, the risk profile of banks should have a significant effect on the value
of this ratio. This profile can be reflected in various aspects: banks’
balance-sheet structure (the relative weight of their different portfolios),
the quality of the assets included in each portfolio, the geographical areas
in which they operate, the types of business in which they engage
(commercial banking, investment banking, bancassurance…). Those
banks focusing on what are considered as low-risk activities, or whose
investments are of higher quality, should show lower ratios.
– Another aspect to bear in mind is that RWA are the outcome of a weighting
of assets based only on their risk of unexpected loss, and they do not take
into account the risk of expected loss. The breakdown of total risk into
these two components may differ substantially across banks depending
on the type of business pursued, so that the numerator of the ratio offers
a partial view of the risk taken or of the regulatory requirements made.
6 The term is in inverted commas to highlight the fact that in many cases it refers not only to on-balance sheet
assets, but also to off-balance sheet items. A more appropriate term would be ‘exposures’, also commonly used,
which covers both on and off-balance sheet items.

BANCO DE ESPAÑA 15 ESTABILIDAD FINANCIERA, NÚM. 22
– As to the denominator (Total Assets), the use of the total balance sheet poses
various problems in respect of comparison with RWA:
– Not all RWA arise from weighting balance sheet assets in the proper sense
of the term: evident examples are RWA relating to contingent exposures
and commitments (guarantees extended, undrawn amounts in credit
accounts), short positions in financial instruments, financial derivatives,
etc. On the contrary, there are balance sheet assets to which the
regulations do not apply the weighting and capital requirements scheme,
opting instead, conventionally, for deducting them from eligible own
funds; that is the case, for example, of intangible assets, such as goodwill,
certain holdings in other companies, some securitisations, etc. Operations
such as the foregoing mean that some components of the numerator have
no reflection in the denominator, and vice-versa: the RWA/TA ratio is
inconsistent by definition.
– Another source of inconsistency arises from the fact that the ratio mixes
risks whose requirements are calculated on the basis of “assets” (or rather,
as noted, exposures), such as credit risk, with others that use methodologies
whose relationship to balance sheet assets is less direct, as occurs with
market and operational risk, and where a “weighted assets/assets” ratio is
not really adequate. This matter is particularly serious when banks whose
type of business is very different (e.g. commercial banks versus investment
banks) are compared.
– Furthermore, differences in the accounting criteria applied to certain
operations may mean the value of total assets is very different under
different regulations7, prompting likewise notable differences in the ratio.
This especially affects trading book operations.
In this context, it would be unwarranted to state that the differences in the RWA/TA ratio are
principally due to possible inconsistencies in the methodologies for calculating RWA or in
supervisors’ criteria, even though it cannot be ruled out that such inconsistencies may exist.
The flaws exposed in this ratio have raised doubts over its usefulness as an analytical tool:
in particular, its intrinsic inconsistency and the fact that, by attempting to cover all the
bank’s activity, its value is influenced by a multitude of different factors whose effect is
difficult to assess (balance sheet structure, investment policies, type of business,
operations and also the calculation methodologies for RWA). Indeed, it is likely that their
use will readily lead to mistaken conclusions. If the aim is to detect methodological or
criteria-related inconsistencies in the calculation of RWA across banks, this ratio does not
appear to be overly useful.
It is worth asking whether a ratio (or a set of ratios) could be designed to measure the
relative risk taken by banks, that does not have the shortcomings of the one discussed
above (or that has them in a less serious form), so that more appropriate comparisons can
be made. To do this, a measure of the risk taken should be set against a measure of the
7 Ledo, M. (2011) mentions two real, and telling, examples of to what extent total assets may differ under US-
GAAP and IFRS.

BANCO DE ESPAÑA 16 ESTABILIDAD FINANCIERA, NÚM. 22
exposure that has given rise to this risk. It seems reasonable to require that any ratio of this
type should meet the following conditions:
– Consistency: there should be no risks in the numerator whose exposure is not
reflected in the denominator.
– Completeness: all exposures that are relevant in the context of analysis should
be included in the denominator, and all significant risks associated with such
exposures should appear in the numerator.
In the area of solvency regulations, the construction of ratios of this type would involve
using capital requirements (or their equivalent RWA) in the numerator, and it seems
reasonable to also include expected losses in the case of credit risk, since they are actually
part of the regulatory estimate of risk and, moreover, their amount is by no means
insignificant. As a result, a measure of the relative risk assumed by banks in accordance
with regulatory criteria would be obtained, as would, therefore, a measure of the relative
effort that regulations require of banks in terms of own funds required relative to exposures
held. Unfortunately, it seems difficult to find an “overall” ratio, similar to that criticised
above, which consistently measures the risks incurred by banks, due above all to the fact
that, as said, the requirements are calculated in very different ways for the different risks
envisaged (credit, market and operational risk, mainly), and the concept of exposure is not
clearly defined in certain cases (market and operational risk).
Consequently, a ratio of this type will be all the more significant and useful the more
restricted and uniform the area to which it is applied. Focusing on credit risk, it does seem
possible to design useful ratios that meet the conditions mentioned above, although
certain particularities of the two fundamental approaches for calculating requirements
should be borne in mind; in short:
– Standardised approach: capital requirements are calculated from the exposure
at default (EAD8) net of provisions, similarly to under Basel I. This implicitly
assumes that capital requirements cover estimated unexpected losses arising
from exposures, and that provisions cover expected losses.
– Internal Ratings Based (IRB) approach: capital requirements are calculated
from gross EAD (provisions not deducted). Expected losses (EL) are calculated
explicitly and the difference between provisions and EL is included, subject to
an upper limit, in regulatory capital (i.e. EL are treated as a deduction from
regulatory capital).
Given these differences, if it is wished to treat these two approaches together or to
compare their respective regulatory capital requirements, it seems reasonable to define
the ratio as follows:
– Numerator: capital requirements plus expected losses, so as to reflect all
regulatory ‘capital’ requirements (all the estimated risk of loss). For exposures
8 This is the fundamental measure of exposure used in credit risk regulatory capital calculations, to which risk
weights and expected loss estimates are applied to calculate RWA and expected loss amounts (the latter only in
the case of the IRB approach).

BANCO DE ESPAÑA 17 ESTABILIDAD FINANCIERA, NÚM. 22
treated under the standardised approach, given that expected losses are not
calculated explicitly, it is necessary to make certain assumptions in this
respect. Since the loss estimates used are derived from the legal regulations,
it would seem adequate to use the assumption implicit in the regulations for
that approach (expected losses are covered by provisions) and take the best
estimate of expected losses under the standardised approach to be the
provisions booked.9
– Denominator: with a view to encompassing both on-balance-sheet assets
and off-balance-sheet contingent exposures and commitments, it would
seem most appropriate to use the same concept of exposure as that used to
calculate capital requirements and EL, namely EAD, since this includes off-
balance-sheet exposures through the application of conversion factors which
transform them into equivalent on-balance-sheet amounts. It is also of interest
that the exposures treated under the standardised approach should be made
as consistent as possible with those used under the IRB approach, by taking
their gross value, i.e. not net of provisions.
This would give the following theoretical ratio:
Capital requirements + Expected credit losses
Gross exposure
Or, more specifically:
(Capital req. + EL ) IRB + (Capital req. + Provisions)STA
Gross EAD
where gross EAD = (EAD) IRB + (EAD + Provisions) STA.
In terms of risk-weighted assets, the ratio would be:
12.5 × [(Capital req. + EL ) IRB + (Capital req. + Provisions) STA ]
Gross EAD
Hence, in the area of credit risk, a consistently defined ratio is obtained that includes all
the regulatory capital requirements for the exposures in question (i.e. a regulatory estimate
of the risks taken) and whose value represents the sum of the average risk-weight and the
average expected loss (multiplied by 12.5), which are applied to the total EAD considered.
This ratio can be used for banks applying the standardised approach, the IRB approach
or both.
However, this ratio is not without its shortcomings and problems. Most notable among
these are, firstly, that if the ratio is applied at a high level of aggregation (total credit risk,
total IRB approach, total standardised approach, etc.), the result will be the average of a
heterogeneous set of diverse approaches, portfolios or exposures. Secondly, that from the
standpoint of measuring banks’ regulatory capital requirements, the ratio is still somewhat
9 A legitimate criticism here is that often it is not very obvious that there is a close relationship between the risk of
expected losses and provisions booked by banks.
BANCO DE ESPAÑA 18 ESTABILIDAD FINANCIERA, NÚM. 22
incomplete because, as it provides a measure of the regulatory requirements per unit of
EAD, it does not show the effect of the credit conversion factors (CCF) that are used to
estimate the EAD of off-balance-sheet items: the larger CCF are, the larger the EAD and
the larger the volume of RWA and expected losses, although the ratio is practically
unaffected.
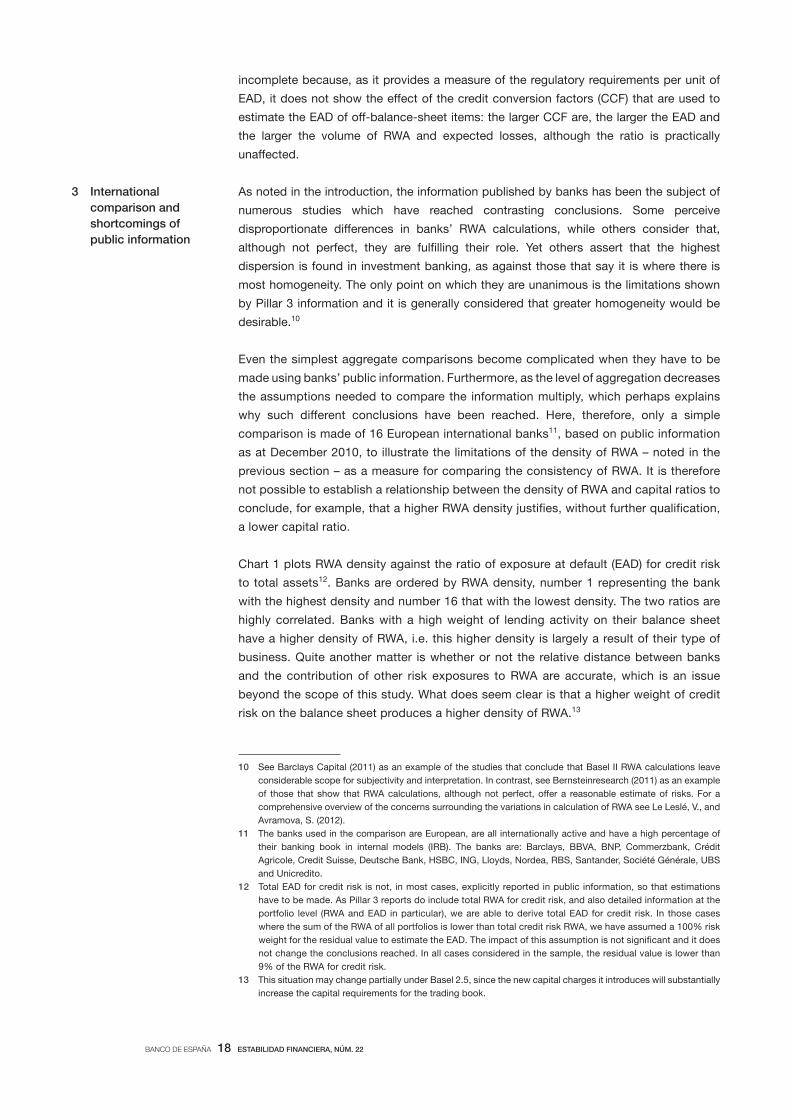
As noted in the introduction, the information published by banks has been the subject of
numerous studies which have reached contrasting conclusions. Some perceive
disproportionate differences in banks’ RWA calculations, while others consider that,
although not perfect, they are fulfilling their role. Yet others assert that the highest
dispersion is found in investment banking, as against those that say it is where there is
most homogeneity. The only point on which they are unanimous is the limitations shown
by Pillar 3 information and it is generally considered that greater homogeneity would be
desirable.10
Even the simplest aggregate comparisons become complicated when they have to be
made using banks’ public information. Furthermore, as the level of aggregation decreases
the assumptions needed to compare the information multiply, which perhaps explains
why such different conclusions have been reached. Here, therefore, only a simple
comparison is made of 16 European international banks11, based on public information
as at December 2010, to illustrate the limitations of the density of RWA – noted in the
previous section – as a measure for comparing the consistency of RWA. It is therefore
not possible to establish a relationship between the density of RWA and capital ratios to
conclude, for example, that a higher RWA density justifies, without further qualification,
a lower capital ratio.
Chart 1 plots RWA density against the ratio of exposure at default (EAD) for credit risk
to total assets12. Banks are ordered by RWA density, number 1 representing the bank
with the highest density and number 16 that with the lowest density. The two ratios are
highly correlated. Banks with a high weight of lending activity on their balance sheet
have a higher density of RWA, i.e. this higher density is largely a result of their type of
business. Quite another matter is whether or not the relative distance between banks
and the contribution of other risk exposures to RWA are accurate, which is an issue
beyond the scope of this study. What does seem clear is that a higher weight of credit
risk on the balance sheet produces a higher density of RWA.13
3 International
comparison and
shortcomings of
public information
10 See Barclays Capital (2011) as an example of the studies that conclude that Basel II RWA calculations leave
considerable scope for subjectivity and interpretation. In contrast, see Bernsteinresearch (2011) as an example
of those that show that RWA calculations, although not perfect, offer a reasonable estimate of risks. For a
comprehensive overview of the concerns surrounding the variations in calculation of RWA see Le Leslé, V., and
Avramova, S. (2012).
11 The banks used in the comparison are European, are all internationally active and have a high percentage of
their banking book in internal models (IRB). The banks are: Barclays, BBVA, BNP, Commerzbank, Crédit
Agricole, Credit Suisse, Deutsche Bank, HSBC, ING, Lloyds, Nordea, RBS, Santander, Société Générale, UBS
and Unicredito.
12 Total EAD for credit risk is not, in most cases, explicitly reported in public information, so that estimations
have to be made. As Pillar 3 reports do include total RWA for credit risk, and also detailed information at the
portfolio level (RWA and EAD in particular), we are able to derive total EAD for credit risk. In those cases
where the sum of the RWA of all portfolios is lower than total credit risk RWA, we have assumed a 100% risk
weight for the residual value to estimate the EAD. The impact of this assumption is not significant and it does
not change the conclusions reached. In all cases considered in the sample, the residual value is lower than
9% of the RWA for credit risk.
13 This situation may change partially under Basel 2.5, since the new capital charges it introduces will substantially
increase the capital requirements for the trading book.

BANCO DE ESPAÑA 19 ESTABILIDAD FINANCIERA, NÚM. 22
Chart 2 compares the dispersion and order of RWA densities with those of a similar but
more consistent measure: the ratio of RWA to EAD in IRB portfolios14. In this case, when
the comparison is limited to the IRB portfolios and is based on the EAD, the dispersion
decreases substantially from a standard deviation of 11% to 7%. Moreover, the order
varies and those banks with a greater density of RWA do not have the highest capital
requirements for credit risk. For example, the bank with the highest RWA density, 59%
higher than the average, ranks fifth in the second ratio, being 15% above the average.
Obviously, significant differences still remain, but the information banks publish gives no
insight into whether they are due to differences in the risk profile of the portfolios or to
other factors. Also, it should be noted that the banks’ data are at the consolidated level,
often the result of mixing portfolios of subsidiaries from different countries, so they do not
allow the idiosyncratic behaviour of a given portfolio to be linked to the bank’s home
country. Thus, for example, if the comparison is restricted to a more homogeneous group
14 The IRB portfolios included are: central government and central banks, institutions, corporate and retail.
RWA DENSITY AND THE RATIO OF CREDIT RISK EAD TO TOTAL ASSETS FOR A SAMPLE OF EUROPEAN BANKS
CHART 1
1
4
6
15
2 3
57
8 91011
1213
16
10
20
30
40
50
60
40 50 60 70 80 90 100 110 120
%
EAD for Credit Risk / Total Assets
Tota
l RW
A /
Tota
l Ass
ets R2 = 91%
SOURCES: Financial and Pillar 3 reports by individual banks.NOTE: The chart plots RWA density against the ratio of exposure at default (EAD) for credit risk to total assets for a sample of 16 European international IRB banks. The banks are: Barclays, BBVA, BNP, Commerzbank, Crédit Agricole, Credit Suisse, Deutsche Bank, HSBC, ING, Lloyds, Nordea, RBS, Santander, Société Générale, UBS and Unicredito. The ratios have been calculated using public information as at December 2010. Banks are ordered by RWA density, number 1 representing the bank with the highest density.
14
RWA DENSITY AND THE RATIO OF RWA TO EAD IN IRB PORTFOLIOS FOR A SAMPLE OF EUROPEAN BANKS CHART 2
0
10
20
30
40
50
1
60
%
Total RWA / Total Assets IRB RWA / IRB EAD
2
45
3
6 7 8 9 1011 12
1314
1516
12 4
53
6
7
8
9
10
11 1213 14
1516
SOURCE: Financial and Pillar 3 reports by individual banks.NOTE: The chart shows RWA density, on the left, and the ratio of RWA to exposure at default (EAD) in IRB portfolios (central government and central banks, institutions, corporate and retail) on the right, for a sample of 16 European international IRB banks. The banks are: Barclays, BBVA, BNP, Commerzbank, Crédit Agricole, Credit Suisse, Deutsche Bank, HSBC, ING, Lloyds, Nordea, RBS, Santander, Société Générale, UBS and Unicredito. The ratios have been calculated using public information as at December 2010. Banks are ordered by RWA density, number 1 representing the bank with the highest density.

BANCO DE ESPAÑA 20 ESTABILIDAD FINANCIERA, NÚM. 22
of banks, such as the six Spanish banks with approved IRB approaches which do not
have significant international activity (not represented in the above charts), the dispersion
in terms of RWA density would be less than that in the international comparison, fluctuating
from 57% to 72%15, as a natural consequence of more comparable businesses and a
homogeneous supervisory validation process.
There are three possible sources of differences in banks’ RWA:
– Different risk profile of their portfolios. This difference would be justified.
– Different progress in implementing advanced approaches, and differences in
banking regulation due to areas of national discretion. The latter are not few
in number and may have a substantial impact, although they are envisaged in
banking regulation.16 In this connection, efforts are being made at the international
level to reduce the areas of national discretion. The differences arising from
disparate progress in implementing advanced approaches are generally a
more or less logical consequence of the incentives offered to encourage
banks to improve their risk management.
– Finally, those due to differing interpretations by banks or supervisors or to
less supervisory “pressure” in validation processes. This source of
differences is not justified, although it is not difficult to find examples
of divergences, not only in validation processes, reflecting the supervisory
models in place in each country, but also in the interpretation of banking
regulations, from the most complex issues such as the definition of long-run
probability of default (PD), the concept of downturn for calculating the loss
given default (LGD) and the credit conversion factors (CCF), the treatment of
exposures in default or the justification of the number of rating grades to be
used,17 to simpler matters such as the application of certain floors or
whether some conservative adjustments should be reflected in risk
parameters (Pillar 1) or in Pillar 2.
The difficulty is to determine what part of the differences comes from each source. The
main conclusion is that the information included in Pillar 3 reports does not allow us to say
whether the differences are due to different risk profiles or to other factors, since not
enough details on the regulatory parameters are provided. For example, given two
portfolios that are identical in terms of counterparties (the same PD), collateral (the same
LGD), size (the same S) and applying the same credit conversion factors (CCF), if one of
them has a maturity (M) longer than the other, the minimum capital requirements for the
portfolio with the longer maturity may be twice as high. There are many matters not
included in sufficient detail in the public information which could be important in calculating
capital requirements.
The problem is that, although unquestionably Pillar 3 information can be improved, it is
unlikely that it will contain sufficient detail to enable banks to be compared satisfactorily.
For this reason, the supervisory review process takes on special importance, particularly
15 Values obtained from public information as at December 2010.
16 The very definition of “default” is an area of national discretion in retail portfolios, as the minimum period of time
established to classify a past due exposure as defaulted ranges from 90 to 180 days.
17 The mere grouping of transactions in homogeneous categories may give rise to significant changes in minimum
capital requirements, although, in fact, it does not modify the risk associated with the portfolio.

BANCO DE ESPAÑA 21 ESTABILIDAD FINANCIERA, NÚM. 22
considering that many decisions considered to be “details” may have a major impact on
calculations and they cannot be assessed without a thorough review. It is therefore
essential to make progress in harmonising supervisory validation processes. This
harmonisation is undoubtedly one of the main challenges of the new European Banking
Authority, in which it will have to take an active role. Section 5 describes the main
characteristics of the supervisory validation process in Spain.
Table 1 shows various RWA density ratios for the Spanish banks applying the standardised
approach and for those authorised to use the IRB approach to calculate their capital
requirements for credit risk, on an aggregate basis for each group. The calculation of
these ratios took into account the considerations set out in Section 2 and used the
information in the confidential accounting and solvency returns as at June 2011:
The ratios shown are of two types:
– Risk-Weighted Assets/Total Assets (RWA/TA) ratio: as noted above, this is the
ratio most widely used in the market to analyse the consistency of risk-
weighted assets in the context of solvency regulations.
– Other ratios: these are also designed to measure the relationship between
the risk taken and their respective exposures, all likewise measured by
regulatory methods, but with the focus on credit risk. The first focuses on
assets weighted by the risk of unexpected losses (i.e. the customary
RWA), while the next two also include assets weighted by the risk of
expected losses, this being done most completely and consistently in the
last of these ratios.
As discussed in detail in Section 2, the RWA/TA ratio does not seem suitable for comparing
banks, and less so for attempting to detect inconsistencies in the calculation of RWA, basically
because it is not defined consistently and because its value is influenced by a mix of
heterogeneous factors whose effects are difficult to separate from each other, since it is a
ratio which encompasses all risks (credit, market, operational, etc.) and activities of the bank.
Therefore, to make comparisons in terms of the relative risk taken, it seems advisable to
restrict the analysis to a domain as homogeneous as possible, at least that of one type of
risk in particular. For this purpose, the last three ratios shown in Table 1 focus on a bank’s
total credit risk.18 The RWA/EAD ratio reflects the average risk weight applied to the credit
4 Comparison of Spanish
IRB and standardised
banks
18 Actually, this is still an excessive level of aggregation for an adequate analysis, and the results may be influenced
by the relative weight of the various credit risk portfolios on banks’ balance sheets, because the capital
requirements (and asset weights) vary greatly from one bank to another.
Total RWA /
%
Total Assets
Credit Risk:
RWA / EAD
Credit Risk:
(RWA + 12.5*EL) / EAD
Credit Risk:
[RWA + 12.5*
(EL + STA Prov.)] / Gross EAD
Standardised banks 60.3 57.1 57.1 98.4
IRB banks 53.7 49.1 63.1 77.3
SOURCE: Banco de España.NOTE: The table shows various RWA density ratios for the Spanish banks applying the standardised approach and for those authorised to use the IRB approach,on an aggregate basis for each group and using con dential data as at June 2011.
RWA DENSITY RATIOS FOR SPANISH BANKS TABLE 1
BANCO DE ESPAÑA 22 ESTABILIDAD FINANCIERA, NÚM. 22
risk, considering only the risk of unexpected losses. However, it seems reasonable to take
into account not only this risk, but also the risk of expected losses, as in the last two ratios.
The first of them incorporates the expected losses from the exposures treated under the
IRB approach, but this is still incomplete and inconsistent, since only unexpected losses
are included for exposures under the standardised approach (the rule does not require an
explicit calculation of expected losses). The last ratio remedies this defect by using the
assumption implicit in the standardised approach (expected losses are covered by
provisions) and equating the expected losses under this approach to the provisions set
aside. This ratio seems to be the most suitable one, within its limitations, for comparing
banks which apply different approaches to calculate their regulatory capital requirements
for credit risk.
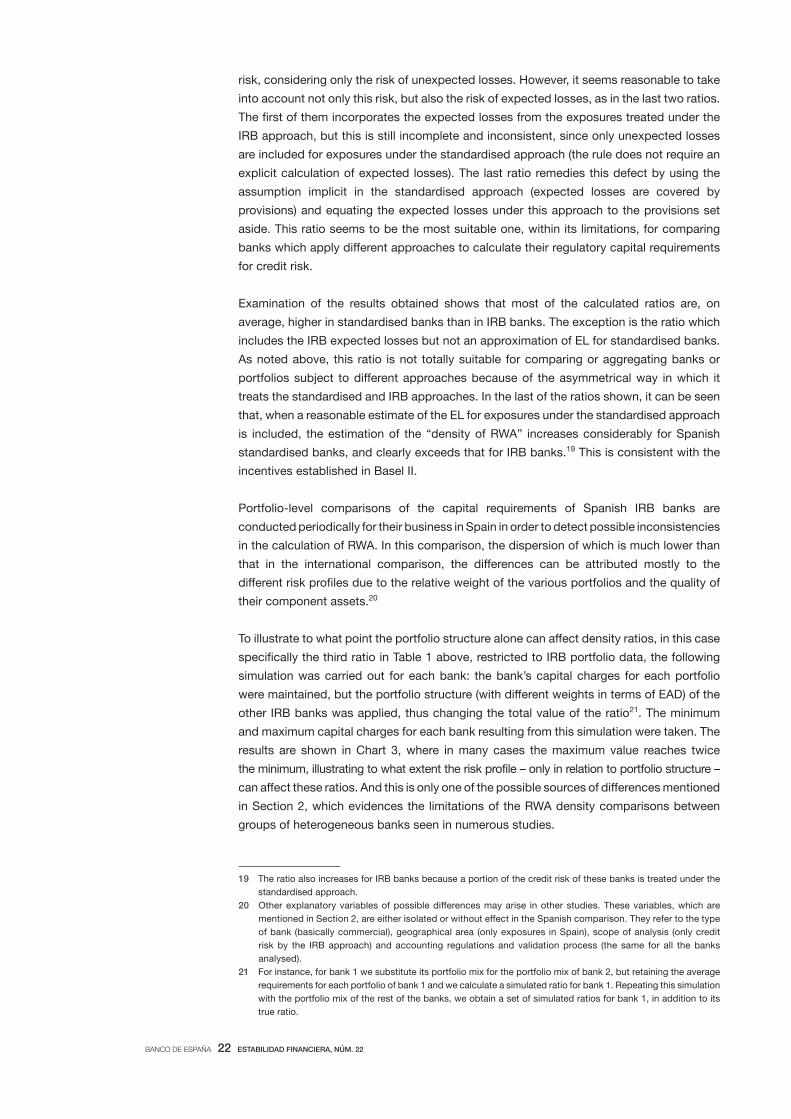
Examination of the results obtained shows that most of the calculated ratios are, on
average, higher in standardised banks than in IRB banks. The exception is the ratio which
includes the IRB expected losses but not an approximation of EL for standardised banks.
As noted above, this ratio is not totally suitable for comparing or aggregating banks or
portfolios subject to different approaches because of the asymmetrical way in which it
treats the standardised and IRB approaches. In the last of the ratios shown, it can be seen
that, when a reasonable estimate of the EL for exposures under the standardised approach
is included, the estimation of the “density of RWA” increases considerably for Spanish
standardised banks, and clearly exceeds that for IRB banks.19 This is consistent with the
incentives established in Basel II.
Portfolio-level comparisons of the capital requirements of Spanish IRB banks are
conducted periodically for their business in Spain in order to detect possible inconsistencies
in the calculation of RWA. In this comparison, the dispersion of which is much lower than
that in the international comparison, the differences can be attributed mostly to the
different risk profiles due to the relative weight of the various portfolios and the quality of
their component assets.20
To illustrate to what point the portfolio structure alone can affect density ratios, in this case
specifically the third ratio in Table 1 above, restricted to IRB portfolio data, the following
simulation was carried out for each bank: the bank’s capital charges for each portfolio
were maintained, but the portfolio structure (with different weights in terms of EAD) of the
other IRB banks was applied, thus changing the total value of the ratio21. The minimum
and maximum capital charges for each bank resulting from this simulation were taken. The
results are shown in Chart 3, where in many cases the maximum value reaches twice
the minimum, illustrating to what extent the risk profile – only in relation to portfolio structure –
can affect these ratios. And this is only one of the possible sources of differences mentioned
in Section 2, which evidences the limitations of the RWA density comparisons between
groups of heterogeneous banks seen in numerous studies.
19 The ratio also increases for IRB banks because a portion of the credit risk of these banks is treated under the
standardised approach.
20 Other explanatory variables of possible differences may arise in other studies. These variables, which are
mentioned in Section 2, are either isolated or without effect in the Spanish comparison. They refer to the type
of bank (basically commercial), geographical area (only exposures in Spain), scope of analysis (only credit
risk by the IRB approach) and accounting regulations and validation process (the same for all the banks
analysed).
21 For instance, for bank 1 we substitute its portfolio mix for the portfolio mix of bank 2, but retaining the average
requirements for each portfolio of bank 1 and we calculate a simulated ratio for bank 1. Repeating this simulation
with the portfolio mix of the rest of the banks, we obtain a set of simulated ratios for bank 1, in addition to its
true ratio.

BANCO DE ESPAÑA 23 ESTABILIDAD FINANCIERA, NÚM. 22
Irrespective of its complexity, the best regulation is useless if it is not applied correctly.
Hence the importance of adequate supervision. In Basel II, the incorporation of greater
sensitivity to risk and the possibility of applying a range of approaches depending on the
level of development of risk management has certain implications. First, the supervisory
task is more complex and its implementation and monitoring require greater consumption
of supervisory resources. Second, this greater complexity may make comparisons
between banks difficult. However, the solution should not be to return to arrangements
that were less sensitive to risk, but rather to strive for more uniform implementation. The
alternative of a less complex system does not guarantee greater comparability in terms of
risks taken; it may be recalled that under Basel I exposures with very different levels of risk
had the same capital requirements.
At the same time the advantages entailed by the introduction of Basel II should not be
forgotten. The quantity and quality of the information available to analyse banks’ exposures
are much higher than before its introduction. As a result, analyses can be performed that,
despite their limitations, are deeper and more revealing than would have been the case if
Basel I were still in place and banks had developed internal models with little comparability
and not subject to supervisory validation.
Under Basel II, banks may use their models to calculate capital requirements only if they
comply with a number of minimum requirements and they have first been validated and
authorised by the supervisory authority. Here, as in the case of other types of supervisory
tasks, differences between jurisdictions remain. Although the scope of supervisory validation
work tends to be the same for many supervisors and generally covers the revision of
methodologies, documentation, data quality, the technological environment and quantitative
and qualitative aspects, its focus and intensity differs. This section presents some of the
main characteristics of the validation process in Spain.23
Supervisory validation of models in Spain commenced following the publication of Basel II
in June 2004, and the first phase culminated in 2008 with the approval of the use of the
5 Supervisory validation
of IRB approaches
in Spain 22
22 Although many of the comments in this section are applicable to the supervisory validation of models to
measure different kinds of risks, the section refers to credit risk models in particular.
23 See Banco de España (2006) for details of the Basel II implementation process in Spain and of the validation of
advanced approaches.
IMPACT OF PORTFOLIO STRUCTURE ON IRB CREDIT RISK REQUIREMENTS CHART 3
0
20
40
60
80
100
120
140
160
180
1 2 3 4 5 6 7 8
%
Banks
(RW
A +
12.5
*EL) /
E
AD
SOURCE: Banco de España.NOTE: The chart illustrates the effect of portfolio structure on density ratios, in particular on the ratio that considers RWA and also expected losses in the numerator and uses exposure at default in the denominator. Con dential June 2011 data of the IRB portfolios of eight Spanish IRB banks are used. The vertical bars represent the range of possible values of the ratio when the portfolio structures of all banks are applied to the risk weights and expected losses of every bank.

BANCO DE ESPAÑA 24 ESTABILIDAD FINANCIERA, NÚM. 22
IRB approach by eight Spanish banking groups. Since then the IRB approach has been
rolled out across portfolios, including those of their subsidiaries abroad in coordination
with host supervisors. So-called mixed validation teams were created to carry out this
validation, consisting of staff responsible for the regular inspections of each bank and staff
specialised in risk measurement models. The approach applied is characterised by its
global view of all the essential elements of an advanced risk management system, by
its intensity, both in terms of the number of staff involved and its duration, and by being
performed mainly on-site, at the banks’ headquarters.
At the end of the validation process it should be possible to answer three key questions in
the affirmative:
– The first is whether the bank’s models contribute to daily risk management. To
answer this question, among other aspects assessed are their internal uses,
besides their regulatory ones, and the participation of senior management in
the whole process.24
– The second is whether the models produce outputs that are adequate for their
regulatory use. Here, not only the methodologies but also the quality of the
information are reviewed.
– And finally, whether the bank has a structure of internal controls that
guarantees the correct functioning of its models in the future, with special
attention being given to the role played by internal validation units25 and
internal audit.
Although the questions are simple, they cannot be answered without a profound knowledge
of the models and the data fed into them, and also of the bank’s risk management and its
technological environment. Two validation tests stand out here which consume a large
amount of resources, but which have proven to be enormously useful for answering those
three questions and have shown the importance of descending to a very detailed level to
be able to understand banks’ capital estimates and the great impact that apparently
“minor” factors may have. These two tests are data checking and replication exercises.
One of the key elements, and the largest source of incidents detected by far, is the
quality of the databases. Given that scoring models (or rating systems) and risk
parameters, whether internal or regulatory, are obtained by applying estimation
procedures to data, the quality and reliability of such data need to be assessed. This is
a necessary but not sufficient condition for obtaining models and estimates that are also
adequate and reliable.
Data checking
24 It is worth highlighting that the main aim of developing internal models should be to improve risk management.
For this reason, a basic requirement for the regulatory use of models is that they must be integrated in day-to-
day risk management and be part of the bank’s culture. This requirement is commonly known as the “IRB use
test”. However, integration does not mean that models outputs for management and regulatory purposes must
be the same. As has been stated by the Basel Committee on Banking Supervision (2006), “measures used for
internal processes may reasonably differ from IRB components in some instances… Where such differences
exist, banks should demonstrate good reasons for use of parameters that do not match IRB components. The
supervisory objectives of the use test could be met if banks demonstrate that the degree of consistency
between the IRB components and the internal estimates is sufficiently high as to contribute to continuous
quality pressure on the IRB components. In this context, consistency might be demonstrated by establishing
clear linkages between the internal inputs and the IRB components, showing that any differences reflect
legitimate risk management needs.”
25 See Banco de España (2007) for the criteria that banks’ internal validation units are expected to meet.

BANCO DE ESPAÑA 25 ESTABILIDAD FINANCIERA, NÚM. 22
This data checking is generally carried out in two ways:
– Consistency and coherence with other databases of the bank. Thus, inter alia,
the data are checked against the original systems and databases (loans,
cards, etc.) and the accounting information. Also, the information controls
and filters existing in the different sample creation processes are analysed,
whether they are for building the model or for calibrating the risk parameters,
as well as the information treatment protocols.26 Special emphasis is placed
on the replicability of the data.
– Review of physical files: not only enables the assessment of the reliability of
the information (model variables, collateral data, recovery cash flows, etc.),
but also the evaluation of the monitoring of the internal management
procedures established, the relevance of models when granting credit
facilities and the effectiveness of controls.
Replication exercises generally consist in verifying the reality of the various outputs
presented by the bank in its estimates, starting from internal databases and carrying out
the operations and treatments reflected in the documentation. There are three different
areas in which this type of task is performed:
– Construction of scoring models or rating systems.
– Calibration of risk parameters (PD, LGD, etc.).
– Regulatory outputs (capital requirements and expected loss amounts).
In Spain replications have focused on the latter two areas. As regards scoring models and
rating systems we rely on the control procedures that their use should entail because, as
they ought to be used to approve credit facilities, set prices and for other management
practices, the bank itself is the main party interested in their proper functioning and in
adapting them to changes, so as to ensure that they retain sufficient discriminatory
power.27 Moreover, if there is any problem in the ranking of exposures it will be detected in
the replication of the risk parameter calibration.
Replications in the area of parameter calibration help to answer the question of whether
the calculated outputs are appropriate, and seek:
– To detect gaps in the documentation.
– To provide a sufficient understanding of the estimation processes and hypotheses
assumed, as well as to assess their importance and reasonableness.
– To check compliance with the minimum requirements established in the
regulations.
Replications have also highlighted the importance of the details in the estimation
processes, many of which are not incorporated into the documentation, so that it would
Replication exercises
26 For example, the treatment of outliers and of zero or absent values.
27 In any case, partial replications are sometimes performed, in relation to the discriminatory power measures.

BANCO DE ESPAÑA 26 ESTABILIDAD FINANCIERA, NÚM. 22
not be possible to be aware of their existence and assess them without carrying out
these exercises. In our experience, taken together, they normally have an important
impact on the final estimates.
As regards the calculation of the regulatory outputs (capital and expected losses), the
aim of the replication tasks is to check that the bank’s calculations are correct.
The revision of the capital requirements that banks must regularly report to their
supervisors has become a complex task, and certainly much more so than in the case of
banks that apply the standardised approach. Replicating the capital calculations has the
following objectives:
– To check that the bank is using for its capital calculations the approved set of
regulatory parameters, and that the segmentation of the exposures and the
capital curves applied are correct given the characteristics of each operation.
– To analyse the changes in capital requirements and expected loss amounts,
trying to identify the causes of such changes: portfolio changes (migrations,
new transactions...), parameter recalibrations or other relevant changes.
Finally, once the models have been approved it is necessary to design a structure for
monitoring them so as to be able to check that the answers to the three basic questions
of the validation process remain in the affirmative. Models are dynamic and must be
adapted to changing reality and improved, as more and better information becomes
available, which means they must be carefully maintained. This monitoring task has proven
to be more costly in terms of supervisory resources than initially expected.
In Spain, model monitoring is based on the following elements:
1 Periodic information that banks must send or keep updated and available to
the supervisor: the monitoring dossier, model-based internal validation
reports and internal audit reports on use tests, databases and the technological
environment. In addition, obviously, the sending of official solvency returns.
2 Continuous review of parameter recalibrations, including the related internal
validation reports.
3 Cross-sectional analysis, both at the bank and portfolio level.
4 Prior notification of those changes that are considered relevant, in relation to
models, essential parameters and the risk management system.
The importance that we already attributed, at the time of the first approvals, to internal
control procedures and to the need for tight control over models and parameter estimates
has been clearly confirmed by our experience over the last four years of severe crisis. This
situation, and the policy changes and management decisions made by banks, have
substantially modified the calibration samples used to estimate parameters, so increasing
the importance of their detailed review. In addition, regulatory changes, especially those
seeking to increase the quality of eligible capital, have, as discussed, increased the
pressure on the denominator, and therefore on the parameter estimation processes.
However, the monitoring scheme described has enabled supervisors to see the true nature
of so-called “model optimisation”, a very trendy topic along with RWA comparability. While

BANCO DE ESPAÑA 27 ESTABILIDAD FINANCIERA, NÚM. 22
naive comparisons with similar banks seemed to be enough to endorse certain changes in
models, it should be clearly stated that any change must be justified in terms of actual
portfolio risk.
We believe that the Banco de España’s supervisory validation process is appropriate,
given the possibilities that use of the IRB approach allows for offering disparate results for
portfolios that are similar from the point of view of their risk profile. Although it is difficult
to know the extent to which the possible heterogeneity in this sense is affecting the
comparability of RWA and the level playing field at the international level, we consider that
it is necessary to homogenise further supervisory validation processes and the interpretation
by the supervisory community of certain key aspects of estimation procedures. Steps are
already being taken in this direction, such as the work at the European level to develop
binding technical standards and the intention to reduce substantially the areas of national
discretion. In addition, Basel and European working groups have been set up to analyse
the consistency of RWA.
At the same time, it should be noted that when the scope of the models encompasses
subsidiaries of Spanish banks in third countries, or subsidiaries in Spain of international
banks, validation processes are performed in close collaboration with the relevant
supervisors. This collaboration takes the form of joint reviews of models, with a division of
labour that seeks to exploit the synergies arising from the specific knowledge of each
supervisor and to avoid a duplication of work that may impose excessive costs on banks.
The channels of communication and cooperation established with other supervisory
authorities during approval processes serve, without a doubt, to increase the homogeneity
of Basel II implementation, since both supervisors must feel comfortable with the model
results at the end of the validation.
In order to analyse the consistency of risk-weighted assets in the context of solvency
regulations, comparisons in terms of the so-called RWA density – the ratio between
a bank’s total regulatory weighted assets and its total balance sheet – have proliferated.
The revelation of notable differences in the value of this ratio across banks and countries
has led some studies on the subject to conclude, one could say denounce, that RWA
are not calculated consistently, and that there are significant, and unwarranted,
differences in the calculation methodologies used by the banks and in the criteria
of supervisors.
This article analyses the problems of this ratio, including its intrinsic inconsistency and the
fact that very different business structures are considered. An international comparison is
made of 16 European banks, which concludes that a significant part of the greater RWA
density of banks is a consequence of the type of business. In particular, the greater the
weight of credit risk in the balance sheet the greater the RWA density. In addition, the
dispersion is reduced if we limit the scope of the comparison to the ratio of RWA to EAD
in IRB portfolios.
Also, alternative RWA density ratios are proposed and the best way to relate a measure of
risk to a measure of exposure is discussed. It is concluded that to be able to make a more
appropriate comparison one must restrict the sphere to which it is applied. The article
focuses on credit risk and shows that it is not sufficient to compare RWA, but that in the
case of IRB banks, at least, expected losses must be included and, if the aim is to make a
comparison with standardised banks, the different treatment of provisions should be
considered. A comparison is presented for the Spanish case, showing that IRB banks have
6 Summary
and conclusions
BANCO DE ESPAÑA 28 ESTABILIDAD FINANCIERA, NÚM. 22
a lower RWA density than standardised banks, which is consistent with the Basel II
incentives. An example of the very important impact that the portfolio structure can have
on RWA density ratios is also offered.
The possible sources of RWA differences are analysed, specifically differences in risk
profiles, in the amount of progress made in applying advanced approaches and those
permitted by the rules themselves, as well as differences of interpretation by banks and
the heterogeneity of the supervisory validation processes. The conclusion drawn is that,
unfortunately, it is not possible to determine from public information how much of the
differences arises from each source, and that, although Pillar 3 could be improved, in
particular in terms of comparability, it is doubtful whether it could ever offer sufficient
detail to permit adequate cross-bank comparisons. As in other areas, there are certain
aspects that can only be assessed by supervisors, not only because the information
needs to be so detailed, but also because confidential information may need to
be assessed.
Accordingly, the supervisory review process acquires particular importance, especially
considering the quantitative importance that issues regarded as details may have, and
therefore it is essential that the harmonisation of supervisory validation processes be
increased. The main characteristics of the validation and monitoring carried out by the
supervisor in Spain of banks with authorised internal models are presented. An adequate
level of knowledge of the models of such banks is considered to have been achieved so
that most of their differences can be explained in terms of different risk profiles.
Finally, two important aspects should be stressed. First, the Basel II rules are more
complex than those of Basel I and consequently more supervisory resources are needed
to monitor them. Second, this greater complexity can make comparison of the capital
requirements across banks difficult, and their specific implementation in different countries
may involve different criteria or different degrees of strictness in certain aspects. However,
the solution must be to achieve greater uniformity in their implementation. The alternative
of a less complex system would not guarantee greater comparability in terms of risks
taken; it should be recalled that under Basel I exposures with very different levels of risk
had the same capital requirements. Risk insensitive measures only lead to greater
regulatory arbitrage and distortion of competition. In this respect, models continue to
play an essential role, although, as always, their limitations should not be forgotten.
The advantages entailed by the introduction of Basel II should not be overlooked. Both the
quantity and quality of the information available to analyse banks’ risks have improved
greatly since its introduction, with the resulting synergies, both for banks, in their risk
management, and for supervisors, in their various monitoring tasks. Consequently,
analyses can be performed which, despite their limitations, are more profound and
revealing than those that would be possible if Basel I were still in force.

BANCO DE ESPAÑA 29 ESTABILIDAD FINANCIERA, NÚM. 22
BANCO DE ESPAÑA (2006). “Implementation and validation of Basel II advanced approaches in Spain”.
http://www.bde.es/webbde/en/supervision/funciones/Documento_Supervision_Web_ingles_completo.pdf.
— (2007). “Criteria for internal validation of advanced risk management models. Validation Document 2”.
http://www.bde.es/webbde/en/supervision/funciones/DV2_Internal_Validation_English.pdf.
BARCLAYS CAPITAL (2011). “Can you trust risk weightings at European banks?”, Equity research, Industry Update,
April.
BASEL COMMITTEE ON BANKING SUPERVISION (2006). “The IRB Use Test: Background and Implementation”,
Newsletter No. 9, Bank for International Settlements, Basel.
http://www.bis.org/publ/bcbs_nl9.pdf.
BERNSTEINRESEARCH (2011). “Global banking: what is behind the difference in RWA/Asset ratios between US and
European banks?”, European Banking, June.
LEDO, M., (2011). “Towards more consistent, albeit diverse, risk-weighted assets across Banks”, Estabilidad
Financiera, No. 21, p. 49, Banco de España.
http://www.bde.es/webbde/Secciones/Publicaciones/InformesBoletinesRevistas/RevistaEstabilidadFinanciera/
11/ref201121%20.pdf.
LE LESLÉ, V., and S. AVRAMOVA (2012). “Revisiting risk-weighted assets: Why Do RWA Differ Across Countries and
What Can Be Done About It?”, IMF Working Paper 12/90, International Monetary Fund.
http://www.imf.org/external/pubs/ft/wp/2012/wp1290.pdf.
REFERENCES


(*) Alejandra Kindelán is Head of Economic Research and Public Policy in Banco Santander. Nick Greenwood is a
Policy Advisor in the Public Policy team in Banco Santander. The authors would like to thank Lara de Mesa, Alicia
Sanchis and Dan Rosenstone for their comments and suggestions on the paper. Also special thanks to Juan
Vázquez, former member of the Public Policy team.
This article is the exclusive responsibility of the authors and does not necessarily reflect the opinion of the Banco
de España
Alejandra Kindelán and Nick Greenwood (*)
AN OVERVIEW OF THE INDEPENDENT COMMISSION ON BANKING
REFORMS – MOTIVATIONS, MEASURES AND LIKELY IMPACT


BANCO DE ESPAÑA 33 ESTABILIDAD FINANCIERA, NÚM. 22
AN OVERVIEW OF THE INDEPENDENT COMMISSION ON BANKING
REFORMS – MOTIVATIONS, MEASURES AND LIKELY IMPACT
The economic crisis that has gripped the world is now about to enter its sixth year. The scale
and depth of disruption to economic activity has been widespread and rapidly evolving.
Government support to the financial sector helped to avoid a systemic collapse but also
contributed to a rapid deterioration in public finances, exacerbating a cyclical decline and
drawing attention to underlying spendthrift policies, resulting in sovereign debt crises in
some eurozone countries.
Against a backdrop of deteriorating economic activity, continued liquidity stress and
regulatory changes, banks have found it increasingly difficult to fulfil financial intermediation
roles. Deteriorating asset quality (both public and private) and regulatory pressures, have
constrained banks’ ability to provide crucial credit needed to support the economic recovery.
The challenge facing policymakers is therefore threefold:
i) How to ensure the banking sector does not contribute to the build-up of
unsustainable economic bubbles, which could precipitate a future crisis?
ii) How to avoid the need for future taxpayer support to the banking sector?
iii) How to solve the above two challenges without inhibiting banks’ vital financial
intermediation role and prolonging the recovery from the current crisis?
The objective of this article is to provide: an overview of the background and motivations
for the UK’s Independent Commission on Banking (ICB); an explanation of the key
recommendations; a high-level evaluation of its likely impact.
Section 2 of this article sets the ICB within the overall perspective of wider international and
national developments. Section 3 explains the UK-specific motivations for the ICB reforms
and provides an overview of the overall approach. Section 4 sets out in detail the specific
proposals of the ICB measures with regard to financial stability. Section 5 provides an overall
evaluation of the likely impact of the ICB measures considering both theoretical and practical
implementation challenges. The final section provides a summary of the key messages.
The international response to these challenges has been led by the G-20 through the Basel
Committee on Banking Supervision (BCBS), the Financial Stability Board (FSB) and the
International Monetary Fund (IMF).
Most of the international regulatory effort to date has focussed on trying to address the first two
challenges i.e. putting in place regulation to avoid a future crisis. However, there is increasing
recognition that more needs to be done to secure the recovery from the current crisis.
The key elements of the international response include:
— Enhancing prudential regulation via the Basel III agreement to increase banks’
buffers of capital and liquidity. Such regulation is primarily designed to
1 Introduction
1.1 THE BANKING SECTOR
AND THE CRISIS
2 International and
regional regulatory
developments
2.1 THE INTERNATIONAL
RESPONSE

BANCO DE ESPAÑA 34 ESTABILIDAD FINANCIERA, NÚM. 22
counter-balance the build-up of unsustainable leveraging and to increase
banks’ ability to weather periods of heightened stress.
— Addressing the underlying moral hazard problem by introducing crisis
management frameworks designed to facilitate the failure of any bank
without the need for recourse to public funds and the spreading of
systemic risk.
— Improving micro and macro supervision to better foresee emerging risks in the
financial sector and to be able to take early measures to address them.
The response to date has primarily focussed on enhancing regulation and supervision of
the traditional banking sector. However, there is also a need for regulators to take a wider
view of risks emanating from non-traditional banking sources, such as the so-called
shadow banking sector (loosely defined by the FSB as “credit intermediation involving
entities and activities outside the regular banking system”1). As regulation of the banking
sector increases so do incentives for arbitrage and it is therefore important that these risks
are appropriately addressed.
This overall approach can broadly be described as an attempt to address market failures
by adapting regulation to the existing system. The objective is to better identify and
measure the build-up of risks, ensure that appropriate regulatory measures are taken to
penalise risky behaviour and make those responsible for taking systemic risks bear the
consequences of their actions.
So far there has been significant activity and many standards have now been defined at an
international level. However, some crucial elements are still to be released (most notably
the European Commission’s Crisis Management framework) and some aspects still need
further enhancement (such as a harmonisation of risk-weighted assets). A particular
challenge for the banking sector is to correctly assess the implications of the various
different changes in the regulatory environment and make clear decisions about future
business strategy.
The process of transposing these international standards into regional and national
legislation is now starting to take place, though progress has been disjointed with some
countries advancing further than others. Some countries (or regions) – where the impact
on the banking sector has been especially pronounced – have also introduced their own
additional national initiatives. One of the key challenges is to ensure that implementation
is even-paced and geographically consistent and that individual national initiatives do not
lead to the creation of an unlevel-playing field, which could complicate the activity of
cross-border banks and create potential incentives for arbitrage.
To date these additional national measures can de divided into two groups.
By far the most common, are regional/national initiatives that broadly follow the overall
shape of the international regulatory approach. These measures typically extend certain
elements of the existing framework or include specific additions to take account of national
and regional circumstances.
1 http://www.financialstabilityboard.org/publications/r_110412a.pdf.

BANCO DE ESPAÑA 35 ESTABILIDAD FINANCIERA, NÚM. 22
In the United States, the Dodd-Frank Reform will introduce 243 rules over the coming
years and represents a major overhaul of the US financial sector. A number of the
proposed changes follow the broad elements of the international reform but with US
specific applications. Some elements also go much further, such as the Volcker Rule
(see below).
Similarly in Europe, whilst the European Commission is aiming for a consistent
implementation of Basel III, requests are being made to introduce EU-specific nuances.
The European Commission is also developing its version of a crisis management
framework. This framework is likely to closely follow the standards set out by the FSB but
with some European-specific additions, such as a proposal for a voluntary ex-ante
agreement for intra-group support or additional mechanisms for early intervention (such as
the appointment of a special manager). The European Union is also considering the
application of an EU-wide Financial Transactions Tax (FTT), which has not yet received the
full support of the international community. An FTT would be aimed at disincentivising
high-frequency transactions and recuperating some of the fiscal costs of bank rescues.
Individual European countries have also implemented their own initiatives. For example,
in 2010, Germany, France and the UK publically committed to introducing direct bank
taxes with flexibility to differ on specific design elements. In Spain, measures were
introduced in 2011 to increase the capital requirements for Spanish banks. The law
required that listed Spanish banks hold core capital of 8% of risk-weighted assets
(RWAs), increasing to 10% for banks that have less than 20% of their capital listed and
have a wholesale funding dependency of over 20%. Meanwhile in 2011, Germany
introduced the Bank Restructuring Act, which amongst other things introduced two new
voluntary restructuring proceedings and amendments to the existing German Banking
Act, which significantly broaden the powers of BaFin to execute a rapid bridge
bank resolution.
However, a small number of jurisdictions have opted to take an alternative approach.
Instead of attempting to address market failures within the current system, these
jurisdictions have instead looked to reform the structure of the system itself.
This is true for certain elements of the United States’ Dodd-Frank reform, which contains
the proposal to introduce the Volcker Rule. In simple terms the rule would prevent US-
headquartered banks (and those non-US banks that trade with them) from engaging in
proprietary trading and would therefore introduce a structural change in the operation of
some US banks. It would aim to reduce speculative trading, which it regards as non-
economically viable and volatility enhancing.
More recently, the European Commissioner for Internal Markets and Services Michel
Barnier has announced the creation of a High-level Expert Group on reforming the structure
of the European banking sector. The Expert Group been tasked to consider the need for
further structural reform in Europe and will evaluate measures taken by the United States
and the United Kingdom’s Independent Commission on Banking.
The United Kingdom is the country that has perhaps gone furthest in undertaking its own
national measures that are independent of the wider international agenda. To some extent
this is unsurprising. The UK’s financial sector was one of the worst affected by the crisis.
Furthermore, together with the US, the UK has long been regarded as being something of
a trendsetter in the financial regulation sphere.
2.2 FINANCIAL REGULATORY
REFORM IN THE UK
BANCO DE ESPAÑA 36 ESTABILIDAD FINANCIERA, NÚM. 22
Aside from the recommendations of the ICB, which will be discussed in more detail in the
following sections, the UK has introduced a wide range of measures seeking to address
the particularly pronounced banking crisis that it experienced.
These measures include:
— Reform of the previous “tri-partite” regulatory system (introduced in 1997),
where supervision was divided between the Bank of England, Financial
Services Authority (FSA) and HM Treasury. The reforms will see the dismantling
of the FSA, the transfer of day-to-day macro-supervisory responsibilities to
the Bank of England through the Financial Policy Committee, the creation of a
Prudential Regulatory Authority responsible for the prudential regulation of
banks, and the establishment of a Financial Conduct Authority to cover
markets and consumer protection. In the case of taxpayer funds being
required, increased powers will also be given to the Chancellor. The reform
recognises failures in the UK financial regulatory approach prior to the crisis.
The objective is to better integrate supervision, making clearer the lines of
responsibility and increasing the focus on identifying the development of macro-
fiscal risks.
— The creation of a Special Resolution Regime through the 2009 Banking Act.
The Special Resolution Regime sets out specific statutory objectives for
resolution of banks, as well as establishing a toolkit of powers for authorities
to use in resolution. Tools include the ability to accelerate property transfers to
private purchasers, the power to establish a bridge bank, the power to take
an institution into temporary public ownership, as well as a modified bank
insolvency procedure to close a failing bank and facilitate payment or transfer
of insured depositor claims.
— The introduction of a bank levy on banks’ total liabilities. The levy is designed
to recuperate some of the fiscal costs of the crisis and to encourage banks to
choose less risky forms of borrowing by excluding protected retail deposits
and halving the tax rate for long-term debts. The first £20bn of taxable
liabilities are excluded from the levy, in part to recognise the lower systemic
risk posed by smaller financial institutions.
However, the Independent Commission on Banking’s recommendations are without doubt
the clearest example of how the UK has adopted an approach that goes beyond and in a
different direction to the current international consensus on financial regulation.
The rationale for establishing the ICB was to address what the Chancellor of the Exchequer,
George Osborne, describes as the “British dilemma”.
On the one hand it is vital for the UK that it does not lose its strength in financial services.
The UK financial sector makes an important contribution to the UK economy’s growth
and job creation, as well as to fiscal revenue. In 2010, the financial sector accounted for
approximately 10% of UK GDP and employed approximately 1 million people. Meanwhile
some 11% of fiscal revenues in year 2009/10 were collected from the financial sector.2
3 The ICB Proposal
3.1 THE “BRITISH DILEMMA”
2 http://www.thecityuk.com/assets/Reports/Economic-Trends-Series/Key-facts-about-UK-FS.pdf.

BANCO DE ESPAÑA 37 ESTABILIDAD FINANCIERA, NÚM. 22
On the other hand, as the crisis has shown, the financial sector is a major risk factor for
the UK economy and as much as the financial sector has been a significant plus for public
finances in normal economic times, it has the potential to be a significant negative
in crisis.
A recent report by the National Audit Office3 estimates that at its peak, total explicit
Government support to the UK banking system amounted to £1.2 trillion including taxpayer
support to specific banks and support to the financial sector as a whole. Whilst some of
this support may yet be recouped through sale of Government stakes in publically-owned
banks it is clear that this scale of public sector support is highly undesirable both in terms
of its long-term impact on public finances and its moral hazard implications.
Furthermore, the financial crisis starkly called into question the availability and stability of
essential banking services in the UK. This was most graphically illustrated by the queues
that formed outside branches of Northern Rock in September 2007 and the problems that
confronted customers in accessing bank accounts.
In straightforward terms the challenge that the Chancellor tasked the ICB to resolve was,
“how Britain can be home to one of the world’s leading financial centres, without exposing
British taxpayers to the massive costs of those banks failing”?4
In June 2010, the British Government established the Independent Commission on
Banking headed by Sir John Vickers, a former Chief Economist of the Bank of England, to
answer this question.5
The Government set the formal terms of reference6 for the Commission as being to consider
structural and non-structural measures to reform the banking sector and promote competition
with a view to: reducing systemic risk; mitigating moral hazard; reducing the likelihood and
impact of firm failure; and ensuring effective competition across sectors and sizes of firms.
3.2 THE INDEPENDENT
COMMISSION ON BANKING
RELATIVE SIZE OF NATIONAL BANKING SECTORS AND FISCAL POSITION (a) CHART 1
Austria
Belgium
Canada
Denmark
Finland
France
Germany
Greece
Ireland
Italy
Japan Netherlands
Portugal
Spain
Sweden
United Kingdom
United States
0
100
200
300
400
500
600
-4 -2 0 2 4 6 8 10 12
2010 structura (per cent of GDP)
Bank a
ssets
(b
) (p
er
cent
of
GD
P)
SOURCES: World Economic Outlook, IMF, April 2012 and Global Financial Stability Report, IMF, September 2011.
a Page 28: http://cdn.hm-treasury.gov.uk/budget2012_complete.pdf.b Total assets of commercial banks, including subsidiaries. For Austria, the data is from Austria National Bank. For Ireland, the data are from Central Bank of Ireland.
For Portugal, the data are from Bank of Portugal.
3 The Comptroller and Auditor General’s Report on Accounts to the House of Commons: The financial stability
interventions, National Audit Office, July 2011. http://www.nao.org.uk/publications/1012/hmt_accounts_2010-2011.
4 Banking Reform Statement of the Chancellor of the Exchequer, 19 December 2011. http://www.hm-treasury.gov.
uk/statement_chx_191211.htm aspx.
5 The other ICB panel members were: Claire Spottiswoode, Martin Taylor, Bill Winters and Martin Wolf.
6 http://bankingcommission.independent.gov.uk/terms-of-reference/.

BANCO DE ESPAÑA 38 ESTABILIDAD FINANCIERA, NÚM. 22
In April 2011, the ICB published its first draft proposals.7 Following several months of
further consultation and consideration, the Commission published its final report in
September 2011.8
The final report made two sets of recommendation: a first set aimed at addressing the
financial stability issues identified earlier; and a second set aimed at boosting competition
in the UK financial sector. The remainder of this article will focus on the recommendations
related to financial stability and will not refer to those on competition, although this is not
to underplay the importance of the latter.
The measures proposed by the ICB to improve financial stability are organised around
two pillars:
1) Increasing the ability of banks that provide critical retail services to absorb
losses: aimed at increasing the resilience of such banks in times of
heightened stress.
2) Separating critical retail banking activities from other banking operations –
through the creation of a ring-fence: aimed at insulating critical retail services
from possible contagion, whilst permitting non-critical banking activities to
fail without the need for public support.
These two pillars constitute two routes to addressing the same problem:
— The increase in loss-absorbing requirements essentially extends existing
international agreements by increasing some minimum standards (e.g.
capital, which other countries have also done) and by bringing forward
certain measures (e.g. proposals to bail-in bondholders). In this regard, the
measures are not qualitatively different from the approach being pursued
elsewhere.
— By contrast, the proposal for a ring-fence is a radically different approach to
the above. Instead of attempting to apply regulation to the existing system, the
ring-fence is an attempt to reform the system itself. The nearest precedent is
the Glass-Steagall Act established in 1933 following the Great Depression
(see text box 1).
In December 2011, the UK Government announced its official support for the measures
proposed by the ICB.9 It published some initial reactions about how the Government
would seek to implement the recommendations and identified specific areas that would
need further analysis. The Government also committed to publishing a White Paper in
spring 2012 which will set out how the Government would practically put the
recommendations into legislation during the course of the current Parliament.
7 http://bankingcommission.s3.amazonaws.com/wp-content/uploads/2010/10/Interim-Report-publication-JV-
opening-remarks-check-against-delivery.pdf.
8 http://bankingcommission.s3.amazonaws.com/wp-content/uploads/2010/07/ICB-Final-Report.pdf.
9 http://cdn.hm-treasury.gov.uk/govt_response_to_icb_191211.pdf.
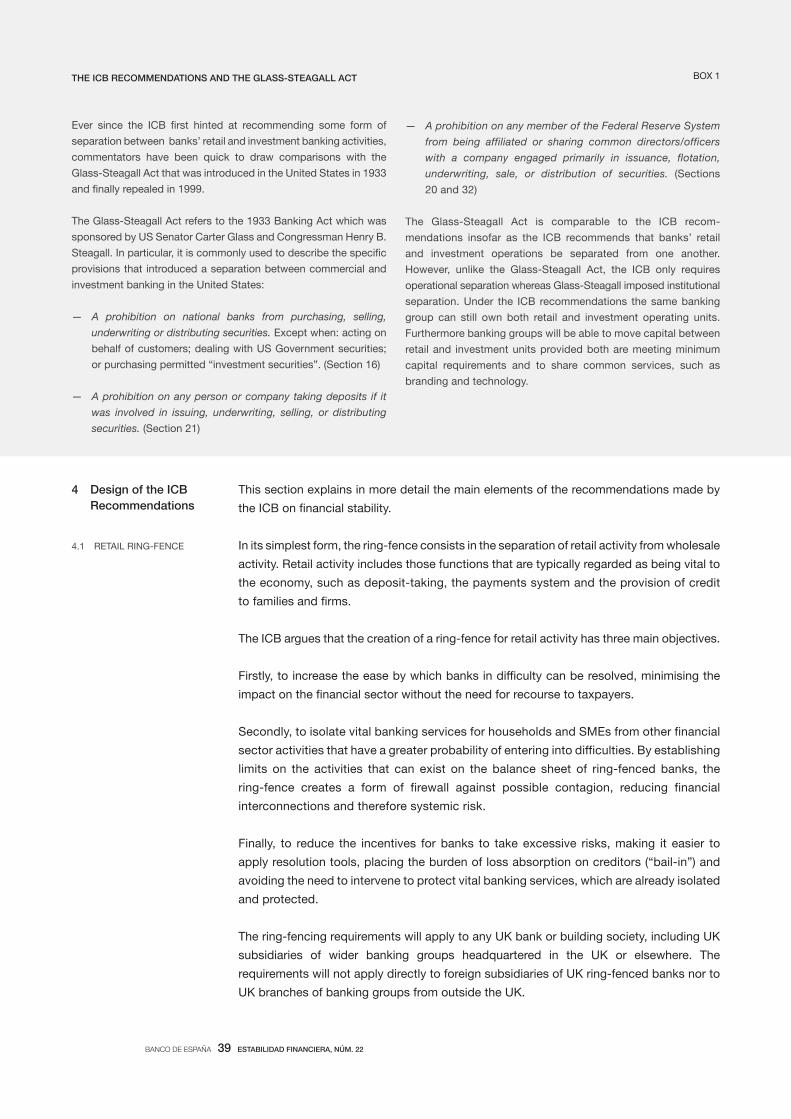
BANCO DE ESPAÑA 39 ESTABILIDAD FINANCIERA, NÚM. 22
THE ICB RECOMMENDATIONS AND THE GLASS-STEAGALL ACT
Ever since the ICB first hinted at recommending some form of
separation between banks’ retail and investment banking activities,
commentators have been quick to draw comparisons with the
Glass-Steagall Act that was introduced in the United States in 1933
and finally repealed in 1999.
The Glass-Steagall Act refers to the 1933 Banking Act which was
sponsored by US Senator Carter Glass and Congressman Henry B.
Steagall. In particular, it is commonly used to describe the specific
provisions that introduced a separation between commercial and
investment banking in the United States:
— A prohibition on national banks from purchasing, selling,
underwriting or distributing securities. Except when: acting on
behalf of customers; dealing with US Government securities;
or purchasing permitted “investment securities”. (Section 16)
— A prohibition on any person or company taking deposits if it
was involved in issuing, underwriting, selling, or distributing
securities. (Section 21)
— A prohibition on any member of the Federal Reserve System
from being affiliated or sharing common directors/officers
with a company engaged primarily in issuance, flotation,
underwriting, sale, or distribution of securities. (Sections
20 and 32)
The Glass-Steagall Act is comparable to the ICB recom-
mendations insofar as the ICB recommends that banks’ retail
and investment operations be separated from one another.
However, unlike the Glass-Steagall Act, the ICB only requires
operational separation whereas Glass-Steagall imposed institutional
separation. Under the ICB recommendations the same banking
group can still own both retail and investment operating units.
Furthermore banking groups will be able to move capital between
retail and investment units provided both are meeting minimum
capital requirements and to share common services, such as
branding and technology.
BOX 1
This section explains in more detail the main elements of the recommendations made by
the ICB on financial stability.
In its simplest form, the ring-fence consists in the separation of retail activity from wholesale
activity. Retail activity includes those functions that are typically regarded as being vital to
the economy, such as deposit-taking, the payments system and the provision of credit
to families and firms.
The ICB argues that the creation of a ring-fence for retail activity has three main objectives.
Firstly, to increase the ease by which banks in difficulty can be resolved, minimising the
impact on the financial sector without the need for recourse to taxpayers.
Secondly, to isolate vital banking services for households and SMEs from other financial
sector activities that have a greater probability of entering into difficulties. By establishing
limits on the activities that can exist on the balance sheet of ring-fenced banks, the
ring-fence creates a form of firewall against possible contagion, reducing financial
interconnections and therefore systemic risk.
Finally, to reduce the incentives for banks to take excessive risks, making it easier to
apply resolution tools, placing the burden of loss absorption on creditors (“bail-in”) and
avoiding the need to intervene to protect vital banking services, which are already isolated
and protected.
The ring-fencing requirements will apply to any UK bank or building society, including UK
subsidiaries of wider banking groups headquartered in the UK or elsewhere. The
requirements will not apply directly to foreign subsidiaries of UK ring-fenced banks nor to
UK branches of banking groups from outside the UK.
4 Design of the ICB
Recommendations
4.1 RETAIL RING-FENCE

BANCO DE ESPAÑA 40 ESTABILIDAD FINANCIERA, NÚM. 22
The ICB make a series of high-level recommendations regarding the separation of activities,
along two axes: the location and the height of the ring-fence.
The ICB make a distinction between the various types of services that can and cannot be
provided by ring-fenced and non-ring-fenced banks. Activities that do not fall into the
following categories are permitted activities, which can be provided by both ring-fenced
and non-ring-fenced banks.
The UK Government has indicated that it favours a flexible approach to setting the ring-
fence with only a limited amount of prescription regarding what ring-fenced banks can
and cannot do.
— Mandated activities can only be undertaken within the ring-fence. The ICB
defines mandated activities as services for which even a temporary interruption
would impose a significant economic cost and for which it is typically difficult
for customers to plan ahead. At a minimum this would include deposit-taking
from individuals and SMEs and providing overdrafts to individuals and SMEs.
The UK Government will evaluate whether provision of credit to households
and/or SMEs should also be mandated within the ring-fence. It will also
provide guidance on the definition of SMEs to be included in the ring-fence
and how to treat private banking services.
— Prohibited activities cannot be undertaken within the ring-fence. Prohibited
activities include services, which: make it significantly more difficult or costly
to resolve the ring-fenced bank; directly increase the exposure of the ring-
fenced bank to global financial markets; are not integral to the provision of
payments services or the direct intermediation function; in any other way
threaten the objectives of the ring-fenced bank. The ICB recommends that
prohibited activities include: services to financial institutions or to non-EEA
customers; services relating to secondary market activities; services that
require firms to hold regulatory capital against market risk and derivatives, or
other contracts which require capital to be held against counterparty risk.
— Ancillary activities can be undertaken if necessary for the efficient provision of
mandated and permitted services e.g. for the purposes of risk management,
liquidity management, or funding of non-prohibited services. The ICB also
recommends that limits be placed on the proportion of wholesale funding
permitted for a ring-fenced bank. The UK Government agrees that ancillary
activities may be necessary for the efficient provision of services, but it is
concerned that these activities should not dilute the ring-fence. It has also
committed to consider how to prevent ring-fenced banks from becoming
over-reliant on wholesale funding.
— The UK Government will evaluate the characteristics of financial institutions
that may be permitted as counter-parties to ring-fence banks. It will also
analyse the characteristics of prohibited products by reference to their
function and investigate the potential scope for including simple derivatives
and investment products within the ring-fence – for example, products
which provide insurance against interest or exchange rate risk. Finally, the
Government will look at ways to define the geographic scope of permitted
Location of the ring-fence

BANCO DE ESPAÑA 41 ESTABILIDAD FINANCIERA, NÚM. 22
services. The guiding principle will be that services should be assumed to
be prohibited, unless it can be shown that they do not jeopardise the
objectives of the ring-fence.
The height of the ring-fence refers to the degree of separation that the ring-fenced bank
should have from other entities within the same corporate group.
During its deliberations the ICB gave serious consideration to recommending full separation
of retail entities from wholesale entities (along the line of the Glass-Steagall Act). In the
end, the ICB concluded that full separation would involve a number of additional costs
with relatively limited additional benefits compared to an effectively imposed ring-fence. In
particular, the ICB noted that full separation could result in the possible loss of diversification
benefits as well as various benefits from economies of scale, such as shared infrastructure,
branding and information. Furthermore, in the case of an entity entering into difficulties, a
ring-fence approach would permit the sharing of surplus capital and liquidity between
entities in the same group. Finally, the ICB also noted potential legal impediments to full
separation from European law.
As a result of these deliberations, the ICB plumped for the ring-fence approach, advocating
a high degree of separation in legal, operational and economic terms between the ring-
fenced entity and the rest of the group.
— In terms of legal and operational separation, the ICB emphasises that authorities
should be able to isolate a ring-fenced bank from the rest of the group in a
matter of days. To this end they recommend that ring-fenced banks be separate
legal entities and that ring-fenced banks only be able to own financial institutions
conducting ring-fence activities. Regarding operational separation, the ICB
emphasises the importance of ensuring that the ring-fenced bank be able to
have an uninterrupted supply of essential operational services even when other
parts of the group face insolvency. The Government recommends that firms
consider use of service level agreements for provision of essential services and
provide services via operational subsidiaries on an arm’s length basis.
Height of the ring-fence
a Page 22: http://cdn.hm-treasury.gov.uk/govt_response_to_icb_191211.pdf.
Liquid assets Other liabilities
Unsecured SME and
personal lendingUnsecured debt
Unsecured
corporate lendingCorporate deposits
Commercial mortgages PLAC
Residential mortgages Equity/Capital
Overdrafts for SMEsand individuals
SME and individual
deposits (EEA)
Assets (restricted to EEA) Liabilites
Liquid assets Other liabilities
Unsecured SME and
personal lendingUnsecured debt
Unsecured
corporate lendingCorporate deposits
Commercial mortgages PLAC
Residential mortgages Equity/Capital
Non-EEA retail and
commercial assetsNon-EEA deposits
Trading book Trading book
PermittedPermitted
Mandated
Prohibitedfrom
ring-fence
Assets Liabilites
Ring-fenced bank Non-ring-fenced bank
WHAT THE BALANCE SHEET OF A RING-FENCED AND NON-RING-FENCED BANK MIGHT LOOK LIKE (a) CHART 2

BANCO DE ESPAÑA 42 ESTABILIDAD FINANCIERA, NÚM. 22
— In terms of economic separation, the ICB recommends inter alia that ring-
fenced banks be subject to regulatory requirements on a solo basis and that
intra-group transactions be conducted on a third party basis. In order to
ensure effective independence in decision making, the board of the ring-
fenced bank should be made up of mainly independent non-executives
tasked with maintaining the integrity of the ring-fence and that no more than
one member of the board of the ring-fenced bank may also sit on the board
of the parent or another member of the group.
The UK Government has signalled its agreement with the broad thrust of the
recommendations and will consider in detail how to practically implement them. In
particular, it will review the case for de minimis exemptions. This could permit certain
entities, which already have a high degree of resolvability and pose minimal systemic
risk, to be exempt from the ring-fencing requirements. The Government has indicated
that this may be the case for small entities. It will analyse the case for de minimis
exemptions for entities that undertake a small amount of either mandated or prohibited
services and for which the implementation of a ring-fence would pose a significant
additional cost. However, the Government is cautious of taking any measure that could
water down the ring-fence.
The second main pillar of the ICB recommendations is the proposal to significantly
increase the capacity of entities to absorb losses. The ICB propose a range of measures
to achieve this.
The ICB recommends that ring-fenced banks should be subject to capital requirements
that are greater than the international standards established by Basel III. They propose an
additional layer of Tier-1 capital, referred to as the “ring-fence buffer”. The buffer will not
apply to non-ring-fenced banks, to avoid harming the international competitiveness of the
UK’s investment banks.
— For large ring-fenced banks with a ratio of risk-weighted assets to UK GDP in
excess of 3%, they propose a ring-fence buffer of 3% of RWAs. Adding the
buffer to Basel III criteria, means that large ring-fenced banks in the UK should
have a total minimum common equity of 10% of RWAs.
— For smaller retail ring-fence banks (ratio of RWAs to GDP of between 1% and
3%), the ICB propose a ring-fence buffer of between 0% and 3%. This means
that small ring-fenced banks could have a total minimum common equity of
between 7% and 10% of RWAs.
These additional capital requirements are aimed at increasing ring-fenced banks’ ability to
weather periods of heightened stress and reduce their cost of resolution, therefore
providing greater insulation to vital banking functions. However, the ICB also note that
increased capital requirements could increase regulatory arbitrage incentives and
potentially encourage deleveraging, which will be discussed in more detail later.
Some industry participants have expressed concern that the ICB’s recommendations
would interfere with the operation of the various equity buffers. These buffers (Basel II
capital conversation buffer, counter-cyclical capital buffer, G-SIB surcharge) are intended
to run in addition to the hard regulatory minimum of 4.5% established by the Basel
Committee. They would provide a cushion that can be built up in normal times but also be
4.2 INCREASED LOSS
ABSORBING CAPACITY
Capital requirements

BANCO DE ESPAÑA 43 ESTABILIDAD FINANCIERA, NÚM. 22
temporarily run down in times of stress. Some industry participants expressed concern
that the ICB criteria would introduce a higher hard regulatory minimum and therefore limit
the operation of the buffers. The ICB has clarified that the ring-fence buffer is exactly that
and should not be seen as raising the hard regulatory minimum.
In line with Basel III, the ICB also favours the introduction of a leverage ratio. The leverage
ratio is designed to avoid some of the difficulties associated with risk-weighting of assets,
which can suffer from inaccuracies. Basel III established a binding minimum ratio of Tier 1
capital to total exposures of 3% to be in place by 2018.
The ICB proposes that:
— All UK-headquartered banks should maintain a Tier 1 leverage ratio of a least
3%. This should be met on a solo basis by ring-fenced banks.
— All ring-fenced banks with a ratio of RWAs-to-UK GDP of between 1% and
3% should have a minimum leverage ratio that increases on a sliding scale to
a maximum of 4.06%.
In accordance with wider international developments, the ICB proposes that UK regulatory
authorities be given statutory bail-in powers, allowing them to impose losses on the
creditors of a failing bank and reducing taxpayer exposure.
The ICB recommends that:
— Authorities are given a “primary” bail-in power allowing them to bail-in long-
term unsecured debt, either by write down or conversion into equity. The
power would be primary insofar as the ICB view this type of debt as being the
most practicable for resolution authorities to impose losses.
— Authorities are given a “secondary” bail-in power allowing them to bail-in all
other unsecured liabilities if the exercise of the primary bail-in power does not
prove sufficient. The ICB propose that this power be secondary, recognising
that imposing losses on certain types of short-term funding and derivatives
could increase disruption in financial markets.
— The existing creditor hierarchy should be maintained as far as possible and
bail-in should be applied retroactively to existing debt already issued.
— Bail-in powers should extend to non-deposit taking entities within banking
groups.
The ICB recommends that all insured deposits (regardless of whether they are in the ring-
fenced or non-ring-fenced bank) should rank ahead of other creditors in resolution. The
ICB argue that this approach would reflect the limited capacity and ability of insured
depositors to exert market discipline on banks and would increase the incentives of other
unsecured creditors (who would normally rank pari passu with insured depositors in
liquidation) to be more effective in exerting discipline. Such an approach would also reduce
the potential losses to the Financial Services Compensation Scheme (FSCS) and further
limit the possibility of recourse to the taxpayer in the case of a systemic event in which
banks were temporarily unable to fund the scheme.
Leverage ratio
Bail-in
Depositor preference

BANCO DE ESPAÑA 44 ESTABILIDAD FINANCIERA, NÚM. 22
The ICB’s proposal to introduce a bail-in regime that prioritises certain liabilities over
others has the potential to increase incentives for banks to concentrate on issuing liabilities
that would not be affected by bail-in (e.g. secured debt or protected deposits or short-term
funding). These liabilities would presumably be relatively cheaper to issue as investors
would not be affected by a possible bail-in.
In anticipation of this problem, and to avoid a situation in which the bail-in tool would be
blunted by a lack of bail-inable liabilities, the ICB recommends that banks be required to
hold a minimum amount of “primary loss absorbing capacity” (PLAC). This is defined as
either regulatory capital or long-term unsecured debt that is capable of being subject to the
primary bail-in power. The ICB suggests that for the biggest G-SIBs and large ring-fenced
banks, the minimum level of PLAC should be set at 17% of RWAs. According to the ICB’s
analysis, this would constitute a level of loss-absorbency capable of covering losses
suffered by banks in the majority of previous crises. In particular, the ICB recommends that:
— UK-headquartered banks that are subject to a 2.5% G-SIB surcharge,10 and
all ring-fenced banks with a ratio of RWAs to UK GDP of 3% or more, should
be required to have PLAC of at least 17% of RWAs
— UK-headquartered banks that qualify as G-SIBs but have a G-SIB surcharge
of below 2.5%, and all ring-fenced banks with a ratio of RWAs to UK GDP of
between 1% and 3%, should be required to have PLAC on a sliding scale
of between 10.5% and 17% of RWAs.
Furthermore, the ICB recommends that these requirements apply to UK-headquartered
G-SIBs at the consolidated group level and to UK-domiciled banks on a solo basis.
Primary loss-absorbing
capacity
LOSS ABSORBENCY CAPACITY IN RESOLUTION FOR A RING-FENCED AND NON-RING-FENCED BANK (a) CHART 3
Equity 'hard' minimum requirement
Equity 'hard' minimum requirement
Equity - CCB Equity - CCB
Non-equity capital Non-equity capital
Bail-in bonds Bail-in bonds
Other liabilities (subject to secondary bail-in)
Other liabilities (subject to secondary
bail-in)
Insured deposits
Insured deposits
Retail bank Investment bank
Basel III = 4.5% Basel III = 4.5%
Basel III minimum CCB (2.5%) +
(3%) = 5.5%
Basel III minimum CCB (2.5%) +
(2.5%) = 5%
Basel III = 3.5% Basel III = 3.5%
PLAC to 17% = 3.5%
PLAC to 17% (4%) +
resolution buffer
Total PLAC (below) = 17%
of RWAs
Total PLAC (below) = 20%
of RWAs
G-SIB surchagering-fence buffer
a Page 120: http://bankingcommission.s3.amazonaws.com/wp-content/uploads/2010/07/ICB-Final-Report.pdf.
10 In November 2011, the Basel Committee on Banking Supervision (BCBS) approved measures to apply a
common equity surcharge on certain global systemically important banks (“G-SIBs”). The surcharge ranges
from an additional 1% to 3.5% to be applied on top of the Basel III 7% requirement in proportion to the degree
of systemic risk posed by banks, determined according to an indicator-based methodology.

BANCO DE ESPAÑA 45 ESTABILIDAD FINANCIERA, NÚM. 22
Imposing PLAC against group wide assets would aim to reduce the impact of the failure of
non-UK operations on UK financial stability and taxpayers.
In addition to the PLAC requirements, the ICB also propose that supervisors of UK-
headquartered G-SIBs and ring-fenced banks should have the discretion to impose an
additional loss absorbing capacity of up to 3% of RWAs. Supervisors could apply this
“resolution buffer” if they have concerns about the resolvability of a particular institution
and would be free to choose whether the buffer should take the form of capital or long-
term unsecured debt.
The UK Government has expressed its support for the loss absorbency proposals as a
whole. In certain areas the Government makes specific observations or commitments to
further work:
— On the ring-fence buffer, the Government believes that capital requirements
should not be regarded as additional to any G-SIB surcharge (only the higher
of the ring-fence buffer or the surcharge should apply) and that internationally-
agreed G-SIB/L-SIB criteria could be used to calibrate the appropriate size
of the buffer.
— On the leverage ratio, the Government will analyse whether different minimum
leverage ratios are needed for banks with different business models and
whether a buffer approach should be taken towards the application of the
leverage ratio.
— On bail-in, the Government will undertake further analysis to determine which
liabilities should fall under the primary and secondary bail-in power. It will
review potential perverse incentives of providing a more favourable treatment
to short-term funding and will analyse whether bail-in should apply retroactivity.
— On depositor preference, the Government will analyse related issues including
the potential for arbitrage, the possibility of flights of certain types of creditors
and potential cost and supply implications for non-protected instruments. It
will also analyse different scopes of depositor preference, which may be wider
or narrower than the ICB’s proposal for an insured depositor preference.
— On primary loss absorbing capacity, the Government will analyse whether
17% is the appropriate number for the largest institutions. The Government
agrees that PLAC should be applied on UK-headquartered G-SIBs’ global
operations, but will consider exemptions for non-UK operations that can be
shown not to pose a risk to UK financial stability. The Government also
believes that PLAC requirements should function on a buffer basis rather than
as a hard regulatory minimum.
The following section looks at the likely impact of the ICB recommendations in addressing
the three challenges defined by this article at the beginning of this paper:
i) How to ensure the banking sector does not contribute to the build-up of
unsustainable economic bubbles, which could precipitate a future crisis?
ii) How to avoid the need for future taxpayer support to the banking sector?
Resolution buffer
The UK Government’s initial
response
5 Evaluation

BANCO DE ESPAÑA 46 ESTABILIDAD FINANCIERA, NÚM. 22
iii) How to solve the above two challenges without inhibiting banks’ vital financial
intermediation role and prolonging the recovery from the current crisis?
The section is divided into two parts: a first part, which highlights some of the challenges
facing the UK Government and the banking sector in implementing the ICB
recommendations; a second part, which draws out some high-level conclusions about the
extent to which the recommendations will deliver on their objectives.
The ICB reforms have already generated a significant amount of discussion. This article
seeks to draw the reader’s attention to some of the key issues that have been raised.
In evidence sessions conducted by the UK Parliament, senior banking figures acknowledged
that the reforms proposed by the ICB were essentially a “done deal”.11 However, they also
emphasised that the implementation of the recommendations was likely to prove complex
and have a significant bearing on the cost and effectiveness of the ICB’s measures.12
This section identifies some of the challenges that the UK Government will need to get
right over the coming years as it attempts to put the ICB recommendations into legislation.
The challenge for the UK Government is to decide which activities should be mandated,
permitted or prohibited, so as to ensure both ring-fenced and non-ring-fenced entities are
economically efficient and viable. The UK Government will need to strike the right balance
to ensure that entities on both sides of the fence have:
— Balance sheets that make sense. Assets and liabilities need to be able to be
balanced effectively. For example, if mandated liabilities are insufficient to
match mandated assets, then the ring-fenced bank will either need to reduce
its mandated assets (which are presumably useful activities), or fund itself
through other non-mandated liabilities, which could increase its exposure to
wholesale market volatility.
— The ability to provide a range of cost efficient services to customers. SMEs
may find themselves in a situation where they need to visit a ring-fenced bank
for vital basic banking services (i.e. to deposit money) and a non-ring-fenced
bank to access important hedging facilities such as exchange rate and interest
rate hedges. There is therefore a potential opportunity cost between permitting
the retail-ring fence bank to engage in certain activities, such as client hedging,
which would involve exposure to small amounts of market volatility and being
able to provide a cost-efficient, low hassle range of services to the client.
— A sufficient degree of diversification. The range of activities that ring-fenced
banks are allowed to engage in should not be so limited that they are exposed
to concentration risks from certain sectors.
The UK Government has indicated that it intends to take a flexible approach, defining
only a small number of mandated and prohibited services for ring-fenced banks. This
would seem to be the most sensible approach for ensuring that the entities are
economically viable.
5.1 PRACTICAL
IMPLEMENTATION
CHALLENGES
Location of the ring-fence
11 Pages 20 & 24: http://www.parliament.uk/documents/lords-committees/economic-affairs/reporticb/ResponseI
CBReport.pdf.
12 See for example pages 20 & 26, Ibid.

BANCO DE ESPAÑA 47 ESTABILIDAD FINANCIERA, NÚM. 22
Another related challenge for the UK Government is to determine how high to place the
ring-fence. The difficulty is to achieve the right balance between allowing some degree of
intra-group connection so groups are able to benefit from economies of scale and the
possibility of sharing excess capital and liquidity in times of stress, whilst ensuring that
the ring-fenced bank is sufficiently separable and resolvable. In this regard one of the key
practical issues that still needs clarification is what to do with shared infrastructure such
as branches and ATM machines.
A more intangible problem is how to bring about changes in culture within the governance
of the ring-fenced bank. One of the key conclusions from the crisis is the need to introduce
a more prudent management culture, focussed on the identification and careful control of
risk. The ICB recommends that as a starting point the board of the ring-fenced bank should
have a majority of independent non-executives and that a maximum of one board member
from the parent or another entity within group may be allowed to sit on the board of the
ring-fenced bank.
On a practical basis, this could present several challenges:
— Ensuring that non-executive directors are sufficiently well-qualified. If non-
executives are to impose a culture of prudence in the ring-fenced bank they
need to be able to effectively carry out their challenge function. This means
that they need to have a deep understanding of how the bank works and
confidence to challenge its management. There is also a question as to
whether there are currently a sufficient number of non-executives well placed
to carry out the function.
— Ensuring that there is congruence between the ring-fenced bank and the rest
of the group. The proposal to limit participation of other group members on
the board of the ring-fenced bank is designed to reduce influences from the
group, which may be more focussed on maximising returns. However, limiting
group involvement also comes with potential costs. It may make the integration
of shared group services and policies more complicated. Furthermore, if
majority shareholders see that they will be deprived of their ability to control
investee banks, this could serve as a barrier to entry for new investors in the
UK banking sector.
Although a number of the ICB’s loss absorbency proposals broadly follow the standards
set out at an international level, there are some specific elements that are likely to
complicate practical implementation:
— Proposal for a minimum-level of Primary Loss Absorbing Capacity – unlike the
FSB, the ICB proposes that banks should hold a minimum level of capital and
primary bail-inable debt. The objective is to avoid incentives for banks to
issue secured debt or other forms of debt that would not be affected by bail-
in. However, for banks which are primarily deposit-funded, the proposal could
have the perverse effect of requiring such banks to increase their financing
from wholesale markets so as to meet the minimum requirements.
— Depositor preference. The proposal to introduce a depositor preference also
raises implementation challenges. On the one hand depositor preference may
provide increased reassurance to depositors, reducing the probability of a
Height of the ring-fence
Loss-Absorbency
BANCO DE ESPAÑA 48 ESTABILIDAD FINANCIERA, NÚM. 22
sudden loss of liquidity resulting from depositor runs in resolution. However,
it also increases monitoring incentives for senior debt classes and this in turn
may lead investors in senior debt to look to reduce their potential exposures
in a resolution by moving into deposits or secured debt not affected by bail-in.
This could have the perverse effect of increasing depositors’ potential
exposure to losses in resolution, as there could be less of a cushion of senior
debt to absorb losses ahead of them. A depositor preference could also
reduce depositors’ incentives to make prudent choices between financial
institutions of varying solvency.
As was highlighted at the start of this article, the ring-fence proposal is fundamentally
different in approach to international regulatory reform to date. However, ring-fenced
and non-ring-fenced entities will continue to operate in a financial sector which is
intrinsically international and will continue to be subject to international regulatory
agreements. This has the potential to present significant implementation challenges in
a number of areas:
— Bail-in: Although the proposal for bail-in has been endorsed at an international
level by the FSB, many of the technical details have not been finalised (for
example on retroactivity, scope of depositor preference). The ICB’s proposals
are more detailed and include elements such as a minimum quantity of bail-
inable debt and retrospective application, which go beyond international
standards. This could raise potential funding costs for UK banks, in particular
if the UK bail-in regime is either more advanced, more complicated or seen to
expose investors to higher risks than the rest of the international sector.
— Crisis Management: UK systemically important financial institutions (SIFIs) will
be subject to the same crisis management requirements established by the
FSB as other global SIFIs. This means that in October 2012 the UK authorities
will need to conduct assessments of the resolvability of UK SIFIs and may be
required to make recommendations on structural changes to improve their
resolvability. This could present potential difficulties given that such changes
would also need to be consistent with the direction of the ICB reform.
The ICB recommendations are a mix of two different solutions to the same problem.
The proposals for increased loss-absorbency broadly follow the international approach
to regulation taken to date. That approach is to identify risk, measure it and take action to
counter it, so that banks better take into account and address the risks of their activities.
It is essentially a market-based solution, focussed on the identification of negative
externalities and the creation of tailored responses, which maintain the overall efficiency of
the system and ensure consistency across the financial sector (both banking and non-
banking sectors). In this sense, the ICB recommendations regarding loss-absorbency are
quantitatively but not substantially qualitatively different from the international approach.
Therefore when evaluating the effectiveness of the loss-absorbency elements of the ICB
reforms, the issue that needs to be considered is whether the ICB chose the right level.
The key question is whether the benefits associated with an increased capacity to
withstand future crises are commensurate to the incremental cost imposed on banks’
funding from having to hold additional capital, more longer-term funding and bail-inable
debt and the possible loss of competitiveness that this may entail.
International consistency
5.2 WILL IT WORK?

BANCO DE ESPAÑA 49 ESTABILIDAD FINANCIERA, NÚM. 22
The proposal to establish a ring-fence is fundamentally a different approach. It is a structural
reform, which instead of adapting regulation to emerging risks, attempts to change the
system itself to avoid the emergence of risks. It is essentially an interventionist solution
based on prohibition rather than the creation of incentives to avoid certain activities. By
significantly inhibiting or totally prohibiting certain risky activities in certain organisations,
it is possible that such an approach is more effective in limiting any residual risk posed by
certain activities. However, it also interferes with the efficiency of the existing system and
may disrupt the provision of associated socially useful activities. It is therefore qualitatively
different from the international approach to regulation to date.
Therefore when evaluating the effectiveness of the ICB’s ring-fencing proposals, the
relevant question is not whether the ICB chose the right level, but whether the approach
itself makes a substantial improvement to addressing the underlying problems given the
implementation and operating costs that will be incurred in implementing the reform.
The UK Government believes that the reforms will deliver significant benefits to the UK
economy. The Government’s analysis assumes that the ICB reforms could reduce the
probability of a future crisis by 10% (by moderating financial sector risk and increasing
bank resilience) and reduce the GDP cost of a crisis by 25% (by protecting vital banking
services and enhancing bank resolution powers). This would yield an incremental economic
benefit of £9.5bn13 p.a., which is roughly five to ten times higher than their estimate of the
GDP costs of the ICB’s recommendations (see below).
This section now briefly evaluates the likely benefits offered by the two pillars of the ICB
reform. It considers the extent to which each approach contributes to addressing the three
questions identified at the start of the article:
How to ensure the banking sector does not contribute to the build-up of unsustainable
economic bubbles, which could precipitate a future crisis?
Loss-absorbency measures: Additional capital and leverage ratios proposed by the ICB
will help to limit future crises. By requiring ring-fenced banks to hold more capital against
their activity, the ICB recommendations act as a counterweight against unsustainable
lending. Furthermore, the bail-in proposals increase incentives for banks’ creditors
(especially in the non-ring-fenced banks) to be more prudent in their approach to
management of risk as they will no longer be excluded from the costs of failure.
The point, however, is whether the ICB have balanced the marginal benefit of requiring
additional capital to the marginal costs of holding more capital. In particular, it is not clear
that retail activity should be penalised through higher capital requirements than non-retail
activity. Retail activity, like all banking activity, carries a degree of risk. However, this risk is
typically low reflecting the straightforward and transparent nature of the activity and slow
deterioration rates of retail bank’s balance sheets even in deep and sudden financial crises
such as in 2008.
Ring-fence measures: The main way in which ring-fence proposals contribute to
reducing the probability of a future crisis is by making clearer the separation between
ring-fenced and non-ring-fenced banks and therefore further reinforcing the removal of
the Government guarantee for those banks outside of the ring-fence. However, on the
13 Chapter 5: http://cdn.hm-treasury.gov.uk/govt_response_to_icb_191211.pdf.

BANCO DE ESPAÑA 50 ESTABILIDAD FINANCIERA, NÚM. 22
flipside, the recommendations also increase moral hazard within the ring-fenced bank.
The concentration of economically critical functions within the ring-fence makes it
unthinkable that a ring-fenced bank would be allowed to fail.
Furthermore, whilst ring-fenced banks are limited in some of the risky activities that they
can undertake; the ring-fencing solution does little to address the potential for non-ring-
fenced banks to continue taking significant risks. In order to maintain the competitiveness
of UK wholesale banking the ICB proposals permit non-ring-fenced banks to have lower
levels of capital than ring-fenced banks. It is true the creditors of such institutions will be
vulnerable to pay the price for excessive risks, but this is a result of the loss-absorbency
measures and not the structural reform itself.
How to avoid the need for future taxpayer support to the banking sector?
Loss-absorbency measures: Loss-absorbency measures proposed by the ICB will reduce
the need for taxpayer support to the banking sector. Increased levels of capital and the
possibility to bail-in creditors create additional layers, protecting taxpayers from having to
take a share in the losses. The size of these additional layers will depend on the scope of
the depositor preference chosen by the Government. A wider depositor preference would
reduce the liabilities capable of being bailed-in and may create arbitrage incentives for
senior debt-holders to move to protected classes.
Ring-fence measures: The ICB argue that the ring-fence reduces future taxpayer support
by significantly simplifying the disentanglement of vital economic functions from non-vital
functions and therefore underlying the ease with which a non-ring-fenced bank would be
allowed to fall without taxpayer support.
The potential flaw in the ICB’s analysis is to assume that the ring-fenced bank can be fully
isolated from the potential failure of a non-ring-fenced bank. Although the ring-fence
creates a barrier between ring-fenced and non-ring-fenced banks, both entities share a
common link to the real economy. The failure of a non-ring-fenced bank could have an
important impact on the real economy, which in turn could affect the ring-fenced banks’
assets and costs of financing. Furthermore, both banks will depend on the same capital
and debt markets. Any disruption to these markets created by the activity of non-ring-
fenced banks would also have a direct impact on ring-fenced banks’ funding. Thus by
failing to fully rein in the risky activity of non-ring-fenced banks, the ring-fence proposals
may do relatively little to reduce the probability of contagion to ring-fenced banks.
Some commentators also argue that the ring-fence will lead to a concentration of particular
assets in the ring-fenced bank. This means the ring-fenced bank could be more vulnerable to
risks in certain key sectors than might otherwise have been the case if it were able to have a
more diversified approach. Furthermore, in the UK certain retail banks proved vulnerable to
the crisis as a result of high loan-to-value ratios, poor underlying analysis of credit risks and
lending at high income multiples – all of which are not fully addressed by the ICB reforms.
How to avoid inhibiting banks’ vital intermediation role and prolonging the current crisis?
Aside from the risks that the financial sector can pose to the real economy, banks also
have a vital role in providing credit to support growth and the economic recovery. There is
significant debate about the extent to which current economic conditions and financial
regulation may be impacting on the cost and supply of credit by banks.

BANCO DE ESPAÑA 51 ESTABILIDAD FINANCIERA, NÚM. 22
The ICB recommendations will impose costs on banks. These costs are likely to be
substantial, especially in the short-run and depending on banks’ ability to absorb them,
could have an additional impact on the price and supply of credit.
The size of any potential impact will depend to a large extent on the timing of implementation.
Whilst implementation is officially scheduled for full completion by 2019, the Government has
indicated that it will look to implement certain elements more rapidly. Furthermore, market
expectations often lead to a more rapid implementation than set out by official timelines.
Loss-absorbency measures: The loss absorbency measures are likely to have a very
significant ongoing impact on banks’ balance sheets through an increase in funding costs.
Funding costs could increase as a result of several factors:
— The requirement to hold increased capital of a higher quality;
— The requirement to hold larger proportions of more expensive, long-term
financing to satisfy minimum loss-absorbency requirements;
— The loss of the Government guarantee, which is likely to be most significant
for non-ring-fenced banks.
More indirectly, increased loss absorbency measures may also have a detrimental impact
on the international competitiveness of UK banks. This could have a long-term impact on
UK banks’ profitability and therefore lending.
Ring-fence measures: The costs of ring-fencing measures are likely to be most pronounced
in the short-run. They will include:
— Implementation costs associated with moving to new structures (for example,
the possible need to create a new wholesale entity or establish separate
arrangements for the use of branches and ATMs),
— Legal costs (for example, associated with the rewriting of contracts,
counterparty documentation)
— Tax costs and possible pensions implications.
There may also be additional effects on lending – as highlighted earlier – if the balance
sheets of ring-fenced and non-ring-fenced banks cannot be easily matched.
Overall, the ICB estimate that the annual pre-tax costs to UK banks of the reforms could
be between £4bn and £7bn. The UK Government believes that the range may be slightly
larger at between £3.5bn and £8bn. Industry estimates are even higher. Based on its own
calculations, the UK Government estimates that the additional bank costs would translate
into a gross reduction in GDP or around £0.8 to £1.8bn p.a. in the long-term.
Ultimately the overall costs of the reform are extremely uncertain and will likely be
significantly higher in the short-run. Much will depend on how the Government resolves
some of the implementation challenges set out earlier in the article, as yet unknown market
conditions in the future and the extent to which the reforms have a longer term impact on
UK banks’ competitiveness.

BANCO DE ESPAÑA 52 ESTABILIDAD FINANCIERA, NÚM. 22
The UK financial sector has been both a major source of growth, employment and fiscal
revenue as well as a significant risk factor to the UK economy.
The ICB recommendations are an attempt to address the financial sector’s role in the
origins of the crisis and to reduce the need for taxpayer involvement in future crises, while
at the same time maintaining the UK’s position as a leading financial centre.
This article has argued that the ICB recommendations are a combination of two different
routes to tackling the same problem. The loss-absorbency measures are an extension of
the international regulatory reform undertaken to date – they are quantitatively but not
significantly qualitatively different. By contrast, the ring fencing proposal is fundamentally
a different route, based not on adjusting regulation to the existing system but in attempting
to reform the structure of the system itself.
Attempting to implement these two distinct approaches at the same time, as well as
navigating amongst various other regulatory reform developments and a still fragile economy,
is likely to prove a challenging task for UK authorities and the financial sector itself. There
are important practical decisions to be made that will have an impact on the likely cost.
The additional loss-absorbency measures should help to reduce the likelihood of future
crises and reduce the probability of future taxpayer support. However, these measures
will have a significant impact on banks’ funding costs and spillover effects for short-term
lending cannot be ruled out. Furthermore, requiring retail banks to hold more capital
does not reflect the low risk posed by retail activity and as a result harms the efficiency
of retail banks.
This article has also questioned whether the marginal benefits from the artificial separation
of retail and wholesale activities are commensurate with the likely additional costs. The
approach is based on the assumption that ring-fenced banks can be isolated from potential
contagion risks posed by wholesale banking. However, this fails to recognise that both
banks are linked via the shared economy and therefore it will never be fully possible to
eliminate contagion risks.
6 Conclusion

(*) Jerry Edwards serves as Senior Advisor on Accounting and Auditing Policy with the Financial Stability Board
(FSB), with a dual senior advisory role with the Basel Committee’s Accounting Task Force, at the Bank for International
Settlements (BIS) in Basel, Switzerland. He also co-chaired the Basel Committee’s High Level Working Group on the
G20 Accounting Recommendations from 2009 to 2012. Prior to his secondment to the BIS, he was Associate
Director and Chief Accountant with over 25 years experience in the Federal Reserve Board’s Division of Banking
Supervision and Regulation in Washington, DC. He has served as the FSB’s representative on the IASB-FASB
Financial Crisis Advisory Group and on other key accounting and auditing advisory groups.
This article es the exclusive responsibility of the author and does not necessarily reflect the opinion of the Banco
de España.
Gerald A. Edwards, Jr. (*)
FSB TRANSPARENCY INITIATIVES


BANCO DE ESPAÑA 55 ESTABILIDAD FINANCIERA, NÚM. 22
FSB TRANSPARENCY INITIATIVES
Starting in the summer of 2007, the world experienced financial market turmoil that grew
into a global financial crisis, and challenging international market conditions have persisted
in its aftermath. Over this period, the Financial Stability Board (FSB) (and, up to April 2009
its predecessor, the Financial Stability Forum (FSF)), has been called upon by the leaders
of the G20 countries to analyze the causes of the international market turmoil and to agree
coordinated financial reforms that address core problems and lay the foundations to
strengthen market and institutional resilience and promote financial stability.1 As part of
this work, G20 leaders asked the FSF to conduct an analysis of procyclicality in the
financial system and recommend policy options to mitigate it. Efforts to enhance
transparency have been an important part of coordinated financial reforms, including
through convergence activities of the International Accounting Standards Board (IASB)
and the U.S. Financial Accounting Standards Board (FASB).
This article summarizes the key financial stability initiatives of the FSB that seek to enhance
transparency and move toward improved global accounting and auditing standards and
practices.
The FSB and its predecessor FSF recognized the importance of promoting transparency
by encouraging high quality international accounting and auditing standards and practices,
and improved disclosure practices. These enhance the quality of information available to
investors and other market participants, regulators and prudential authorities, which can
help to improve market discipline, reinforce sound risk management practices and improve
the consistency of capital measures and ratios. External audits performed in accordance
with high quality auditing standards can promote appropriate implementation of accounting
standards by firms and help to enhance market confidence by providing assurance that
the financial statements are presently fairly in accordance with the relevant accounting
framework. Moreover, through interaction with firms’ governance and management
processes, sound audits can help reinforce strong corporate governance and internal
controls at firms and, in certain cases, more reliable supervisory reports. Together with
effective supervision and other factors, the above can help to foster safe and sound
banking systems and more stable financial markets.
The IASB Chairman has long been a member of the FSF and FSB, serving on both the FSB
Plenary – its policy making body – and its Steering Committee. Also, the International
Financial Reporting Standards (IFRS) of the IASB and the International Standards on
Auditing of the International Auditing and Assurance Standards Board (IAASB) are among
the key standards for sound financial systems designated by the FSB as deserving of
priority implementation, because of their importance for financial stability.2
1 Prior to the
financial crisis
1 The FSB was established in April 2009 to coordinate at the international level the work of national financial
authorities and international standard setting bodies and to develop and promote the implementation of effective
regulatory, supervisory and other financial sector policies in the interest of financial stability. It brings together
national authorities responsible for financial stability in 24 countries and jurisdictions, international financial
institutions, sector-specific international groupings of regulators and supervisors, and committees of central
bank experts. The FSB is chaired by Mark Carney, Governor of the Bank of Canada. Its Secretariat is located in
Basel, Switzerland, and hosted by the Bank for International Settlements. For further information on the FSB,
visit the FSB website, www.financialstabilityboard.org.
2 See http://www.financialstabilityboard.org/cos/key_standards.htm.

BANCO DE ESPAÑA 56 ESTABILIDAD FINANCIERA, NÚM. 22
In the years preceding the financial crisis, the FSF carefully considered the IASB’s
progress in developing and improving its main standards affecting financial institutions,
as well as important accounting and auditing developments and issues arising in its
member jurisdictions.
– The FSF called for the establishment of the Public Interest Oversight Board to
provide independent oversight to the international audit standard-setting
activities of the International Federation of Accountants (IFAC), and was a
strong supporter of the Monitoring Group that worked with IFAC in the
development of reforms of its standard-setting activities in 2003. The FSB
continues this work as a member of the Monitoring Group.
– The FSF also encouraged the establishment of independent auditor oversight
regimes and promoted cooperation among audit oversight authorities (also
called audit regulators). The FSF strongly supported the formation of the
International Forum of Independent Audit Regulators (IFIAR), recognizing the
role it could have in enhancing communication and coordination among
audit regulators and bringing more consistency to global audit regulation
over time.
– Moreover, the FSF conducted joint international roundtables in 2004 and
2006 together with the IASB and IFAC on ways to improve international
accounting and auditing practices.
In addition, the FSF maintained dialogue with leading global financial institutions and audit
firms on important international accounting, auditing and disclosure issues affecting
financial markets such as valuation, impairment, off-balance sheet entities and related risk
management and control practices.
In October 2007, the G7 Finance Ministers and Central Bank Governors asked the FSF to
undertake an analysis of the causes and weaknesses that produced the market turmoil
and to set out recommendations for increasing the resilience of markets and institutions, and
to report to their meeting in Washington in April 2008.
The findings and recommendations in the FSF’s report in April 2008 were the product of
an intensive collaborative effort of the main international bodies and national authorities
in key financial centers. To address the G7 request, the FSF formed a senior working
group from among its membership. They drew on a large body of coordinated work,
comprising that of the Basel Committee on Banking Supervision (BCBS), the International
Organization of Securities Commissions (IOSCO), the International Association of Insurance
Supervisors (IAIS), the Joint Forum, the IASB, the Committee on Payment and Settlement
Systems (CPSS), the Committee on the Global Financial System (CGFS), the International
Monetary Fund (IMF), the Bank for International Settlements (BIS) and national authorities
in key financial centers. In addition, insights had been gained from private sector market
participants.
To restore confidence in the soundness of markets and institutions and enhance the resilience
of the global financial system, the FSF proposed concrete actions in the following five areas:
2 Initial
recommendations
in early 2008 as
the market turmoil
deepens3
3 “Report of the Financial Stability Forum on Enhancing Market and Institutional Resilience”, April 2008. See
www.financialstabilityboard.org/publications/r_0804.pdf.

BANCO DE ESPAÑA 57 ESTABILIDAD FINANCIERA, NÚM. 22
– Strengthened prudential oversight of capital, liquidity and risk management;
– Enhancing transparency and valuation;
– Changes in the role and uses of credit ratings;
– Strengthening the authorities’ responsiveness to risks; and
– Robust arrangements for dealing with stress in the financial system.
In order to enhance transparency and valuation, the FSF report encouraged a number of
actions, including needed risk disclosure, valuation and accounting convergence reforms.
In assessing challenging situations during the market turmoil, the FSF found that:
– Weaknesses in public disclosures by financial institutions had damaged
market confidence. Public disclosures that were required of financial
institutions did not always make clear the type and magnitude of risks
associated with their on- and off-balance sheet exposures. There were also
shortcomings in the other types of information firms provided about market
and credit risk exposures, particularly as these related to structured products.
Where information was disclosed, it was often not done in an easily accessible
or usable way.
– The turbulence revealed the potential for adverse interactions between high
leverage, market liquidity, valuation losses and financial institutions’ capital.
For example, write-downs of assets for which markets were thin or buyers
were lacking raised questions about the adequacy of capital buffers, leading
to asset sales, deleveraging and further pressure on asset prices. Poor
information availability reinforced these adverse feedback loops.
The market turmoil highlighted the importance to market confidence of reliable valuations
and useful disclosures of the risks associated with structured credit products and off-
balance sheet entities. To address these particular issues, the FSF report called for specific
actions by market participants, standard-setters, supervisors and regulators relating to:
– Risk disclosures by market participants;
– Accounting and disclosure for off-balance sheet entities;
– Valuation; and
– Transparency in securitization processes and markets
These recommendations are summarized in Box 1.

BANCO DE ESPAÑA 58 ESTABILIDAD FINANCIERA, NÚM. 22
Robust risk disclosures:
– The FSF strongly encouraged financial institutions to make
robust risk disclosures using leading disclosure practices
(summarized in the FSF report), at the time of their mid-year
2008 reports.
– The private sector should jointly develop principles for
relevant risk disclosures and identify leading risk
disclosure practices based on current market conditions
and risk at the time of the disclosure.
– Further guidance to strengthen disclosure requirements under
Pillar 3 of Basel II was issued by the BCBS in 2009.
Standards for off-balance sheet vehicles and valuations:
Relevant standard setting bodies took urgent action to:
– Improve and converge financial reporting standards for off-
balance sheet vehicles;
– Develop accounting, supervisory and auditing guidance on
valuations when markets are no longer active, including calling for
the establishment of an IASB expert advisory panel on valuations.
Transparency in structured products:
– Market participants and securities regulators took steps to
expand the information provided about securitized products
and their underlying assets.
BOX 1OVERVIEW OF FSF-RECOMMENDED INITIATIVES IN 2008 TO ENHANCE TRANSPARENCY AND VALUATIONS
The FSF’s first recommendation strongly encouraged financial institutions to make robust
risk disclosures using leading disclosure practices at the time of their upcoming mid-year
2008 reports. These leading-practice risk disclosures were summarized in the FSF report
and based on a survey by the Senior Supervisors Group (SSG) of end-2007 risk disclosures
for selected exposures that the marketplace considered to be high-risk or involve more
risk than previously thought.4, 5 Specifically, the FSF recommended robust, consistent
disclosures about the following types of exposures:
– Collateralized debt obligations, including related hedges;
– Other subprime and Alt-A exposures;
– Special purpose entities (SPEs);
– Commercial mortgage-backed securities; and
– Leveraged finance exposures.
The report stressed that these disclosures should be made by financial institutions for
significant risk exposures. FSB communicated the FSF recommendations to financial
institutions in their jurisdictions and encouraged enhanced disclosure practices for those
with significant exposures. In response to the recommendations by the FSF and others,
Improved risk disclosure
and valuation by market
participants
4 Senior representatives of eight supervisory authorities from five countries (collectively the “Senior Supervisors
Group” or SSG) joined in issuing a report to the FSF that reviewed the disclosure practices of financial services
firms concerning their exposures to certain financial instruments that the marketplace in early 2008 considered
to be high-risk. The SSG analyzed year-end 2007 disclosures by a sample of large internationally-oriented banks
and securities firms, in its report to the FSF, Leading-Practice Disclosures for Selected Exposures, April 2008.
5 The term “leading” was used by the FSF and SSG to mean most informative, both as regards quantity and quality
of information (e.g., the data would enable market participants to assess the risks and returns of investments in
or exposures to the firm; so that market participants can properly understand data that are disclosed). The
proposed disclosures were intended to supplement rather than replace existing risk disclosures, including those
required under Pillar 3 of Basel II. The FSF noted that, in this context, disclosure broadly included not only
information presented in public securities filings but also information presented in earnings press releases and
accompanying presentation slides posted to the firms’ internet websites.

BANCO DE ESPAÑA 59 ESTABILIDAD FINANCIERA, NÚM. 22
many large banks started to provide more meaningful and consistent quantitative and
qualitative information about structured credit risk exposures, valuations, off-balance
sheet entities and related policies from mid-2008.6
A second set of principles-based recommendations included in the FSF report encouraged
investors, financial industry and auditors to work together to provide principles and leading
practice risk disclosures that would be most relevant to market conditions at the time of
disclosure. This would help keep disclosures fresh and reflective of the risks truly being
faced at those future reporting dates, and avoid institutions focusing undue attention on
making supplemental disclosures focusing on yesterday’s risk issues that are no longer
relevant to the marketplace.
Third, the FSF report called on financial institutions to establish rigorous valuation
processes and make robust valuation disclosures. To this end, they should:
– Establish rigorous and timely processes to apply critical expert judgment and
discipline in how they value holdings of complex or illiquid instruments
(avoiding undue reliance on ratings and consensus pricing services);
– Maintain sound governance and control practices associated with valuation
processes, including those that deal with hard-to-observe inputs to valuation
models, model validations, price verification and related audit programs; and
– Enhance the quality of their disclosures about valuations, valuation
methodologies, price verification processes and the uncertainty associated
with valuations.
The FSF’s work spurred additional measures by banking supervisors to enhance transpar-
ency. The BCBS issued in 2009 further guidance to strengthen disclosure requirements
under Pillar 3 of Basel II, for example, for securitization exposures, off-balance sheet entities,
liquidity commitments to asset-backed commercial paper conduits and valuations.
Also, the BCBS issued supervisory guidance for assessing banks’ financial instrument fair
value practices in April 2009. The principles in this supervisory guidance promote strong
governance over valuation processes; the use of reliable, diverse information sources for
valuation inputs; the communication of valuation uncertainty to internal and external
stakeholders; independent verification and validation processes; consistency in valuation
practices for risk management and reporting purposes, where possible; and strong
supervisory review of bank valuation practices.
Accounting and auditing standard-setters also took forward the FSF’s initiatives. In
response to the FSF’s recommendations to enhance transparency and valuation, the IASB
implemented a number of key projects. Given the importance of these initiatives, these
projects were undertaken on an accelerated timetable.7
BCBS initiatives requested
by the FSF
Initiatives by accounting and
auditing standard setters
6 The FSB Thematic Review on Risk Disclosure Practices, March 2011, found that this has improved risk disclosure
practices related to structured credit activities, including exposures to SPEs, asset-backed securities,
mortgage-backed securities and collateralized debt obligations. See http://www.financialstabilityboard.org/
publications/r_110318.pdf.
7 At the time of the development of the FSF report, the IASB due process requirements resulted in significant time
to propose and finalize standards and the IASB did not have procedures for accelerating projects. Such
procedures were later approved by the trustees overseeing the IASB, now called the IFRS Foundation.

BANCO DE ESPAÑA 60 ESTABILIDAD FINANCIERA, NÚM. 22
– In October 2008 the IASB enhanced its guidance on valuing financial
instruments when markets are no longer active, based on the findings of an
expert advisory group on valuation that it had established in June 2008.8 The
IASB also issued proposals to strengthen disclosures about valuations and
related governance, controls, methodologies and uncertainties.
– Moreover, as mentioned in the FSF recommendations, the IASB developed
proposals to enhance its standards on consolidation of off-balance sheet
entities and related risk disclosures and finalized these proposals during
2009 to 2011.
Furthermore, the FSF report indicated that the IAASB, major national standard setters and
relevant regulators should enhance the guidance for audits of valuations of complex or
illiquid financial products and related disclosures, where necessary. The report
recommended that the largest global audit firms provide input to this process by sharing
their audit approaches in addressing auditing and financial reporting issues resulting from
the market turmoil and which could be used for enhancing auditing guidance. The IAASB
issued a Staff Audit Practice Alert in October 2008 on audits of valuations and complex
products and also discussed these issues with the largest international audit firm networks
to encourage improved practices.9
The FSF report also called for the IASB and the US FASB to converge their standards and
guidance in key areas. In addition, as discussed below, the calls from the marketplace for
convergence strengthened as the financial crisis deepened.
In addition to recommendations in the reports of the FSF and FSB, the FSB supported
dialogue to foster better understanding and communication with respect to important
international accounting, auditing and risk disclosure issues, including the following:
Senior official dialogue:
– The FSB Chairman, Secretary General and senior advisor maintained dialogue
with the Chairmen of the IASB, U.S. FASB and IAASB on key developments
in projects of interest to the FSB.
– The FSB supported the IASB in maintaining enhanced technical dialogue with
senior representatives of its member bodies and with the accounting
committees of IOSCO, the BCBS and IAIS.
– The FSB conducted roundtables and other focused meetings to foster
dialogue between senior officials in the private and public sectors on
important accounting, auditing, and risk disclosure developments and
issues.
8 This IASB guidance was issued in the following report: www.ifrs.org/NR/rdonlyres/0E37D59C-1C74-4D61-A984-
8FAC61915010/0/IASB_Expert_Advisory_Panel_October_2008.pdf.
9 Following, in part, from the FSF recommendation to the IAASB and other audit authorities, in 2009 and 2010 the
IAASB proposed improvements in its audit guidance for complex financial instruments that draws attention to
relevant aspects of accounting for fair value measurement and related disclosures and practical considerations
when auditing such instruments. The IAASB finalized this as IAPN 1000.

BANCO DE ESPAÑA 61 ESTABILIDAD FINANCIERA, NÚM. 22
Technical dialogue:
– The FSB senior advisor participated in (a) the IASB-FASB Financial Crisis
Advisory Group; (b) the IASB Expert Advisory Panel on Valuations and (c) the
IASB Expert Advisory Panel on Impairment.
– The FSB Secretariat maintained ongoing technical dialogue with the IASB and
FASB project experts on key aspects of their convergence progress.
In its April 2008 Report, the FSF noted that it would examine the forces that contribute to
procyclicality in the financial system and develop options for mitigating it. At the G20
Leaders Summit in London in April 2009, the FSF issued a report, “Addressing Procyclicality
in the Financial System”.10
The term “procyclicality” refers to the dynamic interactions between the financial and the
real sectors of the economy. These mutually reinforcing interactions tend to amplify
business cycle fluctuations and cause or exacerbate financial instability. The global
financial crisis was a graphic example of the disruptive effects of procyclicality. Institutions
that experienced extensive losses faced growing difficulties in replenishing capital. This, in
turn, induced them to cut credit extension and dispose of assets. Their retrenchment
precipitated a weakening of economic activity, thereby raising the risk of a further
deterioration in their financial strength. Addressing procyclicality in the financial system is
an essential component of strengthening the macroprudential orientation of regulatory and
supervisory frameworks.
The FSF report examined the forces that contribute to procyclicality in the financial system,
and explored possible mitigating actions in three main areas: (i) the Basel II capital accord;
(ii) loan loss provisioning; and (iii) valuation and leverage, including margining practices.
The recommendations in the report were the result of collaborative work involving national
authorities, the BCBS, BIS, CGFS, IMF, IOSCO, the IASB and the U.S. FASB.
At the London summit meeting, the FSF was re-established as the FSB with a broadened
mandate to promote financial stability. The G20 Leaders welcomed the accounting
recommendations in the FSF’s procyclicality report and requested action by account-
ing standard-setters.11 The G20 Leaders also called on “the accounting standard setters
to work urgently with supervisors and regulators to improve standards on valuation and
provisioning and achieve a single set of high-quality global accounting standards”.12
Specifically, the G20 Leaders encouraged accelerated efforts by the IASB and FASB to
finalize improved, converged accounting standards and efforts to enhance the governance
of the IASB.
The G20 Leaders requested that the FSB monitor implementation efforts, including those
addressing accounting issues. Starting with its progress reports to the G20 Leaders in
September 2009, the FSB has included recommendations on accounting matters in its
communications with the G20, including an assessment of IASB-FASB convergence progress.
Box 2 provides an example of FSB recommendations on impairment and valuation presented
in its progress report to the G20 Leaders at the Pittsburgh Summit in September 2009.
3 The G20 Leaders and
FSB on procyclicality,
convergence and
transparency
10 See www.financialstabilityboard.org/publications/r_0904a.pdf.
11 G20 Leaders, “Declaration on Strengthening the Financial System – London Summit, 2 April 2009”.
12 G20 Leaders, “London Summit – Leaders’ Statement, 2 April 2009”.

BANCO DE ESPAÑA 62 ESTABILIDAD FINANCIERA, NÚM. 22
31. Moreover, continuing differences in accounting requirements
of the IASB and FASB for netting/offsetting of assets and liabilities
also result in significant differences in banks’ total assets, posing
problems for framing an international leverage ratio.
32. Therefore, additional work in the areas above is urgently
needed in order to meet the important objectives of convergence,
transparency and the mitigation of procyclicality, as standard
setters continue their efforts to improve the quality of their
standards and reduce the complexity of their standards on
financial instruments.
33. We strongly encourage the IASB and FASB to agree on
improved converged standards that will:
– incorporate a broader range of available credit information
than existing provisioning requirements, so as to recognize
credit losses in loan portfolios at an earlier stage as part of an
effort to mitigate procyclicality. We are particularly supportive
of continued work on impairment standards based on an
expected loss model; and
– simplify and improve the accounting principles for financial
instruments and their valuation. We are particularly supportive
of continued work in a manner that does not expand the use of
fair value in relation to the lending activities (involving loans and
investments in debt instruments) of financial intermediaries.
34. While respecting the independence of accounting standard
setters, the FSB is urging renewed efforts by the IASB and FASB
to achieve these objectives, working with supervisors, regulators
and other constituents. The Basel Committee has issued for
consideration by accounting standard setters principles for the
revision of accounting standards for financial instruments, agreed
by all G20 banking supervisors, that address issues related to
provisioning, fair value measurement and related disclosures.
35. We welcome the IASB’s recent initiatives with respect to
provisioning and its enhanced technical dialogue with prudential
supervisors and other stakeholders, and encourage the IASB to
continue its dialogue with stakeholders as it moves forward. We
request G20 Leaders to support the call for action set forth in this
section.
BOX 2EXAMPLE OF FSB ACCOUNTING RECOMMENDATIONS IN PROGRESS REPORT TO G20 LEADERS, SEPTEMBER 2009
The call of the G20 Leaders to the IASB and FASB to enhance accounting for loan loss
“impairment” or “provisioning”, was largely encouraged by FSF/FSB work at that time.
Under both IASB standards (called International Financial Reporting Standards or IFRS)
and FASB standards (called generally accepted accounting principles or GAAP), the
accounting model for recognizing credit losses is commonly referred to as an “incurred
loss model” because the timing and measurement of losses is based on estimating losses
that have been incurred as of the balance sheet date. Provisioning requirements in IASB
and FASB standards thus generally limit provisioning to losses that are considered
probable as of the balance sheet date. In addition, these accounting standards do not
permit credit losses based on events that are expected to occur in the future to be
included in provisions until the event or events that would probably result in a loss have
occurred, generally supported by observable evidence (e.g., borrower loss of employment,
decrease in collateral values).
While the incurred loss model had been ingrained in the thinking of standard-setters for
many years, the experience of the financial crisis highlighted problems, particularly with
the delayed recognition of credit losses caused by the incurred loss standards. These
delays resulted in the recognition of credit losses that were widely regarded as “too
little, too late”.
New thinking was needed, based on lessons from the financial crisis, to reform the
accounting approach in this area in a manner that would support the overall goal of
improving transparency. The FSF Working Group on Provisioning, co-chaired by Kathleen
Casey, Chairman of IOSCO’s Technical Committee and SEC Commissioner, and by John
Dugan, Chairman, Joint Forum, and US Comptroller of the Currency, brought together
securities regulators, banking supervisors, accounting standard-setters and audit
regulators to evaluate this key area. Both U.S. and international accounting perspectives
Encouragement to consider
expected loss provisioning

BANCO DE ESPAÑA 63 ESTABILIDAD FINANCIERA, NÚM. 22
were carefully explored. The IASB and FASB were fully involved, as were BCBS
representatives and the chairmen of IFIAR and the U.S. Public Company Accounting
Oversight Board. The working group also engaged in outreach involving investors, external
auditors and financial institutions. This effort helped to ensure that the group’s findings
would address needs of investors while also addressing certain key prudential objectives.
In April 2009, based on the working group’s recommendations, the FSF’s procyclicality
report to the G20 noted that: “Earlier recognition of loan losses could have dampened
cyclical moves in the current crisis... Earlier identification of credit losses is consistent both
with financial statement users’ needs for transparency regarding changes in credit trends
and with prudential objectives of safety and soundness.” The FSF report recommended:
“The FASB and IASB should reconsider the incurred loss model by analyzing alternative
approaches for recognizing and measuring loan losses that incorporate a broader range of
available credit information.”
In its progress report to the G20 Leaders in September 2009, the FSB noted that, “We are
particularly supportive of continued work on impairment standards based on an expected
loss model”. 13
This encouragement has led to valuable work by the accounting standard setters. The
IASB proposed an expected loss impairment or provisioning model in November 2009.
The FASB, after first proposing in May 2010 a modified version of the incurred loss model,
has been working jointly with the IASB since early 2011 on clarifying and finalizing an
expected loss impairment approach.
As previously mentioned, the FSF procyclicality report in April 2009 had also involved an
assessment of valuation and leverage issues. The report found that:
“The extensive use of fair value accounting encouraged market practices that
contributed to excessive risk-taking or risk-shedding activity in response to
observed changes in asset prices. In the course of the present crisis, this mechanism
became clear at times of adverse market dynamics, particularly as liquidity in
financial markets evaporated. When the markets for many credit risk exposures
became illiquid over 2007-08, credit spreads widened substantially as liquidity
premia grew. Wider spreads drove down mark-to-market valuations on a range of
assets. Some fair valued assets that became illiquid were marked down to match
declines in traded derivative indices.
The extensive use of fair value accounting meant that, across the financial system,
these declines in valuations translated into lower earnings or accumulated
unrealised losses in the equity account for securities held for sale. Mark-to-market
losses eroded banks’ core capital, causing balance sheet leverage to rise. Banks
sold assets in an attempt to offset this rise in balance sheet leverage and to
address liquidity issues, but such sales only pushed credit spreads wider, causing
more mark-to-market losses.”
This effort resulted in two sets of accounting recommendations, summarized below, which
were developed with input from the IASB, IOSCO, the SEC, and the BCBS.
Encouragement to further
improve financial instruments
and valuation standards
13 “Improving Financial Regulation, Report of the Financial Stability Board to G20 Leaders”, September 2009.

BANCO DE ESPAÑA 64 ESTABILIDAD FINANCIERA, NÚM. 22
– Accounting standard setters and prudential supervisors should examine the
use of valuation reserves or [valuation] adjustments for fair valued financial
instruments when data or modeling needed to support their valuation is weak.14
– Accounting standard setters and prudential supervisors should examine
possible changes to relevant standards to dampen adverse dynamics
potentially associated with fair value accounting. Possible ways to reduce this
potential impact include the following:
– Enhancing the accounting model so that the use of fair value accounting
is carefully examined for financial instruments of credit intermediaries.
– Transfers between financial asset categories.
– Simplifying hedge accounting requirements.
In its progress report to the G20 Leaders at the Pittsburgh Summit in September 2009, the
FSB noted that it was particularly supportive of standards that would not expand the use of
fair value in relation to the lending activities of financial intermediaries. Considering the
views of stakeholders, the IASB issued IFRS 9, “Financial Instruments”, in November 2009
which includes an amortized cost category for financial assets such as loans and certain
investments in debt securities. The other aspects of the above recommendations have been
reflected by the IASB in IFRS 9 and IFRS 13, “Fair Value Measurement”, as well as in the
IASB’s planned new hedge accounting standard, which seeks to simplify hedge accounting
requirements in ways that are more consistent with companies’ risk management practices.
In early 2010 it looked as though divergent accounting standards for lending activities
might arise, due to a FASB proposal to use fair value measurement on the balance sheet
and through “other comprehensive income” for loans and investments in debt securities.
Under this proposal, changes in fair values of lending instruments would affect reported
shareholders’ equity, but generally would not be included in profit and loss. However, in
response to FASB’s request for feedback from interested parties on the proposal, and
based upon extensive outreach by the FASB, the majority of investors and other
stakeholders indicated they did not agree with the fair value measurement recognition
aspects of that proposal as it relates to lending activities, deposits, and other liabilities.
The FASB has since moved away from this proposal, and has decided in its revised
approach to use amortized cost as a measurement basis for loans.
Starting in 2009 the FSB has been reporting to the G20 Leaders on progress in implementing
the recommendations of the G20 and the FSB, including those on accounting matters.
Progress has been achieved so far in many of these areas. For example:
– Measurement of loans. As discussed above, both the IASB and the FASB
have decided that their financial instruments accounting standards will use
amortized cost as a measurement basis for loans, moving away from an
earlier FASB proposal to require fair value measurement for loans.
FSB monitoring of IASB-FASB
convergence progress
14 The report noted that, “Standard setters and supervisors should explore whether firms should be required to
hold valuation reserves or to otherwise adjust valuations to avoid overstatement of income when significant
uncertainty about valuation exists. For financial instruments that are not actively traded, insufficient market
depth or reliance on valuation models using unobservable inputs that are difficult to verify may create
considerable valuation uncertainty.”

BANCO DE ESPAÑA 65 ESTABILIDAD FINANCIERA, NÚM. 22
– Loan provisioning/impairment. Following the above recommendations of the
FSB, both Boards are seeking to develop and finalize an expected loss
approach for impairment that should lead to more robust, forward-looking
impairment practices that are intended to result in an earlier recognition of
credit losses based on consideration of all available information about credit
quality and trends.
– Off-balance sheet entities. The FSB has encouraged improved IASB accounting
and disclosure standards for off-balance sheet vehicles. The IASB’s final
disclosure standards in 2011 enhance information about risk exposures that
remain when a financial asset has been derecognized (e.g. securitized), including
improved information about unconsolidated structured entities, and are broadly
aligned to FASB disclosure requirements.15
– Addressing valuation uncertainty in fair value measurement guidance. The
FSB recommended that standard setters and supervisors explore whether
firms should be required to hold valuation reserves or to otherwise adjust
valuations to avoid overstatement of income when significant uncertainty
about valuation exists. Final improved IASB and FASB fair value measurement
standards in 2011 have aligned requirements about how to measure fair
value, including guidance on measurement when markets become less active,
and to address valuation uncertainty.
– Repurchase agreements. The FSB had expressed concern that the IASB’s
consultation proposal on derecognition would require repurchase agreements
to be treated as sales and forward contracts in certain situations (thus leading to
off-balance-sheet treatment), instead of as financing transactions on the
balance sheet as under current IFRS. The IASB decided not to move forward
with its proposal. The FASB has also taken steps to review its accounting for
repurchase agreements and plans steps in 2012 that could further converge
its approaches with those of the IASB, for example, by eliminating “repo-to-
maturity” accounting approaches under FASB standards which result in off-
balance sheet treatment for those transactions.16
– Risk disclosures. As a result of the efforts of the two Boards, improved risk
disclosure requirements are in place. However, not all are converged at this time.
While progress has been made toward improved, converged standards, the convergence
process is taking longer than initially expected in some areas, such as classification,
measurement and provisioning, and it appears that the Boards are diverging with respect
to their ongoing projects on hedge accounting. The FSB has encouraged the Boards to
redouble their efforts to seek converged standards in these important areas.
15 In their joint update report on convergence progress to the the FSB and G20 in April 2012, the IASB and FASB said,
“The boards have completed their respective consolidation projects, which included addressing issues about the
consolidation of special purpose entities and enhanced disclosures about off balance sheet risks. The new IFRS
requirements will also bring into force new disclosure requirements relating to structured entities (special purpose
entities), making IFRS and US GAAP disclosure requirements similar. Differences remain, however, in relation to
what US GAAP refers to as voting interest entities; US GAAP has a legalistic approach to defining control, whereas
the new IFRS has a broader definition of control, including effective control. On the basis of feedback received, the
FASB also decided to expose the principal-agent sections of the IFRS model.” This joint report can be found on
the FSB website. See www.financialstabilityboard.org/publications/r_120420d.pdf.
16 For a summary explanation of the accounting treatment for repo-to-maturity transactions and concerns about
their use at MF Global, see www.cnbc.com/id/45132384/The_Trade_That_Killed_MF_Global,

BANCO DE ESPAÑA 66 ESTABILIDAD FINANCIERA, NÚM. 22
The netting/offsetting of derivative contracts and other financial assets and financial
liabilities is another area where the FSB has expressed concerns. In this case, where
different approaches result in significant differences in the total assets of large financial
institutions, the Boards decided to maintain their different current offsetting accounting
rules while issuing at end-2011 new requirements for common disclosures about gross
and net positions for derivatives and other financial instruments to improve transparency.
This follows the Boards’ issuance of a joint proposal in January 2011 on a converged
accounting approach to balance-sheet netting. However, instead of the 2011 proposal,
comments from the U.S. generally supported the current FASB netting rules and those
using IFRS generally supported current IASB rules, with many investors seeking both
gross and net information. Derivatives dealer banks, both inside and outside the U.S.,
generally wanted the FASB (net) accounting approach in order to avoid the massive
grossing-up of their balance sheets.
The FSB noted a concern in this area was that differences in offsetting/netting accounting
standards would adversely affect the efforts to develop an internationally comparable
leverage ratio for capital purposes. However, while the IASB and FASB have decided to
maintain their different accounting rules for netting/offsetting, the FASB netting approach
and the netting approach that will be carried forward to the Basel III international leverage
ratio are similar in their effect because both recognize netting/offsetting based on legally
enforceable master netting agreements. Thus, from a bank supervisory perspective, there
may be more convergence for leverage ratio purposes than is first apparent.
Some were concerned that the IASB and FASB have revised their target completion dates
for their remaining convergence projects so that they extend into 2013, beyond the end-
2011 date called for earlier by the G20. The FSB reported to the G20 in April 2012 that the
IASB and FASB will conduct further public consultations in the second half of 2012, and
expect to issue final converged standards in a number of key areas by mid-2013. The two
Boards mentioned that they have extended certain project target completion dates in order
to allow sufficient time for outreach and public comment on the large number of planned
major Exposure Drafts, and for the Boards to reflect that feedback in high-quality final
standards. The FSB reported to the G20 that it supports the efforts of the IASB and FASB
to achieve convergence to a globally accepted set of high-quality accounting standards
and urges them to issue final converged standards on key projects by mid-2013.17
In March 2012, the FSB issued a public statement underscoring the importance of work to
improve external audits by:
– enhancing the information provided to prudential supervisors and regulators
of financial institutions, and
– reinforcing the effectiveness of the regulation of external audits, particularly
those of financial institutions.
The financial crisis demonstrated the importance of addressing these issues. Work to
improve audit practices and standards is ongoing, with some regulators and auditing
4 Improving the
contribution of external
audits to financial
stability18
17 FSB Chairman’s letter, “To G20 Finance Ministers and Central Bank Governors, Progress of Financial Regulatory
Reforms”, 16 April 2012. See www.financialstabilityboard.org/publications/r_120420a.pdf.
18 See press release at www.financialstabilityboard.org/press/pr_120315.pdf.

BANCO DE ESPAÑA 67 ESTABILIDAD FINANCIERA, NÚM. 22
standard setters having issued finalized guidance on certain audit issues, and proposals in
some other jurisdictions having been issued subject to public consultation. In view of the
global nature of markets, financial institutions and audit firms, greater international
consistency in external audit practices and requirements will be important while continuing
to promote their high quality.
In particular, the FSB encouraged further work in the following areas:
1 Improving the information that external audits provide to prudential supervisors
and regulators of financial institutions, including systemically important
financial institutions (SIFIs). As part of this effort, the FSB will provide input to
the BCBS’ ongoing revision of its external audit policy papers and as it
develops new robust external audit guidance, to be proposed by end-2012,
and to the IAIS as it updates and enhances its policies with respect to external
audits of insurance companies.
2 Reinforcing the effectiveness of audit regulation, particularly for external
audits of financial institutions, to improve audit quality. The FSB is requesting
IFIAR to report on (i) challenges and problems that its members have
identified in their inspection programs relating to external audits of financial
institutions, including audits of SIFIs; (ii) responses by IFIAR members to
those issues, including follow-up with external audit firms; and (iii) member
recommendations concerning steps that could be taken by audit regulators
and auditors to further strengthen external audits of financial institutions.
IFIAR decided at its Plenary meeting in April 2012 that it will seek to provide
the report requested by the FSB by end-2012.
The FSB also announced that it recognizes the importance of other work underway to
improve audit practices and standards and:
– encourages the continued efforts of the IAASB, internationally, and other audit
standard setters in their national contexts to improve the standards on
information that external audits provide to investors and other financial report
users. The approaches set forth in various consultative documents differ
across jurisdictions, and it will be important to seek high quality standards
that enhance audit practices, and to the extent possible, improved international
consistency. IOSCO has agreed to monitor developments in this area and
provide updates to the FSB on progress.
– asks IOSCO to report to the FSB on authorities’ experiences with the
considerations in IOSCO’s 2008 report on audit contingency planning.
– asks FSB members and other key bodies such as the IAASB, to provide input
to the World Bank’s review of how to enhance its Accounting and Auditing
Reports on Standards and Codes (ROSCs).
The FSB will continue to support dialogue between audit standards setters and regulators,
investors, market regulators, prudential authorities, financial institutions and audit firms on
improving the quality of external audit and its contribution to financial stability.

BANCO DE ESPAÑA 68 ESTABILIDAD FINANCIERA, NÚM. 22
As previously mentioned, the importance to market confidence of useful disclosure by
financial institutions of their risk exposures and risk management practices has been
underscored in recent years. Building on the March 2011 FSB thematic peer review report
and a roundtable held in December 2011, the FSB has undertaken an initiative to further
enhance risk disclosure practices.
The FSB is following up on a recommendation in the FSB thematic review report, by
considering on an ongoing basis whether there is a need for improved disclosures about
new risk areas as these are identified. During 2012 the FSB will deepen these assessments,
and will continue to draw on relevant expertise from the private sector in doing so. Efforts
involving international standard setting bodies and joint private sector initiatives will in
many cases be the most appropriate manner to take any new risk disclosure
recommendations forward. The report recommended that the FSB should coordinate as
necessary the alignment of the activities of standard setting bodies to fill any gaps arising
because of a lack of a timely response or from financial stability concerns.
In December 2011, the FSB hosted a roundtable on risk disclosures by financial
institutions.19 Eighty-two senior officials and other experts from around the world took
part, representing investors and analysts, asset managers, credit rating agencies, banks,
insurance companies, audit firms, audit regulators, accounting and auditing standard
setters, as well as prudential and market authorities. The roundtable fostered a rich and
lively dialogue about the current state of risks and related disclosures and how to
improve their transparency. The key themes that arose during the course of the discussion
are summarized below:
– Risk disclosure foundations. Participants generally preferred risk disclosure
requirements in accounting standards and securities regulatory requirements
that are principles-based rather than rules-based, but investors also called for
measures to improve comparability, such as more consistent risk disclosure
formats or templates. Principles-based approaches, such as those in the
IASB’s IFRS 7 (on financial instrument disclosure) and the US Securities and
Exchange Commission’s guidance on management’s discussion and analysis
(MD&A), may be sufficient to underpin disclosure improvements of the type
discussed at the roundtable without the issuance of new disclosure
requirements, but greater attention needs to be paid to address user needs
for information about emerging risks.
– Views of regulators and accounting standard setters. The IASB and FASB
discussed their initiatives in recent years to enhance risk disclosures. These
include IASB improvements in standards for disclosures about financial
instrument risks and valuations, and about off-balance sheet exposures, and
FASB enhancements in standards for disclosures about credit risk, valuations
and off-balance sheet risks. The two Boards have issued converged standards
for improved disclosures about the gross and net exposures associated with
derivatives and certain other financial instruments.
Regulators generally acknowledged some recent improvements in risk
disclosure practices but they shared the view that further improvement would
be useful to enhance transparency. Securities regulators noted the benefits of
5 Recent FSB efforts
to further enhance risk
disclosure practices
Consideration of whether
enhanced risk disclosures are
needed as new risk areas are
identified
Summary of key themes that
arose during the FSB
roundtable on risk disclosure
19 See press release and roundtable summary at www.financialstabilityboard.org/press/pr_120320.pdf.

BANCO DE ESPAÑA 69 ESTABILIDAD FINANCIERA, NÚM. 22
regulators and firms reaching out to key stakeholders about disclosure issues
and the importance of monitoring information discussed during senior
management calls with analysts and the related presentations, which could
provide insights into ways to improve financial report disclosures. They noted,
however, that this required significant resources. The Financial Policy
Committee of the Bank of England has encouraged improvements in the
quality of disclosures as indicated the Bank’s Financial Stability Reports in
June and December 2011.
– The role of auditors in risk disclosures. External auditors are currently required
to consider the risk of material misstatement of the financial statements in
planning and performing the audit. Where the applicable accounting framework
requires disclosure in the financial statements of information relating to risk,
the auditor is required to audit that disclosure. The auditor’s responsibility for
disclosures in documents accompanying the financial statements – such as
those in MD&A or the financial review section of financial reports – is generally
limited to considering whether it is materially inconsistent with the audited
financial statements or a material misstatement of fact. Auditors’ roles are
also limited with respect to disclosures in interim financial reports. Generally,
other risk disclosures, such as those in presentations to investors and analysts
or on a firm’s websites, are not subject to external auditor’s review.
Audit regulators and standard setters summarized their recent guidance
which included (i) alerts to auditors for assessing and responding to the risk
of material financial statement misstatement in this difficult economic
environment and (ii) consultative documents to explore possible improvements
in auditor reporting and/or changes in the role of the external auditor for
disclosures outside the financial statements (e.g., risk disclosures in MD&A).
They are considering ways of expanding the scope of risk-related reporting
responsibilities through consultative documents issued in 2011 and further
work planned for 2012. Challenges remain in areas such as auditability of
forward-looking statements, application of materiality concepts, and going
concern assessments.
Investors and analysts stressed that disclosure that enhances the transparency of risks and
risk management practices helps to build confidence in the firm’s management, which can
be particularly important to attract debt and equity investors. However, they argued that still
many financial firms provide only minimal risk disclosures or obscure important information
in voluminous disclosures that are not relevant or prioritized. Many participants encouraged
that disclosure on past risks no longer of key importance should be allowed to be phased
out, to ensure more relevant disclosure and avoid unnecessary reporting burden.
Enhancements discussed. Given the current financial market environment, participants
expressed the view that enhanced qualitative and quantitative disclosure is particularly
important in the following areas:
– Information on governance and risk management strategies. Investors requested
better qualitative disclosures about governance, risk management oversight
and related controls, and qualitative and quantitative disclosures about risk
management practices, risk exposures and remuneration. Banking and
insurance representatives noted the relevance of information about a financial

BANCO DE ESPAÑA 70 ESTABILIDAD FINANCIERA, NÚM. 22
institution’s risk appetite and that risk disclosures would be most relevant if they
were consistent with information used internally for risk management purposes.
Disclosure should be put in the context of the financial institution’s business
model to facilitate market understanding of risk management practices.
– Summary disclosure and benefits of achieving comparability. Participants
agreed that risk disclosure should be timely, clear, prioritized, consistent
and comparable, as highlighted by a recent survey of financial report users.
Many analysts recommended more use of executive summaries of the key
risk categories, which should include key metrics on entity-wide risk
exposure and risk management effectiveness. Disclosures should better
differentiate market risk components (e.g., interest rate, foreign currency
and commodity risk as separate disclosure categories) and firms should
avoid voluminous or boilerplate disclosures presented as a compliance
exercise. Some supported the idea of standardized common disclosure
templates to facilitate comparability across firms and jurisdictions and to
aid aggregation and assessment of system-wide risks. Others pointed out
that risk disclosure should be supported by qualitative information that
provides management’s context for measurements and important firm-
specific considerations.
– Credit risk. While acknowledging that some banks have enhanced their
disclosures in recent interim reports, participants encouraged improved
disclosure about exposures to sovereign debt and to other financial institutions.
In addition to the areas for potential enhanced credit risk disclosure raised in
the FSB Report, including the disclosure of renegotiated loans for troubled
borrowers, participants discussed other areas where enhanced risk disclosure
could be useful, such as: (i) expected credit losses for impaired financial
assets, (ii) counterparty exposures, (iii) derivatives, (iv) off-balance sheet and
joint venture structures, and (v) risk concentrations.
– Liquidity risk. Participants noted the importance of transparency about liquidity
and funding risks, including potentially additional disclosures about sensitivity
analyses, sources and volume of liquidity buffers, and maturity tables including
contingent lending commitments. Given the increasing role of collateral,
participants shared the view that the degree of asset encumbrance should be
disclosed at a reasonable interim frequency as well as annually. Some
mentioned the importance of addressing the liquidity of collateral and the
extent of its use and residual availability.
– Capital adequacy and risk weighted assets (RWAs). Participants said that
disclosures on capital planning (including the ability of firms to transfer capital
across borders) were important. Further disclosure about RWAs and their
calculation methods would be helpful. Investors noted as a positive
development that some banks had started to disclose their regulatory leverage
ratios voluntarily.
– Pillar 3 disclosure. Participants indicated that the usefulness of Pillar 3 disclosures
was hampered by difficulties in reconciling the unaudited Pillar 3 information
to the audited financial statements of firms. Participants generally supported
more integrated presentation which would, for example, better link and

BANCO DE ESPAÑA 71 ESTABILIDAD FINANCIERA, NÚM. 22
allow navigation between the Pillar 3 and financial report (e.g., IFRS 7) risk
disclosures, align the timing of their publication, and achieve more comparability
across jurisdictions and banks. In addition, some noted as important that
liquidity information was included in the Pillar 3 framework, as set forth in the
Basel Committee’s current plans.
– Scenario and sensitivity analyses. Some participants expressed their desire
that the results of stress tests should be disclosed in financial reports, possibly
with an indication as to whether the results are reviewed by external auditors.
Care should be taken to properly interpret stress test results and summaries
information in a manner useful to investors (e.g., using the impacts on earnings
and capital of a certain change in interest rates, providing relevant information
about non-linearity).
The roundtable showed the value of robust exchanges on shortcomings in disclosures
among a wide range of private sector and public sector stakeholders. The full range of
participants agreed that it would be important for investors, financial institutions and
auditors to develop principles and formats for better risk disclosures going forward, with
input from standard setters and regulators, as recommended in the FSB Report.
Participants noted that these principles and leading practice disclosures should be broad
in scope to avoid disclosure arbitrage among various market participants.
However, some felt that the private sector would not initially be able to carry forward this
work on its own. Some called for more proactive involvement of the official sector under
the current stressed situations where voluntary risk disclosure initiated by some in the
private sector alone might not be sufficient to restore confidence quickly. Many expressed
the view that the FSB should continue to help encourage and facilitate this work, perhaps
by conducting another roundtable in 2012 and prompting a task force of investors,
analysts, rating agencies, financial institutions, and auditors, with input from standard
setters and regulators, to take forward this work.
Taking account of the views expressed at the December 2011 FSB roundtable and the
recommendations set forth in a March 2011 FSB report on risk disclosures, the FSB
announced in March 2012 the following next steps:
– The FSB will facilitate the formation of a task force to develop principles for
improved disclosures based on current market conditions and risks, including
ways to enhance the comparability of disclosures. The task force will involve
investors, financial institutions, and external auditors and will be requested to
develop proposed principles later this year for implementation in connection
with end-year 2012 annual reports. The task force is expected to commence
its activities in May 2012.
– The task force will be encouraged to have dialogue with standard-setting
bodies, such as IOSCO, BCBS, IAIS, the IASB, the U.S. FASB and the IAASB,
at key stages as it develops its recommendations and to report to the FSB.
– The FSB will also ask the task force to identify leading practice risk disclosures
presented in annual reports for end-year 2011 based on broad risk areas such
as those identified in the summary of the roundtable. The task force would be
asked to report on these leading practice disclosures to the FSB in 2012.
FSB next steps in its risk
disclosure initiative

BANCO DE ESPAÑA 72 ESTABILIDAD FINANCIERA, NÚM. 22
– The FSB will consider holding another international roundtable in late 2012 to
facilitate further discussion by investors, financial institutions, auditors,
standard setters, regulators and supervisors on market conditions and risks
at that time and the progress toward improving the transparency of risks and
risk management through relevant disclosures.
As the March 2011 FSB report noted, should the follow-up actions by the private sector
not result in sufficient progress in this area, the appropriate international standard-setting
bodies will be asked to take forward work to consider principles.
In May 2012, the FSB announced that the new private sector task force – called the
Enhanced Disclosure Task Force – has been established and the FSB public statement
provided information about the co-chairs and other members of the task force. Mark
Carney, Chairman, FSB, welcomed the formation of the Enhanced Disclosure Task Force.
He added “The FSB supports these efforts which, together with the activities of standard
setters, are expected to result in improved risk disclosure practices by financial institutions
that will provide timely and useful information to investors.”20
The FSB and its predecessor, the FSF, have encouraged improvements in the transparency
of financial institutions and this article has summarized key initiatives in this respect, with
a focus on those since 2008. These include calls for actions by market participants,
standards setters, supervisors and regulators in a number of broad areas; namely:
– Convergence to improved standards by the IASB and FASB;
– Risk disclosure by market participants starting in 2008 about structured credit
products, subprime exposures and SPEs;
– Off-balance sheet entities;
– Valuation;
– Transparency in securitization processes and markets;
– Enhanced external audit practices; and
– A joint private sector initiative to improve risk disclosure practices.
There has been a good deal of progress toward improved standards and practices. The FSB’s
thematic review of risk disclosure practices found that risk disclosure by financial institutions
had improved following the FSF’s 2008 recommendations. In addition, the IASB and FASB are
making progress on projects to improve and converge their standards on financial instruments,
including a joint expected loss impairment/provisioning approach and a more converged
approach to classification and measurement. Important improvements to their standards on
financial instruments, valuation, and off-balance sheet entities were finalised in 2011.
The more recent initiatives on external audit and joint private sector work on better risk
disclosure principles and practices are aimed at further enhancements in practices
beginning within the next year.
6 Conclusion
20 The FSB press release can be seen at www.financialstabilityboard.org/press/pr_120510.pdf.

BANCO DE ESPAÑA 73 ESTABILIDAD FINANCIERA, NÚM. 22
Enhanced dialogue between regulators, standard setters and industry is very important. The
FSB encourages such dialogue in a manner that respects the independence of the standard
setting bodies. This dialogue with key stakeholders and respect for the independence of
standard setters are critically important in achieving improved global standards and their
sound, high quality implementation across jurisdictions and the financial services industry.
The FSB will continue to encourage improved standards and practices and monitor
progress as part of its initiatives to enhance transparency.


(*) Óscar Arce, Anna Ispierto y Rosario Martín pertenecen al Departamento de Estudios, Estadísticas y Publicaciones
de la Comisión Nacional del Mercado de Valores.
Este artículo es responsabilidad exclusiva de los autores y no refleja necesariamente la opinión del Banco de España
ni de la Comisión Nacional del Mercado de Valores.
Óscar Arce, Anna Ispierto y Rosario Martín (*)
HACIA MERCADOS SECUNDARIOS DE TITULIZACIÓN LÍQUIDOS Y EFICIENTES


BANCO DE ESPAÑA 77 ESTABILIDAD FINANCIERA, NÚM. 22
HACIA MERCADOS SECUNDARIOS DE TITULIZACIÓN LÍQUIDOS Y EFICIENTES
Durante la década previa al inicio de la crisis, la titulización se convirtió en una importante
fuente de financiación que permitió al sistema financiero la obtención recurrente de fon-
dos con los que mantener la expansión de la actividad crediticia. No obstante, el rápido
crecimiento de esta actividad conllevó una serie de riesgos que terminaron afectando al
conjunto de la economía. Uno de los aspectos que pudo amplificar los efectos de la crisis
(especialmente, en sus fases iniciales) y facilitar la trasmisión de las tensiones entre los
diferentes mercados fue el escaso grado de desarrollo del mercado secundario de tituliza-
ción. Esta carencia limitó las posibilidades de formar precios fiables para estos productos
y dar así a los inversores, en una situación financiera más vulnerable, una posible salida
ordenada para sus exposiciones en estos productos. En este contexto, el presente artícu-
lo subraya la necesidad de desarrollar mercados secundarios líquidos y eficientes como
un elemento esencial en cualquier proceso de reestablecimiento sólido y sostenible de la
titulización.
El reconocimiento por parte de varias entidades financieras de sus dificultades para obte-
ner un valor de mercado de algunos productos de titulización vinculados a hipotecas
subprime estadounidenses fue el detonante, en agosto de 2007, de la actual crisis finan-
ciera. Progresivamente, los problemas de iliquidez y riesgo de crédito, inicialmente identi-
ficados en un segmento del mercado de titulizaciones hipotecarias muy concreto, se ex-
tendieron a otros ámbitos del sistema financiero. De este modo, caben pocas dudas de
que la titulización introdujo en el sistema financiero una forma de riesgo sistémico que ni
la industria, ni los mercados, ni las autoridades reguladoras pudieron identificar y corregir
con suficiente antelación.
En los últimos años, varios trabajos han señalado muchos aspectos de la titulización que
podrían haber sido los causantes de ese desequilibrio estructural [véase, por ejemplo,
Joint Forum (2011)]. Entre estos factores causantes destacan la posible falta de incentivos
por parte de los originadores para ejercer un control suficientemente riguroso de la calidad
de los activos titulizados, la escasa transparencia en el funcionamiento de las estructuras de
titulización y en la evolución de las carteras de derechos de crédito subyacentes, y la falta
de información suficiente en cuanto a la identificación y localización de los riesgos reales de
este tipo de operaciones.
Sin embargo, el comportamiento de los mercados secundarios para este tipo de valores
en las primeras etapas de la crisis ha sido escasamente analizado, y ello a pesar de que
este aspecto cobra una especial relevancia cuando se trata de comprender cómo la tituli-
zación actuó de mecanismo transmisor del riesgo al conjunto del sistema financiero en
dicho período. En concreto, la falta de un mercado secundario líquido para los valores de
titulización que permitiese la formación de precios de mercado suficientemente informati-
vos y fiables, unida a la complejidad característica de estos valores, fue una de las princi-
pales causas de las turbulencias que afectaron inicialmente a los balances de los bancos
que mantenían alguna exposición en este tipo de productos y de las distorsiones en el
funcionamiento de otros mercados, como el de los bonos corporativos.
El presente artículo analiza el papel desempeñado por los mercados secundarios de valores
de titulización en la actual crisis financiera y subraya la necesidad de avanzar hacia mer-
cados más líquidos y eficientes para este tipo de valores. Con este objetivo, el documento
1 Introducción

BANCO DE ESPAÑA 78 ESTABILIDAD FINANCIERA, NÚM. 22
se ha dividido en las siguientes secciones. En el apartado segundo se describe el período
de crecimiento de la titulización. En el tercero se analizan el papel de la titulización duran-
te las distintas etapas de la crisis y las repercusiones que ha tenido su declive en otros
sectores financieros. En el apartado cuarto se describen los principales problemas aso-
ciados a la titulización y las medidas tomadas hasta el momento para corregirlos. El
quinto apartado se centra en la necesidad de conseguir mercados secundarios eficientes
para estos valores y describe cómo algunas de las iniciativas institucionales y privadas
puestas en marcha pueden contribuir a este objetivo. El documento se cierra con un
apartado final de conclusiones.
El desarrollo de los mercados de titulización comenzó en Estados Unidos en la década
de 1990, siendo el período comprendido entre los años 2000 y 2007 el que registró las
mayores tasas de crecimiento en las emisiones de estos productos (véase gráfico 1).
Desde finales de la última década del siglo pasado, el proceso de crecimiento de la tituli-
zación se vio impulsado por la disminución relativa del volumen de depósitos bancarios
de los clientes particulares que, ante las bajas remuneraciones ofrecidas, buscaron instru-
mentos más rentables en los que colocar sus ahorros, al tiempo que ese entorno de bajos
tipos de interés hacía aumentar la demanda de crédito. Para hacer frente a este desequi-
librio entre la oferta y la demanda de fondos, el sector bancario buscó vías alternativas de
financiación y encontró en los mercados mayoristas de capitales, especialmente en el de la
titulización, una vía accesible para cubrir ese déficit. Así, entre los años 2000 y 2007 el
volumen de activos titulizados en Estados Unidos aumentó en 1,5 veces, y se quintuplicó
en Europa, aunque en este último caso partiendo de una cifra inicial muy baja.
La elevada aceptación de este tipo de valores en los mercados internacionales convirtió la
titulización en una importante fuente de financiación para muchos países industrializados.
Por ejemplo, el Fondo Monetario Internacional estima que en Estados Unidos, a media-
dos del año 2009, el 16 % del crédito hipotecario para la compra de vivienda estaba fi-
nanciado por la titulización privada [véase FMI (2009)]1. En Europa, por su parte, se esti-
ma que en 2006 aproximadamente el 10 % del mercado hipotecario residencial estaba
financiado por titulizaciones [véase Comisión Europea (2006)]. En España, la importancia
2 La titulización antes
de la crisis subprime
2.1 EVOLUCIÓN DE LAS
PRINCIPALES MAGNITUDES
EMISIONES GLOBALES DE TITULIZACIÓN: 1990-ENERO DE 2012 GRÁFICO 1
FUENTE: Dealogic.
0
75.000
150.000
225.000
300.000
375.000
450.000
525.000
600.000
675.000
1990 1991 1992 1993 1994 1995 1996 1997 1998 1999 2000 2001 2002 2003 2004 2005 2006 2007 2008 2009 2010 2011 2012
OTROS EUROPA ESTADOS UNIDOS
Millones de euros
1 Tradicionalmente, en Estados Unidos las agencias gubernamentales (principalmente, la Federal Home Loan Mortgage
Corporation, conocida como Freddie Mac, y la Federal National Mortgage Association, conocida como Fannie Mae)
habían sido las promotoras de titulizaciones. Sin embargo, la titulización privada, es decir, toda aquella no realizada
por alguna de las agencias gubernamentales, cobró relevancia entre 2004 y 2007, llegando a realizar, en alguno de
esos años, más del 50 % de todas las emisiones de titulización dentro del mercado estadounidense.

BANCO DE ESPAÑA 79 ESTABILIDAD FINANCIERA, NÚM. 22
de la titulización en la actividad económica durante el último ciclo expansivo también
estuvo especialmente ligada a los activos hipotecarios, lo que queda patente en el hecho
de que los fondos de titulización hipotecaria representaban el 30,5 % del volumen vivo del
crédito hipotecario a finales de 2008, cifra que se eleva hasta el 54,3 % si además se in-
cluyen las titulizaciones de cédulas hipotecarias. El rápido crecimiento de los activos
españoles titulizados durante esos años convirtió a la industria española de titulización en
la segunda proveedora de este tipo de valores en el ámbito europeo (véase gráfico 2).
Aunque el sector de la vivienda fue el principal destinatario de los fondos obtenidos a par-
tir de las titulizaciones, hubo otros sectores que también se beneficiaron del auge de este
tipo de financiación estructurada, como fueron los del consumo y el préstamo empresarial.
El crecimiento de la titulización a escala global se vio también impulsado por la relativa
escasez de instrumentos de ahorro considerados como seguros, de manera que este tipo
de financiación estructurada emergió como uno de los mecanismos más eficaces para
generar nuevos activos de elevada calidad crediticia a gran escala2.
El gráfico 3 muestra el extraordinario crecimiento en la proporción de activos emitidos con
calificación de triple-A sobre el total de emisiones de renta fija a largo plazo desde comien-
zos de la década de los noventa hasta 2009. En efecto, entre 1990 y 2006 los activos con
la máxima calificación crediticia pasaron de suponer poco más del 20 % del total de emisio-
nes de renta fija calificadas a representar casi el 55 % de las mismas. Analizando la contri-
bución de los distintos activos al crecimiento total de los activos con calificación triple-A,
puede comprobarse la importancia de la titulización en la producción de activos considera-
dos seguros. En concreto, durante ese período, las titulizaciones dieron cuenta del 64 % del
crecimiento de la emisión bruta de los instrumentos de renta fija a largo plazo con la máxima
calificación crediticia, frente a un 27 % atribuible al crecimiento de la deuda pública. Asimis-
mo, mientras que el porcentaje promedio de emisiones corporativas con triple-A, en rela-
ción con las emisiones corporativas totales, era del 9 %, esta proporción alcanzó el 18 %
para las emisiones soberanas, elevándose hasta el 75 % en el caso de las titulizaciones.
Durante los años previos a la crisis, los bancos fueron los principales compradores pri-
vados de valores procedentes de titulizaciones. Las compañías de seguros, los fondos
de inversión y los gestores de activos completarían la relación de inversores, pero den-
tro de un segundo orden. No obstante, durante ese período se observaron diferencias
2.2 EL PAPEL DE LA
TITULIZACIÓN COMO
MECANISMO DE
GENERACIÓN DE ACTIVOS
DE ALTA CALIDAD
CREDITICIA
EMISIONES DE TITULIZACIÓN EUROPEAS: 2003-SEPTIEMBRE DE 2011 GRÁFICO 2
FUENTES: AFME y Comisión Nacional del Mercado de Valores.
0
50
100
150
200
250
300
2003 2004 2005 2006 2007 2008 2009 2010 Sep-11
GRAN BRETAÑA ESPAÑA HOLANDA ITALIA ALEMANIA
mm de euros
2 Véanse CNMV (2010) y FMI (2012).

BANCO DE ESPAÑA 80 ESTABILIDAD FINANCIERA, NÚM. 22
importantes en el abanico de inversores en función de las diferentes áreas económicas
(véase gráfico 4). Así, por ejemplo, en Estados Unidos las agencias gubernamentales fue-
ron no solo los principales originadores, sino también inversores muy activos en este tipo
de productos, de manera que a finales del 2006 estas agencias contabilizaban en su haber
el 21 % de todos los valores respaldados por hipotecas3. Por su parte, en el ámbito de la
UE, los bancos ocuparon una posición predominante como inversores de este tipo de
productos, destacando la relevancia del papel desempeñado por los vehículos emisores
de pagarés respaldados por activos (Asset-Backed Commercial Paper conduits, ABCP).
Estas estructuras fueron uno de los principales demandantes de valores de titulización,
aunque resulta difícil conocer su exposición exacta, al tratarse de figuras económicas
sometidas dentro del territorio europeo a legislaciones muy diferentes, no siempre bajo
la supervisión de los organismos reguladores y que en muchas ocasiones se ubicaron
fuera del perímetro de consolidación de sus originadores, normalmente bancos. Con
todo, se estima que a finales de 2006 en la UE estos vehículos contabilizaban en torno al
20 % del total del saldo vivo de titulizaciones en ese momento4.
EMISIÓN BRUTA DE RENTA FIJA CON TRIPLE-A MUNDIAL GRÁFICO 3
FUENTE: Dealogic. NOTA: La categoría «resto» incluye cédulas hipotecarias, acciones preferentes y otros instrumentos de renta ja a largo plazo.
0
10
20
30
40
50
60
70
0
1.000
2.000
3.000
4.000
5.000
6.000
7.000
1990 1991 1992 1993 1994 1995 1996 1997 1998 1999 2000 2001 2002 2003 2004 2005 2006 2007 2008 2009 2010 2011
DEUDA SOBERANA TITULIZACIONES (INCLUYENDO AGENCIAS) BONOS CORPORATIVOS RESTO PESO EN EL TOTAL (Escala dcha.)
mm de dólares %
INVERSORES EN TITULIZACIONES GRÁFICO 4
FUENTES: Fondo Monetario Internacional y Bond Market Association.
19%
18%
18% 1%
10%
15%
20%
BANCOS INVERSORES EXTRANJEROS AGENCIAS GUBERNAMENTALES VEHÍCULOS DE INVERSIÓN INMOBILIARIA FONDOS DE INVERSIÓN ASEGURADORAS/FONDOS DE PENSIONES OTROS
ESTADOS UNIDOS: MEDIADOS DE 2007
52%
13%
24%
5% 1% 1% 4%
BANCOS ASEGURADORAS/FONDOS DE PENSIONES GESTORES DE FONDOS HEDGE FUNDS EMPRESAS CLIENTES PRIVADOS BANCOS CENTRALES
EUROPA: MEDIADOS DE 2005
3 De acuerdo con los datos publicados por Inside Mortgage Finance en su revista Inside MBS and ABS, del
16 de marzo de 2007.
4 Véase el informe «Moody’s Special Investment Report 2006».

BANCO DE ESPAÑA 81 ESTABILIDAD FINANCIERA, NÚM. 22
Después de más de una década de crecimiento continuado, a mediados de 2007 se pro-
dujo un cambio brusco en el entorno descrito antes, provocado fundamentalmente por
dos hechos que desestabilizaron las bases del sistema financiero. Por una parte, el au-
mento de los tipos de interés a partir de 2004 por parte de la Reserva Federal estadouni-
dense (entre 2004 y 2006 el tipo oficial pasó del 1 % al 5,25 %) y, por otra, el descenso
sostenido del precio de la vivienda desde finales de 2006. Ambos factores provocaron,
indirectamente, un rápido crecimiento de la morosidad y las ejecuciones hipotecarias. No
cabe duda de que el tamaño alcanzado por el mercado subprime en Estados Unidos en los
años que precedieron al inicio de la crisis contribuyó de forma clara a este hecho. En efecto,
mientras que en 2002 el volumen de créditos subprime representaba el 7 % del mercado
hipotecario de ese país, en 2007 la cifra era del 12,5 %.
Como cabría esperar, los bonos respaldados por los préstamos subprime fueron los prime-
ros en empezar a notar los efectos de los impagos. Así, en junio de 2007 Bear Stearns tuvo
que inyectar liquidez en dos hedge funds que mantenían posiciones en valores vinculados
a hipotecas subprime. En julio de ese año, varios inversores en series de bonos con califi-
caciones bajas anunciaron pérdidas en sus posiciones y aumentó el número de vehículos
que necesitaron de apoyo financiero para hacer frente a sus compromisos.
IKB Deutsche Industriebank (IKB) fue el primer banco europeo que reconoció estar sufrien-
do problemas financieros debido a hipotecas subprime estadounidenses, y en julio de 2007
esta entidad también anunció que debía proporcionar liquidez, por un importe de 3.500
millones de euros, a uno de sus vehículos de titulización con inversiones subprime. Unos
meses más tarde, en febrero de 2008, el Gobierno alemán anunció que IKB necesitaba una
inyección de liquidez de 1.500 millones de euros para evitar la quiebra. En agosto de 2007
BNP Paribas hizo pública la suspensión de tres fondos de inversión, al no poder calcular su
valor liquidativo debido a la imposibilidad de obtener un valor de mercado de los activos en
los que había invertido. En palabras de la propia entidad, «la desaparición de toda transac-
ción en ciertos segmentos del mercado de la titulización en Estados Unidos lleva a una
ausencia de precios de referencia y a una falta de liquidez casi total de los activos que
forman parte de las carteras de los fondos, sea cual sea su calidad o rating. Esta situación
ya no permite establecer una valoración justa de los activos subyacentes y así calcular un
valor liquidativo para estos tres fondos» (nota de prensa de BNP, del 9 de agosto de 2007).
De manera simultánea, la incertidumbre que se generó sobre la calidad de los activos ti-
tulizados afectó de manera considerable al mercado de los ABCP, algunos de los cuales
sufrieron una situación, prácticamente, de pánico inversor. Ello fue debido al desfase en
los vencimientos de activos y pasivos con que operaban estas estructuras, para las que
una de sus principales fuentes de ingresos era arbitrar el diferencial entre los activos a
largo plazo —en su mayoría, valores de titulización que mantenían en sus carteras— y los
pasivos a corto plazo, los ABCP, que emitían para financiar la compra de dichos activos.
Dado que en la mayoría de los casos estos vehículos no llevaban a cabo una gestión ac-
tiva de sus carteras, se limitaban a renovar los pasivos a medida que se producía su ven-
cimiento. Cuando los tenedores de ABCP comenzaron a dudar de la capacidad de repago
de estos valores, respaldados por valores de titulización en algunos casos vinculados a
hipotecas subprime, dejaron de renovar sus inversiones al vencimiento abandonando los
vehículos con dificultades para hacer frente al pago del resto de los reembolsos pendientes.
Sin embargo, fueron pocos los inversores que incurrieron en pérdidas en ese momento,
dado que la mayoría de los vehículos tenían garantías de crédito o mejoras crediticias
concedidas por bancos, normalmente los promotores de los vehículos, para hacer estas
estructuras más atractivas. En conjunto, únicamente el 2,5 % de los ABCP en circulación
3 La crisis
en los mercados
de titulización
3.1 EL AGOTAMIENTO
DEL CICLO EXPANSIVO

BANCO DE ESPAÑA 82 ESTABILIDAD FINANCIERA, NÚM. 22
en julio de 2007 se clasificó como impagado en el período entre julio de 2007 y diciembre
de 2008, siendo los bancos los que absorbieron la mayoría de esas pérdidas. Como resul-
tado, el saldo vivo de ABCP en el mercado estadounidense se contrajo un 44 % en la se-
gunda mitad del 2007 y un 80 % en el europeo5.
Pero no fueron únicamente los vehículos emisores de ABCP la única forma de titulización
que tuvo que ser rescatada debido a desequilibrios estructurales. Así, por ejemplo, se
estima que, desde mediados de 2007, el 30 % de los valores de titulización respaldados
por préstamos a particulares distintos de los préstamos hipotecarios y por deuda emitida por
empresas (en adelante, por sus siglas en ingles CDO - collaterized debt obligation) fue
transferido a los balances de los bancos originadores. De este modo, los bancos se con-
virtieron en los principales tenedores de valores procedentes de titulizaciones.
La consecuencia inmediata fue que la incertidumbre sobre la calidad crediticia de estos
valores se convirtió en incertidumbre sobre la calidad crediticia de los bancos. El motivo
fue que el sistema contable de los bancos, a diferencia del de la mayoría de los vehículos,
exigía la incorporación de esos activos a valor de mercado6. Sin embargo, en ese momen-
to no existía un mercado secundario líquido para estos valores, lo cual obligó a la banca a
reconocer en sus balances activos con alto grado de deterioro. Esto, a su vez, hizo que
las entidades bancarias incurriesen en mermas de capital inesperadas, reduciendo la con-
fianza de los mercados en su solvencia y dificultando así el acceso de estas entidades a
sus fuentes de financiación. Esto se vio reflejado en el aumento de los diferenciales de los
mercados interbancarios, tanto estadounidenses como europeos, que fue más intenso en
Estados Unidos debido, principalmente, a la mayor importancia relativa de la financiación
basada en depósitos minoristas en el caso de la banca europea.
Simultáneamente, los mercados secundarios comenzaron a experimentar niveles crecien-
tes de la volatilidad, en gran medida debido a una mayor consideración del riesgo en la
formación de los precios en mercado, combinado con políticas de inversión más conser-
vadoras por parte de los inversores, que comenzaron a deshacer sus posiciones con
mayor riesgo. Todos estos factores generaron movimientos sustanciales de los precios, lo
que provocó una elevada inestabilidad de los precios de muchos activos.
Como se ha señalado anteriormente, la titulización afectó en primera instancia al mercado
interbancario. Sin embargo, en un segundo estadio de la crisis otros mercados se vieron
asimismo afectados por los problemas de la titulización. En concreto, uno de los merca-
dos financieros más afectados indirectamente fue el de los bonos corporativos.
En efecto, algunos fondos de inversión operaron como mecanismo de transmisión de las
tensiones en los mercados de titulización a otros mercados. En particular, estas entidades
adquirieron antes del inicio de la crisis importantes cantidades de bonos procedentes de
titulizaciones, atraídas por su elevada rentabilidad. Una vez iniciadas las turbulencias finan-
cieras en 2007, muchos fondos tuvieron que hacer frente a dos problemas. Por un lado, no
podían contar con sus carteras de titulización para obtener efectivo con el que afrontar los
reembolsos ordinarios o anticipados que pudieran surgir, dado que no había un mercado
secundario activo en el que vender estos productos. Por otro lado, los fondos que estaban
obligados a mantener determinadas ratios de calidad crediticia en sus carteras se vieron
3.2 ILIQUIDEZ EN
LOS MERCADOS DE
TITULIZACIÓN Y CONTAGIO
A OTROS MERCADOS
5 De acuerdo con los datos publicados por la Reserva Federal de Estados Unidos y AFME.
6 El valor de mercado puede calcularse a partir de valores tomados de mercados activos o mediante modelos de
valoración en el caso de mercados inactivos o sin datos disponibles.

BANCO DE ESPAÑA 83 ESTABILIDAD FINANCIERA, NÚM. 22
forzados a reequilibrar la composición de sus inversiones, demasiado expuestas en esos
momentos a bonos de baja calidad, como consecuencia de la continuada rebaja de las
calificaciones de los bonos de titulización. Incapaces de vender los activos deteriorados,
tanto por la ausencia de compradores como por su reticencia a registrar en sus libros las
importantes pérdidas que dichas ventas podrían llegar a ocasionarles, procedieron a ven-
der en su lugar otros activos más líquidos, como los bonos corporativos. Por ejemplo,
Manconi et al. (2010) señalan que, en el último trimestre de 2007, los fondos de inversión
estadounidenses redujeron en un 15 % el volumen de bonos corporativos en sus carteras,
mientras que las titulizaciones tan solo disminuyeron un 9 %. La presión vendedora en el
mercado de bonos provocó un aumento del margen entre precios de compra y precios de
venta, y contribuyó también a elevar sensiblemente la volatilidad de sus cotizaciones.
En este contexto, cabe cuestionarse por qué los mercados secundarios de titulización no
funcionaron correctamente. En primer lugar, es necesario reconocer que la negociación de
valores de titulización en el mercado siempre había sido muy moderada. En el momento
en que comenzó la crisis, hay dos razones básicas por las que este mercado secundario
dejó de funcionar. Por un lado, la escasez de capital limitó la capacidad de los agentes
participantes en estos mercados para ejercer su papel de creadores de mercado y, por
otro, muchos de los tenedores de titulizaciones consideraron que el precio de mercado
era mucho menor que la rentabilidad que razonablemente podrían obtener si los mante-
nían hasta el vencimiento, por lo que se mostraron reacios a venderlos.
La consecuencia de todo ello fue una disminución generalizada de los volúmenes nego-
ciados en torno al 45 % en valores de titulización respaldados por préstamos hipotecarios
y del 85 % para valores respaldados por préstamos para la compra de coches, con res-
pecto a los volúmenes previos a la crisis [véase IOSCO (2010)]. En el ámbito europeo, el
Comité Europeo de Reguladores de Valores (CESR, por sus siglas en inglés), precursor
de la actual Autoridad Europea de Mercados y Valores (ESMA), estimó que el número de
transacciones de mercado había pasado de una media de 250 operaciones a la semana
antes de la crisis a situarse entre 50 y 100 durante la misma, muchas de ellas, además,
calificadas como ventas forzadas [véase CESR (2009)]. En este escenario, los diferencia-
les en el mercado secundario aumentaron considerablemente (véase gráfico 5) y, aunque
al inicio de la crisis hubo cierta reticencia a reducir en exceso las valoraciones por miedo a
incentivar las ventas masivas, finalmente los precios sufrieron una caída drástica, alcanzan-
do su punto más bajo a mediados de 2009 (véase gráfico 6).
DIFERENCIALES PARA VALORES RMBS (a) CALIFICADOS AAA: ENERO DE 2009-ENERO DE 2012 GRÁFICO 5
0
200
400
600
800
1.000
1.200
1.400
1.600
ene-07 abr-07 jul-07 oct-07 ene-08 abr-08 jul-08 oct-08 ene-09 abr-09 jul-09 oct-09 ene-10 abr-10 jul-10 oct-10 ene-11 abr-11 jul-11 oct-11 ene-12
AUSTRIA ITALIA HOLANDA ESPAÑA REINO UNIDO PRÉSTAMOS PRIME REINO UNIDO PRÉSTAMOS SUBPRIME
pb
FUENTE: Markit.
a Residential Mortgage Backed Securities, bonos de titulización respaldados por créditos hipotecarios para la adquisición de vivienda.

BANCO DE ESPAÑA 84 ESTABILIDAD FINANCIERA, NÚM. 22
Desde entonces, el mercado secundario de valores de titulización ha experimentado una
cierta recuperación, gracias a la estabilización de los diferenciales fijados en el mercado
primario como consecuencia de los programas de ayuda especiales implementados por
varios Gobiernos y bancos centrales. En todo caso, los mercados han establecido una
clara diferencia entre los diferentes tipos de activos, demandando mayores rentabilidades
a aquellos valores con peor comportamiento histórico, como las titulizaciones respaldadas
por préstamos hipotecarios no residenciales (CMBS, por sus siglas en inglés), o a las ope-
raciones originadas en países afectados por un mayor grado de incertidumbre económica.
Otra de las consecuencias más visibles de la crisis en el ámbito de la titulización ha sido
la práctica paralización del mercado de las emisiones a escala global (véase gráfico 1).
Así, en Estados Unidos las colocaciones privadas de estos activos se redujeron muy sen-
siblemente, hasta representar únicamente el 12 % del volumen total de titulizaciones emi-
tidas en 20117, quedando el mercado abastecido únicamente por las emisiones proce-
dentes de las agencias gubernamentales. En Europa, por su parte, se ha observado una
evolución diferente, registrándose un gran crecimiento de las emisiones de valores de ti-
tulización durante el 2008 para ir disminuyendo paulatinamente en los siguientes años. Sin
embargo, las colocaciones entre inversores privados han sido, durante todos estos años,
muy escasas (véase gráfico 7), debido a que los originadores, esencialmente entidades de
crédito, han retenido los valores en sus balances para su utilización en programas públi-
cos especiales de apoyo al sector financiero y como garantías en las operaciones de in-
yección de liquidez articuladas por los bancos centrales.
En este contexto, cabe señalar que las operaciones extraordinarias de apoyo al sistema
financiero en Europa no incluían inicialmente entre sus objetivos la recuperación del mer-
cado de las titulizaciones. Sin embargo, el modo en el cual se diseñaron muchas de estas
operaciones convirtió la titulización, en algunos casos, en un instrumento útil para acceder
a las mismas (véase gráfico 8). En particular, las titulizaciones cobraron una especial rele-
vancia en la instrumentación de las medidas dirigidas a reducir el peso de los activos
deteriorados en los balances bancarios y en los programas de inyección de liquidez.
Así, por ejemplo, en el Reino Unido, el Banco de Inglaterra puso en marcha en abril de
2008 el Special Liquidity Scheme, que permitía a las entidades financieras y a las socieda-
des constructoras intercambiar temporalmente con la autoridad monetaria algunos de sus
3.3 LA ACTIVIDAD EMISORA
DURANTE LOS AÑOS
DE LA CRISIS FINANCIERA
EVOLUCIÓN DEL ÍNDICE MARKIT IBOXX EUROPE RMBS: ENERO DE 2007 -ENERO DE 2012 GRÁFICO 6
FUENTE: Markit. El Markit iBoxx European RMBS Index está calculado diariamente por Markit a partir de los precios proporcionados por Markit European ABS Pricing Service, obtenidos gracias a las contribuciones de 20 creadores de mercado.
80
85
90
95
100
105
110
1.1.07 1.5.07 1.9.07 1.1.08 1.5.08 1.9.08 1.1.09 1.5.09 1.9.09 1.1.10 1.5.10 1.9.10 1.1.11 1.5.11 1.9.11 1.1.12
7 Datos hasta septiembre de 2011, publicados por la Association for Financial Markets in Europe (AFME). Durante
los años 2005 y 2006 la titulización privada estadounidense suponía algo más del 50 % de todo el mercado.

BANCO DE ESPAÑA 85 ESTABILIDAD FINANCIERA, NÚM. 22
activos ilíquidos, como valores respaldados por préstamos hipotecarios, por bonos del
tesoro, con los cuales podrían financiarse en el mercado con mayor normalidad. De acuer-
do con los datos publicados por la institución, al cierre del plazo para acudir a estas ayu-
das, el Banco de Inglaterra había prestado bonos del Tesoro por un valor nominal de 185 mm
de libras esterlinas.
Por su parte, el Gobierno español constituyó en octubre de 2008 el Fondo de Adquisición
de Activos Financieros, cuyo objetivo era apoyar la oferta de crédito destinado a la activi-
dad productiva de las empresas y los particulares mediante la adquisición de activos fi-
nancieros emitidos por entidades de crédito y fondos de titulización. El Fondo compró
cédulas hipotecarias y bonos de titulización con la máxima calificación crediticia median-
te un sistema de subastas que se llevaron a cabo a finales de 2008 y principios de 2009,
por un importe total de 19.341 millones de euros.
Aunque su actuación no puede enmarcarse estrictamente dentro de ningún plan de res-
cate, lo cierto es que el Eurosistema ha venido desarrollando también durante estos tres
últimos años un papel importante en la provisión de liquidez al sistema financiero europeo.
Cabe destacar en este sentido las adquisiciones temporales de activos de entidades pri-
vadas y las operaciones de crédito con garantía de activos. El importe medio de los valo-
res de titulización depositados en garantía en el Banco Central Europeo (BCE) ascendía a
finales de 2008 a 1,1 billones de euros, lo que supuso el 9 % del total de sus operaciones
durante dicho ejercicio. En 2009, este importe se incrementó hasta los 1,3 billones de
COLOCACIONES PRIVADAS DE LAS EMISIONES EUROPEAS ENTRE 2007 Y 2011 GRÁFICO 7
FUENTES: AFME y Comisión Europea.
0
200
400
600
800
2007 2008 2009 2010 2011
EMISIONES COLOCACIONES PRIVADAS
mm de euros
COMPARATIVA ENTRE LA EVOLUCIÓN DE LAS AYUDAS FINANCIERAS AL SISTEMA FINANCIERO EUROPEO Y LAS EMISIONES DE TITULIZACIÓN: 2006-2010
GRÁFICO 8
FUENTES: AFME y Comisión Europea.
0
500
1.000
1.500
2006 2007 2008 2009 2010
EMISIONES DE TITULIZACIÓN AYUDAS CONCEDIDAS AL SECTOR FINANCIERO EUROPEO
mm de euros

BANCO DE ESPAÑA 86 ESTABILIDAD FINANCIERA, NÚM. 22
euros, el 10 % del total. En 2010 volvieron a depositarse en garantía valores de titulización por
importe de 1,3 billones de euros, que ese año supusieron un 9 % del total.
La incertidumbre sobre el posible deterioro de las carteras de préstamos titulizadas y su
impacto sobre las estructuras de titulización fueron factores que determinaron la paraliza-
ción de este mercado. Los datos que se muestran en el cuadro 1 permiten comprobar que
las series con mejor calificación han tenido un comportamiento estable durante los años
que dura la crisis, mientras que, como cabría esperar, los valores con menores calificacio-
nes han absorbido los impagos procedentes del deterioro de la calidad crediticia de par-
ticulares y corporaciones.
Un análisis más detallado sobre el comportamiento real de las carteras muestra que los
niveles de impago se han distribuido de manera desigual entre los diferentes segmentos
del mercado de la titulización y que, de manera general, el comportamiento de los valo-
res emitidos en Europa ha sido comparativamente mejor que el de los estadounidenses.
En concreto, el nivel de impago de la titulización europea desde que comenzó la crisis a
mediados de 2007 hasta el segundo semestre de 2011 se estima en el 1,24 % del saldo
titulizado8, mientras que el de la estadounidense está en torno al 9,66 %. También los
valores europeos con mejores calificaciones han mostrado mayor fortaleza. Así, a finales
de 2011 tan solo el 0,95 % de los bonos europeos calificados con triple-A hubo de ser
clasificado como impagado, y en ningún caso se trató de RMBS, frente al 7,03 % de las
titulizaciones estadounidenses con la misma calificación. El cuadro 2 proporciona detalles
adicionales sobre la distribución de los niveles de impago en ambas áreas económicas
para el año 2010.
3.4 LA DIVERGENCIA ENTRE
EL PRECIO DE LAS
TITULIZACIONES Y LA
CALIDAD DE LOS ACTIVOS
8 Según estudios realizados por Standard & Poor´s.
2007 2008 2009 2010
AAA 0,0 0,5 0,3 0,3
Investment-grade 0,2 1,0 2,6 0,8
Speculative-grade 3,1 16,1 38,5 20,3
TOTAL 0,6 4,1 16,7 10,9
FUENTE: Standard & Poor´s, «Default Study: Global Structured Finance Default Study-1978-2010: Credit Trends Started to Improve in 2010, but U.S. RMBS faces Challenges».
RATIOS GLOBALES DE IMPAGO DE LOS PRODUCTOS ESTRUCTURADOS: 2007-2010 CUADRO 1
Porcentaje
Europa (%) Estados Unidos (%)
ABS 0,51 0,61
CDO 3,20 4,90
CMBS 2,85 13,09
RMBS 0,73 17,39
Titulización sintética 0,27 0,40
Total global 10,9
ESTADOS UNIDOS FRENTE A EUROPA: RATIOS DE IMPAGO POR SEGMENTO DE TITULIZACIÓN (AÑO 2010)
CUADRO 2
FUENTE: Standard & Poor´s, «Default Study: Global Structured Finance Default Study-1978-2010: Credit Trends Started to Improve in 2010, but U.S. RMBS faces Challenges». NOTA: El segmento RMBS considera también las hipotecas subprime. En el apartado CDO se incluyen tanto CDO en efectivo como sintéticos, a valor de mercado y sobre fondos apalancados. CMBS incorpora Re-REMICS y CRE CDO cuyos subyacentes son locales comerciales o CMBS.

BANCO DE ESPAÑA 87 ESTABILIDAD FINANCIERA, NÚM. 22
En el caso concreto de España, la evolución de los valores de titulización ha sido seme-
jante a la del resto de los valores europeos, con mejor comportamiento, incluso, en algu-
nos segmentos. Así, la tasa total de impago de los bonos de titulización española conta-
bilizada a finales de 2011 fue del 0,09 %9. Las carteras con peor comportamiento fueron
las de préstamos para consumo y automoción, con una tasa de fallidos del 2,62 %, mien-
tras que únicamente el 0,29 % de los préstamos para la compra de vivienda titulizados
había sido clasificado como fallido10.
A pesar del nivel relativamente bajo de impagos en la titulización europea y española, a
raíz de la crisis se ha producido un deterioro en la calidad crediticia de las carteras tituli-
zadas, lo cual ha quedado reflejado en la evolución de los ratings para estos productos
(véase gráfico 9).
No obstante, además de un cierto deterioro crediticio de los activos subyacentes, existen
otros factores que han afectado a la evolución negativa de las calificaciones crediticias de
este tipo de productos, especialmente en el período más reciente. En este sentido, cabe
mencionar los cambios metodológicos introducidos por las agencias de rating en sus
procedimientos de valoración a raíz de la crisis económica o la rebaja de las calificaciones
crediticias soberanas a numerosas instituciones financieras, habituales proveedoras de
servicios a los fondos de titulización. Todo ello ha motivado, en cierta medida, la evolución
a la baja de los ratings de los valores de titulización en los últimos años.
9 Tasa de impago de principal e intereses de bonos de titulización sobre los importes pendientes de reembolso.
10 A finales de 2011 los derechos de crédito hipotecarios para la compra de vivienda representaban el 72 % del
saldo vivo de las carteras de activos titulizados.
EVOLUCIÓN DE LOS RATINGS OTORGADOS A LAS TITULIZACIONES: 2008- 2011 GRÁFICO 9
FUENTE: Dealogic.
0
20
40
60
80
100% %
%
2008 2009 2010 Sep-11
Aaa/AAA Aa/AA A/A
Baa/BBB POR DEBAJO DE BBB
EUROPA
0
20
40
60
80
100
2008 2009 2010 Sep-11
Aaa/AAA Aa/AA A/A
Baa/BBB POR DEBAJO DE BBB
ESTADOS UNIDOS
0
20
40
60
80
100
2008 2009 2010 Sep-11
Aaa/AAA Aa/AA A/A Baa/BBB POR DEBAJO DE BBB
ESPAÑA

BANCO DE ESPAÑA 88 ESTABILIDAD FINANCIERA, NÚM. 22
La paralización del mercado de la titulización y la transmisión de las tensiones antes des-
critas desde esta actividad a través de toda la cadena del sector financiero pusieron al
descubierto, en algunos casos, deficiencias importantes en la gestión del crédito por par-
te de las entidades en las prácticas titulizadoras, en los servicios de calificación del crédito
y en el comportamiento de los inversores. A continuación se detallan algunas de estas
áreas de vulnerabilidad, así como los principales desarrollos normativos adoptados, o en
curso de elaboración o aplicación, que diversas autoridades han impulsado recientemente
para atajar estas deficiencias.
Una de las ideas sobre las que más se ha debatido ha sido la presencia de conflictos de
interés a lo largo de la cadena de la titulización y sus potenciales efectos negativos sobre
la calidad de estos activos11. En concreto, se han identificado tres problemas importan-
tes en este ámbito: el deterioro de los niveles de calidad en la creación y supervisión de
los préstamos por parte de los originadores, la existencia de información asimétrica entre los
diferentes agentes que participan en el proceso y la actuación de las agencias de rating
en la titulización.
Varios estudios recientes han documentado cómo la utilización generalizada del modelo
«originar para distribuir», principalmente en Estados Unidos, redujo el nivel de exigencia en
los procedimientos de aprobación y supervisión de los prestamistas, lo cual podría haber
llevado a una disminución en la calidad de los préstamos titulizados antes de la crisis12. De
esta manera, los originadores de préstamos estarían ahorrándose los costes de obtener
una mayor información sobre la calidad de los activos titulizados, puesto que no obten-
drían ningún beneficio futuro de dicha información, ya que esos activos serían vendidos
posteriormente a través de su titulización13.
Una de las posibles soluciones para hacer frente a este problema, y que ha recibido un
elevado grado de atención a raíz de la crisis, consiste en involucrar de manera más direc-
ta a los originadores en sus propias operaciones de titulización, obligándoles a retener una
parte del riesgo de estas operaciones. La declaración final emitida por el G 20 en la Cum-
bre de Pittsburgh, en septiembre de 2009, recomendaba el establecimiento de umbrales
mínimos de retención para los originadores de estos productos. En un informe publicado
por IOSCO en marzo de 2011 [véase IOSCO (2011)] se señala que la mayoría de las juris-
dicciones ha implementado o está considerando implementar requisitos de retención en
el ámbito de la titulización.
En Estados Unidos, la Dodd-Frank Wall Street Reform and Consumer Protection Act (en
adelante, Ley Dodd-Frank) establece las líneas generales de los requerimientos de reten-
ción del riesgo y deja a la Securities Exchange Commission (SEC) y a las diferentes agen-
cias bancarias federales el desarrollo de las reglas concretas dentro de sus respectivos
ámbitos de actuación. En Europa, los requerimientos de retención para originadores de
titulizaciones que sean entidades de crédito han sido introducidos mediante una modifi-
cación de la Directiva de Adecuación de Capital, conocida como CRD II, en su artículo
122(a)14. En síntesis, la nueva normativa europea establece que los bancos no puedan
invertir en titulizaciones a menos que los originadores de las mismas retengan, como
4 Desarrollos normativos
recientes en el ámbito
de la titulización
CONFLICTOS DE INTERÉS
DETERIORO DE LOS NIVELES
DE CALIDAD EN LA CREACIÓN
Y SUPERVISIÓN DE LOS PARTES
DE LOS ORIGINADORES
11 Ashcraft y Schuermann (2008) realizan una descripción exhaustiva de los diferentes agentes participantes en
el proceso de titulizar y estudian los potenciales conflictos de interés entre ellos.
12 Keys et al. (2010), Purnanandam (2010) o Kara et al. (2010).
13 Véanse también Bubb y Kaufman (2009) o Bhardwaj y Sengupta (2009).
14 Directiva (CE) n.º 111/2009, de 16 de septiembre de 2009.

BANCO DE ESPAÑA 89 ESTABILIDAD FINANCIERA, NÚM. 22
mínimo, el 5 % del riesgo. Además, medidas similares a las recogidas en el artículo 122(a)
de la Directiva de Adecuación del Capital para entidades de crédito se han incluido en
otros desarrollos normativos europeos, como la Directiva (CE) n.º 138/2009, sobre el se-
guro de vida, el acceso a la actividad de seguro y reaseguro y su ejercicio (Solvencia II), y
la Directiva para gestores de inversión alternativos. De esta manera se pretende crear un
marco regulatorio homogéneo en el ámbito europeo para todo el abanico de inversores
potenciales en este tipo de productos y evitar la posibilidad de arbitraje regulatorio.
La existencia de información asimétrica entre los diferentes agentes involucrados en una
titulización ha sido ampliamente señalada como uno de los principales problemas asocia-
dos a este tipo de operaciones. Las prácticas del tipo cherry picking entre originadores y
promotores de titulizaciones podrían haber contribuido a sembrar la duda en el mercado
sobre la calidad de las carteras de activos subyacentes, alimentada, posteriormente, por
la escasa información disponible al respecto a lo largo de la vida de los valores emitidos15.
Por otra parte, la dificultad para entender el funcionamiento de estas estructuras, que en
muchos casos estaban diseñadas específicamente para un inversor, junto con la escasa
información aprovechable acerca de las mismas, motivó que los inversores recurriesen
sistemáticamente a los análisis efectuados por las agencias de rating.
Desde diferentes ámbitos se han llevado a cabo importantes esfuerzos para mejorar la
información puesta a disposición de los inversores y el mercado, tanto en el momento de
la creación de los valores como de manera continuada durante la vida de los mismos. En
este sentido, IOSCO (2010) y el Joint Forum (2011), entre otros, han defendido los bene-
ficios de una mayor transparencia y la necesidad de mayor y mejor información en rela-
ción con los mercados de titulización, de manera que los inversores sean capaces de
llevar a cabo sus propias valoraciones, disminuyendo así su excesiva dependencia de las
agencias de rating.
En Estados Unidos, la Ley Dodd-Frank establece varias directrices generales en este sen-
tido. En el ámbito europeo, se han puesto en marcha varias iniciativas. Así, a través de la
anteriormente mencionada CRD II, se han introducido nuevos requisitos de disponibilidad de
información para originadores o promotores de titulizaciones que sean entidades de depó-
sito. En paralelo, algunas jurisdicciones europeas han desarrollado normativas comple-
mentarias para aumentar la transparencia en este ámbito; así, por ejemplo, en España, la
Comisión Nacional del Mercado de Valores estableció en 2009 requerimientos de informa-
ción pública periódica16, con formato estandarizado y envío electrónico, para los fondos
de titulización.
Otro de los trabajos puestos en marcha recientemente es la loan-level initiative, que el BCE
está desarrollando con el objetivo de promover el establecimiento de una central de regis-
tro de datos europeos para el procesamiento, verificación y transmisión de datos de los
préstamos que respaldan valores de titulización y que son utilizados como colaterales en
las operaciones de las instituciones financieras con este organismo. Está previsto que este
sistema electrónico de información comience a funcionar en el tercer trimestre de 2012.
Por su parte, el Banco de Inglaterra también está en proceso de implementar requerimientos
similares de información, es decir, a escala individualizada, de los préstamos vinculados a
activos elegibles como colaterales en operaciones con esta institución.
EXISTENCIA
DE INFORMACIÓN
ASIMÉTRICA
15 Esta idea ha sido tratada en trabajos académicos como los realizados por Elul (2009) o Berndt y Gupta (2009).
16 Circular 2/2009, de 25 de marzo, de la Comisión Nacional del Mercado de Valores, modificada posteriormente
por la Circular 4/2010.

BANCO DE ESPAÑA 90 ESTABILIDAD FINANCIERA, NÚM. 22
El marco legal y las prácticas del mercado antes de la crisis conformaron un sistema
estrechamente vinculado y muy dependiente de la actuación de las agencias de rating17.
Así, en el ámbito normativo hay tres áreas principales en las que los reguladores han
identificado una dependencia excesiva del mercado con respecto a las calificaciones
crediticias. El primero se refiere al uso de las calificaciones externas para el cálculo de
requerimientos de capital y límites regulatorios18. El segundo está relacionado con el
cumplimiento de requerimientos normativos vinculados a la consecución de determina-
dos niveles de calidad crediticia por parte de fondos de inversión, fondos de pensiones
y compañías de seguros. Y, por último, el tercero alude a la implementación para algunas
instituciones financieras de políticas de inversión asociadas al cumplimiento de niveles
mínimos de rating en sus carteras.
Con respecto a las prácticas de mercado habituales en los años previos a la crisis, el
éxito o el fracaso de las colocaciones de valores en los mercados internacionales de-
pendían, en gran medida, de los informes emitidos por las agencias, ya que los inverso-
res utilizaban sus calificaciones como punto de partida en sus decisiones de inversión,
dedicando pocos recursos, en general, al análisis propio. En este entorno, las bruscas
rebajas en las valoraciones de las titulizaciones que tuvieron lugar al comienzo de la
crisis plantearon una serie de interrogantes acerca de la calidad de las mismas19. En
concreto, entre los problemas más relevantes detectados en este ámbito destacan la
posibilidad de conflicto de intereses en el doble papel de las agencias de rating, como
oferentes de servicios de asesoramiento o consultoría a los emisores de titulizaciones,
por un lado, y como valoradores, por otro; el riesgo de selección estratégica de las ca-
lificaciones por parte de los emisores (rating shopping) con el objetivo de lograr la mejor
calificación posible; la reducida experiencia en la calificación de titulizaciones, especial-
mente aquellas más complejas para las que no existían registros estadísticos lo sufi-
cientemente representativos sobre su comportamiento histórico, y la falta de informa-
ción relativa a algunos aspectos clave, como la metodología de valoración, el significado
de las calificaciones o la profundidad y calidad del análisis de riesgos de los activos
subyacentes.
Por ello, el Comité de Estabilidad Financiera (FSB, por sus siglas en inglés) ha recomen-
dado una reducción progresiva de la dependencia de organismos públicos e instituciones
financieras de su dependencia en las calificaciones emitidas por las agencias de rating y,
actualmente, muchos países están trabajando en este sentido20.
En la actualidad, la mayoría de instituciones y organismos ha reconocido los beneficios de
la titulización y la necesidad de recuperar esta forma de financiación para bancos y otras
entidades financieras. Aunque la inexistencia de un mercado secundario para las titulizacio-
nes durante la crisis no ha sido considerada como una causa de primer orden del colapso de
esta industria, los estudios realizados por diferentes instituciones coinciden en que la
existencia de un mercado transparente y eficiente para este tipo de valores es uno de los
AGENCIAS DE RATING
5 El papel de la
titulización en el
escenario postcrisis:
el papel de los
mercados secundarios
17 El Joint Forum realizó un estudio sobre el papel que desempeñan las agencias de rating en las diferentes juris-
dicciones y fue publicado en junio del 2009 bajo el título Stocktaking on the use of credit ratings.
18 En el ámbito europeo, es especialmente relevante para en método contable standard y para las titulizaciones.
19 Ashcraft et al. (2009) o Mathis et al. (2009).
20 La sección 939A de la Ley Dodd-Frank requiere a las agencias federales revisar la normativa vigente para de-
terminar el grado de dependencia en las calificaciones emitidas por las agencias de rating y recomienda redu-
cirla, en la medida de lo posible. En esa misma línea, la Comisión Europea publicó en noviembre de 2011 una
propuesta de directiva para modificar las disposiciones legales sobre determinados organismos de inversión
colectiva en valores mobiliarios y gestores de fondos de inversión alternativos en lo que se refiere a la depen-
dencia excesiva de las agencias de rating.

BANCO DE ESPAÑA 91 ESTABILIDAD FINANCIERA, NÚM. 22
factores fundamentales para lograr la recuperación de esta actividad21. En este ámbito,
como se analiza en detalle a continuación, los esfuerzos se están centrando en dos áreas
principales: la simplificación y estandarización de los productos, y la transparencia post-
negociación.
Las titulizaciones son productos relativamente complejos, con un alto grado de heteroge-
neidad en sus estructuras, en la composición de las carteras subyacentes y en multitud de
aspectos relacionados con su comportamiento y pago de flujos de efectivo. En Europa,
además, siguen existiendo diferencias importantes ente las regulaciones y las prácticas
de mercado a escala nacional. El grado de heterogeneidad que esto genera ha obstaculi-
zado el desarrollo de los mercados secundarios, ya que los bonos de titulización de unos
inversores eran difícilmente intercambiables con los de otros.
Existen varias iniciativas para conseguir un mercado de valores de titulización más homo-
géneo, sencillo y estandarizado. La industria europea, encabezada por la EFSRT (European
Financial Services Round Table) y AFME (Association for Financial Markets in Europe), está
trabajando en un ambicioso proyecto para conseguir una categoría estandarizada en el
ámbito de la UE de ABS de alta calidad, a través del programa Prime Collateralized Securities
(PCS). El principal objetivo de este programa es aumentar la estandarización en la elabo-
ración de informes, el uso de definiciones, las obligaciones de información y los tipos de
estructuras. En Estados Unidos, por su parte, se está proponiendo a través de la Ley
Dodd-Frank un tratamiento regulatorio diferente para las titulizaciones hipotecarias de alta
calidad. En concreto, cuando el conjunto de activos que respaldan el bono de titulización
cumple los requisitos para ser una hipoteca residencial cualificada (QRM, por sus siglas en
inglés), la estructura titulizada podrá acogerse a determinadas ventajas regulatorias
(como, por ejemplo, quedar exenta de las reglas de retención mínima del riesgo por parte
de los originadores). El cuadro 3 muestra los criterios para determinar si un activo puede
considerarse QRM en Estados Unidos y proporciona una comparativa con los requisitos
del proyecto PCS.
Otra iniciativa que indirectamente redundará en una mayor homogeneización de los valores
de titulización es el desarrollo de una legislación específica para los mercados no organi-
zados (over the counter, OTC) de derivados22. El uso intensivo de los derivados en las
estructuras de titulización genera complejidad en la valoración y en la comprensión de
estos instrumentos por parte de los inversores. De manera general, el nuevo marco regu-
latorio exige mayores requisitos de capital para aquellas transacciones que contengan
derivados no estandarizados, de forma que los participantes en el mercado estarán incen-
tivados a utilizar instrumentos estandarizados y a diseñar las estructuras de titulización,
de forma que obtengan el mayor ahorro posible en términos de capital. Como consecuen-
cia, es posible que algunos tipos de titulizaciones no sean económicamente viables y se
alcance un mayor nivel de estandarización de estos productos reduciendo el abanico de
derivados utilizables para que una transacción sea beneficiosa.
Lograr productos más simples y homogéneos debería ayudar a los inversores a desarro-
llar métodos de valoración más robustos, reducir la segmentación del mercado e impulsar
la presencia de precios de referencia en el mercado.
SIMPLIFICACIÓN
Y ESTANDARIZACIÓN
DE LOS VALORES DE
TITULIZACIÓN
21 Véanse Joint Global Initiative (2008), IOSCO (2010) y CESR (2009).
22 Esta es una de las medidas para la reforma del sistema financiero global acordadas por el G 20 en la cumbre
de líderes de abril de 2009 en Londres.

BANCO DE ESPAÑA 92 ESTABILIDAD FINANCIERA, NÚM. 22
En apartados anteriores se han comentado las iniciativas regulatorias puestas en este
sentido y que afectan, no solamente a la información disponible en el momento de la crea-
ción de los valores, sino también a lo largo de la vida de los mismos23. Es necesaria una
mayor transparencia para fomentar la eficiencia del mercado, para reducir asimetrías de
información entre los agentes de mercado y así, por un lado, mitigar los conflictos de in-
tereses existentes a lo largo de la cadena de titulización y, por otro, promover la compe-
tencia entre los intermediarios (dealers) que operan con este tipo de productos. Así, unos
niveles mayores de transparencia facilitarían la valoración de carteras y posiciones y ayu-
darían a los inversores a la hora de evaluar la calidad de las ejecuciones de órdenes que
impliquen a intermediarios.
No obstante, algunos analistas y participantes en el mercado argumentan que, en el ac-
tual escenario de crisis, los precios de negociación podrían tan solo reflejar ventas urgen-
tes y no las condiciones «fundamentales» de mercado. Además, dado que el número de
participantes en el mercado secundario ha sido tradicionalmente reducido, existe una
preocupación añadida por el riesgo que supone en el anonimato de los participantes en
TRANSPARENCIA
EN LOS MERCADOS
DE NEGOCIACIÓN DE
LOS VALORES DE
TITULIZACIÓN
23 La modificación de la Directiva de Adecuación del Capital, CRD II, también incluye, para aquellos bancos que
actúen como originadores o promotores de titulizaciones, la obligación de proporcionar de manera continuada
información a los inversores sobre la evolución de las carteras titulizadas.
EEUU: QRM UE: PCS
Garantía Primera hipotecaPrimera hipoteca
(segunda si la primera está incluida)
Vencimiento 30 años —
Solicitud por escrito del prestatario Sí —
Mora (c) No No
Mora previa
El prestatario no puede haber estado en mora
durante 60 días o más en el pasado o
con alguna deuda pendiente durante los
24 meses precedentes
Máximo un pago en
los últimos doce meses
Condiciones de pago
No está permitido: carencia de principales,
amortizaciones negativas, pagos a
vencimiento o penalizaciones por
amortizaciones anticipadas
Como máximo, se permiten
pagos anuales
Loan to Value (LTV) 80 % 100 %
Obligación de que el prestatario efectúe
un pago inicial en efectivoSí —
Calidad del deudor
Mensualidad hipoteca / ingresos brutos
mensuales: 28 %
Deudas mensuales totales / ingresos brutos
mensuales: 36 %
Mensualidad hipoteca / ingresos
brutos mensuales: 38 %
Puntos y comisiones Máximo 3 % del préstamo —
Prohibición de sustituir al prestatario Sí —
Publicación de los compromisos
de mitigación en caso de impago asumidos
por el originador
Sí Sí
LOS PROGRAMAS QRM (a) (ESTADOS UNIDOS) Y PCS (b) (UE): ASPECTOS BÁSICOS CUADRO 3
FUENTE: Elaboración propia.
a b PCS son las siglas en inglés de Prime Collateralized Securities.c El deudor no se retrasa más de 30 días en el pago de la hipoteca.

BANCO DE ESPAÑA 93 ESTABILIDAD FINANCIERA, NÚM. 22
el mercado y sus estrategias de negociación un aumento de la transparencia postnego-
ciación. Sin embargo, los acontecimientos han dejado claro que el actual nivel de infor-
mación disponible en los mercados para inversores y supervisores en muchos casos está
todavía por debajo de los niveles óptimos.
En este contexto, la propuesta presentada por la Comisión Europea para la revisión de la
actual Directiva MiFID24 prevé un nuevo régimen de transparencia postnegociación para
productos estructurados que cuenten con folleto informativo o que se negocien en un
mercado organizado. En particular, se establece la obligación de publicar el precio, volu-
men y momento en que se ha efectuado una transacción tanto en mercados organizados
como para el caso de sociedades de inversión y operadores de mercado funcionando en
Sistemas Multilaterales de Negociación (SMN) o en Sistemas Organizados de Negocia-
ción (SON). La Comisión Europea ha delegado en ESMA la determinación de los detalles
prácticos para este nuevo marco de transparencia.
Sin embargo los esfuerzos regulatorios llevados a cabo para mejorar los niveles de trans-
parencia de los mercados secundarios organizados para los valores de titulización po-
drían no ser del todo eficaces si no se tiene en consideración que este tipo de productos
ha sido negociado, mayoritariamente, en mercados OTC. Así, por ejemplo, en 2005, el
95 % de la negociación de los valores de titulización europeos se había realizado directa-
mente cliente-dealer o entre dealers, telefónicamente25.
En general, los mercados OTC se caracterizan por su opacidad y los de titulización no han
sido una excepción. En los años previos a la crisis, los precios de mercado disponibles
para una gran parte de la titulización europea eran proporcionados por las empresas pro-
veedoras de datos y dichos precios no procedían necesariamente de transacciones real-
mente efectuadas, sino que a veces se trataba contribuciones de los agentes del mercado
al libro de órdenes. A pesar de su cuestionable validez como referencias de mercado,
estos precios fueron sistemáticamente utilizados en las valoraciones de colaterales en
operaciones repo, valoraciones de carteras o posiciones de riesgo y para el cálculo del
valor neto de los activos a efectos contables.
En este contexto, el sector privado ya ha puesto en marcha varias iniciativas enfocadas
a corregir los fallos que la crisis financiera ha puesto de manifiesto. Por ello, las últimas
plataformas electrónicas de negociación para bonos europeos (incluidos los proceden-
tes de titulizaciones), como BondMatch o Galaxy, contemplan el cumplimiento de medi-
das en el ámbito de abuso de mercado, la existencia de una cámara de compensación
con cámara de contrapartida central y cuentan con un sistema multilateral para el cru-
zado de operaciones26. También el lanzamiento de nuevos índices de referencia para los
bonos de titulización europea, como el Markit iBoxx European ABS Index27, puede me-
jorar la percepción de los inversores con respecto a los retornos de las carteras de titu-
lización europea.
24 La revision de la MiFID se ha presentado bajo la forma de dos documentos: una versión revisada de la actual
directiva MiFID y, en documento separado, un reglamento, MiFIR.
25 Este dato aparece en el documento Response to FSA discussion paper 05/05 on trading transparency in the UK
secondary bond market, realizado por las siguientes asociaciones: Bond Market Association, European High
Yield Association, Trade Association for Emerging Markets, European Primary Dealers Association y European
Securitisation Forum. Véase también IOSCO (2010).
26 Estos Sistemas Multilaterales de Negociación han sido autorizados por la Autorité des Marchés Financiers
francesa.
27 El Markit iBoxx European ABS Index está formado a partir de datos proporcionados por más de 20 creadores
de mercado.

BANCO DE ESPAÑA 94 ESTABILIDAD FINANCIERA, NÚM. 22
En general, en los mercados OTC se debe mejorar la publicación de información y disponer
de una mayor transparencia en la formación de precios, con una clara distinción entre pre-
cios de transacciones efectivamente realizadas y cotizaciones de precio. También deberían
desarrollarse libros de órdenes que casen órdenes de forma multilateral y que dispongan de
registros históricos como referencia para análisis en el ámbito de la postnegociación.
A lo largo de este documento se ha analizado la forma en que los mercados de tituliza-
ción pudieron contribuir a propagar las tensiones desatadas al comienzo de la actual
crisis financiera a otras partes del sistema financiero. En concreto, se estudia el papel
que ha podido desempeñar la ausencia de un mercado secundario para los valores de
titulización que actuase de mecanismo estabilizador, proporcionando precios fiables
para este tipo de activos y creando un entorno propicio para dar entrada a nuevos inver-
sores y salida a aquellos otros que hubiesen optado por seguir esquemas de inversión
más conservadores.
En estos momentos, desde diferentes ámbitos institucionales se ha manifestado la nece-
sidad de recuperar la titulización como una alternativa válida de financiación para el sector
financiero y empresarial, aunque corrigiendo los errores evidenciados en el pasado e in-
troduciendo nuevos elementos que contribuyan a eliminar el estigma que viene soportan-
do esta industria en los últimos años y lograr hacerla atractiva, de nuevo, para emisores e
inversores. En todo caso, hay que tener en cuenta que, para que las iniciativas regulato-
rias tengan el éxito deseado, es necesario conseguir un equilibrio entre transparencia,
desde el punto de vista de los inversores, que demandan mayor y mejor acceso a la infor-
mación, y la eficiencia, a fin de que la divulgación de dicha información no sea excesiva-
mente onerosa para los originadores.
En este contexto, es deseable que las distintas iniciativas que se lleven a cabo en el ám-
bito de la titulización tengan presente su posible impacto de cara a facilitar el desarrollo
de mercados secundarios líquidos y eficientes para este tipo de valores. La experiencia
obtenida de la evolución histórica de otros mercados financieros, como el de acciones,
muestra la necesidad de conseguir mayores y mejores estándares de divulgación de la
información, al tiempo que una mayor disponibilidad de esta de una forma continuada
durante la vida de los activos, que permita realizar análisis más precisos y tomar unas
decisiones más eficientes. De la misma forma, la transparencia, tanto en relación con los
productos como con los mercados donde se negocian, es necesaria para lograr reglas de
difusión homogénea y comparable a escala internacional. Por su parte, la industria debe
continuar con sus esfuerzos para conseguir que estos productos sean menos complejos
y más estandarizados, pues normalmente solo los instrumentos relativamente sencillos,
sobre los que existe información accesible y comprensible por parte de los inversores,
llegan a ser negociados a gran escala en mercados secundarios.
ASHCRAFT, A., y T. SCHUERMANN (2008). Understanding the Securitisation of Subprime Mortgage Credit, Reserva
Federal del Banco de Nueva York, Staff Report n.º 318.
ASHCRAFT, A., P. GLODSMITH-PINKHAM y J. VICHERY (2009). MBS Ratings and the Mortgage Credit Boom,
European Banking Center, Paper n.º 2010-24S, disponible en http://arno.uvt.nl/show.cgi?fid=107205.
BERNDT, A., y A. GUPTA (2009). «Moral Hazard and Adverse Selection in the Originate-to-Distribute Model of Bank
Credit», Journal of Monetary Economics, vol. 56, pp. 725-743.
BHARDWAJ, G., y R. SENGUPTA (2009). Where’s the Smoking Gun? A Study of Underwriting Standards for US
Subprime Mortgages, Reserva Federal del Banco de San Luis Working Paper n.º 2008-036C, octubre.
BUBB, R., y A. KAUFMAN (2009). Securitisation and Moral Hazard: Evidence from a Lender Cutoff Rule, Reserva
Federal del Banco de Boston, Public Policy Discussion Paper n.º 09-5, septiembre.
CESR (2009). «Transparency of corporate bond, structure finance product and credit derivatives markets - Final
Report», disponible en http://www.esma.europa.eu/system/files/09_348.pdf.
6 Conclusiones
BIBLIOGRAFÍA

BANCO DE ESPAÑA 95 ESTABILIDAD FINANCIERA, NÚM. 22
COMISIÓN EUROPEA (2006). «Report of the Mortgage Funding Expert Group», disponible en http://ec.europa.eu/
internal_market/finservices-retail/docs/home-loans/mfeg/final_report-en.pdf.
COMISIÓN NACIONAL DEL MERCADO DE VALORES (2010). «Los mercados financieros a través de la crisis»,
capítulo 2 del Informe Anual, 2009, disponible en http://www.cnmv.es/DocPortal/Publicaciones/Informes/
AnnualReport2009_weben.pdf.
ELUL, R. (2009). Securitisation and Mortgage Default: Reputation vs. Adverse Selection, Reserva Federal del Banco
de Filadelfia, Working Paper n.º 09-21.
FITCH RATINGS (2008). «The difference between traditional ABCP conduits and SIVs», disponible en http://
fitchratings.com.
— (2008). «Fair Value Accounting: Is It Helpful in Illiquid Markets?», Fitch Research Special Report.
FONDO MONETARIO INTERNACIONAL (2009). «Restarting Securitization Markets: Policy Proposals and Pitfalls»,
Global Financial Stability Report, octubre, capítulo 2.
— (2012). «Safe assets: Financial system corner stone?, Global Financial Stability Report, abril, capítulo 3.
IOSCO (2010). «Transparency of Structured Finance Products – Final Report», disponible en http://www.iosco.org/
library/pubdocs/pdf/IOSCOPD326.pdf.
— (2011). «Implementation Report, report of the IOSCO Task Force on Unregulated Financial Markets and Products»,
disponible en http://www.iosco.org/library/pubdocs/pdf/IOSCOPD348.pdf.
JOINT FORUM (2009). «Stocktaking on the use of credit ratings», disponible en http://www.bis.org/publ/joint22.pdf.
— (2011). «Report on assets securitisation incentives», disponible en http://www.bis.org/publ/joint26.pdf.
JOINT GLOBAL INITIATIVE (2008). «Restoring Confidence in Securitisation Markets», disponible en http://www.sifma.org.
KARA, A., D. MARQUÉS-IBÁÑEZ y S. ONGENA (2010). «Securitization and Lending standards: Evidence from the
Wholesale Loan Market», Banco Central Europeo, disponible en http://www.ecb.int/events/conferences/shared/
pdf/Securitisation_and_lending_standards.pdf?2d0ea0458477730e6a9ec780410704c8.
KEYS, B., J. T. MUKHERJEE, A. SERU y V. VIG (2010). «Did Securitisation Lead to Lax Screening? Evidence From
Subprime Loans», The Quarterly Journal of Economics, vol. 125, n.º 1, pp. 307-362.
MANCONI, A., M. MASSA y A. YASUDA (2010). The Behavior of Intoxicated Investors: The role of institutional
investors in propagating the crisis of 2007-2008, NBER Working Paper n.º 16191.
MATHIS, J., J. MCANDREWS y J. C. ROCHET (2009). «Rating the raters: Are reputation concerns powerful enough
to discipline rating agencies?», Journal of Monetary Economics 56 (5), pp. 657-674.
MOODY’S (2006). Moody’s Special Investment Report.
PURNANANDAM, A. (2010). Originate-to Distribute Model and the Sub-Prime Mortgage Crisis, Corporación Federal
de Seguro de Depósitos, Centro de Estudios Financieros, Working Paper n.º 2010-08.
THE BOND MARKET ASSOCIATION AND THE AMERICAN SECURITIZATION FORUM (2006). «An Analysis and
Description of Pricing and Information Sources in the Securitized and Structured Finance Markets», disponible en
http://www.sifma.org/WorkArea/DownloadAsset.aspx?id=21641.


Manuel Merck Martel, Adrian van Rixtel and Emiliano González Mota (*)
BUSINESS MODELS OF INTERNATIONAL BANKS IN THE WAKE OF THE 2007-2009
GLOBAL FINANCIAL CRISIS
(*) Manuel Merck Martel, Adrian van Rixtel and Emiliano González Mota are economists at the International Financial
Markets Division - DGA International Affairs at the Banco de España. Adrian van Rixtel is currently working at the
Monetary and Economic Department at the Bank for International Settlements. The authors appreciate the valuable
comments received from Vicente Salas and José Manuel Marqués.
This article is the exclusive responsibility of the authors and does not necessarily reflect the views either of the
Banco de España or the Bank for International Settlements.


BANCO DE ESPAÑA 99 ESTABILIDAD FINANCIERA, NÚM. 22
BUSINESS MODELS OF INTERNATIONAL BANKS IN THE WAKE OF THE 2007-2009
GLOBAL FINANCIAL CRISIS
This study provides an analysis of developments in the business models of large internationally
operating banks over the period 2006-2010. The investigation focuses on a sub-group (peer
group) of the largest internationally active banks in the world (10 institutions out of a wider
group of 22), which allows for an in-depth comparison of their business models, balance sheet
structures and performance. Our findings support the view that commercial banking oriented
business models proved more resilient during and in the aftermath of the global financial crisis
(2007-2009) due to their relatively modest exposures to trading and derivatives activities, their
greater reliance on stable sources of funding and larger diversity of business lines.
Regarding perspectives for the future, the regulatory environment is the key challenge for
banks’ business models in the years ahead of us. The evidence shown through the article
strongly suggests that regulation should take into account its business model. On this
issue, the article briefly discusses how some characteristics intrinsically linked to the
business models have been taken into account in several recent important regulatory
initiatives such as those that address the systemic and moral hazard risks associated with
large financial institutions and those aimed at isolating or ring fencing retail banking vis-à-
vis investment banking.
The internationalisation of the banking industry has intensified during the past few decades,
both in terms of cross-border capital flows and cross-border entry in banking sectors
overseas. As shown in Chart 1, international banking exposures grew at average annual
rates above 10% since the mid nineties and up to the start of the financial crisis in the
advanced economies, and gathered strength in emerging economies in the years up to
the crisis (2003-2007). This process occurred in parallel with the globalisation of international
trade and brought important benefits in terms of economic welfare across the globe
[Goldberg (2009), CGFS (2010c)]. The rapid advance of international banking also had
important repercussions for funding and liquidity management at the institutions involved,
and resulted in a diverse range of practices across the spectrum ranging from centralised
to decentralised banks [CGFS (2010b)]. All in all, international banking has been an
important channel for allocating financial resources around the globe and by doing so has
contributed significantly to supporting world economic growth and increasing the financial
linkages between areas with excesses of savings and others with lack of them.
The rapid expansion of international banking was interrupted sharply by the 2007-2009 global
financial crisis which saw important reductions in banks’ international activities and exposures
(Chart 1). The crisis has led to important restructurings of business models and international
strategies of many globally oriented banks, often aided by unprecedented government
support in the form of substantial capital injections, asset protection schemes and liability
guarantees [Stolz and Wedow (2010)]. Moreover, cross-border bank linkages proved
important transmission channels of the crisis, which predominately had its origin in the
mature economies and their complex financial systems, to emerging market economies
[Cetorelli and Goldberg (2011a)]. Hence, the high degree of interconnectedness of the
global banking system, established over the previous years through the interrelated
processes of financial liberalisation, globalisation of trade and finance and financial
innovation, contributed to spread the impact of the financial crisis on domestic banking
systems across the world [Lane and Milesi-Ferretti (2008)].
1 Introduction

BANCO DE ESPAÑA 100 ESTABILIDAD FINANCIERA, NÚM. 22
This article provides an analysis of developments in the business models of large
internationally operating banks over the period 2006-2010, thus including the global
financial crisis, which have seen important changes in the global banking landscape. The
investigation focuses on a sub-group (peer group) of the largest internationally active
banks in the world (10 institutions out of a wider group of 22), which allows for an in-depth
comparison of their business models, balance sheet structures and performance.
The analysis distinguishes between four, relatively simplified and general business models
for internationally operating banks: The specialised investment bank, the investment
banking oriented diversified or universal bank, the commercial banking oriented diversified
or universal bank and the specialised commercial bank (see Table 1).
Our findings support the view that commercial banking oriented business models proved
more resilient than the specialised and diversified investment banking business models
during and in the aftermath of the global financial crisis (2007-2009). In fact, the balance
sheet structure of both the specialised commercial bank and commercial banking
oriented universal bank models displayed relatively modest adjustments after 2008,
while those of numerous banks adopting investment banking oriented business models
changed relatively strongly, with significant relative reductions in securities markets
activities, on the assets side, and in trading and derivatives exposures, on the liabilities
side. This was compensated by relative increases in retail and wholesale lending
activities, and in deposit financing. All in all, most investment banking oriented universal
banks in our sample started to move towards the business model of the commercial
banking oriented universal bank. In this process, international bank exposures in
developed countries experienced a contraction and have not recovered previous rates of
growth, in contrast with the remarkable rebound in developing economies – as Chart 1
suggests –.
The structure of the article is as follows. In Section 2 we provide an overview of the various
business models of large global banking groups, which shows the large dispersion in the
their activities – retail, wholesale commercial, investment banking and asset management –
among banks. We also discuss recent trends in the size of banks and provide evidence of
the significant increase in the concentration of international banks. The subsequent section
focuses on the performance of the banks in the peer group, which reveals important
differences in behaviour across countries as well as inside the same country. Section 4
investigates in depth the funding modes of several of the banks, which shows the existence
SOURCE: BIS.NOTE: Exchange rate adjusted.
YEAR ON YEAR GROWTH IN BANK'S EXTERNAL ASSETS. DEVELOPED VS. DEVELOPING COUNTRIES CHART 1
-40
-20
0
20
40
60
Jun-90 Jun-94 Jun-98 Jun-02 Jun-06 Jun-10
DEVELOPED COUNTRIES DEVELOPING COUNTRIES
%

BANCO DE ESPAÑA 101 ESTABILIDAD FINANCIERA, NÚM. 22
of strongly different funding structures between different business models. Moreover, the
section highlights the differences in liquidity management of large globally active banks,
which range between centralised and decentralised approaches. Finally, the last section
presents our conclusions, including a discussion of the challenges and perspectives of
international banking. The Annex shows different financial indicators for the group of the
largest globally active banks.
The international banking groups that dominate global banking are organized across a variety
of business models, depending on historical and geographical characteristics, comparative
advantages and strategic choices. A traditional separation, especially in the US industry, has
been that between investment and commercial banks. Investment banking entails underwriting
securities issuance for corporate and government clients, advice in mergers and acquisitions
(M&A), sales and trading activities in financial markets (including securities lending activities)
and asset management business, financed predominantly by wholesale funding, as
investment banks as a rule have limited access to deposit funding.1
During the past decade, investment banks developed relatively new business lines such
as proprietary trading, – which involved trading in financial markets with the firm’s own
funds –, and prime brokerage business, which entailed providing financial services,
including clearing and settlement services and securities lending to professional investors
such as hedge funds. By contrast, commercial banks in the US fund themselves largely
through deposits and hence had access to the liquidity facilities of the Federal Reserve,
while their business was concentrated on providing retail and wholesale lending to
households and corporations. With the adoption of the Gramm-Leach-Billey Act, in 1999,
the traditional separation between investment and commercial banks in the US was
overturned which allowed for the establishment of universal banks that combined a wide
range of banking activities in one bank holding company [Komai and Richardson (2011)].
Hence, the US moved towards the global dominant business model of universal banking,
that other advanced countries had already accepted – initially in Europe and later in
Japan as well –.
Given the fact that a large range of business undertakings is possible for banking groups
active in the international arena, it is convenient to distinguish between specialised and
diversified business models [ECB (2010)]. Specialised banks are banks that restrict
themselves – only or predominantly – to a few activities, for example investment banking
or retail banking services. By contrast, diversified or universal banks combine different
banking activities in one organisation, for instance a bank combining investment banking
and corporate banking activities.
In order to analyse the impact of the 2007-2009 global financial crisis on the business models
of large global banking groups we focus on the 22 banks that belong to the list of the largest
systemically important financial institutions (SIFIs) in the world, as published by the Financial
Times in November 2009 [FT (2009)]. The choice of the sample was based predominantly on
business model, size and geographical criteria.2 They can be split into four groups along the
2 Recent trends in global
banks’ business
models and size
1 Due to regulatory constraints, the five US investment banks that existed before the 2007-2009 financial crises
– Goldman Sachs, Morgan Stanley, Merrill Lynch, Lehman Brothers and Bear Stearns – did not have deposit-
taking business.
2 US commercial banks (Bank of America-Merrill Lynch, JP Morgan Chase and Citigroup), US investment banks
(Goldman Sachs, Morgan Stanley), banks from respectively the euro area (including the two largest Spanish
banks Banco Santander and BBVA), the UK and Japan, and finally banks from some other countries, i.e.
Switzerland and Canada (UBS, Credit Suisse and Royal Bank of Canada). The Annex provides a set of financial
indicators that allows for a more detailed inspection of these banks.

BANCO DE ESPAÑA 102 ESTABILIDAD FINANCIERA, NÚM. 22
lines of the business model/speciality matrix represented in Table 1. For the sake of simplicity
we have further restricted the number of banks shown in the tables and graphs to 10
institutions, which form our peer group of banks representative of each category.
First, the model of the specialised or “pure” investment bank, such as for example Goldman
Sachs.3 Second, the investment-banking oriented diversified or universal bank, which
includes Barclays, BNP Paribas, Deutsche Bank and UBS. These banks show predominantly
investment- banking related exposures in both asset and funding structures, but at the
same time they have significant business lines related to more traditional commercial
banking activities. Third, we have identified the model of the commercial-banking oriented
diversified or universal bank, of which Citigroup and HSBC and the two largest Spanish
banks, i.e. Banco Santander and BBVA, are examples. Here, the orientation towards
commercial banking may involve a diversification into retail and wholesale banking, or a
specialisation on either retail or wholesale banking business, while at the same time
maintaining considerable exposures to investment banking activities.4 Finally, we define
the specialised or “pure” commercial bank as characterised by a very high concentration
of business activities on both deposit funding and retail and wholesale lending. We use
funding characteristics as the main criterion to classify a commercial bank, taking into
account that the financial crisis put the spotlight especially on banks’ funding structures.
3 Although both Goldman Sachs and Morgan Stanley changed their official status from investment bank to
traditional bank holding companies in October 2008, which was a pragmatic move to obtain access to the full
range of liquidity facilities of the Federal Reserve and to avoid using mark-to-market accounting for certain
assets [Wall Street Journal (2008)], their actual business model remained that of a specialised investment bank.
4 Our data source Bankscope does not unequivocally provide data on retail and wholesale bank lending activities
for all banks and hence we cannot provide more detailed classifications of retail and wholesale-oriented
commercial banks.
Commercial Banks Investment Banks
Specialised
Its funding structure is dominated by customer
deposits, and it is characterized by a reduced
exposition to trading and derivatives.
The asset structure comprises strong lending activity
(retail /wholesale), and shows limited trading business.
(i.e.: Mitsubishi UFJ).
Its funding structure is dominated by short-term debt
nancing and by a signi cant exposure to trading and
derivatives. Customer deposits nancing is not
signi cant.
The asset structure is depicted by the considerable
contribution of investment securities and trading
activities.
The asset structure is characterized by reduced lending
activity (retail / wholesale)
(i.e.: Goldman Sachs & Morgan Stanley)
Diversi ed or Universal
Its funding structure is dominated by customer deposits,
although it shows a more diversi ed pro le than that of
specialized commercial banks.
The nance structure exhibits a reduced exposure to
trading and derivatives .
The asset structure displays a relatively los contribution
of trading activities.
Customer deposits nancing and lending activities (retail
/ wholesale) play a relevant role compared with
investment banking oriented universal banks.
(i.e.: Citigroup, HSBC, Banco Santander and BBVA).
(i.e.: Barclays, BNP Paribas, Deutsche Bank and UBS).
SOURCE: Merck, Van Rixtel and González.
Its funding structure is dominated by short and long-term
debt issuances and signi cant exposures in their trading
and derivatives portfolios.
Signi cant degree of nancing through customer
deposits though lower than that in the commercial
banking oriented universal banks' segment.
The asset structure shows a solid presence of
investment securities and trading activities.
The asset structure contains considerable lending
activity (retail / wholesale), although lower than that in the
commercial banking oriented universal banks.
TOTAL ASSETS OF THE MOST INTERNATIONALLY-ACTIVE INSTITUTIONS TABLE 1
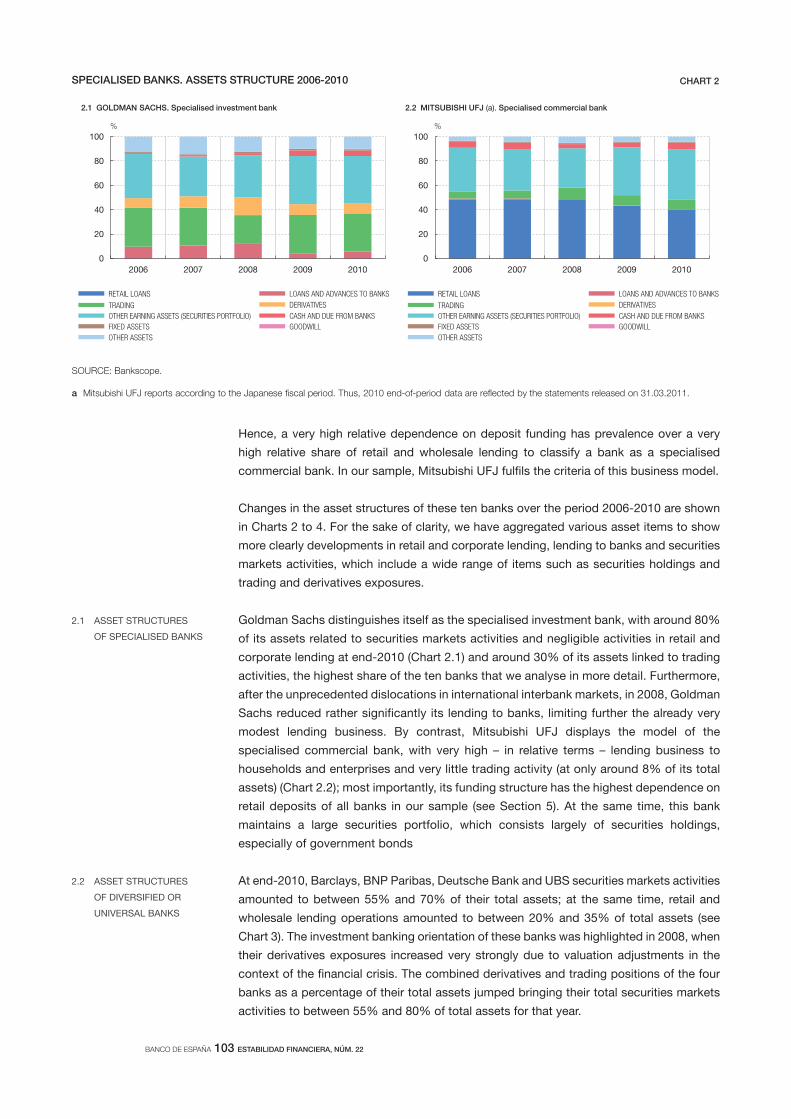
BANCO DE ESPAÑA 103 ESTABILIDAD FINANCIERA, NÚM. 22
Hence, a very high relative dependence on deposit funding has prevalence over a very
high relative share of retail and wholesale lending to classify a bank as a specialised
commercial bank. In our sample, Mitsubishi UFJ fulfils the criteria of this business model.
Changes in the asset structures of these ten banks over the period 2006-2010 are shown
in Charts 2 to 4. For the sake of clarity, we have aggregated various asset items to show
more clearly developments in retail and corporate lending, lending to banks and securities
markets activities, which include a wide range of items such as securities holdings and
trading and derivatives exposures.
Goldman Sachs distinguishes itself as the specialised investment bank, with around 80%
of its assets related to securities markets activities and negligible activities in retail and
corporate lending at end-2010 (Chart 2.1) and around 30% of its assets linked to trading
activities, the highest share of the ten banks that we analyse in more detail. Furthermore,
after the unprecedented dislocations in international interbank markets, in 2008, Goldman
Sachs reduced rather significantly its lending to banks, limiting further the already very
modest lending business. By contrast, Mitsubishi UFJ displays the model of the
specialised commercial bank, with very high – in relative terms – lending business to
households and enterprises and very little trading activity (at only around 8% of its total
assets) (Chart 2.2); most importantly, its funding structure has the highest dependence on
retail deposits of all banks in our sample (see Section 5). At the same time, this bank
maintains a large securities portfolio, which consists largely of securities holdings,
especially of government bonds
At end-2010, Barclays, BNP Paribas, Deutsche Bank and UBS securities markets activities
amounted to between 55% and 70% of their total assets; at the same time, retail and
wholesale lending operations amounted to between 20% and 35% of total assets (see
Chart 3). The investment banking orientation of these banks was highlighted in 2008, when
their derivatives exposures increased very strongly due to valuation adjustments in the
context of the financial crisis. The combined derivatives and trading positions of the four
banks as a percentage of their total assets jumped bringing their total securities markets
activities to between 55% and 80% of total assets for that year.
2.1 ASSET STRUCTURES
OF SPECIALISED BANKS
2.2 ASSET STRUCTURES
OF DIVERSIFIED OR
UNIVERSAL BANKS
SOURCE: Bankscope.
a Mitsubishi UFJ reports according to the Japanese scal period. Thus, 2010 end-of-period data are re ected by the statements released on 31.03.2011.
SPECIALISED BANKS. ASSETS STRUCTURE 2006-2010 CHART 2
0
20
40
60
80
100
2006 2007 2008 2009 2010
RETAIL LOANS LOANS AND ADVANCES TO BANKS
TRADING DERIVATIVES
OTHER EARNING ASSETS (SECURITIES PORTFOLIO)
CASH AND DUE FROM BANKS
FIXED ASSETS GOODWILL
OTHER ASSETS
RETAIL LOANS LOANS AND ADVANCES TO BANKS
TRADING DERIVATIVES
OTHER EARNING ASSETS (SECURITIES PORTFOLIO)
CASH AND DUE FROM BANKS
FIXED ASSETS GOODWILL
OTHER ASSETS
2.1 GOLDMAN SACHS. Specialised investment bank
%
0
20
40
60
80
100
2006 2007 2008 2009 2010
2.2 MITSUBISHI UFJ (a). Specialised commercial bank
%

BANCO DE ESPAÑA 104 ESTABILIDAD FINANCIERA, NÚM. 22
Barclays, BNP Paribas and Deutsche Bank expanded substantially their commercial
banking activities in relative terms after 2008, as shown by the increasing shares of their
lending to retail and corporate customers. This process was fostered by important
acquisitions, such as the takeover of Fortis by BNP Paribas and that of Deutsche Postbank
by Deutsche Bank. The exception was UBS, which experienced a very significant
deleveraging after 2008, undergoing major changes in its business model. The dominant
move towards commercial banking after 2008, is reflected in significant declines in the
shares of derivatives and trading activities, with Deutsche Bank and Barclays mostly
reducing derivatives exposures in relative terms, and BNP Paribas lowering its trading
activities. The data also show that Barclays and UBS, followed by BNP Paribas, retreated
significantly from interbank lending activities in recent years, owing to the severe impact of
the financial crisis on international interbank funding markets.
The commercial banking oriented business model (Citigroup, HSBC, Banco Santander
and BBVA) can be seen in the relatively large size of their lending activities that totalled
between 45% and 65% of total assets at end-2010, and which consisted of retail, non-
financial corporate wholesale and interbank lending (see Chart4). At the same time, their
nature as universal banks was reflected in the importance of securities markets activities,
between 25% and 40% of total assets. Notwithstanding relevant investment banking
SOURCE: Bankscope.
DIVERSIFIED INVESTMENT BANKS. ASSETS STRUCTURE 2006-2010 CHART 3
0
20
40
60
80
100
2006 2007 2008 2009 2010
3.1 BARCLAYS BANK. Diversi ed investment bank
%
0
20
40
60
80
100
2006 2007 2008 2009 2010
3.2 BNP PARIBAS. Diversi ed investment bank
%
0
20
40
60
80
100
2006 2007 2008 2009 2010
3.3 DEUTSCHE BANK. Diversi ed investment bank
%
0
20
40
60
80
100
2006 2007 2008 2009 2010
3.4 UBS. Diversi ed investment bank
%
RETAIL LOANS LOANS AND ADVANCES TO BANKS
TRADING DERIVATIVES
OTHER EARNING ASSETS (SECURITIES PORTFOLIO)
CASH AND DUE FROM BANKS
FIXED ASSETS GOODWILL
OTHER ASSETS
RETAIL LOANS LOANS AND ADVANCES TO BANKS
TRADING DERIVATIVES
OTHER EARNING ASSETS (SECURITIES PORTFOLIO)
CASH AND DUE FROM BANKS
FIXED ASSETS GOODWILL
OTHER ASSETS
RETAIL LOANS LOANS AND ADVANCES TO BANKS
TRADING DERIVATIVES
OTHER EARNING ASSETS (SECURITIES PORTFOLIO)
CASH AND DUE FROM BANKS
FIXED ASSETS GOODWILL
OTHER ASSETS
RETAIL LOANS LOANS AND ADVANCES TO BANKS
TRADING DERIVATIVES
OTHER EARNING ASSETS (SECURITIES PORTFOLIO)
CASH AND DUE FROM BANKS
FIXED ASSETS GOODWILL
OTHER ASSETS
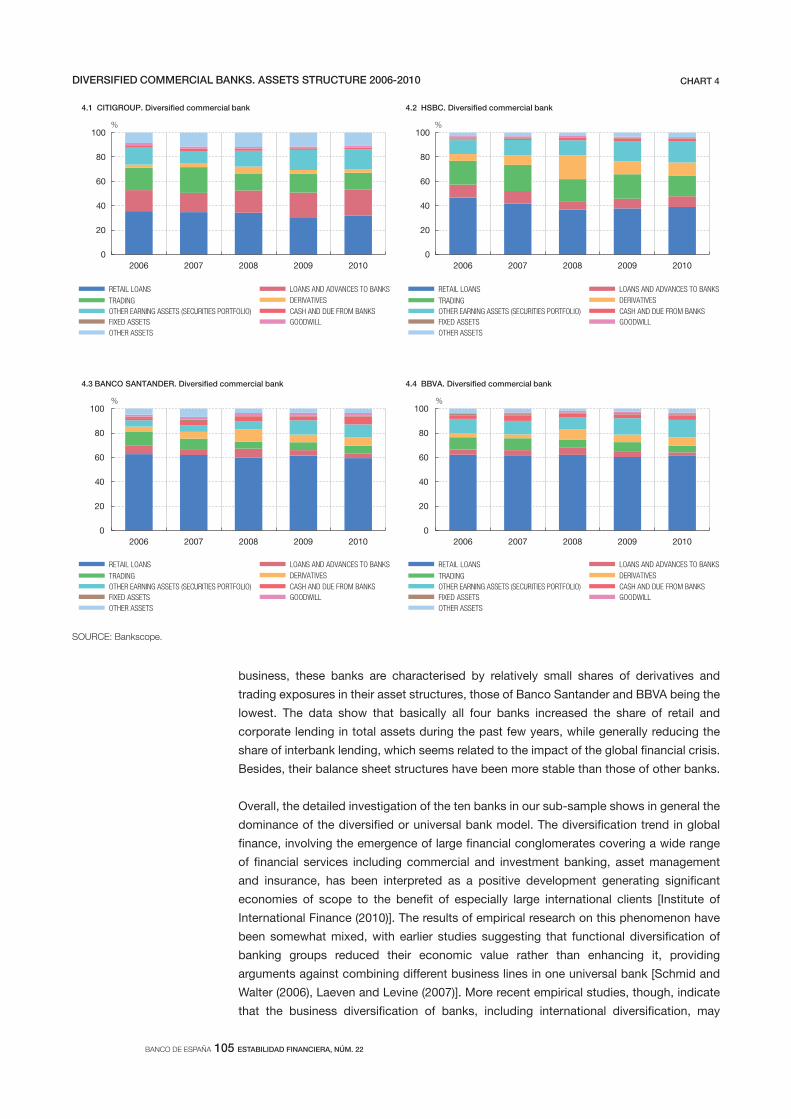
BANCO DE ESPAÑA 105 ESTABILIDAD FINANCIERA, NÚM. 22
business, these banks are characterised by relatively small shares of derivatives and
trading exposures in their asset structures, those of Banco Santander and BBVA being the
lowest. The data show that basically all four banks increased the share of retail and
corporate lending in total assets during the past few years, while generally reducing the
share of interbank lending, which seems related to the impact of the global financial crisis.
Besides, their balance sheet structures have been more stable than those of other banks.
Overall, the detailed investigation of the ten banks in our sub-sample shows in general the
dominance of the diversified or universal bank model. The diversification trend in global
finance, involving the emergence of large financial conglomerates covering a wide range
of financial services including commercial and investment banking, asset management
and insurance, has been interpreted as a positive development generating significant
economies of scope to the benefit of especially large international clients [Institute of
International Finance (2010)]. The results of empirical research on this phenomenon have
been somewhat mixed, with earlier studies suggesting that functional diversification of
banking groups reduced their economic value rather than enhancing it, providing
arguments against combining different business lines in one universal bank [Schmid and
Walter (2006), Laeven and Levine (2007)]. More recent empirical studies, though, indicate
that the business diversification of banks, including international diversification, may
SOURCE: Bankscope.
DIVERSIFIED COMMERCIAL BANKS. ASSETS STRUCTURE 2006-2010 CHART 4
0
20
40
60
80
100
2006 2007 2008 2009 2010
4.1 CITIGROUP. Diversi ed commercial bank
%
0
20
40
60
80
100
2006 2007 2008 2009 2010
4.2 HSBC. Diversi ed commercial bank
%
0
20
40
60
80
100
2006 2007 2008 2009 2010
4.3 BANCO SANTANDER. Diversi ed commercial bank
%
0
20
40
60
80
100
2006 2007 2008 2009 2010
4.4 BBVA. Diversi ed commercial bank
%
RETAIL LOANS LOANS AND ADVANCES TO BANKS
TRADING DERIVATIVES
OTHER EARNING ASSETS (SECURITIES PORTFOLIO)
CASH AND DUE FROM BANKS
FIXED ASSETS GOODWILL
OTHER ASSETS
RETAIL LOANS LOANS AND ADVANCES TO BANKS
TRADING DERIVATIVES
OTHER EARNING ASSETS (SECURITIES PORTFOLIO)
CASH AND DUE FROM BANKS
FIXED ASSETS GOODWILL
OTHER ASSETS
RETAIL LOANS LOANS AND ADVANCES TO BANKS
TRADING DERIVATIVES
OTHER EARNING ASSETS (SECURITIES PORTFOLIO)
CASH AND DUE FROM BANKS
FIXED ASSETS GOODWILL
OTHER ASSETS
RETAIL LOANS LOANS AND ADVANCES TO BANKS
TRADING DERIVATIVES
OTHER EARNING ASSETS (SECURITIES PORTFOLIO)
CASH AND DUE FROM BANKS
FIXED ASSETS GOODWILL
OTHER ASSETS

BANCO DE ESPAÑA 106 ESTABILIDAD FINANCIERA, NÚM. 22
improve their value and hence support the view that economies of scope may be
pronounced in banking [Gulamhussen et al. (2011), Elsas et al. (2010); for a more nuanced
view, see Van Lelyveld and Knot (2009)].
The trend of functional diversification adopted by most large global banking groups has
been intertwined with the significant increase in the consolidation and concentration of
banking services into fewer and much larger banking conglomerates [De Nicolo et al.
(2004), Buch and DeLong (2010), Herring and Carmassi (2010)]. The 2007-2009 financial
crisis seems to have reinforced this trend rather significantly when looking from 2006 to
2010. Table 2 shows the size of 22 of the largest international banks in the world which
were considered systemically important (SIFIs) by the Financial Times (developments in
their total assets are depicted in Annex 1). At end-2010, the amount of total assets of 19
of these banks had increased when compared with 2006, in a majority of cases at double
digit growth rates.5 Only three experienced a decline in total assets from 2006, Morgan
Stanley, UBS and Credit Suisse, all of them banking groups either specialised or
predominantly diversified into investment banking activities.
SOURCE: Bankscope and calculations from the authors.
a Rates of increase in local currency. Balances at the end of 2010 (31.12.2010) except for Japanese institutions (31.3.2011) and Canadian institutions (31.10.2010).
Total AssetsEvolution since the
end of 2006
2010 Closing data
(billion dollars)
31.12.2010 31.12.2009 31.12.2008 31.12.2007 31.12.2006
BNP Paribas SA + 2,669.9 -2.9 -3.7 17.9 38.7
Deutsche Bank AG + 2,546.3 27.0 -13.5 -1.0 21.2
HSBC Holdings Plc + 2,454.7 3.8 -2.9 4.3 31.9
Mitsubishi UFJ Financial Group, Inc. + 2,392.5 1.4 4.7 8.5 12.0
Barclays PLC + 2,323.9 8.0 -27.4 21.4 49.4
Royal Bank of Scotland Group Plc + 2,267.7 -14.3 -39.5 -23.5 66.8
Bank of America - Merrill Lynch + 2,264.9 1.9 24.6 32.0 55.2
JPMorgan Chase & Co. + 2,117.6 4.2 -2.6 35.6 56.7
Citigroup Inc. + 1,913.9 3.1 -1.3 -12.5 1.6
Mizuho Financial Group, Inc. + 1,896.7 3.0 5.6 5.0 8.1
ING Groep N.V. + 1,666.4 7.2 -6.3 -5.0 1.7
Banco Santander, S.A. + 1,626.8 9.6 16.0 33.4 46.0
Société Générale SA + 1,512.7 10.6 0.2 5.6 18.3
UBS AG – 1,406.4 -1.7 -34.6 -42.1 -43.9
UniCredit SpA + 1,242.0 0.1 -11.1 -9.0 12.9
Credit Suisse Group AG – 1,101.9 0.1 -11.8 -24.2 -17.8
Goldman Sachs Group, Inc. + 911.3 7.3 3.0 -18.6 8.7
Morgan Stanley – 807.7 4.7 22.6 -22.7 -27.9
Banco Bilbao Vizcaya Argentaria, S.A. + 738.6 3.3 2.4 10.1 34.2
Royal Bank of Canada + 712.9 10.9 0.3 21.0 35.3
Standard Chartered Plc + 516.3 18.3 18.7 55.9 91.9
Nomura Holdings, Inc. + 442.9 13.8 47.7 39.5 2.3
Rate of increase from 2010 (a) with respect to:
TOTAL ASSETS OF THE MOST INTERNATIONALLY-ACTIVE INTITUTIONS TABLE 2
5 Data for Japanese banks are as of the end of the fiscal year, i.e. end of March. Data for Royal Bank of Canada
are as of the end of October.

BANCO DE ESPAÑA 107 ESTABILIDAD FINANCIERA, NÚM. 22
The longer-term trend of increasing total assets of the world’s largest global banks from
2006 to 2010 has been buttressed by substantial consolidation processes in several
national banking systems, sometimes with public support, which have resulted in higher
degrees of concentration in national markets.6 Some of these processes involved large
government financial support or private-public sector partnerships, i.e. private solutions
with public assistance (such as the takeover of Bear Stearns by JP Morgan Chase); other
were private sector “only” solutions, for example the takeover of Washington Mutual by JP
Morgan Chase. Some cross-border resolutions of failed banks changed the structure of
the domestic banking industries substantially, such as the takeovers of Bradford & Bingley
and Alliance & Leicester by Banco Santander, of Fortis by BNP Paribas and of certain parts
of the investment banking and capital markets business of Lehman Brothers by Barclays.
At the same time, in the immediate aftermath of the financial crisis, the banks in our sample
showed a downward adjustment of their size: Of the ten largest banks, seven had smaller
balance sheets in 2010 than in 2008. For some banks, this deleveraging was very
pronounced: Royal Bank of Scotland, UBS and Barclays reduced their total assets between
2008 and 2010 by 40%, 35% and 27% respectively (Table 2). In the case of UK banks, this
restructuring occurred on the back of significant public support. The process of
deleveraging also resulted in downward adjustments of the balance sheets of Goldman
Sachs and Morgan Stanley, the two remaining US independent investment banks, which
was corrected somewhat after 2008 (Annex 1, Chart 1.B).
Notwithstanding the deleveraging of banks’ balance sheets since the peak of the turmoil,
the financial crisis doesn`t seem to have interrupted the longer-term trend of increasing size.
Only three out of the 22 banks considered had lower total assets in 2010 than in 2009
(Table 2). Clearly bank resolutions processes have had an upward impact on the size of
various globally operating banks. But there are other factors to explain the longer-term trend
of increasing size in banking. One is the significant economies of scale identified in banking,
where larger size generates efficiency benefits derived from technological advantages and
allows for better diversification of risk [Wheelock and Wilson (2009), Feng and Serletis
(2010) Hughes and Mester (2011)]. Additional factors of more strategic nature should not be
discarded. For instance, very large banks can benefit from lower funding costs arising from
an implicit government guarantees that they would not be allowed to fail7; Brewer III and
Jagtiani (2011) show that banks may be willing to pay a premium for mergers that would
increase their size to a level generally perceived as being “too big to fail”.
In addition to size, the 2007-2009 global financial crisis had a strong impact on the performance
of the largest international banking groups as well. One of the most widely used indicators for
bank performance is the return on average equity (ROE), measured by net income over
the average of total equity at the end of the year. It shows how well a bank has performed
on various profitability categories, during a particular year, and indicates how competitive
the bank can be in raising equity in financial markets [Hempel and Simonson (1999)].
ROAEs for our peer group of the largest global banks are shown in Annex 2. Most banks
experienced a sharp decline in profitability for the reporting year 2008. However, the banks
that display more stable ROEs and have kept them high over the period 2006-10 are
3 Recent trends in global
banks’ performance
6 At the same time, this process does not seem to have resulted in a strong adjustment in the overall size of the
industry.
7 At the same time, it needs to be acknowledged that larger banks may hold funding advantages over smaller
banks that may be due to a variety of factors and not necessarily only to “too big to fail” arguments [see Standard
& Poor’s (2011)].

BANCO DE ESPAÑA 108 ESTABILIDAD FINANCIERA, NÚM. 22
commercial-banking oriented universal banks without exception, most notably BBVA,
Banco Santander, Standard Chartered Bank and Royal Bank of Canada (Annex 2). Nomura,
Royal Bank of Scotland and UBS, all of them investment-banking oriented universal banks,
are on the opposite side. Moreover, the most profitable global banks in 2006, i.e. Goldman
Sachs and Morgan Stanley, displayed a rather high variability of their return on average
equity over the subsequent years.
Interestingly, the data show a marked recovery in profitability after the sharp decline in
2008, for most banks reaching levels of ROAE in 2010 not far from those prevailing in 2006,
prior to the outbreak of the financial crisis. This is indicated by rather pronounced V-shape
patterns in the evolution of return on average equity for many large internationally active
banks (Annex 2). At the same time, there are notable differences in levels of ROAE among
banks in different countries. In particular, Japanese banks display relatively low rates of
profitability as demonstrated, reflecting well-known historical patterns and business
practices such as emphasis on long-term banking relationships and relatively low income
growth [Oyama and Shiratori (2001), Loukoianova (2008)]. Among euro area banks, the
most profitable ones over 2006-2010 were the two leading Spanish banks.
The performance of internationally active and diversified banks has been the subject of
considerable empirical research [see CGFS (2010b)]. The international expansion of banks
may improve their risk profile and increase their risk-adjusted return or profitability through
geographical diversification and efficiency gains [see for example García-Herrero and
Vázquez (2007)].
Banks may fund themselves through a wide range of sources of financing, including deposits,
equity and debt. A standard classification of funding models differentiates between wholesale
and retail funding. The former includes central bank liquidity, interbank loans, with a prominent
role for international interbank short-term US dollar funding, other short-term debt, most
notably repurchase agreements (repos) and commercial paper (CP), and longer-term debt.
Sometimes, equity financing is included in wholesale funding as well. Retail funding is
essentially funding through customer deposits, such as current, savings and term deposits.
During the global financial crisis of 2007-2009, banks’ funding models experienced rather
unprecedented shocks, both in terms of access to funding and of cost. Large internationally
operating banks had built up important maturity and currency mismatches between asset
and funding structures [CGFS (2010a)]; in particular, specialised investment banks and
investment-banking oriented universal banks had increased significantly their leverage
[Kalemli-Ozcan et al. (2011)]. In the summer of 2007, tensions emanating from US subprime
mortgage markets spilled over to banks’ short-term wholesale funding markets and
liquidity conditions deteriorated rapidly, particularly for highly leveraged banks. Contagion
through interconnectedness of major global banks and their funding models led to sharp
and unprecedented increases in interbank money market interest rates; in this setting,
European banks had difficulty in obtaining US dollar liquidity [Domanski and Turner (2011)].
Moreover, US investment banks, which had become highly dependent on short-term
wholesale funding – particularly on repo and CP financing – in the years prior to the
financial crisis as a way to leverage their balance sheets, experienced severe dislocations
in their funding [Adrian and Shin (2010)]8. As a matter of fact, the collapses of both Bear
4 Recent trends in global
banks’ funding and
liquidity management
8 US investment banks’ use of repo borrowing increased by almost one trillion dollar from 2004 to 2007, of which
an increasing part consisted of overnight repos, i.e. repurchase agreements with a maturity of just one day
[Financial Crisis Inquiry Commission (2011), Adrian and Shin (2010)].

BANCO DE ESPAÑA 109 ESTABILIDAD FINANCIERA, NÚM. 22
Stearns and Lehman Brothers were highly related to their inability to access any longer
these short-term funding markets, as investor confidence in their business models had
eroded. These problems were not only circumscribed to US investment banks: the demise
of Northern Rock in the UK was also caused by funding strains in short-term wholesale
financing, on which its business model depended crucially [Shin (2009)].
The disruptions in short-term funding markets prompted central banks worldwide to inject
substantial amounts of liquidity into the system and the Federal Reserve granted US
investment banks unprecedented access to its liquidity facilities. All in all, central bank
liquidity became a major source of wholesale funding. Moreover, after the collapse of
Lehman Brothers some governments supported the funding of their globally operating
banks, to the detriment of a level playing field in global banking.
In order to analyse banks’ funding models, we use detailed breakdowns of the funding of
banks in our narrower sub-sample of ten banks. The breakdown includes retail deposits,
short-term wholesale funding (interbank and repo financing), derivatives and trading
positions, long-term debt, other debt and, for completeness sake, equity (Charts 5 to 7).
Similar to our findings for asset structures, we find significant differences between the
specific funding structures of these banks.
Goldman Sachs represents the specialised investment bank model, with essentially no
deposit funding and significant reliance on short-term wholesale funding and other debt
financing (Chart 5.1). In 2008, when the crisis hit especially the funding of investment
banks, its interbank and repo funding experienced a considerable reduction (in relative
terms), but in 2010 the shares of these financing sources had returned to pre-crisis levels.
Furthermore, in 2009 and 2010 Goldman Sachs exposures to derivatives, in relative terms,
were significantly lower than in 2008. Turning to the other specialised model, around 60%
of Mitsubishi UFJ funding in 2010 depended predominantly on customer deposits, the
largest figure in our sample, which has remained rather stable throughout 2006-2010; use
of other sources of financing, such as short-term wholesale funding instruments, was
rather stable as well, with little diversification to liability items such as trading, derivatives
and long-term debt (Chart 5.2).
4.1 FUNDING STRUCTURE
OF THE SPECIALISED
BUSINESS MODELS
SPECIALISED BANKS. FUNDING STRUCTURE 2006-2010 CHART 5
0
20
40
60
80
100
2006 2007 2008 2009 2010
RETAIL DEPOSITS (CURRENT / SAVINGS / TERM) WHOLESALE DEPOSITS & REPOs DERIVATIVES (SHORT POSITIONS) TRADING (SHORT POSITIONS) TOTAL LONG-TERM DEBT
OTHER DEBTS (INCLUDING HYBRID CAPITAL) TOTAL EQUITY (COMMON EQUITY + RESERVES + REVALUATIONS)
RETAIL DEPOSITS (CURRENT / SAVINGS / TERM) WHOLESALE DEPOSITS & REPOs DERIVATIVES (SHORT POSITIONS) TRADING (SHORT POSITIONS) TOTAL LONG-TERM DEBT
OTHER DEBTS (INCLUDING HYBRID CAPITAL) TOTAL EQUITY (COMMON EQUITY + RESERVES + REVALUATIONS)
5.1 GOLDMAN SACHS. Specialised investment bank
%
0
20
40
60
80
100
2006 2007 2008 2009 2010
5.2 MITSUBISHI UFJ (a) Specialised commercial bank
%
SOURCE: Bankscope.
a Mitsubishi UFJ reports according to the Japanese scal period. Thus, 2010 end-of-period data are re ected by the statements released on 31.3.2011.

BANCO DE ESPAÑA 110 ESTABILIDAD FINANCIERA, NÚM. 22
The funding structure of investment banking oriented universal banks displays a relatively
modest share of customer deposits, at just 20%-30% of total funding in 2010, but maintained
substantial liability positions in derivatives and trading, an important characteristic of this
business model (Chart 6). These banks experienced major shifts in their funding structure
after 2008. The most significant change was a rapid and substantial decline in derivatives
in 2009 and 2010, which had increased very strongly in 2008, mostly due to market
valuation adjustments of financial derivatives’ trading positions resulting from the financial
crisis. Regarding other important changes in these banks’ funding structures, they all
increased their use of customer deposit financing after 2008, and hence moved more
towards the commercial banking oriented business model.
By contrast, the funding of the diversified commercial banks was characterised by a
much larger share of customer deposits – of between 40% and 50% at end-2010 –
(Chart 7). After 2008 they showed an ever greater recourse to deposit financing (in
relative terms), at the expense of short-term wholesale funding. This latter development
was a trend clearly visible among commercial banking oriented universal banks,
including BBVA and HSBC, especially when comparing the figures for 2010 with those
for 2006 or 2007.
4.2 FUNDING STRUCTURE
OF THE DIVERSIFIED OR
UNIVERSAL BUSINESS
MODELS
SOURCE: Bankscope.
DIVERSIFIED INVESTMENT BANKS. FUNDING STRUCTURE 2006-2010 CHART 6
0
20
40
60
80
100
2006 2007 2008 2009 2010
RETAIL DEPOSITS (CURRENT / SAVINGS / TERM) WHOLESALE DEPOSITS & REPOs DERIVATIVES (SHORT POSITIONS) TRADING (SHORT POSITIONS) TOTAL LONG-TERM DEBT OTHER DEBTS (INCLUDING HYBRID CAPITAL) TOTAL EQUITY (COMMON EQUITY + RESERVES + REVALUATIONS)
6.1 BARCLAYS BANK. Diversi ed investment bank
%
0
20
40
60
80
100
2006 2007 2008 2009 2010
RETAIL DEPOSITS (CURRENT / SAVINGS / TERM)
WHOLESALE DEPOSITS & REPOs DERIVATIVES (SHORT POSITIONS) TRADING (SHORT POSITIONS) TOTAL LONG-TERM DEBT OTHER DEBTS (INCLUDING HYBRID CAPITAL) TOTAL EQUITY (COMMON EQUITY + RESERVES + REVALUATIONS)
6.2 BNP PARIBAS. Diversi ed investment bank
%
0
20
40
60
80
100
2006 2007 2008 2009 2010
RETAIL DEPOSITS (CURRENT / SAVINGS / TERM) WHOLESALE DEPOSITS & REPOs DERIVATIVES (SHORT POSITIONS) TRADING (SHORT POSITIONS) TOTAL LONG-TERM DEBT OTHER DEBTS (INCLUDING HYBRID CAPITAL) TOTAL EQUITY (COMMON EQUITY + RESERVES + REVALUATIONS)
6.3 DEUTSCHE BANK. Diversi ed investment bank
%
0
20
40
60
80
100
2006 2007 2008 2009 2010
RETAIL DEPOSITS (CURRENT / SAVINGS / TERM) WHOLESALE DEPOSITS & REPOs DERIVATIVES (SHORT POSITIONS) TRADING (SHORT POSITIONS) TOTAL LONG-TERM DEBT OTHER DEBTS (INCLUDING HYBRID CAPITAL) TOTAL EQUITY (COMMON EQUITY + RESERVES + REVALUATIONS)
6.4 UBS. Diversi ed investment bank
%

BANCO DE ESPAÑA 111 ESTABILIDAD FINANCIERA, NÚM. 22
The trend towards greater recourse to customer deposit funding by both investment and
commercially oriented universal banks is clearly visible in the evolution of loans to deposits
ratios, shown in Annex 3. If this ratio is higher than one, a bank needs other funding
sources to finance its loans. For a majority of banks, the loan to deposit ratio declined
rather significantly during 2006-2010, and especially after 2008.
Overall, in the aftermath of the 2007-2009 global financial crisis large international banks’
funding models have shifted towards more stable funding sources, with increasing
reliance on customer deposits. At the same time, many banks – especially commercial
banking oriented universal banks – reduced their recourse to short-term wholesale
funding markets.9 The crisis revealed important shortcomings in funding models mainly
concentrated on short-term wholesale debt instruments.
The crisis also revealed the importance of intra group capital transfers which turned out
to be an effective tool to support foreign affiliates in distress during the turmoil [Navaretti
9 The rating agencies generally view retail deposit funding as the most reliable and stable source of bank funding
[see for example Fitch (2011)]. Deposit funding may be more beneficial also due to the existence of deposit
insurance schemes, which mitigate the likelihood of bank runs and lower the attractiveness of market-based
funding modes, regardless the quality of borrowers [Greenbaum and Thakor (1987)].
SOURCE: Bankscope.
DIVERSIFIED COMMERCIAL BANKS. FUNDING STRUCTURE 2006-2010 CHART 7
0
20
40
60
80
100
2006 2007 2008 2009 2010
RETAIL DEPOSITS (CURRENT / SAVINGS / TERM) WHOLESALE DEPOSITS & REPOs DERIVATIVES (SHORT POSITIONS) TRADING (SHORT POSITIONS) TOTAL LONG-TERM DEBT OTHER DEBTS (INCLUDING HYBRID CAPITAL) TOTAL EQUITY (COMMON EQUITY + RESERVES + REVALUATIONS)
RETAIL DEPOSITS (CURRENT / SAVINGS / TERM) WHOLESALE DEPOSITS & REPOs DERIVATIVES (SHORT POSITIONS) TRADING (SHORT POSITIONS) TOTAL LONG-TERM DEBT OTHER DEBTS (INCLUDING HYBRID CAPITAL) TOTAL EQUITY (COMMON EQUITY + RESERVES + REVALUATIONS)
7.1 CITIGROUP. Diversi ed commercial bank
%
0
20
40
60
80
100
2006 2007 2008 2009 2010
7.2 HSBC. Diversi ed commercial bank
%
0
20
40
60
80
100
2006 2007 2008 2009 2010
RETAIL DEPOSITS (CURRENT / SAVINGS / TERM) WHOLESALE DEPOSITS & REPOs DERIVATIVES (SHORT POSITIONS) TRADING (SHORT POSITIONS) TOTAL LONG-TERM DEBT OTHER DEBTS (INCLUDING HYBRID CAPITAL) TOTAL EQUITY (COMMON EQUITY + RESERVES + REVALUATIONS)
RETAIL DEPOSITS (CURRENT / SAVINGS / TERM) WHOLESALE DEPOSITS & REPOs DERIVATIVES (SHORT POSITIONS) TRADING (SHORT POSITIONS) TOTAL LONG-TERM DEBT OTHER DEBTS (INCLUDING HYBRID CAPITAL) TOTAL EQUITY (COMMON EQUITY + RESERVES + REVALUATIONS)
7.3 BANCO SANTANDER. Diversi ed commercial bank
%
0
20
40
60
80
100
2006 2007 2008 2009 2010
7.4 BBVA. Diversi ed commercial bank
%

BANCO DE ESPAÑA 112 ESTABILIDAD FINANCIERA, NÚM. 22
et al. (2010), Cetorelli and Goldberg (2011b)]. Large international operating banks seem
to have considerable flexibility in moving around sizeable amounts of funding inside their
global organisation, which contributes to their financial resilience and versatility [De
Haas and Van Lelyveld (2010)]. Of course, this aspect is closely related to their funding
and liquidity management practices. In the case of centralised banks, the funding of
foreign subsidiaries relies on intra group loans from the parent bank which is the
institution raising funds in financial markets. By contrast, the non-centralised liquidity
management model is characterised by a high degree of financial autonomy, in which
every subsidiary raises financing in financial markets under its own name and according
to its own credit rating. The centralised model has certain advantages for banks in terms
of economies of scale and cost efficiencies, but it also entails risks in terms of lighter
monitoring by markets of banks’ global funding operations, while being more prone to
mispricing of risk as well. It is worth mentioning that, on the contrary, in the decentralized
model funding is carried out by the final user of these funds, i.e. the subsidiary in need
of funds which is the institution that taps markets under its own name and its own risk
profile. As a consequence in the decentralized model it is easier for markets to accurately
assign and price the risk involved in the funding than in the centralized one as in the
latter case it is the matrix the institution that gets financing. In the wake of the 2007-2009
financial crisis, international banks have gradually increased funding through local
sources of financing in the foreign markets where they operate [CGFS (2010b)]. At the
same time, evidence suggests that global banks have increased centralisation of liquidity
management, through tighter monitoring of liquidity buffers and short-term liabilities at
their headquarters.
The analysis presented in this article showed that overall the commercial banking
oriented business models proved more resilient during the global 2007-2009 financial
crisis when compared with the investment banking oriented models, due to their relatively
modest exposures to trading and derivatives activities, their greater reliance on stable
sources of funding through customer deposits and larger diversity of business lines
which allows to compensate losses in some business segments with revenues from
alternative sources [see also: Boston Consulting Group (2009), ECB (2010), Standard
and Poor’s (2011)]. When comparing the balance sheet structures of both specialised
commercial banks and commercial banking oriented universal banks in 2006 and 2010,
they show relatively similar composition. In contrast, the balance sheets of banks which
adopted investment banking related business models, especially investment banking
oriented universal banks, experienced rather significant changes in balance sheet
structures during this period. More specifically, in 2008, at the height of the financial
crisis, these banks showed strong increases in derivatives exposures on their liabilities
side, which were significantly reduced in 2009 and 2010. In general, the weight of
securities markets activities on the assets side and of trading exposures on the liabilities
side fell and, at the same time, retail and wholesale lending activities, especially the use
of customer deposit financing, increased. All in all, most investment banking oriented
universal banks in our sample moved towards the business model of the commercial
banking oriented universal bank after 2008.
The crisis and the related increase in the number of bank resolutions worked as important
catalysts behind the longer-term trend of increasing the size of global banks. More
structurally, economic strategies such as achieving significant economies of scope and
scale may have been important drivers as well, both for the diversification of business
activities, as evidenced by the dominant business model in our sample of the diversified
or universal bank, and for increasing size of large global banks. At the same time, “too big
5 Conclusions,
challenges and
perspectives

BANCO DE ESPAÑA 113 ESTABILIDAD FINANCIERA, NÚM. 22
to fail” advantages such as lower funding costs for banks that are perceived systemically
important cannot be excluded as an important reason behind the trend of larger international
banking groups.10
Regarding challenges and perspectives for the future, it is clear that the regulatory
environment is the key challenge for banks’ business models in the years ahead of us.
The evidence shown through the previous sections strongly suggests that regulation
aimed at reducing the likelihood and the impact of failure of any large internationally
active financial institution should take into account the business model it conducts. In this
regard, it might be opportune to look at several recent important regulatory initiatives
such as those that address the systemic and moral hazard risks associated with large
financial institutions and those aimed at isolating or ring fencing retail banking vis-à-vis
investment banking.
The Basel Committee on Banking Supervision (BCBS) and the Financial Stability Board (FSB)
have developed a framework to deal with the “too-big-to-fail” issue based on the two
objectives.11 First, the objective is to reduce the probability of failure by improving the loss
10 Demirgüç-Kunt and Huizinga (2011) show that systemically large banks display lower profitability and higher
risk, suggesting that it is neither in the interest of their shareholders nor regulators for them to become too large
relative to the size of their national economies. On the basis of these findings the authors suggest that regulatory
intervention may be warranted were such an outcome to materialise, such as additional capital charges or in
the extreme case downsizing or splitting up of business activities. However, size restrictions may have
unwelcome effects as well as demonstrated in Dermine and Schoenmaker (2010), such as a lack of credit risk
diversification in case size reduction would imply less internationally diversified banks.
11 See Basel Committee on Banking Supervision, “Global systemically important banks: assessment methodology
and the additional loss absorbency requirement”, November 2011.
SOURCE: BIS and Bankscope.NOTE: Exchange rate adjusted.
SIFIs TOTAL ASSETS ACCORDING TO BUSINESS MODELS CHART 8
0
5,000,000
10,000,000
15,000,000
20,000,000
25,000,000
1 Retail Specialised 2 Retail 3 Investment 4 Investment Specialised
1 + 2 Categories(Retail)
3 + 4 Categories (Investment)
TOTAL ASSETS
Millions (€)
0
15
30
45
60
75%
1 Retail Specialised 2 Retail 3 Investment 4 Investment Specialised
1 + 2 Categories(Retail)
3 + 4 Categories (Investment)
Nº INSTITUTIONS (%) (RHS) TOTAL ASSETS (%) (RHS)

BANCO DE ESPAÑA 114 ESTABILIDAD FINANCIERA, NÚM. 22
absorbency of the financial institutions subjected to the regulations. Second, an additional
goal is to reduce the impact of failure by improving global recovery and resolution frameworks.
To attain the first goal, the proposals entail new requirements for the banks that have been
identified as systemically important at the global level. In particular, an additional loss
absorption capacity is tailored to the impact of their default within a range from 1% to
2.5% of risk-weighted assets that should be met with common equity. In addition, the FSB
and BCBS propose changes in national resolution regimes, additional requirements for
resolvability assessment and for recovery and resolution planning and, last but not least,
for more effective supervision. All these measures have been approved by the G20. Thus,
institutions identified as Global Systemically Important Financial Institutions (G-SIFIs) will
have to adapt to this regulation from 2012 onwards and its full implementation is targeted
for 2019. Chart 9 represents our initial assessment of how the G-SIFIs identified by the
BCBS fit in the categorization of business models described in this article. Chart 8 shows
the size of balance sheets of institutions by category at end-2010.
The assessment methodology developed to identify the systemic importance of G-SIFIs
follows a multiple indicator-based measurement approach that encompasses many
dimensions of systemic importance and includes parameters such as cross-jurisdictional
activity, size, interconnectedness, substitutability/financial institution infrastructure and
complexity. On top of it, some qualitative information incorporated in the supervisory
judgement completes the assessment.
Indeed the business model of institutions influences some of the categories aforementioned,
especially those of interconnectedness and complexity. However, as shown in the chart,
the list of institutions identified as G-SIFIs contains, according to our assessment, banks
in all categories without a clear bias to any. In fact, at first glance it seems that the number
of specialized investment banks is relatively low, though admittedly it might be explained
by the failure of very noticeable ones in the crisis. As the data show, the relatively low
prominence of investment banks is further exemplified by the (much) larger size of total
assets of the more retail oriented banks.
SOURCE: Own elaboration with Bankscope data.
a Retail Ratio = (Net Customer Loans + Customer Deposits) / Total Assets.
SIFIs DISTRIBUTION ACCORDING TO BUSINESS MODELS CHART 9
Bank of China
ING Bank
Sumitomo Mitsui FG
Wells Fargo
Santander Mitsubishi UFJ FG
Unicredit Group Lloyds Banking Group
Mizuho FG Banque Populaire CdE
HSBC Bank of America Nordea Dexia Commerzbank Citigroup
JP Morgan Chase Bank of New York Mellon Royal Bank of Scotland State Street
Société Générale BNP Paribas
Group Crédit Agricole Barclays Deutsche Bank Credit Suisse
UBS
Morgan Stanley
Goldman Sachs 0
20
40
60
80
100
120
140
0 1 2 3 4
%
Business Model
Reta
il R
atio
(a)

BANCO DE ESPAÑA 115 ESTABILIDAD FINANCIERA, NÚM. 22
Following the well-documented high resilience and stability of the retail banking model,
which also find support in this article, some could argue that the G-SIFIs identification
criteria do not take into account sufficiently the benefits of this model. However, in this
regard, advocates of the BCBS approach may counter that the concept of “systemically
important” is much richer than just focusing on different business models. In fact, the
additional requirements imposed on any G-SIFI depend on its scoring insofar institutions
are allocated into one out of five possible buckets (eg. riskier banks should be allocated
to higher ranked buckets and thus be asked to fulfill stricter additional capital
requirements). In any case, what it is clear is that regulation should and in fact has taken
into account (sufficiently or not) idiosyncrasies associated with the different business
models of banks.
In the regulatory arena, two national initiatives that may impinge on the business model of
banks are also worthwhile to be commented. The first one relates to the recommendations
of the Independent Commission on Banking for UK banking (ICB report), especially those
ones directed at institutions that combine retail services with global wholesale and
investment banking operations. The second one has to do with certain regulations proposed
in the US to implement the Volcker rule and in particular to its unintended consequences
and extraterritorial effects.
The ICB report proposes ring-fencing retail banking activities that would make it easier
and less costly to effectuate the resolution of any banking institution, would allow for
targeted policies towards banks in difficulties and would minimize the need for public
support. Besides, according to the report, structural separation of activities should help
insulate retail banking from external shocks. Interestingly, the report is very favorable to
business models that provide a great degree of financial autonomy to subsidiaries versus
centralized models. It is important to note that the ICB report does not ask for complete
separation of activities and institutions could maintain the advantages derived from
economies of scale. Moreover, according to the ICB, the recommendations proposed are
neutral with regard to the various business models of UK banks.
Having said all that, the report advocates additional loss absorbency requirements for
large UK retail banks (equity capital of at least 10% of risk weighted assets, which exceeds
the Basel III level for G-SIFIs) and acknowledges that the proposed reforms affect only a
relatively small proportion of wholesale and investment banking activity in the City. The
argument for the latter is to avoid any adverse effect on the competitiveness of UK banks
versus foreign banks. The ICB view on the need for additional burdens imposed on large
retail oriented banking groups is defended as a compensation for the possible “too big to
fail” implicit subsidy these institutions benefit from. This reasoning might implicitly endorse
the belief that these large and key retail banks will be rescued by the public sector in case
it would be needed, whereas small retail banks and wholesale and investment oriented-
banks would be allowed to fail. The merits of the proposals in the ICB report are indeed
considerable. However, challenges remain with regard to their implementation and it might
be argued whether the “no bail out” assumption for large investment banks versus large
retail ones will be followed in case of a financial crisis with systemic effects.
The US approach to isolate retail banking from other activities that is embedded in the
Volcker rule is quite different, though in essence its objectives are close to those of the ICB
proposals. In a nutshell the Volcker rule prohibits any link between retail business (which
benefits from FDIC deposit insurance) and other activities, particularly proprietary trading,
prime brokerage business for hedge funds or risk capital activities, except for exceptions

BANCO DE ESPAÑA 116 ESTABILIDAD FINANCIERA, NÚM. 22
to be detailed. As a consequence, it either interdicts any relation or it imposes the compliance
with severe information requirements to qualify for the exception. The proposed US
regulation clearly differentiates among business models and it interferes with the relations
between retail and investment business. This is an issue particularly relevant for large
institutions and among other things it regulates the links between the subsidiaries of non-
US banks active in the US with their parent banks. This issue may have severe potential
consequences for the activities carried out by those foreign institutions and in fact is under
review by US authorities. Some private institutions (among those the Institute for
International Finance, IIF) have called for a sufficient degree of coordination regarding
those regulatory initiatives with extraterritorial consequences.
In addition, regulatory developments may induce the movement of specific business
lines out of banks – both commercial and investment banks – and into the non-bank
financial sector, such as hedge funds, private equity and asset managers. This may
provide further impetus to the development of the so-called Shadow Banking System.
Moreover, regulatory changes may lead to a further consolidation of large globally active
banks, as scale and scope economies, infrastructure and distribution channels will
become more important to maintain competitive positions [Morgan Stanley and Oliver
Wyman (2011)]. This could buttress the longer-term trend towards bigger size of large
international banking groups and higher industry concentration that we observe in our
analysis. With respect to perspectives for funding structures, the prevailing view is that
the greater recourse to deposit financing observed in the aftermath of the financial crisis
in 2008 may continue for the foreseeable future, implying greater competition for deposits
between banks (ECB, 2009 and 2010). This trend may entail new challenges as well, as
enhanced competition in deposit markets may lead, according to certain academic
research, to an increase in risk, if banks compete for market power offering higher deposit
rates [Craig et al. (2010)].
All in all, and despite the recent financial crises, international banking has not lost its
dynamism and continues to provide important amounts of financing, especially to the
fastest growing economies in the world. These international activities of globally active
banks are of considerable strategic importance in their well-diversified business portfolios
and form a traditional source of revenues on their balance sheet. Indeed, the diversity of
business models for banks active internationally is welcome. However, as shown in the
article, the so-called universal commercial banking oriented business model has shown a
particularly high degree of stability and resilience to the international financial crisis, an
issue that may have to be taken into account in pending regulation.
ACHARYA, V., and M. RICHARDSON (2009). “Causes of the financial crisis”, Critical Review, 21(2-3), pp.195-210.
ADRIAN, T., and H. SONG SHIN (2010). “The changing nature of financial intermediation and the financial crisis of
2007–2009,” Annual Review of Economics (2), pp. 603-618.
BANK FOR INTERNATIONAL SETTLEMENTS (2011). “International banking and financial market developments”,
BIS Quarterly Review, June 2011.
BELTRATTI, A., and R. STULZ (2009). Why did some banks perform better during the credit crisis? A cross-country
study of the impact of governance and regulation, ECGI Finance Working Paper n.º 254/2009.
BOLOGNA, P. (2011). Is there a role for funding in explaining recent US banks’ failures?, IMF Working Paper
n.º WP/11/180.
BOSTONG CONSULTING GROUP (2009). The Next-Generation Investment Bank.
BREWER, E., and J. JAGTIANI (2011). How much did banks pay to become too-big-to-fail and to become
systematically important, Federal Reserve Bank of Philadelphia, Working Papers n.º 11-37.
BUCH, C., and G. DELONG (2010). “Chapter 20: Banking globalization: International consolidation and mergers in
banking”, in A. Berger, P. Molyneux and J. Wilson (eds.), The Oxford Handbook of Banking, pp. 508-530.
CETORELLI, N., and L. GOLDBERG (2011a). “Global Banks and International Shock Transmission: Evidence from
the Crisis,” IMF Economic Review, Vol. 59, pp. 41-76.
REFERENCES

BANCO DE ESPAÑA 117 ESTABILIDAD FINANCIERA, NÚM. 22
— (2011b). Liquidity management of US global bank: Internal capital markets in the Great Recession, NBER Working
Paper n.º 17355.
COMMITTEE ON THE GLOBAL FINANCIAL SYSTEM (2010a). The functioning and resilience of cross-border funding
markets, CGFS Papers n.º 37.
— (2010b). Funding patterns and liquidity management of internationally active banks, BIS, CGFS Papers n.º 39, May.
— (2010c). Long-term issues in international banking, BIS, CGFS Papers n.º 41, July.
CORNETT, M., J. MCNUTT, P. STRAHAN and H. TEHRANIAN (2011). “Liquidity risk management and credit supply
in the financial crisis”, Journal of Financial Economics, 101, pp. 297-212.
CRAIG, B., and V. DINGER (2010). Deposit market competition, wholesale funding and bank risk, European Banking
Center Discussion Paper n.º 2010-17S, July.
DAMAR, H., C. MEH, and Y. TERAJIMA (2010). Leverage, balance sheet size and wholesale funding, Bank of Canada
Working Paper 2010-39.
DEMIRGÜÇ-KUNT, A., and H. HUIZINGA (2009). Bank activity and funding strategies: the impact on risk and return,
Centre for Economic Policy Research, Discussion Paper n.º 7170, February.
— (2011). Do we need big banks? Evidence on performance, strategy and market discipline, World Bank Policy
Research Working Paper n.º 5576.
DERMINE, J., and D. SCHOENMAKER (2010). “In banking, is small beautiful?”, Financial Markets, Institutions &
Instruments, 19(1), pp. 1-19.
DOMANSKI, D., and P. TURNER (2011). The great liquidity freeze: What does it mean for international banking?,
ADBI Working Paper Series n.º 291, June.
ELSAS, R., A. HACKETHAL and M. HOLZHÄUSER (2010). “The anatomy of bank diversification”, Journal of Banking
& Finance, 34, pp.1274-1287.
EUROPEAN CENTRAL BANK (2009). EU banks’ funding structures and policies, May.
— (2010), EU Banking Structures, September.
FENG, G., and A. SERLETIS (2010). “Efficiency, technical change and returns to scale in large US banks: Panel data
evidence from an output distance function satisfying theoretical regularity”, Journal of Banking and Finance, 34,
pp. 127-138.
FINANCIAL CRISIS INQUIRY COMMISSION (2011). The Financial Crisis Inquiry Report, January.
FINANCIAL TIMES (2009). Thirty financial groups on systemic risk list, 29 November.
FITCH RATINGS (2011). Trends in bank funding profiles – Secured financing on the rise, but likely to tail off, Banks -
Global Special Report, June.
GARCÍA-HERRERO, A., and F. VÁZQUEZ (2007). International diversification gains and home bias in banking, IMF
Working Paper n.º WP/07/281.
GOLDBERG, L. (2009). Understanding banking sector globalization, IMF Staff Papers, 56(1), pp. 171-197.
GONZÁLEZ-MOTA, E., and J. MARQUÉS (2010). “Dodd-Frank Wall Street Reform: Un cambio profundo en el sistema
financiero de Estados Unidos”, Banco de España, Estabilidad Financiera, n.º 19, 11/2010, pp. 72-85.
GREENBAUM, S., and A. THAKOR (1987). “Bank funding modes”, Journal of Banking & Finance, 11, pp. 379-401.
GULAMHUSSEN, M., C. PINHEIRO and A. POZZOLO (2011). Do multinational banks create or destroy economic
value?, mimeograph.
HAAS, R. DE, and I. VAN LELYVELD (2010). “Internal capital markets and lending by multinational bank subsidiaries”,
Journal of Financial Intermediation, 19, pp. 1-25.
HEMPEL, G., and D. SIMONSON (1999). Bank management, New York. John Wiley & Sons, Inc.
HERRING, R., and J. CARMASSI (2010). “Chapter 8: The corporate structure of international financial conglomerates:
Complexity and its implications for safety and soundness”, in A. Berger, P. Molyneux and J. Wilson (eds.), The
Oxford Handbook of Banking, pp. 195-229.
HUANG, R., and L. RATNOVSKI (2011). “The dark side of bank wholesale funding”, Journal of Financial Intermediation,
20(2), pp. 248-263.
HUGHES, J., and L. MESTER (2011). Who said large banks don’t experience scale economies? Evidence from a
risk-return-driven cost function, Federal Reserve Bank of Philadelphia, Working Papers n.º 11-27.
INSTITUTE OF INTERNATIONAL FINANCE (IIF) (2010). Systemic risk and systemically important firms: An integrated
approach.
IVASHINA, V., and D. SCHARFSTEIN (2010). “Bank lending during the financial crisis of 2008”, Journal of Financial
Economics, 97, pp. 319-338.
KALEMLI-OZCAN, S., B. SØRENSEN and S. YESILTAS (2011). Leverage across firms, banks and countries, CEPR
Discussion Paper Series n.º 8549.
KOMAI, A., and G. RICHARDSON (2011). A brief history of regulations regarding financial markets in the United
States: 1789 to 2009, NBER Working Paper Series n.º 17443, September.
LAEVEN, L., and R. LEVINE (2007). “Is there a diversification discount in financial conglomerates?”, Journal of
Financial Economics, 85, pp. 331-367.
LANE, P., and G. MILESI-FERRETTI (2008). “The drivers of financial globalization”, American Economic Review:
Papers and Proceedings, 98(2), pp. 327-332.
LELYVELD, I. VAN, and K. KNOT (2009). “Do financial conglomerates create or destroy value? Evidence for the EU”,
Journal of Banking & Finance, 33, pp. 2312-2321.
LOUKOIANOVA, E. (2008). Analysis of the efficiency and profitability of the Japanese banking system, IMF Working
Paper n.º WP/08/63.
NAVARETTI, G., G. CALZOLARI, A. POZZOLO and M. LEVI (2010). Multinational banking in Europe: Financial stability
and regulatory implications. Lessons from the financial crisis, MoFiR Working Paper n.º 40, April.
NICOLO, G., P. BARTHOLOMEW, J. ZAMAN and M. ZEPHIRIN (2004). “Bank consolidation, internationalization and
conglomeration: Trends and implications for financial risk”, Financial Markets, Institutions & Instruments, 13(4),
pp. 173-217.

BANCO DE ESPAÑA 118 ESTABILIDAD FINANCIERA, NÚM. 22
MORGAN STANLEY and O. WYMAN (2011). Wholesale & Investment Banking Outlook: Reshaping the Model, 23 March.
OYAMA, T., and T. SHIRATORI (2001). Insights into the low profitability of Japanese banks: Some lessons from the
analysis of trends in banks’ margins, Bank of Japan Discussion Paper Series n.º 01-E-1.
RATNOVSKI, L., and R. HUANG (2009). Why are Canadian banks more resilient?, IMF Working Paper n.º WP/09/152.
RIXTEL, A. VAN, and S. CRIADO (2010). “The contribution of structured finance to the financial crisis: An introductory
overview”, in R. W. Kolb (ed.), Lessons from the financial crisis: Causes, consequences, and our economic future,
John Wiley & Sons.
RIXTEL, A. VAN, and L. ROMO (2011). “Non-enhanced debt financing by euro area banks under severe financial
stress”, Banco de España, Estabilidad Financiera, n.º 20, 05/2011, pp. 94-117.
SCHMID, M., and I. WALTER (2006). Do financial conglomerates create or destroy economic value?, mimeograph.
SHIN, H. (2009). “Reflections on Northern Rock: The bank run that heralded the global financial crisis”, Journal of
Economic Perspectives, 23(1), pp. 101-119.
STANDARD & POOR´S (2011). For universal banks, the recent dominance of investing banking Is giving way to more
balanced earnings, Global credit portal, June 30.
STOLZ, M., and M. WEDOW (2010). Extraordinary measures in extraordinary times: Public measures in support of
the financial sector in the EU and the United States, ECB Occasional Paper n.º 117, July.
WALL STREET JOURNAL (2008). Goldman, Morgan scrap Wall Street model, become banks in bid to ride out crisis,
22 September.
WELLINK, N. (2011). Remarks at the Goldman Sachs European Bank Financing Conference, 29 September.
WHEELOCK, D., and P. WILSON (2009). Are US bank too large?, Federal Reserve Bank of St. Louis Working Paper
n.º 2009-054B.
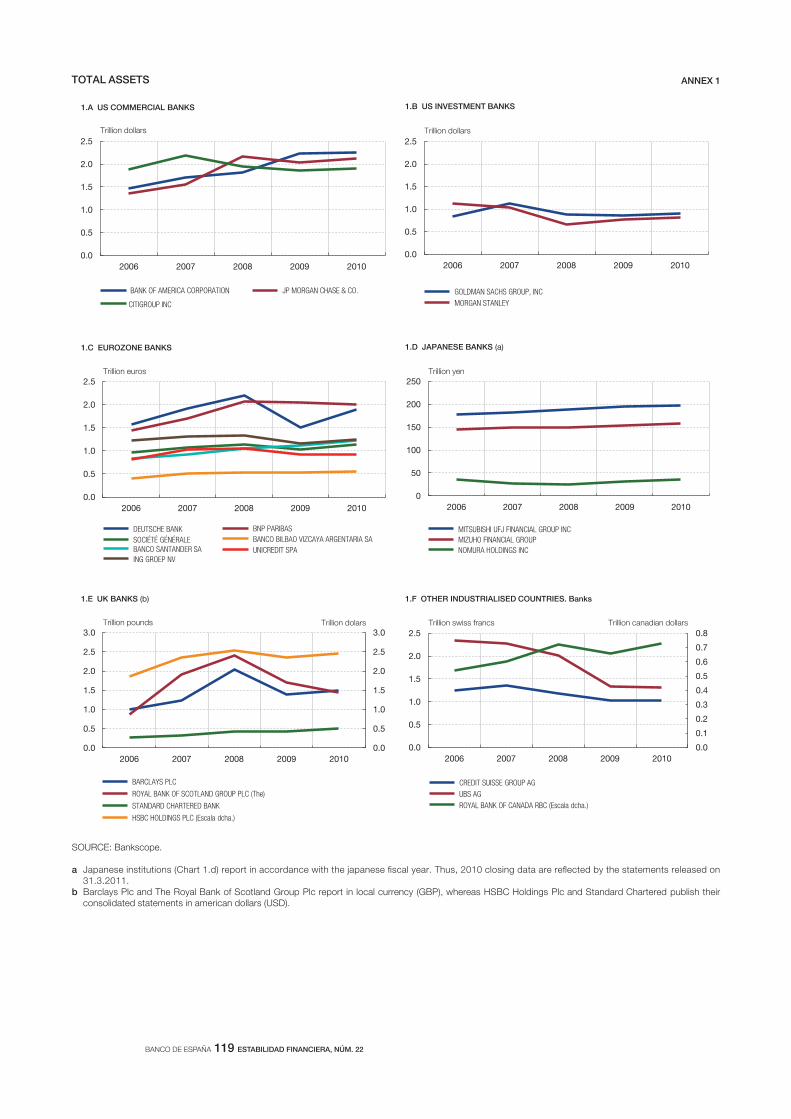
BANCO DE ESPAÑA 119 ESTABILIDAD FINANCIERA, NÚM. 22
TOTAL ASSETS ANNEX 1
0.0
0.5
1.0
1.5
2.0
2.5
2006 2007 2008 2009 2010
BANK OF AMERICA CORPORATION JP MORGAN CHASE & CO.
CITIGROUP INC
1.A US COMMERCIAL BANKS
Trillion dollars
0.0
0.5
1.0
1.5
2.0
2.5
2006 2007 2008 2009 2010
DEUTSCHE BANK BNP PARIBAS SOCIÉTÉ GÉNÉRALE
BANCO BILBAO VIZCAYA ARGENTARIA SA
BANCO SANTANDER SA UNICREDIT SPA
1.C EUROZONE BANKS
Trillion euros
0
50
100
150
200
250
2006 2007 2008 2009 2010
MITSUBISHI UFJ FINANCIAL GROUP INC
MIZUHO FINANCIAL GROUP
NOMURA HOLDINGS INC
1.D JAPANESE BANKS (a)
Trillion yen
0.0
0.5
1.0
1.5
2.0
2.5
2006 2007 2008 2009 2010
GOLDMAN SACHS GROUP, INC
MORGAN STANLEY
1.B US INVESTMENT BANKS
Trillion dollars
0.0
0.5
1.0
1.5
2.0
2.5
3.0
0.0
0.5
1.0
1.5
2.0
2.5
3.0
2006 2007 2008 2009 2010
BARCLAYS PLC
ROYAL BANK OF SCOTLAND GROUP PLC (The)
STANDARD CHARTERED BANK
HSBC HOLDINGS PLC (Escala dcha.)
1.E UK BANKS (b)
Trillion pounds Trillion dolars
0.0
0.1
0.2
0.3
0.4
0.5
0.6
0.7
0.8
0.0
0.5
1.0
1.5
2.0
2.5
2006 2007 2008 2009 2010
CREDIT SUISSE GROUP AG
UBS AG
ROYAL BANK OF CANADA RBC (Escala dcha.)
1.F OTHER INDUSTRIALISED COUNTRIES. Banks
Trillion swiss francs Trillion canadian dollars
ING GROEP NV
SOURCE: Bankscope.
a
b Barclays Plc and The Royal Bank of Scotland Group Plc report in local currency (GBP) whereas HSBC Holdin s Plc and Standard Chartered pu lish their

BANCO DE ESPAÑA 120 ESTABILIDAD FINANCIERA, NÚM. 22
SOURCE: Bankscope.
a Japanese institutions (Chart 2.d) report in accordance with the japanese scal year. Thus, 2010 end-of-period data are re ected by the statements released on 31.3.2011.
RETURN ON AVERAGE EQUITY (ROAE) ANNEX 2
-50
-40
-30
-20
-10
0
10
20
30
2006 2007 2008 2009 2010
BANK OF AMERICA CORPORATION
% %
%
% %
%
JP MORGAN CHASE & CO.
CITIGROUP INC
2.A US COMMERCIAL BANKS
-50
-40
-30
-20
-10
0
10
20
30
2006 2007 2008 2009 2010
DEUTSCHE BANK BNP PARIBAS
SOCIÉTÉ GÉNÉRALE BANCO BILBAO VIZCAYA ARGENTARIA SA
BANCO SANTANDER SA UNICREDIT SPA
ING GROEP NV
2.C EUROZONE BANKS
-50
-40
-30
-20
-10
0
10
20
30
2006 2007 2008 2009 2010
MITSUBISHI UFJ FINANCIAL GROUP INC
MIZUHO FINANCIAL GROUP
NOMURA HOLDINGS INC
2.D JAPANESE BANKS (a)
-50
-40
-30
-20
-10
0
10
20
30
2006 2007 2008 2009 2010
GOLDMAN SACHS GROUP, INC
MORGAN STANLEY
2.B US INVESTMENT BANKS
-50
-40
-30
-20
-10
0
10
20
30
2006 2007 2008 2009 2010
BARCLAYS PLC
ROYAL BANK OF SCOTLAND GROUP PLC (The)
STANDARD CHARTERED BANK
HSBC HOLDINGS PLC (Right-hand scale)
2.E UK BANKS
-50
-40
-30
-20
-10
0
10
20
30
2006 2007 2008 2009 2010
CREDIT SUISSE GROUP AG UBS AG ROYAL BANK OF CANADA RBC (Right-hand scale)
2.F OTHER INDUSTRIALISED COUNTRIES. Banks
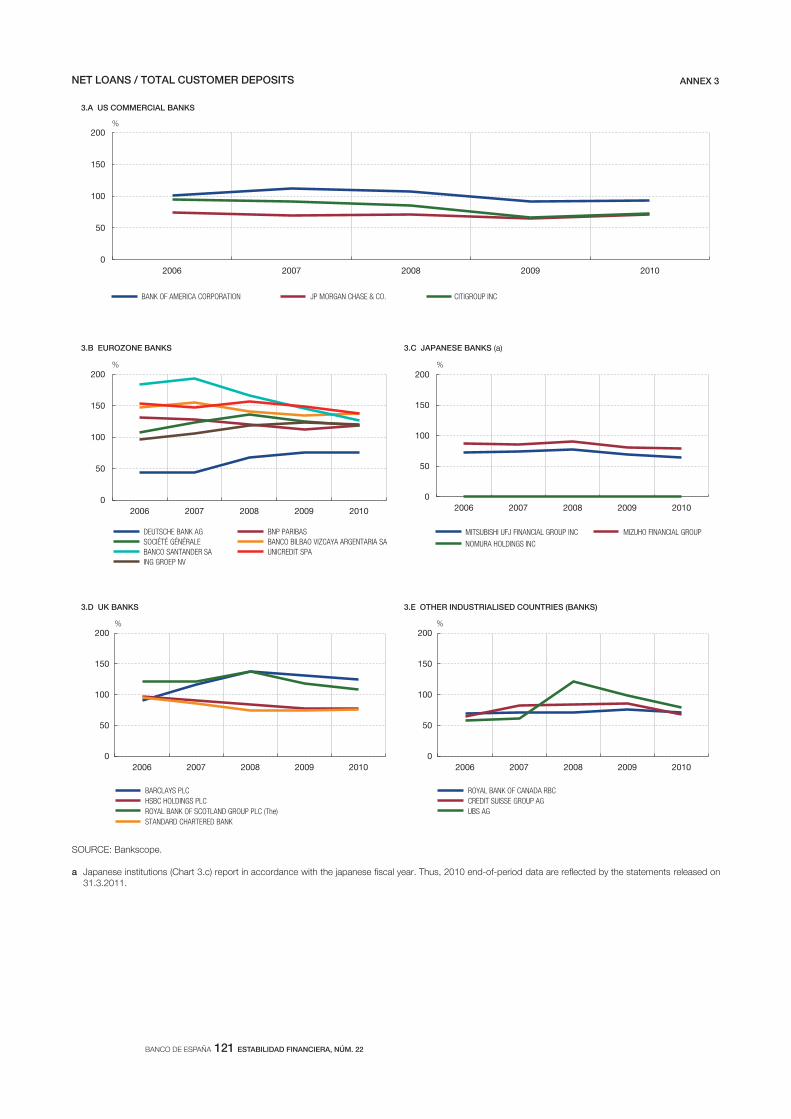
BANCO DE ESPAÑA 121 ESTABILIDAD FINANCIERA, NÚM. 22
SOURCE: Bankscope.
a Japanese institutions (Chart 3.c) report in accordance with the japanese scal year. Thus, 2010 end-of-period data are re ected by the statements released on 31.3.2011.
NET LOANS / TOTAL CUSTOMER DEPOSITS ANNEX 3
0
50
100
150
200
2006 2007 2008 2009 2010
BANK OF AMERICA CORPORATION JP MORGAN CHASE & CO. CITIGROUP INC
3.A US COMMERCIAL BANKS
0
50
100
150
200
2006 2007 2008 2009 2010
DEUTSCHE BANK AG BNP PARIBAS
SOCIÉTÉ GÉNÉRALE BANCO BILBAO VIZCAYA ARGENTARIA SA
BANCO SANTANDER SA UNICREDIT SPA
ING GROEP NV
3.B EUROZONE BANKS
0
%%
%%
%
50
100
150
200
2006 2007 2008 2009 2010
MITSUBISHI UFJ FINANCIAL GROUP INC MIZUHO FINANCIAL GROUP
NOMURA HOLDINGS INC
3.C JAPANESE BANKS (a)
0
50
100
150
200
2006 2007 2008 2009 2010
BARCLAYS PLC
HSBC HOLDINGS PLC
ROYAL BANK OF SCOTLAND GROUP PLC (The)
STANDARD CHARTERED BANK
3.D UK BANKS
0
50
100
150
200
2006 2007 2008 2009 2010
ROYAL BANK OF CANADA RBC
CREDIT SUISSE GROUP AG
UBS AG
3.E OTHER INDUSTRIALISED COUNTRIES (BANKS)


IDENTIFICACIÓN Y EVOLUCIÓN DE LOS CICLOS DE CRÉDITO
EN LAS ECONOMÍAS AVANZADAS
Rebeca Anguren Martín (*)
(*) Rebeca Anguren Martín pertenece a la Dirección General Adjunta de Asuntos Internacionales del Banco de
España. El trabajo se ha beneficiado de los comentarios recibidos de Jesús Saurina. Asimismo, la autora agradece
los comentarios de Enrique Alberola, Emiliano González-Mota y José Manuel Marqués Sevillano, así como la ayuda
recibida de Emilio Muñoz de la Peña. El presente artículo se basa en el documento de trabajo de R. Anguren (2011),
Credit cycles: Evidence based on a non linear model for developed countries.
Este artículo es responsabilidad exclusiva de la autora y no refleja necesariamente la opinión del Banco de España.


BANCO DE ESPAÑA 125 ESTABILIDAD FINANCIERA, NÚM. 22
IDENTIFICACIÓN Y EVOLUCIÓN DE LOS CICLOS DE CRÉDITO
EN LAS ECONOMÍAS AVANZADAS
El presente artículo se centra en uno de los campos de estudio que han adquirido especial
relevancia tras la última crisis financiera: el ciclo de crédito. En particular, se propone el
análisis de este haciendo uso de una variación del Markov con regímenes cambiantes
propuesto por Hamilton (1989). A través de este modelo se identifican las fases alcistas,
intermedias y bajistas en el crecimiento del crédito de diversos países desarrollados. La
distinción entre las distintas fases es resultado de la estimación, evitando arbitrariedades
en la captación de los distintos episodios. Por otra parte, los resultados del modelo per-
miten estudiar el ciclo de crédito tanto a nivel conjunto como a nivel nacional. Las fases
bajistas identificadas coinciden en numerosos casos con episodios de crisis bancaria y/o
financiera identificados previamente en la literatura, subrayando los paralelismos entre el
ciclo de crédito y el estado de los sistemas bancario y financiero. Asimismo, una compa-
ración de las fases bajistas de Estados Unidos con las recesiones señaladas por el NBER
muestra una estrecha relación entre el ciclo de crédito y el ciclo económico. Por último, se
observa una cierta sincronización entre los ciclos de crédito de las economías avanzadas,
siendo destacado el papel de Estados Unidos en este contexto.
El crédito bancario al sector privado de las economías desarrolladas ha estado sujeto a
fluctuaciones cíclicas durante los últimos 50 años, alternando episodios de expansión con
períodos de crecimiento muy reducido o incluso negativo, en términos reales, como puede
observarse en el gráfico 1 para los casos de Estados Unidos y de España. Con anterioridad
a la última crisis financiera, numerosos países experimentaron un fuerte crecimiento del
crédito. Esto sugiere que un seguimiento detallado de su ciclo puede ayudar a explicar o
anticipar mejor la evolución de otras variables en la economía [como el crecimiento econó-
mico: Borio et al. (2001)] y constituir una herramienta útil para identificar situaciones de
riesgo para la estabilidad financiera, dada su estrecha relación con la salud del sistema
financiero y bancario [véanse, por ejemplo, Kaminsky y Reinhart (1999), Borio y Lowe
(2002a, 2002b y 2004) y Borio y Drehmann (2009)].
1 Introducción
CRÉDITO BANCARIO AL SECTOR PRIVADO GRÁFICO 1
FUENTES: Fondo Monetario Internacional (IFS) y Banco de España.
-6
-4
-2
0
2
4
6
8
1960 1965 1970 1975 1980 1985 1990 1995 2000 2005 2010
ESPAÑA ESTADOS UNIDOS
DATOS EN TÉRMINOS REALES. TASA INTERTRIMESTRAL
%

BANCO DE ESPAÑA 126 ESTABILIDAD FINANCIERA, NÚM. 22
Este artículo presenta los resultados de Anguren (2011), propuesta que contribuye a este
campo de estudio a través de la modelización de los ciclos de crédito de doce econo-
mías desarrolladas haciendo uso de un modelo econométrico que ha demostrado poseer
ciertas ventajas en el análisis de ciclos: el modelo de Markov con regímenes cambiantes.
El artículo se organiza del siguiente modo. En la sección siguiente se describen breve-
mente la naturaleza y los determinantes de los ciclos de crédito, haciendo una revisión
de diversas teorías propuestas en este campo de investigación y señalando, además, su
relación con el ciclo económico y con el estado del sistema bancario. En la sección 3 se
presentan algunas de las metodologías que pueden ser utilizadas para el análisis del ciclo
de crédito. En la sección 4 se describen los resultados obtenidos de la estimación de un
modelo de Markov con regímenes cambiantes, presentando los ciclos de crédito identi-
ficados de forma individual y conjunta. Posteriormente, en la sección 5 se estudian los
paralelismos que presentan los ciclos de crédito con el estado de la economía y con la
evolución de las encuestas de préstamos bancarios. Finalmente, se exponen las conclu-
siones del trabajo.
En la actualidad existe un consenso bastante asentado sobre el carácter cíclico de la
evolución del crédito. Estas fluctuaciones están estrechamente relacionadas con el ciclo
económico, pudiendo actuar como amplificador durante episodios tanto de expansión
como de contracción de la actividad [Bordo et al. (2001)]. Sin embargo, la naturaleza de
las relaciones entre la actividad económica y el crédito no son evidentes, por lo que no
resulta sencillo identificar ni el sentido de la causalidad ni los canales subyacentes.
En primer lugar, la evolución de la actividad económica afecta al ciclo de crédito. En este
contexto, cambios en la demanda de financiación, derivados de una ralentización de la
actividad o de un empeoramiento en las condiciones y/o perspectivas de negocio, redu-
cen la actividad crediticia impulsando una fase bajista del crédito. Mientras que esta re-
lación enfatiza el lado de la demanda, el ciclo económico también puede influir en la
oferta de crédito: en un entorno económico contractivo, la calidad crediticia de los poten-
ciales prestatarios tiende a reducirse, induciendo un comportamiento más conservador
por parte de las entidades a la hora de conceder préstamos (canal de riesgo de crédito o
credit risk channel).
Existen otros factores que pueden afectar a la oferta de crédito y, a través de esta, al
crecimiento económico, lo que implicaría una causalidad del crédito a la actividad. Así,
si las entidades bancarias son una fuente importante de financiación para los hogares y
empresas, un shock específico que afecte a la disposición de las entidades a conceder
crédito (por ejemplo, variaciones en su coste de financiación, en su nivel de capital, en
los requisitos regulatorios o cambios en la calidad percibida de los prestatarios) incide
en las condiciones de acceso a este tipo de financiación. Esto afecta a la capacidad
para consumir e invertir en la economía, dando lugar a una aceleración o desaceleración
en el crecimiento económico (canal de crédito o bank lending channel) [véase Gordon y
Winton (2003)]1.
2 Naturaleza y
determinantes de
los ciclos de crédito
1 Otras teorías apuntan a que los ciclos de crédito tienen un origen propio no ligado a la situación económica
y, en concreto, se basan en los fallos de coordinación entre prestamistas [véase Gordon y He (2008)]. En virtud
de esta teoría, los ciclos de crédito resultarían de un proceso de colusión entre las entidades bancarias para
mantener unos tipos de interés poco competitivos, acordando de forma implícita reducir los fondos destinados
a investigar la calidad crediticia de los posibles prestatarios. Eventuales desviaciones en el comportamiento
de los prestamistas (adopción de políticas más rigurosas en la concesión de crédito reflejadas, por ejemplo,
en una reducción de la tasa de morosidad) inducirían al resto de entidades a restringir las condiciones aplica-
das para la concesión de préstamos de forma generalizada, dando lugar a una contracción del crédito bancario
a nivel agregado.

BANCO DE ESPAÑA 127 ESTABILIDAD FINANCIERA, NÚM. 22
La bidireccionalidad de la relación entre ciclo de crédito y ciclo económico ha sido subra-
yada por algunos autores, como Bernanke y Gertler (1989) o Kiyotaki y Moore (1997), que
consideran el ciclo de crédito como acelerador financiero del ciclo económico. Bajo esta
teoría, las fluctuaciones en el crédito vendrían explicadas, en buena medida, por los cam-
bios en el valor de los activos utilizados como colateral en los préstamos. En una parte
importante de los contratos de préstamo, el prestatario aporta un activo como colateral
que garantiza la devolución de la deuda y señaliza su calidad crediticia frente al prestamis-
ta. Por ejemplo, en el caso de los préstamos hipotecarios el colateral vendría dado por la
vivienda, mientras que en los créditos a empresas el colateral estaría representado, bien
por los activos aportados, o bien por el valor de liquidación de la empresa. El valor de los
activos aportados como garantía está sujeto a variaciones —inducidas, entre otras, por la
actividad o perspectivas económicas— que originan el comportamiento cíclico del crédito
(véase esquema 1). En períodos de expansión económica, o como consecuencia de un
shock externo, el valor del colateral aumenta, expandiendo la capacidad de obtener finan-
ciación por parte de los prestatarios. El mayor dinamismo en la actividad crediticia fomenta
la inversión y permite financiar aumentos en la demanda por parte de los hogares, impul-
sando el crecimiento económico y presionando al alza el valor de los activos. Cuando este
círculo virtuoso toca a su fin (por ejemplo, a causa de un shock externo sobre el precio de
los activos), la situación se invierte, dando lugar a un proceso de retroalimentación en el
que el descenso del crédito impulsa una menor actividad económica.
Bordo et al. (2001) sugieren que la teoría del acelerador financiero no es suficiente para expli-
car las fuertes fluctuaciones del crédito y del crecimiento económico como consecuencia de
períodos de inestabilidad financiera. Estos autores sostienen que los errores de valoración
del riesgo son la fuente fundamental que explica los cambios extremos en el ciclo de crédito
y su papel amplificador de los ciclos económicos. El riesgo tiende a ser infravalorado en
episodios de expansión, lo que explica los booms de crédito y el aumento de la fragilidad del
sistema financiero. Esta infravaloración vendría dada por una relajación de las políticas
de concesión de crédito, una sobrevaloración de activos, una contracción de diferencia-
les no basada en fundamentales y unos niveles de capital relativamente reducidos. En
este sentido, Jiménez y Saurina (2006) encuentran evidencia en el caso de España sobre la
relajación de los estándares de crédito requeridos por las entidades durante episodios de
expansión atendiendo tanto a la monitorización de prestatarios como a los requerimientos
Shock externo
DESCRIPCIÓN DEL CÍRCULO GENERADOR DEL ACELERADOR FINANCIERO ESQUEMA 1
FUENTE: Banco de España.
Precio de los activos
Valor del colateral
Capacidad de endeudamiento
Concesión de crédito
Inversión y demanda
Crecimiento económico

BANCO DE ESPAÑA 128 ESTABILIDAD FINANCIERA, NÚM. 22
de colateral. De forma alternativa, en épocas de recesión el riesgo tiende a ser sobrevalora-
do, contrayendo el acceso a la financiación de forma relativamente más severa durante pe-
ríodos más prolongados, lo que acaba agudizando los parones en la actividad económica.
Como puede deducirse de esta explicación, la evolución del crédito bancario viene determi-
nada en gran medida por estos cambios cíclicos en la valoración del riesgo. Estas fluctuacio-
nes, además, acentúan las dinámicas del ciclo económico y afectan directamente a la salud
de los sistemas financiero y bancario.
Existen diversas técnicas que permiten la identificación del ciclo de crédito bancario, sien-
do especialmente útiles las herramientas analíticas utilizadas para el estudio de los ciclos
económicos. Del mismo modo que ocurre en la identificación de episodios de recesión y
de expansión económica, los distintos instrumentos planteados para la caracterización del
ciclo de crédito presentan ciertas ventajas y desventajas, que deben ser tenidas en cuenta
a la hora de aplicarlos.
En primer lugar, el filtro lineal de Hodrick y Prescott (1997), filtro HP, es uno de los más
comunes en la identificación de ciclos económicos. Este se basa en la caracterización
del ciclo a través de las desviaciones de una determinada variable en torno a su tenden-
cia [Aykut et al. (2010)2 ]. Este filtro es capaz de distinguir entre la tendencia de la serie,
cuya estimación depende de un parámetro que determina si es más próxima a una línea
recta o a la propia evolución de la serie, y las fluctuaciones cíclicas respecto a la misma
que presenta la variable. Si bien el filtro HP presenta la ventaja de su simplicidad a la hora
del cálculo, es importante tener en cuenta la necesidad de elegir a priori el parámetro que
determina la evolución de la tendencia, lo que implica un cierto grado de arbitrariedad.
Asimismo, presenta un problema de sesgo en la estimación de la tendencia al final de la
muestra, dado el peso que concede a los últimos datos disponibles para la estimación de
la misma [French (2001)].
Otro tipo de técnicas se basa en el seguimiento de los cambios en los niveles de la serie.
Esto es, en lugar de extraer la tendencia para separar el componente cíclico, se estudia
directamente la evolución de la serie identificando las distintas fases del ciclo de acuerdo
con un conjunto de requisitos a través de algoritmos estadísticos, como el de de Bry y
Boschan (1971). Estos algoritmos se basan en la identificación de los máximos y mínimos
que presenta una determinada variable a lo largo de cierto período de tiempo, en función
de determinadas condiciones impuestas de forma subjetiva3. El uso de esta técnica pre-
senta la ventaja de que la determinación del ciclo no depende de la inclusión de nuevos
datos (como en el caso del filtro HP) y, además, es fácilmente replicable. Sin embargo,
conlleva un notable componente de valoración subjetiva a la hora de determinar la dura-
ción de las distintas fases.
Un enfoque cercano a la identificación de ciclos es el análisis de eventos, centrados en la
identificación de episodios de crisis bancarias o financieras que coinciden con períodos
de crisis de crédito. La mayoría de estas propuestas se basa en la identificación de crisis,
3 Identificación de
ciclos. El modelo de
Markov con regímenes
cambiantes
2 Aykut et al. (2010) utilizan dos métodos diferentes para identificar fluctuaciones en los flujos de deuda privada a
países emergentes y en vías de desarrollo. El primero aplica el filtro HP en una primera etapa, para después
identificar épocas de expansión como aquellos doce meses precedentes a los máximos locales de la serie
obtenida (y fases contractivas los doce meses posteriores). En segundo lugar, identifica episodios de boom-bust
utilizando como umbrales +/– 1 y +/– 0,5 desviaciones estándar de la serie respecto a su media histórica.
3 Por ejemplo, Claessens, Kose y Terrones (2011) imponen que la duración de un ciclo completo, es decir, el
número de períodos que tarda la serie en completar la fase de expansión y la fase de contracción, sea de al
menos cinco trimestres, y la duración de una determinada fase sea mayor o igual a dos trimestres.

BANCO DE ESPAÑA 129 ESTABILIDAD FINANCIERA, NÚM. 22
que se determinan cuando la evolución de distintas variables que describen el estado del
sector financiero cumple determinadas condiciones extremas. Por ejemplo, Laeven y Va-
lencia (2008) identifican episodios de crisis bancarias sistémicas para una muestra amplia
de países entre 1970 y 2007, haciendo uso de una combinación de datos cuantitativos
con una valoración subjetiva de la situación. Por otra parte, Bordo et al. (2001) presentan
una base de crisis financieras, cambiarias y bancarias, de modo que estas últimas corres-
ponden a períodos donde las tensiones financieras erosionaron la mayor parte o todo el
capital bancario del sistema4. Si bien este enfoque de análisis de eventos puede ser útil en
contextos como el actual, no es estrictamente un análisis de ciclos y, como los anteriores,
el componente subjetivo es elevado.
Dadas las limitaciones de los métodos anteriores, se ha planteado el uso de técnicas eco-
nométricas para identificar las distintas fases o regímenes de la actividad, destacando en-
tre ellas las basadas en el conocido como «modelo de Markov con regímenes cambiantes».
Este modelo fue introducido por Hamilton (1989) tomando como ejemplo el producto
nacional bruto (PNB), con el objetivo de caracterizar el ciclo económico en Estados Uni-
dos. El argumento básico descansa en el hecho de que las series económicas muestran
cambios drásticos en su evolución. Estas variaciones vendrían dadas por alteraciones en
el estado de la economía, como, por ejemplo, un episodio de inestabilidad financiera,
cambios de política económica u otras perturbaciones. Lo que Hamilton sugiere es que
las alternancias periódicas entre tasas de crecimiento positivas y negativas del PNB real
son una característica recurrente del ciclo económico. De este modo, la evolución de esta
serie puede ser utilizada para identificar a través de un criterio objetivo episodios de
recesión económica.
La estimación de este modelo permite cuantificar la probabilidad de que la actividad
—o cualquier otra variable— se encuentre en una u otra fase, las cuales presentan distin-
tas características (por ejemplo, en su media o varianza). Asimismo, este modelo permite
la inclusión de dos o más estados, permitiendo añadir de este modo fases adicionales
que captarían aquellos momentos donde la evolución se asemeja más a períodos de
crecimiento intermedios o a períodos de evolución extrema5. La asignación a cada uno de los
estados se realiza a través de una simple comparación entre dichas probabilidades. Así,
por ejemplo, si —como se hará en el ejercicio posterior— se consideran tres fases (alcista,
intermedia o bajista), el crecimiento de una variable se encontrará en una fase alcista siempre
y cuando la probabilidad de ese estadio sea superior a la probabilidad de encontrarse en
cualquiera de los otras dos.
Esta técnica, a pesar de presentar un coste computacional relativamente más elevado,
tiene la ventaja de que permite la identificación las distintas fases sin necesidad de intro-
ducir valoraciones subjetivas. Además, cabe notar que el modelo de Markov ha demos-
trado tener cierto éxito en la caracterización de los ciclos reales. Hamilton (1989) muestra
cómo los episodios de recesión captados por el modelo coinciden con aquellas recesio-
nes aceptadas por consenso en el ámbito económico6.
4 Reinhart y Rogoff (2008a, 2008b) ofrecen una síntesis de las crisis bancarias en una serie de países con un nivel
de ingresos medio-alto, determinando los episodios de crisis bancaria a las siguientes condiciones: 1) una huida
de los depósitos que da lugar al cierre, fusión o adquisición de una o más instituciones financieras, y/o 2) el
cierre, fusión, adquisición o intervención de una institución financiera destacada, marcando el inicio de una ca-
dena de eventos similares.
5 Para una descripción sobre la selección del número de regímenes considerados, véase Anguren (2011).
6 Según las identifica la organización no gubernamental de economistas estadounidense National Bureau of
Economic Research (NBER).

BANCO DE ESPAÑA 130 ESTABILIDAD FINANCIERA, NÚM. 22
En esta sección se presentan los resultados del estudio de Anguren (2011). En particular,
se propone la identificación de las distintas fases a través de un modelo de Markov con
regímenes cambiantes para doce países desarrollados durante el período 1960-2010.
Los países incluidos en la estimación son: Alemania, Bélgica, Canadá, España, Estados
Unidos, Francia, Holanda, Italia, Japón, Reino Unido, Suecia y Suiza.
Los datos utilizados en la estimación corresponden a tasas de crecimiento del crédito
bancario, en términos reales, entre los años 1960 y 2010, constituyendo un panel incom-
pleto donde el horizonte temporal para cada país viene determinado por la disponibilidad
de datos. En concreto, el estudio se centra en la financiación destinada al sector privado,
excluyendo la dirigida al sector público, ya que esta última presenta variaciones idiosin-
crásicas cuya relación con la economía y con el sector financiero no es tan clara. Las
series de crédito en términos nominales provienen de la base de datos International Fi-
nancial Statistics (IFS) del Fondo Monetario Internacional y se deflactan haciendo uso del
deflactor del producto interior bruto, o del índice de precios de consumo cuando el pri-
mero no está disponible (ambas se obtienen también de la base del IFS). Las tasas de
crecimiento utilizadas corresponden a cambios intertrimestrales, ya que esta frecuencia
permite evitar retrasos en la identificación de los puntos de giro en el ciclo, mientras que
el uso de series de tasas interanuales diluye, por construcción, el efecto de los cambios
en la serie trimestral.
La estimación del modelo se realiza de forma conjunta, incluyendo todos los países de la
muestra. Este punto resulta de especial interés en aquellos casos en los que el ciclo bajo
estudio presenta fases relativamente amplias y el horizonte temporal considerado puede
carecer de la variabilidad necesaria para asegurar que los parámetros son estimados de
forma eficiente. La estimación del modelo de forma conjunta se realiza bajo el supuesto
de que cada una de las series, una vez estandarizada, es una realización independiente del
mismo proceso [véase Cerón y Suárez (2006)]. Es precisamente a través de la estandari-
zación de las series como se asume que los componentes idiosincrásicos nacionales son
eliminados de la serie, de modo que se pueden modelar de forma conjunta.
En concreto, la especificación del modelo se realiza sobre las series estandarizadas del
crecimiento intertrimestral del crédito bancario (∆dit ):
[1]
donde α i y σ i representan la media y en varianza no condicionadas de la serie, las cuales
se asume que contienen las características particulares de cada país, de modo que a
través de la estandarización se obtendría el componente puramente cíclico de la serie. El
modelo que se ha de estimar es el siguiente:
∆d it = μ(s it ) + φ(∆d it–1 – μ (s it–1)) + ϵ it, [2] ϵ it ~ iidN(0,1)
La variable latente s it describe el estado del ciclo de crédito para cada país i en el mo-
mento t. En concreto, se considera la existencia de tres estados en la evolución del crédito
(alcista, intermedio y bajista), los cuales determinan la media de la serie μ (s it ).
En el cuadro 1 se presentan los resultados de estimación del modelo. Las fases alcistas
recogen episodios donde el crecimiento del crédito ha sido relativamente más elevado,
4 El ciclo de crédito
en las economías
desarrolladas
∆d it = (dit – α i ) ,
σi

BANCO DE ESPAÑA 131 ESTABILIDAD FINANCIERA, NÚM. 22
con un crecimiento medio del 0,808 (es importante notar que estos parámetros se obtie-
nen de series estandarizadas, por lo que este valor representaría un 80,8 % de una des-
viación típica más la media no condicionada de la serie original7) y una duración esperada
superior a tres años. Las fases bajistas presentan una duración menor de dos años y
engloban períodos donde el crecimiento fue negativo; en concreto, –1,212. Por último,
las fases en las que la evolución del crédito no ha sido extremo (–0,185), durante las fases
intermedias, son las más usuales, con una duración esperada superior a tres años y una
probabilidad no condicionada del 44,8 %.
El cuadro 2 muestra la evolución de los ciclos de crédito identificados por el modelo me-
diante un mapa térmico, donde se distinguen por colores las tres fases. Los períodos de
transición entre las distintas fases muestran ciertas peculiaridades que cabe destacar. Por
ejemplo, durante la década de los setenta, la mitad de los países considerados registró
frenazos en el crecimiento del crédito bancario, entrando directamente en fases bajistas
—en rojo— tras un período de expansión —en verde— (Alemania, Estados Unidos, Francia,
Italia y Reino Unido). En segundo lugar, parece que este fenómeno ha ido desapareciendo
en las siguientes décadas, durante las cuales la ralentización en el crecimiento del crédito
pasó a ser más gradual, presentando episodios de crecimientos intermedios —en amarillo—
entre fases alcistas y fases bajistas (Alemania en 2001, España en 1990, y Estados Unidos
en 1987 y en 2007). En tercer lugar, se puede observar cómo, en la mayoría de los casos,
las fases bajistas finalizaron con períodos de crecimiento intermedio, lo que indica que las
recuperaciones rápidas no son frecuentes en el ciclo de crédito bancario. Por último, tras
el inicio de la crisis financiera en 2007, seis países habrían entrado en algún momento en
un episodio bajista o de ajuste (Alemania, Canadá, España, Estados Unidos, Holanda y
Suiza), y el crédito continuaría en el último período disponible en la muestra en esa fase en
tres de ellos (Alemania, España y Estados Unidos).
Es destacable que los episodios de fases bajistas detectados por el modelo coinciden en
varios casos con crisis financieras o bancarias identificadas previamente en la literatura,
lo que indica una notable correlación entre el análisis de eventos y este tipo de análisis.
FUENTE: Anguren (2011).
a Los números entre paréntesis se re eren a la desviación estándar de los parámetros estimados.b p_ii se re ere a la probabilidad de que la variable latente permaneza en el mismo estado (i = 1, 2, 3) en el período siguiente.c La duración esperada de cada estado se obtiene del siguiente modo: 1 / (1 – p_ii).d Probabilidad no condicionada de que el ciclo de crédito se encuentre en cada una de las fases.
FASE Media (a) p_ii (a) (b)Duración esperada
(n.º trimestres) (c)Probabilidad ergódica (d)
1 Alcista 0,808 0,923 13,0 0,371
(0,055) (0,013)
2 Intermedia -0,185 0,924 13,2 0,448
(0,063) (0,016)
3 Bajista -1,212 0,864 7,4 0,181
(0,075) (0,011)
RESULTADOS DE ESTIMACIÓN CUADRO 1
7 La traducción de estos parámetros para cada una de las series originales debe llevarse a cabo deshaciendo la
estandarización propuesta para la estimación. De este modo, las medias para cada uno de los estados difiere
entre países, siendo más extremas en casos como Suecia o Reino Unido (donde los períodos expansivos coin-
ciden con crecimientos medios cercanos al 3 % intertrimestral y los períodos bajistas con decrecimientos me-
dios mayores del –1 % intertrimestral). Véase Anguren (2011).

BANCO DE ESPAÑA 132 ESTABILIDAD FINANCIERA, NÚM. 22
Por ejemplo, las fases de ajuste en España (1977), Japón (a mediados de los noventa) o
Suecia (1991) forman parte de las que Reinhart y Rogoff (2008a) llaman las «cinco grandes
crisis financieras». Asimismo, existen diversos episodios que concuerdan con crisis ban-
carias detalladas por Honohan y Laeven (2005) y Laeven y Valencia (2008), como Alemania
en la primera mitad de los setenta, Italia a mediados de los noventa, Reino Unido a media-
dos de los setenta o la savings and loans crisis en Estados Unidos.
Respecto a la evolución individual de los ciclos de crédito, en el gráfico 2 se muestra la
evolución de la probabilidad de estar en estadios alcistas o bajistas junto con las series
utilizadas en la estimación para los casos de España, Japón y Suecia (países que han
sufrido importantes crisis crediticias, como se comentaba en el párrafo anterior). En mu-
chos de estos casos, la dinámica observada en la evolución del crédito refleja aconteci-
mientos característicos de episodios de crisis financiera y/o bancaria. Por ejemplo, antes
de la crisis de los países nórdicos de principios de los noventa, la actividad crediticia de las
entidades bancarias en estos países creció fuertemente, resultando en un episodio de
expansión. La evolución del ciclo en Suecia describe este desarrollo con un prolongado
período de expansión desde 1985, previo a su entrada en una fase bajista iniciada en el
primer trimestre de 1990.
Japón también muestra un comportamiento singular que refleja la importante crisis ban-
caria experimentada a principios de los años noventa y que marcó el inicio de la «década
perdida». El sector bancario japonés experimentó un prolongado período de expansión de
la financiación bancaria a finales de los ochenta, en paralelo con la burbuja en los precios
de los activos que finalmente explotaría en el año 1991. El efecto del pinchazo de esta
burbuja es capturado como un episodio de crecimiento intermedio, pues el ajuste del
crédito bancario fue paulatino. No obstante, el fuerte incremento de las pérdidas experi-
mentadas por el sector bancario (por el reconocimiento de préstamos incobrables y el
fuerte incremento de las provisiones) dio lugar a una nueva oleada de quiebras bancarias
FUENTE: Banco de España.
a La fecha de cierre es el I TR 2010, exceptuando Canadá (IV TR 2008), Japón (IV TR 2009) y Estados Unidos (IV TR 2009).
Bélgica
Canadá
Francia
Alemania
Italia
Japón
Holanda
España
Suecia
Suiza
Reino Unido
Estados Unidos
Global
FASE BAJISTA FASE INTERMEDIA FASE ALCISTA DATO NO DISPONIBLE
Ciclo del crédito
1960 1970 1980 1990 2000 2010
MAPA TÉRMICO: EVOLUCIÓN DEL CICLO DEL CRÉDITO (a) CUADRO 2

BANCO DE ESPAÑA 133 ESTABILIDAD FINANCIERA, NÚM. 22
que desembocaría en el año 1997 en una de las fases bajistas más prolongadas observa-
das en el conjunto de países incluidos en la muestra [véase Nakaso (2001)]8. En definitiva,
aunque en la crisis japonesa la expansión no fue seguida por una fase bajista inmediata-
mente, los efectos del ajuste se hicieron sentir en el medio plazo y han sido muy persis-
tentes: casi veinte años después, el crédito no ha vuelto a situarse en una fase alcista
(véase también el cuadro 1).
FUENTE: Banco de España.
PROBABILIDADES DE ESTAR EN FASE BAJISTA Y ALCISTA GRÁFICO 2
-6
-4
-2
0
2
4
0,0
0,2
0,4
0,6
0,8
1,0
1960 1965 1970 1975 1980 1985 1990 1995 2000 2005 2010
PROBABILIDAD DE ESTAR EN FASE BAJISTA PROBABILIDAD DE ESTAR EN FASE ALCISTA SERIE ESTANDARIZADA (Escala dcha.)
SUECIA
-6
-4
-2
0
2
4
0,0
0,2
0,4
0,6
0,8
1,0
1960 1965 1970 1975 1980 1985 1990 1995 2000 2005 2010
PROBABILIDAD DE ESTAR EN FASE BAJISTA PROBABILIDAD DE ESTAR EN FASE ALCISTA SERIE ESTANDARIZADA (Escala dcha.)
JAPÓN
-6
-4
-2
0
2
4
0,0
0,2
0,4
0,6
0,8
1,0
1960 1965 1970 1975 1980 1985 1990 1995 2000 2005 2010
PROBABILIDAD DE ESTAR EN FASE BAJISTA PROBABILIDAD DE ESTAR EN FASE ALCISTA SERIE ESTANDARIZADA (Escala dcha.)
ESPAÑA
8 No se ha encontrado evidencia que respalde el repunte en la probabilidad de estar en una fase alcista en el
cuarto trimestre 1997 para Japón, por lo que cabe pensar que puede tener su origen en un cambio de metodo-
logía en las series.

BANCO DE ESPAÑA 134 ESTABILIDAD FINANCIERA, NÚM. 22
En el caso de España, cabe destacar que la fase bajista observada en el año 1977 coincide
con la crisis bancaria que vino precedida por un período de fuerte expansión del crédito
bancario. Asimismo, se puede observar que las transiciones experimentadas por el creci-
miento del crédito en este caso y a principios de los noventa fueron graduales, entrando
en un período de crecimiento intermedio previo a las fases bajistas. Sin embargo, el punto
de giro observado en la última crisis fue más contundente. Durante los años previos a la
crisis financiera iniciada en 2007, tuvo lugar uno de los episodios de expansión de crédito
más amplios observados en el período considerado, que finalizó súbitamente en torno al
segundo trimestre de 2009, cuando el crédito entra en una fase bajista.
Una de las ventajas de trabajar con una muestra amplia de países avanzados es que
permite estudiar la evolución del ciclo de crédito desde una perspectiva global para las
áreas desarrolladas y su grado de sincronización. En el gráfico 3 se muestra un indica-
dor compuesto por la media simple de las probabilidades de estar en una fase bajista en
cada uno de los países considerados, junto con las contribuciones de distintas áreas a
la evolución del mismo (también en el mapa térmico representado en el cuadro 1 se ha
incluido la secuencia de fases agregada). El indicador representado en el gráfico 3 apor-
ta evidencia sobre la existencia de un patrón cíclico sistemático en el crecimiento del
crédito en este grupo de países desarrollados durante los últimos cuarenta años. Así, se
pueden identificar cinco episodios de fase bajista sincronizada en el crédito bancario:
1974-1975, 1980-1982, 1991-1993, 2001-2002 y desde 2008 hasta el final de la mues-
tra. Sin embargo, solo en tres de esas ocasiones se observó un cambio de fase en el
crédito bancario global (1974-1975, 1991-1993 y 2001-2002). Esta menor recurrencia
viene inducida por el efecto agregación de las series en el indicador, que tiende a alisar
la serie y a reducir las observaciones extremas. Por último, en el mapa térmico resulta
especialmente llamativo el hecho que, tanto en el inicio la última crisis financiera como
en el episodio de mediados de los años setenta, se observó un parón generalizado con
cambios simultáneos desde fases alcistas a fases intermedias o bajistas en la mayor
parte de estos países.
En el gráfico 4 se pueden observar una descripción alternativa de la sincronización del cré-
dito global y su correlación con el de Estados Unidos. La línea roja muestra el porcentaje de
países que se encontraban en una fase bajista, mientras que la línea azul refleja el porcen-
taje de países en una fase bajista o intermedia. Las áreas sombreadas corresponden
FUENTE: Banco de España.
a Países: Japón, Europa del euro (Alemania, Bélgica, España, Francia, Holanda e Italia), Europa no del euro (Reino Unido, Suecia y Suiza) y Estados Unidos.
INDICADOR: PROBABILIDAD GLOBAL DE ESTAR EN FASE BAJISTA (a) GRÁFICO 3
0,0
0,1
0,2
0,3
0,4
0,5
0,6
1970 1975 1980 1985 1990 1995 2000 2005 2010
TOTAL CONTRIBUCIÓN ESTADOS UNIDOS CONTRIBUCIÓN EUROPA DEL EURO (a) CONTRIBUCIÓN EUROPA NO DEL EURO (a) CONTRIBUCIÓN JAPÓN
PROBABILIDAD MEDIA

BANCO DE ESPAÑA 135 ESTABILIDAD FINANCIERA, NÚM. 22
a períodos en los cuales el ciclo crediticio en Estados Unidos se encontraba en un episodio
contractivo. Esta comparativa visual permite observar que el ciclo estadounidense mues-
tra una alta correlación con la evolución del crédito bancario en el ámbito internacional.
Asimismo, se intuye una cierta anticipación del ciclo de Estados Unidos frente al global,
entrando en episodios bajistas con anterioridad a otros países y recuperándose cuando
buena parte de las economías analizadas acababa de entrar en un período de restriccio-
nes en el crecimiento del crédito.
Como se ha expuesto anteriormente, en muchas ocasiones las fluctuaciones en el creci-
miento del crédito están relacionadas con el estado del ciclo económico real. Se puede
estudiar la relación entre ambos a través de una comparación de los episodios de crisis
crediticia identificados por el modelo de Markov frente a las recesiones económicas que
se han dado en un determinado país. A modo de ilustración, el gráfico 5 muestra, para el
caso de Estados Unidos, la evolución de la probabilidad de estar en una fase bajista (en
rojo) y alcista (en verde), junto con las recesiones identificadas por el NBER durante los
últimos cincuenta años (área sombreada).
En el gráfico se puede observar que, para el caso de Estados Unidos, existe una relación
estrecha entre la evolución de la economía real y el estado de la financiación bancaria. Cua-
tro de las recesiones experimentadas en el período considerado han estado acompañadas
por fases bajistas en el ciclo de crédito: la primera crisis del petróleo (1973-1975), la segun-
da crisis del petróleo (1979-1982), la crisis de las savings and loans (1989-1993) y la crisis
financiera iniciada en 2007. Respecto a las recesiones de inicio de los setenta y en 2001,
se puede observar que, aunque el modelo no identifica una entrada en una fase bajista, la
probabilidad de encontrarse en la misma aumenta. De hecho, durante estos períodos el
ciclo de crédito se ralentizó de forma moderada, entrando en una fase intermedia (véase
cuadro 2).
Como ya se ha expuesto en la sección 2, la causalidad entre ambos ciclos puede darse
en los dos sentidos. Las recesiones de los años ochenta y noventa comenzaron con
posterioridad al inicio de una fase bajista de crédito, de modo que la ralentización del
crédito bancario habría incidido en la actividad económica a través del canal de crédito
o bank lending channel. Por otra parte, se puede observar cómo, durante las recesiones
de mediados de los setenta y la reciente crisis financiera, la evolución del crédito banca-
rio ha presentado un comportamiento retardado frente al ciclo económico real. En el
período actual, sin duda, la caída de la actividad ha desempeñado un papel importante
5 Relación con el ciclo
económico real y con
las encuestas de
opinión sobre
préstamos bancarios
SINCRONIZACIÓN DEL CICLO DE CRÉDITO GRÁFICO 4
FUENTE: Banco de España.
0
10
20
30
40
50
60
70
80
90
100
1970 1975 1980 1985 1990 1995 2000 2005 2010
EPISODIOS DE FASE BAJISTA PARA ESTADOS UNIDOS PORCENTAJE DE PAÍSES EN FASE INTERMEDIA O BAJA PORCENTAJE DE PAÍSES EN FASE BAJISTA
%

BANCO DE ESPAÑA 136 ESTABILIDAD FINANCIERA, NÚM. 22
en la reducción de la demanda crédito, pero no se puede descartar que un comporta-
miento más cauto de los prestatarios —el canal de riesgo de crédito— también haya
desempeñado un papel relevante. En todos los casos, no obstante, hay que tener en
cuenta que el efecto del acelerador financiero tiende a generar espirales en el que el
sentido de la causalidad actúa en ambas direcciones.
También se puede observar en el gráfico 5 cómo todos los episodios bajistas de creci-
miento del crédito estuvieron precedidos por un período de expansión, si bien es llamativo
el hecho de que no resulta sencillo establecer una relación clara entre la duración de las
fases de auge del crédito y los subsecuentes períodos bajistas. Algunos autores han se-
ñalado la relación entre un crecimiento rápido del crédito y un aumento de la fragilidad del
sistema bancario, apuntando a su capacidad como indicador adelantado de futuras crisis
bancarias o financieras [Kaminsky y Reinhart (1999)]. En todo caso, cabe destacar el he-
cho de que el crecimiento acelerado del crédito bancario puede venir dado por un proce-
so de desarrollo financiero que sirva de base para un mayor crecimiento económico. Por
ejemplo, según Alberola y Berganza (2007) el avance del crédito bancario previo a la crisis
financiera observado en los países de América Latina desde comienzos de 2004 hasta el
inicio de la crisis financiera parece haber estado determinado, fundamentalmente, por un
proceso de profundización bancaria.
Como se explica en la sección 2, la evolución del ciclo de crédito está relacionada con los
cambios en la valoración del riesgo de las entidades y con sus criterios para la concesión
de préstamos. De acuerdo con ello, cabría esperar que los ciclos muestren un comporta-
miento similar al de variables que reflejen los cambios en sus políticas de concesión, como,
por ejemplo, las encuestas sobre préstamos bancarios. Estas encuestas ofrecen informa-
ción cualitativa sobre las condiciones de la oferta de crédito bancario9. En el gráfico 6 se
muestra una comparación entre el ciclo de crédito y los estándares aplicados por las enti-
dades bancarias en la concesión de préstamos para los casos de Estados Unidos (panel
superior) y la zona del euro (panel inferior). La variable referida a los estándares aplicados
señala el porcentaje de encuestados que afirmaron haber endurecido los estándares a la
concesión de préstamos durante el trimestre (un signo positivo refleja un endurecimien-
to neto y un signo negativo señala una relajación neta). En el caso de Estados Unidos,
se observa una relación estrecha entre ambas variables, especialmente desde los años
9 Lown y Morgan (2006) sugieren que la evolución de los estándares aplicados por las entidades dominan a los
tipos de interés de los préstamos como variable explicativa de la variación del crédito bancario.
EVOLUCIÓN DEL CRÉDITO BANCARIO Y DE LAS RECESIONES NBER GRÁFICO 5
FUENTE: Banco de España.
0,0
0,2
0,4
0,6
0,8
1,0
1970 1975 1980 1985 1990 1995 2000 2005 2010
RECESIONES NBER PROBABILIDAD DE ESTAR EN FASE BAJISTA PROBABILIDAD DE ESTAR EN FASE ALCISTA
PROBABILIDADES DE ESTAR EN FASE BAJISTA Y ALCISTA, Y RECESIONES

BANCO DE ESPAÑA 137 ESTABILIDAD FINANCIERA, NÚM. 22
noventa. Además, resulta llamativo el hecho de que la evolución de los estándares reac-
cionó con anterioridad al crédito bancario durante la mayor parte del período (por ejemplo,
previamente a la última crisis financiera, las entidades comenzaron a endurecer las condi-
ciones en el primer trimestre de 2007, mientras que el crecimiento del crédito entró en fase
bajista en el segundo trimestre de 2008). El gráfico correspondiente a la zona del euro
comprende un período más reducido, dada la disponibilidad de la encuesta elaborada por
el Banco Central Europeo. El patrón observado tiene cierta similitud al de Estados Unidos,
ya que los datos indican que las entidades bancarias comenzaron a endurecer los están-
dares aplicados en el segundo trimestre de 2007, mientras que el crecimiento del crédito
no comenzó a ralentizarse hasta el primer trimestre de 2008. A partir de ese momento, el
indicador para la zona del euro refleja un aumento de la probabilidad de estar en una fase
bajista de crédito, si bien seguía sin ser la fase dominante al final de la muestra.
El presente artículo se centra en uno de los campos de estudio que han adquirido espe-
cial relevancia tras la última crisis financiera: el ciclo de crédito. Esta rama de investiga-
ción resulta de interés, dada su relación con la evolución de la actividad económica, así
como para comprender las dinámicas que afectan al estado de los sistemas financiero y
bancario. En particular, se propone el análisis del ciclo de crédito haciendo uso de un
modelo de Markov con regímenes cambiantes, propuesto originalmente por Hamilton
(1989) para el PNB de Estados Unidos. Este enfoque ha demostrado poseer ciertas ventajas
6 Conclusiones
FUENTE: Banco de España.
a Porcentaje neto de entidades que a rman haber endurecido las condiciones de concesión de nuevos préstamos. Un signo positivo/negativo muestra un endurecimiento/relajación durante el trimestre correspondiente. Durante el período 1984-1989 no existen datos, ya que la Reserva Federal optó por no realizarla.
b Países de la zona del euro de la muestra: Alemania, Bélgica, España, Francia, Holanda e Italia.
PROBABILIDAD DE ESTAR EN FASE BAJISTA Y ESTÁNDARES DE CONCESIÓN GRÁFICO 6
-30
0
30
60
90
0,00
0,25
0,50
0,75
1,00
1970 1975 1980 1985 1990 1995 2000 2005 2010
PROBABILIDAD DE ESTAR EN FASE BAJISTA ESTÁNDARES APLICADOS (Senior Loan Of cer Opinion Survey) (Escala dcha.) (a)
ESTADOS UNIDOS
%
-30
-10
10
30
50
70
0,00
0,05
0,10
0,15
0,20
0,25
2003 2004 2005 2006 2007 2008 2009 2010
PROBABILIDAD DE ESTAR EN FASE BAJISTA ESTÁNDARES APLICADOS (Euro Area Bank Lending Survey) (Escala dcha.) (a)
ZONA DEL EURO (b)
%

BANCO DE ESPAÑA 138 ESTABILIDAD FINANCIERA, NÚM. 22
en el análisis de ciclos: en particular, la minimización del grado de arbitrariedad en el
análisis de las series.
Los resultados muestran cómo las economías desarrolladas consideradas (G 10 más España)
han experimentado fases alcistas y bajistas de modo recurrente durante los últimos cincuen-
ta años. Asimismo, se observa una cierta sincronía en sus ciclos, destacando el papel de
Estados Unidos en este contexto. Por otra parte, es llamativo el cambio en el comportamien-
to de los ciclos observados en cuanto a sus cambios de fase o puntos de giro. Mientras que
en los años setenta eran más usuales los parones bruscos en el crecimiento del crédito —es
decir, el paso de fases alcistas a bajistas sin pasar por el estadio intermedio—, desde finales
de los ochenta se observan cambios más graduales. También es destacable el hecho de que
muchos de los episodios de crisis crediticias identificados en este trabajo están estrecha-
mente relacionados con la situación del sistema financiero, coincidiendo en muchos casos
con crisis bancarias o financieras señaladas en la literatura.
Asimismo, también se observa, tomando el ejemplo de Estados Unidos, que la relación
entre el ciclo del crédito y el de la actividad opera en ambas direcciones, observándose
casos en los que la fase bajista del ciclo de crédito se anticipó a episodios de recesión, y
viceversa. Por último, la evolución del ciclo de crédito presenta un comportamiento simi-
lar, aunque en su mayor parte retardado, al de los estándares aplicados por las entidades
en la concesión de préstamos, los cuales representan una medida cualitativa de la oferta
de crédito bancario.
ALBEROLA, E., y J. C. BERGANZA (2007). «La recuperación del crédito bancario en América Latina», Boletín Eco-
nómico, febrero, Banco de España.
ANGUREN, R. (2011). Credit cycles: Evidence based on a non linear model for developed countries, Documentos de
Trabajo, n.º 1113, Banco de España.
AYKUT, D., J. L. FRANCIS y E. TEREANU (2010). The cost of private debt over the credit cycle, IMF Working Paper,
n.º 10/283.
BERNANKE, B., y M. GERTLER (1989). «Agency Costs, Net Worth, and Business Fluctuations», American Economic
Review, vol. 79, n.º 1, pp. 14-31.
BORDO, M., B. EICHENGREEN y M. S. MARTÍNEZ PEIRA (2001). «Is the crisis problema growing more severe?»,
Economic Policy, n.º 16, pp. 51-82.
BORIO, C., C. FURFINE y P. LOWE (2001). «Procyclicality of the financial system and financial stability: issues and
policy options», en Marrying the macro- and microprudential dimensions of financial stability, BIS Papers n.º 1,
pp. 1-57.
BORIO, C., y P. LOWE (2002a). Asset prices, financial and monetary stability: exploring the nexus, BIS Working Pa-
pers, n.º 114, julio.
— (2002b). «Assessing the risk of banking crises», BIS Quarterly Review, diciembre, pp 43-54.
— (2004). Securing sustainable price stability: Should credit come back from the wilderness, BIS Working Papers,
n.º 157, julio.
BORIO, C., y M. DREHMANN (2009). «Assessing the risks of banking crises – revisited», BIS Quarterly Review,
marzo, pp. 29-46.
BRY, G., y C. BOSCHAN (1971). Cyclical Analysis of Economic Time Series: Selected Procedures and Computer
Programs, NBER Technical Working Paper, n.º 20.
CERÓN, J., y J. SUÁREZ (2006). Hot and cold housing markets: International evidence, CEMFI, Working
Paper, n.º 0603.
CLAESSENS, S., A. KOSE y M. TERRONES (2011). Financial cycles: What? How? When?, IMF Working
Paper, n.º 1176.
COTARELLI, C., G. DELL’ ARICCIA y I. VLADKOVA-HOLLAR (2005). «Early Birds, Late Disasters, and Sleeping Beauties:
Bank Credit Growth to the Private Sector in Central and Eastern Europe and the Balkans», Journal of Banking
and Finance, n.º 29, pp. 83-104.
FRENCH, M. W. (2001). Estimating changes in trend growth of total factor productivity: Kalman and H-P filters
versus a Markov-switching framework, Federal Reserve System FEDS Working Paper n.º 2001-44.
GORTON, G., y P. HE (2008). «Bank Credit Cycles», Review of Economic Studies, vol. 75, n.º 4, pp. 1181-1214.
GORTON, G., y A. WINTON (2003). «Financial intermediation», en G. M. Constantinides, M. Harris y R. M. Stulz
(eds.), Handbook of the Economics of Finance (Elsevier).
HAMILTON, J. (1989). «A new approach to the economic analysis of nonstationary time series and the business
cycle, Econometrica, n.º 57, pp. 357-389.
HODRICK, R. J., y E. C. PRESCOTT (1997). «Postwar US Business Cycles: An Empirical Investigation», Journal of
Money, Credit and Banking, vol. 29, pp.1-16.
BIBLIOGRAFÍA

BANCO DE ESPAÑA 139 ESTABILIDAD FINANCIERA, NÚM. 22
HONOHAN, P., y L. LAEVEN (2005). Systemic Financial Distress: Containment and Resolution, Cambridge
University Press.
JIMÉNEZ, G., y J. SAURINA (2006). «Credit cycles, credit risk, and prudential regulation», International Journal
of Central Banking, junio, pp. 65-98.
KAMINSKY, G., y C. REINHART (1999). «The twin crises: The causes of banking and balance-of-payments problems»,
American Economic Review, vol. 89, n.º 3, pp. 473-500.
KIYOTAKI, N., y J. MOORE (1997). «Credit Cycles», Journal of Political Economy, n.º 105, pp. 211-248.
LAEVEN, L., y F. VALENCIA (2008). Systemic Banking Crises: A New Database, IMF Working Paper WP/08/224.
LOWN, C., y D. MORGAN (2006). «The credit cycle and the business cycle: New findings using the Loan Officer
Opinion Survey», Journal of Money, Credit and Banking, vol. 38, n.º 6, pp. 1575-1597.
NAKASO, H. (2001). The financial crisis in Japan during the 1990s: how the Bank of Japan responded and lessons
learnt, BIS papers, n.º 6.
REINHART, C. M., y K. S. ROGOFF (2008a). This time is different: a panoramic view of eight centuries of financial
crises, NBER Working Paper, n.º 13882.
— (2008b). Banking crises: an equal opportunity menace, NBER Working Paper, n.º 14587.


BANCO DE ESPAÑA 141 ESTABILIDAD FINANCIERA, NÚM. 22
ARTÍCULOS PUBLICADOS EN ESTABILIDAD FINANCIERA
Labor reciente del Comité de Basilea no relacionada con el capital,
Danièle Nouy
Las recomendaciones del Comité de Supervisión Bancaria de Basilea,
Raimundo Poveda Anadón
Introducción al Pilar 1 de Basilea II,
Fernando Vargas
El Proceso de Revisión Supervisora en las propuestas del Comité de Basilea,
Joaquín Gutiérrez García
Entidades de crédito: transparencia y disciplina de mercado,
Anselmo Díaz
El proceso de revisión de capital en la Unión Europea,
Cristina Iglesias-Sarria
Basilea II: efectos sobre la práctica supervisora,
José María Lamamié de Clairac y Francisco Gil Almansa
El coeficiente de solvencia de las entidades de crédito españolas,
Pilar Álvarez Canal
Capital regulatorio y capital económico: el efecto de la calidad crediticia y del ajuste por vencimiento,
Gregorio Moral, Carlos Corcóstegui y Raúl García
Modelos factoriales de riesgo de crédito: el modelo de Basilea II y sus implicaciones,
Carlos Trucharte Artigas y Antonio Marcelo Antuña
Basilea 2: Desarrollos desde la publicación del papel consultivo de enero de 2001,
Cristina Iglesias-Sarria y Fernando Vargas
Capital regulatorio y capital económico: prociclicidad del Nuevo Acuerdo de Capital y análisis de escenarios de crisis,
Luis González Mosquera
Los determinantes del excedente de recursos propios de las entidades españolas,
Juan Ayuso, Daniel Pérez y Jesús Saurina
Dinámica temporal de diferentes definiciones de impago,
José Ramón Martínez Resano
Un sistema de clasificación (rating) de acreditados,
Carlos Trucharte Artigas y Antonio Marcelo Antuña
Tratamiento contable de los instrumentos financieros,
Anselmo Díaz
Supervisión del riesgo de liquidez,
Bernardo Orsikowsky
Riesgos en la compensación y liquidación transfronteriza de valores,
M.ª Nieves García-Santos
Indicadores adelantados de crisis y su papel en el análisis económico,
Santiago Fernández de Lis y Alicia García Herrero
Los derivados de crédito,
Jorge Pérez Ramírez
Incorporación de la tecnología de la información a la actividad bancaria en España: la banca por Internet,
Javier Delgado y María Jesús Nieto
Las pequeñas y medianas empresas en el sistema crediticio español y su tratamiento según Basilea II,
Jesús Saurina Salas y Carlos Trucharte Artigas
Número 1 – septiembre 2001
Número 2 – marzo 2002
Número 3 – noviembre 2002

BANCO DE ESPAÑA 142 ESTABILIDAD FINANCIERA, NÚM. 22
Estimación de la severidad de una cartera de préstamos hipotecarios,
Gregorio Moral Turiel y Raúl García Baena
Los sistemas de garantía de depósitos como promotores de la estabilidad financiera,
Luis Javier García Macarrón
El marco general de la validación de procedimientos internos en Basilea II: el enfoque IRB,
Fernando Vargas
Ciclo económico y capital regulatorio: evidencia en un sistema de clasificación de acreditados,
Carlos Corcóstegui, Luis González Mosquera, Antonio Marcelo y Carlos Trucharte
Basilea II y la gestión de las entidades financieras: consideraciones estratégicas,
Manuel A. Méndez
La nueva regulación de los conglomerados financieros: cuestiones fundamentales,
José Manuel Gómez de Miguel
El gobierno de las empresas desde la perspectiva del análisis económico,
María Gutiérrez
Notas sobre la arquitectura de la regulación, supervisión y estabilidad financiera en Europa,
María Jesús Nieto y Juan M.ª Peñalosa
Algunas claves sobre la contabilidad europea: el nuevo proceso regulador y las nuevas normas,
Begoña Giner Inchausti
La contribución de los sistemas de pagos a la estabilidad financiera. El caso español,
Susana Núñez y María Luisa Leyva
Basilea II: tercer documento consultivo y últimos avances,
Linette Field
El estudio del impacto cuantitativo en España de la propuesta (CP3) de Nuevo Acuerdo de Capital de Basilea,
Cecilia Lozano
Basilea II: un análisis de los cambios en el enfoque IRB,
Jesús Saurina y Carlos Trucharte
Inversión en el sector financiero de los países emergentes: posibles riesgos y su gestión,
Sonsoles Gallego, Alicia García Herrero y Cristina Luna
El gobierno de la empresa bancaria desde la regulación,
Vicente Salas Fumás
De la función de riesgos: una aproximación a los riesgos del balance,
Juan Andrés Yanes y Jesús M. Tarriba Unger
Especialización crediticia y resultados en la banca europea,
Javier Delgado, Daniel Pérez y Vicente Salas
Indicadores de estabilidad financiera (FSI). Origen, aspectos metodológicos y elaboración para las entidades
de depósito españolas,
Cristina Luna
Las pruebas de estrés en los programas de evaluación del sistema financiero,
Roberto Blanco Escolar y Alicia García Herrero
Margen de intermediación de las entidades de depósito,
José Cebrián Carrasco
Implicaciones de Basilea II para América Latina,
Andrew Powell
Perspectivas de rentabilidad de la banca por Internet en Europa,
Javier Delgado, Ignacio Hernando y María Jesús Nieto
Análisis institucional y económico de la nueva Ley Concursal,
Esteban van Hemmen Almazor
Número 4 – mayo 2003
Número 5 – noviembre 2003
Número 6 – mayo 2004

BANCO DE ESPAÑA 143 ESTABILIDAD FINANCIERA, NÚM. 22
El Nuevo Acuerdo de Capital «Basilea II» y su transposición europea: el proceso y la implementación,
Cristina Iglesias-Sarria y Fernando Vargas
Las Centrales de Riesgos: una herramienta para Basilea II,
Carlos Trucharte
Validación de enfoques IRB para el cálculo del capital mínimo por riesgo de crédito,
Gregorio Moral
Activos financieros en el exterior e indicadores de riesgo,
Raquel Lago y Jesús Saurina
Enfoque regulatorio en un mundo de riesgo no-cero,
Joseph Eyre
Capital regulatorio y capital económico: un análisis de sus determinantes,
Abel Elizalde y Rafael Repullo
Indicadores de riesgo a partir de los resultados contables de las empresas,
Sonia Ruano y Vicente Salas
La perspectiva económica en las normas de información financiera,
Jorge Pérez Ramírez
El Banco de España y la vigilancia de los sistemas de pago,
Banco de España
Evolución en España de las tarjetas como medio de pago (1996-2004),
Departamento de Sistemas de Pago del Banco de España
XBRL, una herramienta para la transparencia y reducción de la carga informativa.
Los trabajos de la Asociación XBRL España,
Manuel Ortega
La evolución del sistema bancario español desde la perspectiva de los Fondos de Garantía de Depósitos,
Isidro Fainé Casas
Análisis de la dispersión de los tipos de interés de los préstamos y depósitos bancarios,
Alfredo Martín Oliver, Vicente Salas Fumás y Jesús Saurina
Prociclicidad, volatilidad financiera y Basilea II,
Emiliano González Mota
El tratamiento del riesgo operacional en Basilea II,
M.ª Ángeles Nieto Giménez-Montesinos
El FSAP, un instrumento para la estabilidad y el desarrollo,
Ignacio Garrido
Aspectos críticos en la implantación y validación de modelos internos de riesgo de crédito,
Raúl García Baena, Luis González Mosquera y María Oroz García
Las implicaciones de Solvencia II en el sector asegurador español,
Ricardo Lozano Aragüés
Cooperación en materia de supervisión en la Unión Europea y el papel del Comité de Supervisores Bancarios
Europeos (CEBS),
Linette Field
Hedge funds y riesgo sistémico: una primera aproximación,
M.ª Nieves García Santos
Ciclo crediticio, riesgo de crédito y regulación prudencial,
Gabriel Jiménez y Jesús Saurina
Un modelo de análisis del riesgo de crédito y su aplicación para realizar una prueba de estrés del
sistema financiero mexicano,
Javier Márquez Díez-Canedo y Fabricio López-Gallo
Estimaciones de la EAD para contratos con límites de crédito explícito,
Gregorio Moral
Número 7 – noviembre 2004
Número 8 – mayo 2005
Número 9 – noviembre 2005
Número 10 – mayo 2006

BANCO DE ESPAÑA 144 ESTABILIDAD FINANCIERA, NÚM. 22
La posición relativa de la banca española en el contexto europeo,
Luis Gutiérrez de Rozas
El gobierno corporativo de las entidades emisoras de valores cotizados en mercados oficiales.
Un resumen del Informe Anual del ejercicio 2004,
Paulino García Suárez
Funciones y objetivos del Comité de Estabilidad Financiera (CESFI)
David Vegara
La responsabilidad de los administradores y directivos de las entidades de crédito
Jaime Herrero
Evaluación de las metodologías para medir el valor en riesgo
Clara I. González y Ricardo Gimeno
Medición efectiva del riesgo operacional
Santiago Carrillo Menéndez y Alberto Suárez
La aversión al riesgo en el mercado español de renta variable
Carlos L. Aparicio Roqueiro
Estructuras de titulización: características e implicaciones para el sistema financiero
Ramiro Losada López
La supervisión financiera: situación actual y temas para debate
Gonzalo Gil y Julio Segura
MiFID: un nuevo marco de competencia para los mercados de valores
M.ª Nieves García Santos
Las tarjetas de pago ante el proyecto SEPA: algunas reflexiones
Sergio Gorjón Rivas
Un nuevo marco de seguro de depósitos para España
Pablo Campos, Miguel Yagüe e Iker Chinchetru
El proceso de acumulación de reservas de divisas: posibles riesgos para la estabilidad financiera internacional
Enrique Alberola Ila y Santiago Fernández de Lis
Determinantes microeconómicos de la morosidad de la deuda bancaria en las empresas no financieras españolas
Sonia Ruano Pardo
La especialización de las entidades de depósito en el crédito a las empresas no financieras
Javier Delgado
Algunas cuestiones relevantes en el proceso internacional de convergencia contable: IASB vs. FASB
Carlos José Rodríguez García y Alejandra Bernad Herrera
La evolución de las operaciones de Leveraged Buy Out y su financiación: posibles implicaciones para la
estabilidad financiera
María-Cruz Manzano
El número de relaciones bancarias de empresas e individuos en España: 1984-2006
Gabriel Jiménez, Jesús Saurina y Robert Townsend
Dimensiones de la competencia en la industria bancaria de la Unión Europea
Santiago Carbó Valverde y Francisco Rodríguez Fernández
El proceso de apertura del sector bancario chino y el papel de la banca extranjera. Situación y perspectivas
Daniel Santabárbara García
La bancarización en Latinoamérica. Un desafío para los grupos bancarios españoles
José María Ruiz
Regulación e innovación en la reciente crisis financiera
Jaime Caruana
The financial turmoil of 2007-?: a preliminary assessment and some policy considerations
Claudio Borio
Número 11 – noviembre 2006
Número 12 – mayo 2007
Número 13 – noviembre 2007
Número 14 – mayo 2008

BANCO DE ESPAÑA 145 ESTABILIDAD FINANCIERA, NÚM. 22
Los déficits estructurales de liquidez y las tensiones en los mercados monetarios
Javier Alonso
Anatomy of a modern credit crisis
Ángel Ubide
La titulización de activos por parte de las entidades de crédito: el modelo español en el contexto internacional
y su tratamiento desde el punto de vista de la regulación prudencial
Eva Catarineu y Daniel Pérez
Comparación histórica de episodios de turbulencias financieras globales
Pedro del Río
De los modelos de banca y la función de riesgos
Francisco Sánchez Ferrero y Juan Andrés Yanes Luciani
Understanding credit derivatives
Abel Elizalde and Alberto Gallo
El papel del modelo de «originar para distribuir» en la crisis financiera de 2007
José María Roldán
La banca española ante la actual crisis financiera
José Antonio Álvarez
La crisis de liquidez de 2007: hacia un nuevo modelo de industria financiera
Manuel González Cid
Algunas implicaciones de la crisis financiera sobre la banca minorista española
Santiago Fernández de Lis y Alfonso García Mora
La nueva circular sobre solvencia de las entidades de crédito: contenido e impactyo sobre la labor supervisora
del Banco de España
Fernando Vargas y José María Lamamié
Estrategias de expansión de las entidades de depósito españolas. Una primera aproximación descriptiva
Javier Delgado, Jesús Saurina y Robert Townsend
Finanzas islámicas: desarrollo reciente y oportunidades
Alicia García-Herrero, Carola Moreno y Juan Solé
Procyclicality and financial regulation
Charles Goodhart
El carácter procíclico del sistema financiero
Jordi Gual
El informe del grupo de alto nivel sobre supervisión financiera en la UE - «el informe Larosière»
Linette Field, Daniel Pérez y José Pérez
El impacto de la circular de solvencia en las entidades financieras
Enrique Martín Barragán y Ángel Berges
Las prácticas de gobierno corporativo de las entidades bancarias cotizadas en España 2004-2007. Análisis
comparado con el Mercado Continuo
Rafael Crespí y Bartolomé Pascual
Formalismo judicial, control e incentivos en el concurso de acreedores
Estaban van Hemmen
Loan loss provisions in Spain. A working macroprudential tool
Jesús Saurina
Utilización de los sistemas IRB para el cálculo de provisiones anticíclicas
Juan Serrano
Can we enhance financial stability on a foundation of weak financial supervision?
John Palmer
Los instrumentos híbridos en los recursos propios de las entidades financieras: naturaleza y cambios tras
la crisis financiera
José Manuel Marqués Sevillano y Alicia Sanchis Arellano
Número 15 – noviembre 2008
Número 16 – mayo 2009
Número 17 – noviembre 2009

BANCO DE ESPAÑA 146 ESTABILIDAD FINANCIERA, NÚM. 22
¿Qué queda de la agenda «Legislar mejor»?
Isabel Argimón
La estructura del mercado interbancario y del riesgo de contagio en Colombia
Dairo Estrada y Paola Morales
Entidades financieras sistémicas: discusión de posibles medidas
Cristina Iglesias-Sarria y Fernando Vargas
Burden sharing for cross-border banks
Dirk Schoenmaker
Central bank independence and financial stability
Rosa M.ª Lastra
Las nuevas propuestas de Basilea en materia de riesgo de liquidez: de un enfoque cualitativo a un enfoque
cuantitativo
Beatriz M.ª Domingo Ortuño
Crisis financiera, mecanismos de apoyo a las entidades de crédito en dificultades y derecho de la competencia
Francisco Uría
Las nuevas medidas de Basilea III en materia de capital
Elena Rodríguez de Codes Elorriaga
Impacto macroeconómico del reforzamiento de los requisitos de capital y liquidez
Ángel Gavilán
Nuevos requerimientos de información sobre el mercado hipotecario: un análisis del loan to value
Carlos Trucharte Artigas
Fair value accounting in banks and the recent financial crisis
Silviu Glavan
Dodd-Frank Wall Street Reform: un cambio profundo en el sistema financiero de Estados Unidos
Emiliano González Mota y José Manuel Marqués Sevillano
Hong Kong’s international banking center: implications for Spain
Alicia García-Herrero
Recargos de capital en carteras crediticias concentradas en un número reducido de acreditados
Juan Serrano y Antonio Peñaranda
Cooperative and savings banks in Europe: nature, challenges and perspectives
Rebeca Anguren Martín and José Manuel Marqués Sevillano
Cuantificación de los beneficios de la regulación prudencial
Isabel Argimón y Manuel Mertel
El comportamiento de los ratings crediticios a lo largo del ciclo
Mario Deprés Polo
Non-enhanced debt financing by euro area banks under severe financial stress
Luna Romo González and Adrian van Rixtel
El impacto de los nuevos estándares de liquidez desde el punto de vista de un banco central
Liliana Toledo
Living wills
Thomas F. Huertas and Rosa M. Lastra
Towards more consistent, albeit diverse, risk-weighted assets across banks
Mayte Ledo
Los ejercicios de estrés test: experiencia reciente y reflexiones sobre su futuro
Daniel Pérez y Carlos Trucharte
Tipos de referencia de las imposiciones a plazo fijo en los mercados interbancario y de deuda pública
Carlos Pérez Montes
Número 18 – mayo 2010
Número 19 – noviembre 2010
Número 20 – mayo 2011
Número 21 – noviembre 2011

BANCO DE ESPAÑA 147 ESTABILIDAD FINANCIERA, NÚM. 22
Comparing risk-weighted assets: the importance of supervisory validation processes
José María Arroyo, Ignacio Colomer, Raúl García-Baena and Luis González-Mosquera
An overview of the independent commission on banking reforms – motivations, measures and likely impact
Alejandra Kindelán and Nick Greenwood
FSB transparency initiatives
Gerald A. Edwards Jr.
Hacia mercados secundarios de titulización líquidos y eficientes
Óscar Arce, Anna Ispierto y Rosario Martín
Business models of international banks in the wake of the 2007-2009 global financial crisis
Manuel Merck, Adrian van Rixtel and Emiliano González Mota
Identificación y evolución de los ciclos de crédito en las economías avanzadas
Rebeca Anguren Martín
Número 22 – mayo 2012


BANCO DE ESPAÑA 149 ESTABILIDAD FINANCIERA, NÚM. 22
ARTÍCULOS PUBLICADOS EN NOTAS DE ESTABILIDAD FINANCIERA
La provisión para insolvencias en las entidades de crédito. Presente, futuro y pasado
Rafael Prado
Debida diligencia con la clientela de los bancos
Comité de Supervisión Bancaria de Basilea
Las Cuarenta Recomendaciones
Grupo de Acción Financiera sobre el Blanqueo de Capitales
Directrices globales para la prevención del blanqueo de capitales en actividades de banca privada
Grupo Wolfsberg
El sistema financiero y el blanqueo de capitales
Ignacio Palicio Díaz-Faes
El modelo contable IASB. Análisis comparativo con la normativa de las entidades
de crédito españolas
Jorge Pérez Ramírez
Comunicación de la Comisión al Consejo y al Parlamento Europeo. La estrategia de la UE en materia
de información financiera: el camino a seguir
Reglamento de aplicación de las IAS en la UE, de 19 de julio de 2002, relativo
a la aplicación de Normas Internacionales de Contabilidad
Mejora de la transparencia bancaria. Información pública e información supervisora para fomentar sistemas
bancarios sólidos y seguros
Comité de Supervisión Bancaria de Basilea
Grupo de Trabajo Multidisciplinar para mejorar la Información Difundida
Impacto de la Circular Contable 4/2004 sobre el balance y la cuenta de pérdidas y ganancias de las entidades
de
depósito españolas
Daniel Pérez
El programa de evaluación del sector financiero del Fondo Monetario Internacional/Banco Mundial
Tomás J. T. Baliño
Preparación del FSAP en el Banco de España
Ignacio Garrido Sánchez
Evaluación del cumplimiento de los «Principios básicos para una supervisión bancaria efectiva»
Antonio Pancorbo de Rato
Transparencia en la supervisión bancaria española
Andrés García de la Riva
Evaluación del cumplimiento de estándares para sistemas de pago: principios básicos y transparencia de la vigilancia
Carlos Conesa Lareo
Análisis cuantitativo a través de las pruebas de resistencia
Roberto Blanco, Adolfo Rodríguez, Juan M. Ruiz y Carlos Trucharte
Normativa prudencial y estabilidad del sistema bancario español
Alfredo Martín Oliver y Jesús Saurina
Reflexiones finales sobre el Banco de España y el FSAP
José Viñals
Número 1 – septiembre 2001
Número 2 – noviembre 2002
Número 3 – julio 2003
Número 4 – mayo 2006
Número 5 – diciembre 2006


BANCO DE ESPAÑA 151 ESTABILIDAD FINANCIERA, NÚM. 22
PUBLICACIONES DEL BANCO DE ESPAÑA
Periódicos
Balanza de Pagos y Posición de Inversión Internacional de España (ediciones en español e inglés) (anual)
Billetaria (ediciones en español e inglés) (semestral)
Boletín Económico (mensual) (hay una versión en inglés de periodicidad trimestral)
Estabilidad Financiera (semestral)
Informe Anual (ediciones en español e inglés)
Informe de Estabilidad Financiera (ediciones en español e inglés) (semestral)
Memoria Anual sobre la Vigilancia de Sistemas de Pago
Memoria de Actividades de Investigación (ediciones en español e inglés) (anual)
Memoria de la Central de Información de Riesgos (anual)
Memoria de la Supervisión Bancaria en España (ediciones en español e inglés) (anual)
Memoria del Servicio de Reclamaciones (anual)
Mercado de Deuda Pública (anual)
No periódicos
Notas de Estabilidad Financiera
ESTUDIOS ECONÓMICOS
74 MARIO IZQUIERDO Y M.ª DE LOS LLANOS MATEA: Precios hedónicos para ordenadores personales en
España durante la década de los años noventa (2001). (Publicada una edición en inglés con el mismo número.)
75 PABLO HERNÁNDEZ DE COS: Empresa pública, privatización y eficiencia (2004).
76 FRANCISCO DE CASTRO FERNÁNDEZ: Una evaluación macroeconométrica de la política fiscal en
España (2005).
77 JUAN S. MORA-SANGUINETTI: The effect of institutions on European housing markets: An economic
analysis (2010).
ESTUDIOS DE HISTORIA ECONÓMICA
56 RAFAEL MORENO FERNÁNDEZ: El personal del Banco de España: desde su origen en el siglo XVIII hasta
fin del siglo XIX. Vol. 2: Banco de San Fernando (1829-1856) (2010).
57 FRANCISCO MANUEL PAREJO MORUNO: El negocio del corcho en España durante el siglo XX (2010).
58 PILAR NOGUES-MARCO: Tipos de cambio y tipos de interés en Cádiz en el siglo XVIII (1729-1788) (2011).
59 RAFAEL MORENO FERNÁNDEZ: El personal del Banco de España: desde su origen en el siglo XVIII hasta
fin del siglo XIX. Vol. 3: Banco de España (2011).
DOCUMENTOS DE TRABAJO
1214 JOSÉ MARÍA CASADO: Consumtion partial insurance of Spanish households.
1215 J. ANDRÉS, J. E. BOSCÁ Y J. FERRI: Household leverage and fiscal multipliers.
1216 JAMES COSTAIN Y BEATRIZ DE BLAS: The role of fiscal delegation in a monetary union: a survey of the
political economy issues. (De próxima publicación.)
1217 ARTURO MACÍAS Y MARIANO MATILLA-GARCÍA: Net energy analysis in a Ramsey-Hotelling growth model.
DOCUMENTOS OCASIONALES
1201 ELOÍSA ORTEGA Y JUAN PEÑALOSA: Claves de la crisis económica española y retos para crecer en la
UEM. (Publicada una versión inglesa con el mismo número.)
1202 MARÍA J. NIETO: What role, if any, can market discipline play in supporting macroprudential policy?
1203 CONCHA ARTOLA Y ENRIQUE GALÁN: Las huellas del futuro están en la web: construcción de indicadores
adelantados a partir de las búsquedas en Internet. (Publicada una versión inglesa con el mismo número.)
1204 JOSÉ LUIS MALO DE MOLINA: Luis Ángel Rojo en el Banco de España.
Estudios e informes
Nota: La relación completa de cada serie figura en el Catálogo de Publicaciones.
Todas las publicaciones del Banco de España se pueden descargar gratuitamente en formato electrónico en www.bde.es, con excepción
de Ediciones varias y Textos de la División de Formación y Selección.

BANCO DE ESPAÑA 152 ESTABILIDAD FINANCIERA, NÚM. 22
EDICIONES VARIAS1
JOSÉ LUIS MALO DE MOLINA, JOSÉ VIÑALS Y FERNANDO GUTIÉRREZ (Eds.): Monetary policy and inflation
in Spain (1998) (**).
VICTORIA PATXOT: Medio siglo del Registro de Bancos y Banqueros (1947-1997) (1999).
BANCO DE ESPAÑA (Ed.): Arquitectura y pintura del Consejo de la Reserva Federal (2000).
PABLO MARTÍN ACEÑA: El Servicio de Estudios del Banco de España (1930-2000) (2000).
TERESA TORTELLA: Una guía de fuentes sobre inversiones extranjeras en España (1780-1914) (2000).
VICTORIA PATXOT Y ENRIQUE GIMÉNEZ-ARNAU: Banqueros y bancos durante la vigencia de la Ley Cambó
(1922-1946) (2001).
BANCO DE ESPAÑA: El camino hacia el euro. El real, el escudo y la peseta (2001).
BANCO DE ESPAÑA: El Banco de España y la introducción del euro (2002).
BANCO DE ESPAÑA: Billetes españoles 1940-2001 (2004).
NIGEL GLENDINNING Y JOSÉ MIGUEL MEDRANO: Goya y el Banco Nacional de San Carlos (2005).
BANCO DE ESPAÑA. SERVICIO DE ESTUDIOS (Ed.): El análisis de la economía española (2005) (*).
(Ediciones en español e inglés.)
BANCO DE ESPAÑA: Billetes españoles 1874-1939 (2005). (Ediciones en español e inglés.)
BANCO DE ESPAÑA: 150 años de historia del Banco de España, 1856-2006 (2006).
(Ediciones en español e inglés.)
BANCO DE ESPAÑA. SECRETARÍA GENERAL: Legislación de Entidades de Crédito. 5.ª ed. (2006).
SANTIAGO FERNÁNDEZ DE LIS Y FERNANDO RESTOY (Eds.): Central banks in the 21st century (2006).
JUAN F. JIMENO (Ed.): Spain and the euro. The first ten years (2010).
TERESA TORTELLA: El Banco de España desde dentro. Una historia a través de sus documentos (2010).
JOSÉ LUIS MALO DE MOLINA Y PABLO MARTÍN ACEÑA (Eds.): Un siglo de historia del Sistema Financiero
Español (2011) (*).
Boletín de Operaciones (diario)
Boletín del Mercado de Deuda Pública (diario)
Boletín Estadístico (mensual2)
Central de Balances. Resultados anuales de las empresas no financieras (monografía anual)
Cuentas Financieras de la Economía Española (edición bilingüe: español e inglés) (series anuales y trimestrales3)
Circulares a entidades de crédito4
Circulares del Banco de España. Recopilación (cuatrimestral)
Registros de Entidades (anual)
BANCO DE ESPAÑA: Cálculo mercantil (con ejercicios resueltos).
PEDRO PEDRAJA GARCÍA: Contabilidad y análisis de balances en la banca (tomo I) (1999).
PEDRO PEDRAJA GARCÍA: Contabilidad y análisis de balances en la banca (tomo II) (1998).
JESÚS MARÍA RUIZ AMESTOY: Matemática financiera (2001).
UBALDO NIETO DE ALBA: Matemática financiera y cálculo bancario.
LUIS A. HERNANDO ARENAS: Tesorería en moneda extranjera.
PUBLICACIONES DEL BANCO CENTRAL EUROPEO
Informe Anual
Boletín Mensual
Otras publicaciones
Difusión estadística
Legislación financiera
y registros oficiales
Textos de División
de Formación y Selección
Unidad de Servicios Auxiliares
Alcalá, 48 - 28014 Madrid
Teléfono +34 91 338 6360. Fax +34 91 338 6488
Correo electrónico: [email protected]
www.bde.es
1 Las publicaciones de esta sección distribuidas por el Banco de España [todas, excepto las señaladas con (*) y (**), que son distribuidas,
respectivamente, por Alianza Editorial y Macmillan (Londres)] se encuentran descatalogadas.
2 Además, diariamente se actualiza en la sección de Estadísticas.
3 Además, se difunde en Internet una actualización trimestral de los cuadros de esta publicación.
4 Solo disponible en el sitio web del Banco de España hasta su incorporación a la publicación Circulares del Banco de España.
Recopilación.