establishment of rp-hplc and sds-page analytics of an
TRANSCRIPT

Master Thesis
Master of Science (M.Sc.)
___________________________________________________________________
Establishment of RP-HPLC and SDS-PAGE analytics
of an antiseptic peptide to investigate its elimination
on a model waste water plant
____________________________________________
Department of Biotechnology
Hamburg University of Applied Science
Submitted by
Silke Allers
Hamburg, 14 March 2018
1st referee: Prof. Dr. Jörg Andrä, Hamburg University of Applied Science
2nd referee: Prof. Dr. Gesine Cornelissen, Hamburg University of Applied Science

Danksagung
An dieser Stelle möchte ich mich zu aller erst bei Prof. Dr. Jörg Andrä für die
Bereitstellung des Themas und die Unterstützung während der Bearbeitung
bedanken. Vielen Dank für die vielen Freiheiten und das große Vertrauen bei der
praktischen Versuchsdurchführung.
Ich bedanke mich hiermit bei all denen, die mich während meines gesamten
Studiums und im Besonderen bei der Anfertigung dieser Masterarbeit begleitet,
unterstützt und motiviert haben.
Mein Dank geht an die Mitarbeiter der Labore Instrumentelle Analytik,
Verfahrenstechnik und Organische Chemie und Biochemie für die intensive
praktische Betreuung. Ohne sie wäre die Bearbeitung des Themas nicht möglich
gewesen. Mein besonderer Dank geht an Iris Ziehm für die große Unterstützung und
freundschaftliche Aufnahme in den Arbeitsalltag.
Besonders bedanken möchte ich mich auch bei meinen Kommilitonen für eine
abwechslungsreiche und entspannte Zeit. Danke auch an Jana Otte, Lukas Cordts
und Chris Harden für die Unterstützung und den Spaß.
Ein besonderer Dank geht an meine gesamte Familie. Vor allem an meinen Vater
und meinen Bruder die mich immer tatkräftig unterstützt haben.

Abstract
The use of antibiotics in the human health care leads to serious issues. Frequent
use and often misuse of antibiotics results in multi - resistant bacteria (Bérdy, 2012).
An incomplete degradation of the antibiotics in communal waste water plants
supports the development of resistances (Kårelid et al., 2017). Thus, it is not only
necessary to establish new ways of waste water purification to eliminate
pharmaceutical drugs but as well to find new drugs to overcome the problematic of
resistance. A promising approach is the development of peptide drugs.
The aim of this study was the characterization of the antiseptic peptide Aspidasept®.
For this purpose analytical methods such as the RP-HPLC and the SDS-PAGE were
established. Afterwards, the behavior of Aspidasept® on three stages of a lab scale
sewage plant was examined to investigate in the purification of local waste water
contaminated with pharmaceutical peptides. The adsorption on granulated activated
carbon at different conditions, the filtration performance and the behavior on the
biological stage were observed.
The characterization of the peptide showed the formation of dimers in aqueous
solutions. Both established methods were suitable for the analysis and showed
equal results. An antimicrobial activity was not observed. The adsorption on
granulated activated carbon showed no significant temperature dependent behavior.
With increasing activated carbon concentration the adsorption equilibrium
decreased. The adsorption behavior can be well described using the Freundlich-
Isotherm. For the adsoption in dem. water, the Freundlich parameters K = 0.187
[(µg/gGAC)/(µg/L)]n and n = 0.985 were obtained. For the filtration with a 1000 Da
nanofiltration membrane a retention of 100 % were achieved. The filtration results in
low recovery rates of the peptide (between 40 % and 85 %). The recovery is
depending on the ionic strength and the pH of the solution. The trials in synthetic
waste water showed a complete adsorption of the peptide onto the particles of the
waste water. A chemical recovery of the peptide from the particles was feasible. The
obtained results indicate that the purification of peptide contaminated waste water
with the described methods is possible.

_________________________________________________________________ IV
Contents
I ABBREVIATIONS ................................................................................................ VI
II SYMBOLS ......................................................................................................... VII
III APPENDIX INDEX ............................................................................................ VII
1 INTRODUCTION ................................................................................................... 1
2 THEORETICAL BACKGROUND .......................................................................... 3
2.1 Occurrence and toxicity of antibiotics ........................................................... 3
2.2 Peptides as pharmaceuticals .......................................................................... 4
2.3 Aspidasept® as antiseptic peptide .................................................................. 6
2.4 Methods for the elimination of pharmaceuticals ........................................... 8
2.4.1 Activated carbon adsorption in the waste water treatment ........................ 10
2.4.2 Membrane filtration .................................................................................... 13
2.5 Analysis with high performance liquid chromatography ........................... 15
3 MATERIALS AND METHODS ............................................................................ 18
3.1 Equipment ....................................................................................................... 18
3.2 Materials .......................................................................................................... 19
3.3 Chemicals ....................................................................................................... 19
3.4 Proteins and peptides .................................................................................... 20
3.5 Handling of Aspidasept®................................................................................ 21
3.6 Analytical Methods ......................................................................................... 22
3.6.1 Reversed-phase-HPLC .............................................................................. 22
3.6.2 Solid-phase extraction ............................................................................... 24
3.6.3 Tricine-SDS-PAGE .................................................................................... 26
3.6.4 Radial diffusion assay ................................................................................ 29
3.7 Peptide elimination on the model waste water treatment plant ................. 30
3.7.1 Activated carbon adsorption ...................................................................... 30
3.7.2 Membrane filtration .................................................................................... 34
3.7.3 Biological treatment ................................................................................... 38

_________________________________________________________________ V
4 RESULTS ........................................................................................................... 41
4.1 Characterization of the antiseptic peptide Aspidasept® ............................. 41
4.1.1 Verification of Aspidasept® by RP-HPLC ................................................... 41
4.1.2 Reference curve and level of detection on the RP-HPLC .......................... 44
4.1.3 Verification of Aspidasept® by Tricine-SDS-PAGE .................................... 47
4.1.4 Reference curve and level of detection on the Tricine-SDS-PAGE ........... 48
4.1.5 Recovery of Aspidasept® ........................................................................... 50
4.1.6 Verification of antimicrobial activity by radial diffusion assay ..................... 52
4.1.7 Sample concentration by solid-phase extraction ........................................ 53
4.2 Elimination of Aspidasept® by activated carbon adsorption ...................... 54
4.2.1 Adsorption in demineralized water at 10 °C ............................................... 54
4.2.2 Adsorption in demineralized water at 20 °C ............................................... 57
4.3 Membrane filtration ........................................................................................ 58
4.3.1 Membrane adsorption and buffer recovery of Aspidasept® ........................ 58
4.3.2 Cut-Off determination of UA60 membrane ................................................ 60
4.3.3 Aspidasept® filtration with UA60 membrane .............................................. 61
4.4 Biological treatment ....................................................................................... 65
4.4.1 Recovery test in particle free waste water ................................................. 65
4.4.2 Elimination in waste water ......................................................................... 67
5 DISCUSSION ...................................................................................................... 69
6 CONCLUSION AND OUTLOOK ......................................................................... 78
7 REFERENCES .................................................................................................... 80
APPENDIX .................................................................................................................. I

I Abbreviations _________________________________________________________________
_________________________________________________________________ VI
I Abbreviations
AMP Antimicrobial peptide
APS Ammonium per sulfate
CV Column volume
DMSO Dimethylsulfoxid
DTT Dithiothreitol
GAC Granulated activated carbon
LOD Level of detection
LPS Lipopolysaccharide
MIC Minimal inhibitory concentration
MW Molecular weight
PAC Powdered activated carbon
RDA Radial diffusion assay
RO Reverse osmosis
RP-HPLC Reversed-phase-high performance liquid chromatography
SDS-PAGE Sodium dodecyl sulfate polyacrylamide gel electrophoresis
SMX Sulfamethoxazole
SOP Standard operating procedure
SPE Solid-phase extraction
TEMED Tetramethylethylenediamine
TFA Trifluoroacetic acid
TMP Trimethoprim

II Symbols _________________________________________________________________
_________________________________________________________________ VII
II Symbols
Abfeed Absorbance of feed [AU]
Abper Absorbance of permeate [AU]
Abret Absorbance of retentate [AU]
c Concentration of the adsorbing substance [µg/L]
c0 Start concentration of adsorbing substance [µg/L]
ceq Equilibrium concentration of adsorbing substance [µg/L]
K Isotherm-parameter [(µg/gGAC)/(µg/L)]n
m Adsorbent mass [g]
mGAC Granulated activated carbon mass [g]
n Isotherm-parameter [-]
q Loading of the adsorbent [µg/g]
qeq Loading of adsorbents at equilibrium [µg/g]
R Recovery [%]
T Temperature [°C]
VL Experimental volume [L]
III Appendix index
A Figure index ........................................................................................................... i
B Table index ............................................................................................................ i
C Radial diffusion assay – Results ........................................................................... ii

1 Introduction _________________________________________________________________
_________________________________________________________________ 1
1 Introduction
Sepsis is one of the leading causes of death worldwide. In Germany, with 154,000
infections and 54,000 deaths annually, it is the third often deaths cause (Deutsche
Sepsis-Hilfe, 2004). Thus, it results more often in death than colon cancer, breast
cancer and AIDS (Deutsche Sepsis-Hilfe, 2004). With an estimated amount of
approx. 800,000 infections per year in the United States it will increase to 1,600,000
infections by 2050 (Kumar, 2014). For the treatment of sepsis no specific drug is
available (Brandenburg and Schürholz, 2015). In most cases the first therapeutic
approach is the treatment of the bacterial infections which otherwise will result in
sepsis. Commonly, antibiotics are used as therapy. However, this approach fails
more often due to a developing resistance of bacteria against conventional antibiotic
(Brandenburg and Schürholz, 2015). To overcome the crucial issue of sepsis
treatment and the problematic of bacterial resistance, new approaches are required.
The first approach is to stop the progress of new bacterial resistance. These
resistances are developed due to the fact that bacteria are not only coming in
contact with antibiotics if they are used for a therapeutic issue but also in the whole
environment. The way of antibiotics leads from the patient (or animal farm and other
industries) to the waste water treatment plants. With the conventional 3-stage
treatment methods a complete degradation of the antibiotics is not achievable. New
methods for the waste water purification are required.
Investigations in methods for a 4th stage such as activated carbon, ozonation, the
removal with ferrate, advanced oxidation processes or nanofiltrations were made.
Some of these methods made their way from the research to the economic
application in local waste water plants (KOMS, 2018). The adsorption of micro-
pollutants pharmaceuticals on activated carbon is already implemented in a lot of
German waste water plants. But as well the realization of the ozonation is planned in
some treatement plants.
Nevertheless, even though a complete degradation of antibiotics is possible, the
treatment of sepsis and the increasing number of multi-resistant bacteria is still an
issue to be discussed. New pharmaceuticals, not only new antibiotics, could be the

1 Introduction _________________________________________________________________
_________________________________________________________________ 2
answer. Substances with a great opportunity are antimicrobial peptides. These show
trends of a high therapeutic index and a low tendency of bacterial resistance
(Brandenburg and Schürholz, 2015). The substance Aspidasept® belongs to the
class of antimicrobial peptides. Aspidasept® shows as well an effect against septic
shock. By binding free lipopolysaccharides which normally would cause an
increased immune response a sepsis is prevented (Brandenburg and Schürholz,
2015). Even if Aspidasept® shows a great possibility as pharmaceutical, the
elimination after the usage as drug has to be examined to exclude negative effects
on the environment.
The aim of this study was the establishment of RP-HPLC and SDS-PAGE analytics
of the antiseptic peptide Aspidasept®. The developed methods were used for the
investigation of stability and behavior in various environments. For the concentration
of samples the solid phase extraction should be examined. An antimicrobial activity
was evaluated with the radial diffusion assay. After characterization, the antiseptic
peptide was used for an investigation of elimination on a model waste water plant.
The adsorption on granulated activated carbon (GAC) with variation in temperature
and GAC amount was examined. With the obtained data the Freundlich-Isotherm
was determined to decide about the economic efficiency. Furthermore, the behavior
of Aspidasept® during filtration and on the biological stage of the waste water plant
was investigated.

2 Theoretical background _________________________________________________________________
_________________________________________________________________ 3
2 Theoretical background
2.1 Occurrence and toxicity of antibiotics
There are various ways antibiotics get into the environment (Wang et al., 2007).
Beside the human health care where antibiotics get into waste water by human
excretion or by the waste of hospitals and pharmaceutical industries, agriculture and
livestock farming are the major ways (Wang et al. 2007; Hollis and Ahmed, 2013).
Farm animals were treated with antibiotics to increase growth and health
(Stephenson, 2001; Hollis and Ahmed, 2013). Only parts of the antibiotics were
metabolized (Ebert et al, 2014). The excrements of the animals were distributed on
field and heavy rain leads to a wash out. Thereby, the antibiotics get into surface
water which leads to an entrance into ground and drinking water. A direct entry into
the surface water is the treatment of fishes in aquacultures (Hollis and Ahmed, 2013).
In the USA more than 80 % of the used antibiotics were consumed in the agriculture
and aquaculture to increase the food production (Hollis and Ahmed, 2013).
Figure 2.1: Annual amount [kg] of antibiotics used in the USA. Approx. 80 % of antibiotics are
used in the agriculture (crops and animals) and aquaculture. Only 20 % of antibiotics are used in the
human health care (Modified from Hollis and Ahmed, 2013).

2 Theoretical background _________________________________________________________________
_________________________________________________________________ 4
The above specified circumstances indicate that annually several tons of antibiotics
get into the environment, mostly in the aquatic surrounding. Two specific
occurrences can be defined. The direct leads trough agriculture and aquaculture. In
the indirect antibiotics are treated in local waste water plants (Ebert et al., 2014).
The release of antibiotics into the environment results in antibiotic resistance in
bacteria (Kumar et al., 2012). Resistant bacteria show a better chance of survival
which increases the pressure on bacteria to develop these resistances.
Three main mechanisms can be defined to explain the impact of antibiotics on the
human health (Chang et al., 2014). The first one is the direct infection with resistant
bacteria coming from an animal without further spreading of the pathogen. A second
mechanism can be described by an infection of a human and an ongoing
transmission to other humans (Hollis and Ahmed, 2013; Chang et al., 2014). In this
scenario only some of the human will get ill. As maybe most important and most
difficult to study the third mechanism can be named. The mechanism described the
transfer of resistance genes coming from animal farms into human pathogens
(Chang et al., 2014). This horizontal gene transfer between the species is difficult to
trace. A rising number of antibiotic resistant bacteria lead to an increase of problems
in the human health care.
2.2 Peptides as pharmaceuticals
To overcome the dramatic developments in the human health care caused by
increasing resistances against established antibiotics and a lack of new
pharmaceuticals, an advanced research in novel drugs is in urgent need (Bérdy,
2012). Part of a solution of this concern in healthcare can be substances from plant,
animal or microbial origin. Until today, more than 1 million natural compounds are
discovered (Bérdy, 2005). Among them, only 5 % of the substances have been
obtained from microbes. From all discovered natural compounds 20 – 25 % were
identified as substances with biological activity. Only 10 % of the biological active
substances are coming from a microbe origin (Demain and Sanchez, 2009).

2 Theoretical background _________________________________________________________________
_________________________________________________________________ 5
Beneath compounds from natural origin, synthetic, chemically produced substances
are under research or rather on the market.
Some of these natural or synthetic compounds with a great potential to stop the
antibiotic crisis are antimicrobial peptides (AMPs). These peptides can be found in
all living kingdoms as a product of the innate immune system (Mangoni et al., 2016).
AMPs show various favorable effects suitable for the usage in the human healthcare
system. The small peptides (generally 10 to 50 amino acids) were first recognized
for their antimicrobial activity (Mangoni and Shai, 2011). Most AMPs share a majority
of basic residues resulting in a cationic charge and an amphipathic structure in
membrane-mimicking environments (Mangoni and Shai, 2011). With their simple
secondary structure of α – helices, β – sheets and extended structures AMPs are
considered as very stable in terms of heat treatments and other denaturation effects.
The cationic structure helps to interact and unspecifically bind to the anionic
phospholipids of cell membranes. This binding leads to the formation of pores and
the destruction of the cell (Brogden, 2005). Due to this unspecific mode of action,
microbes are rather unlikely to evolve resistances as it is when it comes to antibiotic
targeting enzymatic receptors (Hale and Hancock, 2014; Fjell et al., 2011).
But, beside an antimicrobial activity of the AMPs various other effects were
discovered showing a great opportunity for new pharmaceuticals for e.g. wound
healing (Mangoni et al., 2016). Additionally to the wound healing some peptides
have antiviral (e.g. anti-HIV) or anticancer properties (Wang et al., 2016). The
synthesis of collagen, cytokine release, angiogenesis, chemotaxis, cell migration
and proliferation and lipopolysaccharide (LPS) neutralization are known as favorable
effects for wound healing (see figure 2.2).

2 Theoretical background _________________________________________________________________
_________________________________________________________________ 6
Figure 2.2: Schematic representation of the spectrum of activity of antimicrobial and
antiseptic peptides relating to wound healing. The effect of AMPs includes an antimicrobial
activity, LPS neutralization (sepsis prevention), cell migration and activation, chemotaxis,
angiogenesis/ neovascularization, cytokine release/ cell degranulation and synthesis of collagen.
(Mangoni et al., 2016)
2.3 Aspidasept® as antiseptic peptide
A promising approach for an alternative of antibiotics shows the peptide Aspidasept®
(Pep19-2.5). Aspidasept® was developed based on the anti-LPS factor of the
horseshoe crab (Limulus) (Gutsmann et al., 2010). The synthetic peptide consists of
20 amino acids with a total molecule weight of 2711.3 Da. The detailed amino acid
sequence is showed in table 2.1.
Table 2.1: Amino acid sequence of the antiseptic peptide Aspidasept®
(Pep19-2.5). Symbols: G – Glycine, C – Cysteine, K – Lysine, Y – Tyrosine, R
– Arginine, F – Phenylalanine, W – Tryptophan (Gutsmann et al., 2010).
Peptide Amino acid sequence
Aspidasept® (Pep19-2.5) GCKKY RRFRW KFKGK FWFWG

2 Theoretical background _________________________________________________________________
_________________________________________________________________ 7
Aspidasept® consists of a high degree of polar and positive charged amino acids
with hydrophobic residues resulting in an amphipathic character (Gutsmann et al.,
2010). It was initially developed as a drug against bacterial infections and
inflammations. The peptide is supposed to bind and neutralize the lipid – A part of
the LPS of gram-negative bacteria (Brandenburg and Schürholz, 2015). But as well
an effect on gram-positive bacteria was discovered (Schürholz et al., 2013). In
various trials the peptide showed an antibacterial effect against gram-negative
bacteria (e.g. Escherichia coli, Pseudomonas aeruginosa) and gram-positive
bacteria (e.g. multi-resistance Staphylococcus aureus) (Gutsmann et al., 2010;
Pfalzgraff et al., 2016). In table 2.2 some minimal inhibitory concentrations (MIC) for
Aspidasept® can be found. Aspidasept® indicates an inhibitory effect on the
production of the LPS-induced tumor-necrosis-factor-α (Gutsmann et al., 2010;
Heinbockel et al., 2015).
Table 2.2: Minimal inhibitory concentration (MIC) of Aspidasept®. (Kaconis, 2013)
Bacteria strain MIC [µg/mL]
Escherichia coli WBB01 32
Salmonella enterica serovar Minnesota R60 128
The peptide accentuates from the others by showing an impact against sepsis
(Brandenburg and Schürholz, 2015). Figure 2.3 displays a schematic view how the
peptide can prevent a septic shock. Free LPS from gram-negative bacteria can bind
to the toll-like receptor 4 (TLR4) of immune cells (Peri et al., 2010; Brandenburg and
Schürholz, 2015). These cells respond in an over-productive manner with a cytokine
release which leads to sepsis and often death. If Aspidasept® is present, free LPS
are neutralized and a lower cytokine release results in a normal immune responds.
Experience in rats showed that the necessary drug concentration for the treatment
against sepsis is far below the critical value at which side effect are possible
(Brandenburg and Schürholz, 2015).

2 Theoretical background _________________________________________________________________
_________________________________________________________________ 8
Figure 2.3: Schematic view on the immune response without and in the presence of
Aspidasept®. The top drawing shows how LPS induce an exaggerated cytokine response resulting in
a sepsis. Below, the effect of the LPS neutralizing peptide is shown (Brandenburg and Schürholz,
2015).
2.4 Methods for the elimination of pharmaceuticals
The sewage of households and industry is purified in waste water plants. In different
stages, the sewage is cleared from dirt, nitrate, phosphoric substances and other
compounds. But some pollutants, which show a negative effect on the aqueous life
and human existence, cannot be removed with the old established technology of a
3-stage waste water plant (Eisenächer and Neumann, 1982). The conventional 3-
stage waste water plant consists of mechanical, biological and chemical treatment
methods. During the mechanical treatment gross contaminations such as stones,

2 Theoretical background _________________________________________________________________
_________________________________________________________________ 9
leaves, dead animals, glass splinters and sand are removed. The following primary
clarifier is used for the separation of undissolved materials and paper. The biological
treatment consists of a two-step mechanism. During the aerobic treatment
(nitrification) bacteria and protozoa (activated sludge) transform ammonium-
nitrogen-compounds to nitrate-nitrogen. In the following anaerobic treatment, these
compounds are transformed to gaseous nitrogen and oxygen. The activated sludge
is removed from the waste water by sedimentation. In a final step chemical
treatment with floatation agents and disinfectants (optional) is performed.
Figure 2.4: Typically 3-stage waste water treatment plant. 1st stage: mechanical treatment to
remove gross soiling. 2nd
stage: biological treatment for the degradation of carbon-nitrate-compounds.
3rd
stage: chemically treatment with flocculating agents. The 3rd
stage varies depending on the
treatment plant. (Modified from Gezawa, 2014)
Despite the established methods for sewage clearance, it cannot be ensured to
remove several compounds such as hormones, antibiotics and pesticides. These
substances show an adverse impact on the environment. Hormones can damage
the reproduction of aqueous life (Parry, 2012) and antibiotics will support the
generation of multi-resistance bacteria. Thus, a 4th treatment step is necessary.
Mechanical Biological Chemical

2 Theoretical background _________________________________________________________________
_________________________________________________________________ 10
Different approaches were made and some were implemented so far. The
adsorption of micro-pollutants on granulated activated carbon (Germany) or
powdered activated carbon (Switzerland) is used in several plants (KOMS, 2018).
But as well the ozonation, the removal with ferrate, advanced oxidation processes or
a nanofiltration step are planned. Although these processes promise adequate
results, they are still not implemented in many waste water treatment plant due to
increasing costs.
2.4.1 Activated carbon adsorption in the waste water treatment
Adsorption is defined as accumulation and binding of a substance (adsorbing
molecule) in liquid onto the surface of a second liquid or a solid material – the
adsorbents (Lohrengel, 2012; Worch, 2012). The surface of the adsorbents is
significant for the adsorption. The larger the surface the more substance can be
adsorbed. Thus, highly porous adsorbents with a large inner surface are beneficial
(Worch, 2012).
For the usage of activated carbon in an adsorption experiment, it is required to
consider various parameters (Lohrengel, 2012; Worch, 2012). The increase of the
adsorbing molecule leads to an increase of the adsorption. With an increase of the
inner surface of the adsorbents the adsorption will increases as well. The adsorption
will decrease with increasing temperature. It was observed as well that with
increasing polarity of the adsorbing molecule the adsorption decreases.
Beside the simple determination of adsorption equilibriums, the examination of
adsorption dynamics and adsorption kinetics are necessary to draw conclusion
regarding the economic efficiency of a process (Worch, 2012). Adsorption
equilibriums and adsorption kinetics are required for the characterization of the
adsoption dynamics. The adsorption kinetic describes the time course of the process.
This course is dependent on the transport of the adsorbing substance to the
hydrodynamic interface and the transport trough the interface to the outer surface of
the adsorbent. The transport to the inner surface of the adsorbents and the
adsorption in itself is following. Therefore, the adsorption speed is subordinate to the
diffusion processes at the outer and inner surfaces of the adsorbents. It should be
2 Theoretical background _________________________________________________________________
_________________________________________________________________ 11
pointed out that with decrease of the adsorbents size the adsorption equilibrium is
obtained faster.
The adsorption equilibrium describes the equilibrium between substance in solution
and adsorbed substance. At this time point a saturation of the adsorbents takes
place and maximal loading concentration can be determined. If the adsorption
process is performed at a constant temperature the following isotherm can be used
for the specification.
( ) (Equation 2.1)
qeq Loading of adsorbents at equilibrium [µg/g]
ceq Concentration at equilibrium [µg/L]
T Temperature [°C]
Even through different isotherms are present, during this trial the Freundlich-
Isotherm was used for the evaluation of the obtained data. The Freundlich-Isotherm
is often used for the description of adsorptions in liquid and on activated carbon
(Benström, 2017). Even through isotherms cannot be used to determine an exact
adsorption capacity; estimations can be made if only one adsorbing substance is
present. The loading of the adsorbents at equilibrium qeq can be determined with
equation 2.2 assuming that no other adsorption processes (e.g. adsorption on
experimental setup or evaporation) are present.
) (Equation 2.2)
VL Experimental volume [L]
m Adsorbent mass [g]
c0 Start concentration of adsorbing substance [µg/L]
ceq Equilibrium concentration of adsorbing substance [µg/L]
Using the Freundlich-Isotherm (equation 2.3), the loading of the adsorbents can be
described. The isotherm-parameter K describes the affinity of an adsorption process;
n is a measure for the curve of an isotherm (Worch, 2012). If the parameter n = 1,

2 Theoretical background _________________________________________________________________
_________________________________________________________________ 12
the isotherm is linear and the loading of the adsorbent is proportional to the
concentration of the adsorbing substance. For n < 1 the mass of the adsorbent can
normally be reduced. If n > 1, the process is not beneficial, only small loadings are
possible (Lohrengel, 2012).
(Equation 2.3)
q Loading of the adsorbent [µg/g]
K Isotherm-parameter [µg/g]n
c Concentration of the adsorbing substance [µg/L]
n Isotherm-parameter [-]
Figure 2.5: Schematic drawing of the Freundlich-Isotherm with different values of n. ceq -
loading of adsorbents at equilibrium, ceq – concentration during equilibrium (modified from Arnold,
2017).
The use of activated carbon adsorption in local waste water plants has been
demonstrated as suitable and economically efficient (Kårelid et al., 2017). If
activated carbon should be used as a 4th sage first it has to be decided between
granulated activated carbon (GAC) and powdered activated carbon (PAC). Both
technologies are used in German waste water plants (GAC: e.g. Westerheim, PAC:
e.g. Mannheim, Ulm). In the following the waste water treatment with GAC is
characterized. In this case, the treatment takes place in packed bed adsorbers with
GAC particles sizes between 0.5 and 4 mm (KOMS, 2018). After biological treatment

2 Theoretical background _________________________________________________________________
_________________________________________________________________ 13
and secondary clarification the GAC technology is following directly (figure 2.6). For
the determination of the adsorption capacity the above made descriptions can be
made. Nonetheless, it has to be mentioned that the waste water has a significant
impact on the adsorption of micro-pollutants (hormones and antibiotics) at activated
carbon (Worch, 2012).
pre-treatedwaste water
activated sludge tank
return
GAC-filtersecondary clarification
recirculated sludge
sludge
Figure 2.6: Treatment with granulated activated carbon (GAC). After biological degradation and
secondary clarification, the adsorption with GAC is performed (modified from KOMS, 2018).
2.4.2 Membrane filtration
A membrane is a flat, permeable structure (Melin and Rautenbach, 2007). Whereas,
only flat filter sheets were available in the past, nowadays membranes packed in
various modules (e.g. wound module, or hollow fibers) are more often used. The
filtration is a pressure driven, mechanical procedure which aims the clarification or
separation of a mixture such as suspensions or aerosols (Melin and Rautenbach,
2007). A filter can be consists out of paper, metal, glass, synthetic material or textile
fabric. In biotechnology mostly synthetic materials such as polyethersulfone,
cellulose acetate or polyamide are used. The use of different materials leads to
changing product membrane interactions. Polyethersulfone for example is
hydrophobic which supports the adsorption of particles onto the membrane
(Ohlrogge and Ebert, 2006).
During filtration not only particles larger than the membrane pores were separated
because they cannot enter the pores. Retention of particles smaller than the pores
will be achieved due to electrostatic interactions, particle inertia, diffusion effects or
barrier effect (Melin and Rautenbach, 2007). The filtered phase is defined as

2 Theoretical background _________________________________________________________________
_________________________________________________________________ 14
permeate. The retained phase is called retentate or filtrate. Two different filtration
procedures have to be considered. The static dead-end filtration and the dynamic
cross-flow filtration (figure 2.7). In case of the dead-end filtration (b) a forming filter
cake leads to a blocking of the pore (fouling of the membrane) and an often high
product loss (El-Safty and Hoa, 2012). To maintain a high flow the filtration has to be
stopped and the membrane has to be cleaned or exchanged. During cross-flow
filtration (a) no complete filter cake is formed because the feed passes the
membrane with a high horizontal speed (Melin and Rautenbach, 2007). During this
work a modified cross-flow filtration was used. The flow along the membrane was
simulated by a magnetic stirrer.
Figure 2.7: Two procedures for the membrane filtration: Cross-flow filtration and dead-end
filtration. (a) The cross-flow filtration is a dynamic procedure with a horizontal flow over the
membrane. (b) The dead-end filtration is static. Over the time a filter cake is forming and the
membrane has to be cleaned or exchanged. (El-Safty and Hoa, 2012)
By varying the pore size of membranes the recovery of a membrane can be
influenced. With the smallest pore size, reverse osmosis (RO) membranes have to
be named. Particles have to be smaller than 1 nm to pass the membrane (Melin and
Rautenbach, 2007). A RO membrane is able to recover nearly all in water dissolved
substances. Nanofiltration membrane can be used for the separation of ions and
2 Theoretical background _________________________________________________________________
_________________________________________________________________ 15
molecules in the molecule weight range of 200 – 2,000 Da (Basile and Charcosset,
2016). Ultrafiltration membranes usually recover particles with a molecular weight of
300 to 1,000,000 Da used for the separation of polymers, biomolecules and colloidal
particles (Basile and Charcosset, 2016). The largest pore size for ultrafiltration
membranes is around 0.1 µm (Melin and Rautenbach, 2007). With a pore size range
between 0.1 – 1.0 µm a microfiltration is possible if macromolecules, colloids or
suspended particles should be concentrated or separated (Basile and Charcosset,
2016).
To specify the membrane separation capacity, the Cut-Off is determined. The Cut-
Off describes the size range were 90 % of particles with a specific molecular weight
are retained (Melin and Rautenbach, 2007).
2.5 Analysis with high performance liquid chromatography
The possibility to separate mixtures with a high quantity of similar analytes is the
central and required function of an efficient chromatographic separation technique
(Kromidas, 2014; Meyer, 2009). A chromatography provides detailed information
about the quality and quantity of a mixture or single analyte. The elution or retention
time is characteristic for any substance. The area of an analyte peak is proportional
to the quantity of a substance (Kromidas, 2014). Thus, a chromatography method
can be used for the quantification and qualification of a single substance or a
mixture of substances.
At a normal setup for the stationary phase of the chromatographic column a polar
material (e.g. silica gel) is used. Consequently the mobile phase is nonpolar. A
separation of mixtures is achieved by a differential adsoption of substances. In this
case, nonpolar substance elutes earlier than polar substances (Meyer, 2009).
Various separation mechanisms are possible, such as the attraction by van der
Waals forces, ion exchange or affinity forces (Kromidas, validation guide). A second
chromatographic approach is the reverse phase (RP) – stationary phase. The
stationary phase consists of a nonpolar material (e.g. alkyl chains with various
lengths) which is covalently bond to packing material (Ahuja, 1999). For the mobile
phase a relatively polar solvent is used. The following principle applies: A nonpolar

2 Theoretical background _________________________________________________________________
_________________________________________________________________ 16
solvent (e.g. acetonitrile) elutes faster than polar solvents (e.g. water) and a lower
retention time (time from injection to detection) is achieved, this also results in the
fact that the more polar a substance is the faster the elution takes place (Meyer,
2009).
Since the 1970s, the high performance liquid chromatography (HPLC) is known as a
technique which promises the above made specifications. Nowadays, it is the
dominating chromatographic method (Lundanes et al., 2013). Specific for the HPLC
technique is the high pressure necessary to overcome the back-pressure of the
small particles (less than 10 µm) of the stationary phase (Kaltenböck, 2008). A high
pressure pump (up to 600 bar) is required to move the mobile phase. A typical HPLC
instrument (see figure 2.8) consists of high pressure pumps with gradient unit (for
the mixing of different solvents) and optional degasser, an autosampler and a
column oven (Meyer, 2009). For the detection classical UV-detectors or diode array
detectors (DAD) but as well fluorescence detectors can be used. The organizer,
typically on top of the system, is used for the storage of solvents. The HPLC
instrument is coupled to an evaluation software. A possible step for further
processing of the HPLC separation is the coupling of the instrument with a mass
spectrometer (LC-MS) (Kromidas, 2014).
During this study a HPLC from HITACHI with a RP-column were used. In chapter
3.6.1 the precise specifications of the used system with column and analytical
software are explained.

2 Theoretical background _________________________________________________________________
_________________________________________________________________ 17
Organizer
Diode Array Detector
Column Oven
Autosampler
Pumps with gradient unit and degasser
Evaluation software
Figure 2.8: Typical assembly of a HPLC instrument. The instrument consists of high pressure
pumps with gradient unit and degasser, an autosampler, a column oven, the organizer for the storage
of the mobile phase and evaluation software (modified from manufacturer specifications, HITACHI).

3 Materials and Methods _________________________________________________________________
_________________________________________________________________ 18
3 Materials and Methods
3.1 Equipment
In table 3.1, the, during this study used equipment is listed. The, for the radial
diffusion assay (RDA) necessary equipment can be found in the appropriate SOP.
Table 3.1: List of used equipment
Equipment Vendor
Ultrapure water arium® pro UV Sartorius
Balance 770-60 Kern
Balance BP 221S Sartorius
Balance BP 3100S Sartorius
Balance Entris 321I-1S Sartorius
Centrifuge minispin Eppendorf
Conductivity meter Cond 3310 WTW
Flat filter holder for pressure filtration MMS membrane systems
Heating Block AccuBlock Digital Dry Bath Labnet
HPLC Primaide Hitachi
Laboratory waste treatment system KLD4N/SR Behr Labor-Technik
Magnetic stirrer MR Hei-Standard Heidolph
pH-meter 766 Calimatic Knick
Pipette Transferpette® S (10 µL/ 100 µL/ 200 µL/ 1000 µL)
Brand
Pump (vacuum) KnF Lab Laboport
Rocking Platform VWR
SDS-PAGE PowerPac Basic BIO RAD
Shaked water bath with cooling unit GFL
Shaker Reaxtop Heidolph
Spectrometer Ultrospec 2100pro Amersham Biosciences

3 Materials and Methods _________________________________________________________________
_________________________________________________________________ 19
3.2 Materials
In table 3.2, the used materials for the development of the chromatographic
method and the performance of the SDS-PAGE are listed. As well all materials,
which were required for the experiments, are listed. The, for the RDA necessary
materials and chemicals can be found in the appropriate SOP.
Table 3.2: List of used materials
Materials Vendor
Beakers Schott/ KIMAX
C18 ec SPE cartridge (chromabond®) Macherey-Nagel
Cellulose nitrate filter (0.45 µm) Sartorius
Falcon Tubes (15 mL/ 50 mL) VWR
Flat filter membrane: TRISEP® UA60 MICRODYN-NADIR
Flat filter membrane: XLE, NF90, NF270 DOW
Glass bottles 25 mL Schott
Glass bottles (pressure stable) 500 mL/ 1 L Schott
Graduated cylinders Brand
Granulated activated carbon (Hydraffin AR 8x30) Donau Carbon
HPLC glass vials (300 µL/ 1,5 mL with micro inlay) Thermo Scientific/ VWR
Magnetic stirrer -
Pipette tips (10 µL / 200 µL/ 1000 µL) Brand
Reaction vessel 1.5 mL/ 2 mL Eppendorf
Scoop -
Syringe filters (0.45 µm) VWR
Syringe Henke Sass Wolf
Weighing bowls -
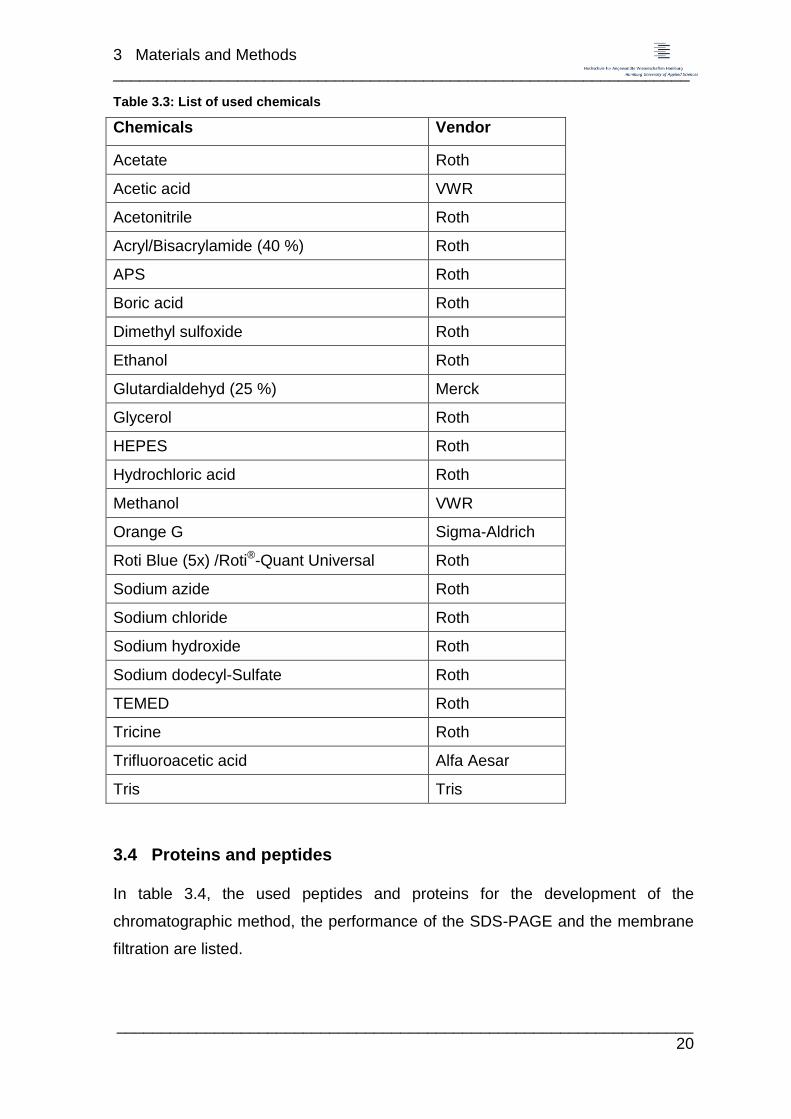
3.3 Chemicals
In table 3.3, the used chemicals for the development of the chromatographic
method and the performance of the SDS-PAGE are listed. The, for the RDA
necessary materials and chemicals can be found in the appropriate SOP.
3 Materials and Methods _________________________________________________________________
_________________________________________________________________ 20
Table 3.3: List of used chemicals
Chemicals Vendor
Acetate Roth
Acetic acid VWR
Acetonitrile Roth
Acryl/Bisacrylamide (40 %) Roth
APS Roth
Boric acid Roth
Dimethyl sulfoxide Roth
Ethanol Roth
Glutardialdehyd (25 %) Merck
Glycerol Roth
HEPES Roth
Hydrochloric acid Roth
Methanol VWR
Orange G Sigma-Aldrich
Roti Blue (5x) /Roti®-Quant Universal Roth
Sodium azide Roth
Sodium chloride Roth
Sodium hydroxide Roth
Sodium dodecyl-Sulfate Roth
TEMED Roth
Tricine Roth
Trifluoroacetic acid Alfa Aesar
Tris Tris
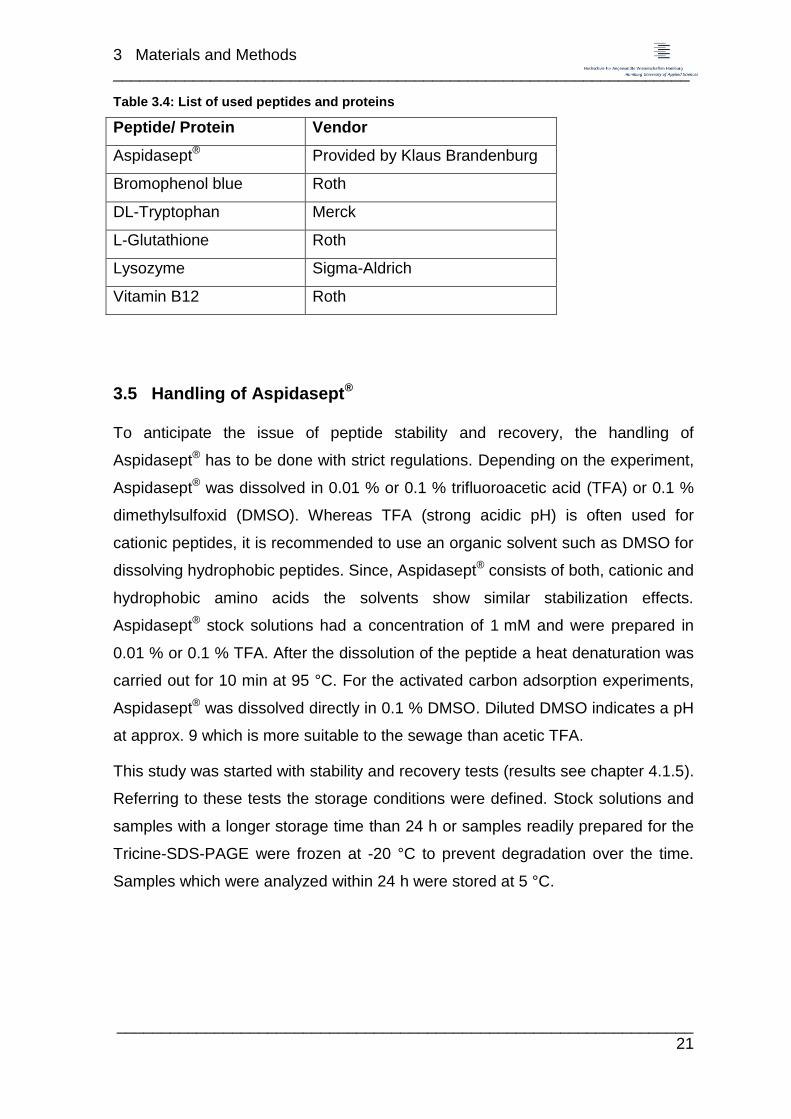
3.4 Proteins and peptides
In table 3.4, the used peptides and proteins for the development of the
chromatographic method, the performance of the SDS-PAGE and the membrane
filtration are listed.
3 Materials and Methods _________________________________________________________________
_________________________________________________________________ 21
Table 3.4: List of used peptides and proteins
Peptide/ Protein Vendor
Aspidasept® Provided by Klaus Brandenburg
Bromophenol blue Roth
DL-Tryptophan Merck
L-Glutathione Roth
Lysozyme Sigma-Aldrich
Vitamin B12 Roth
3.5 Handling of Aspidasept®
To anticipate the issue of peptide stability and recovery, the handling of
Aspidasept® has to be done with strict regulations. Depending on the experiment,
Aspidasept® was dissolved in 0.01 % or 0.1 % trifluoroacetic acid (TFA) or 0.1 %
dimethylsulfoxid (DMSO). Whereas TFA (strong acidic pH) is often used for
cationic peptides, it is recommended to use an organic solvent such as DMSO for
dissolving hydrophobic peptides. Since, Aspidasept® consists of both, cationic and
hydrophobic amino acids the solvents show similar stabilization effects.
Aspidasept® stock solutions had a concentration of 1 mM and were prepared in
0.01 % or 0.1 % TFA. After the dissolution of the peptide a heat denaturation was
carried out for 10 min at 95 °C. For the activated carbon adsorption experiments,
Aspidasept® was dissolved directly in 0.1 % DMSO. Diluted DMSO indicates a pH
at approx. 9 which is more suitable to the sewage than acetic TFA.
This study was started with stability and recovery tests (results see chapter 4.1.5).
Referring to these tests the storage conditions were defined. Stock solutions and
samples with a longer storage time than 24 h or samples readily prepared for the
Tricine-SDS-PAGE were frozen at -20 °C to prevent degradation over the time.
Samples which were analyzed within 24 h were stored at 5 °C.
3 Materials and Methods _________________________________________________________________
_________________________________________________________________ 22
3.6 Analytical Methods
For the analysis of peptide samples, different analytical methods were established.
All methods have to match the same requirement of peptide stability and recovery.
The methods have to be designed in a way that precipitation and peptide changes
are prevented for the time of analysis. The reversed - phase - high performance
liquid chromatography (RP-HPLC) and the Tricine - sodium dodecyl sulfate poly-
acrylamide gel electrophoresis (Tricine-SDS-PAGE) were used for the
identification and quantification of the peptide. For the sample concentration, the
solid-phase extraction (SPE) should be implemented. To test for an antimicrobial
activity the radial diffusion assay (RDAI with Escherichia coli was performed.
3.6.1 Reversed-phase-HPLC
For the identification, quantification and verification of Aspidasept® in water
samples, the reversed - phase - high performance liquid chromatography (RP-
HPLC) was established. In this study, the C18-RP-column 218TPTM 5 µm from
Vydac® with a RP-18 (5 µm) guard column from LiChrospher® was used. The
218TPTM column consists of a reversed – phase (hydrophobic) stationary phase of
octadecyl alipathatic (C18) groups. The stationary phase is attached to the
surface of 300 Å pore diameter silica particles with 5 µm diameter (Hichrom,
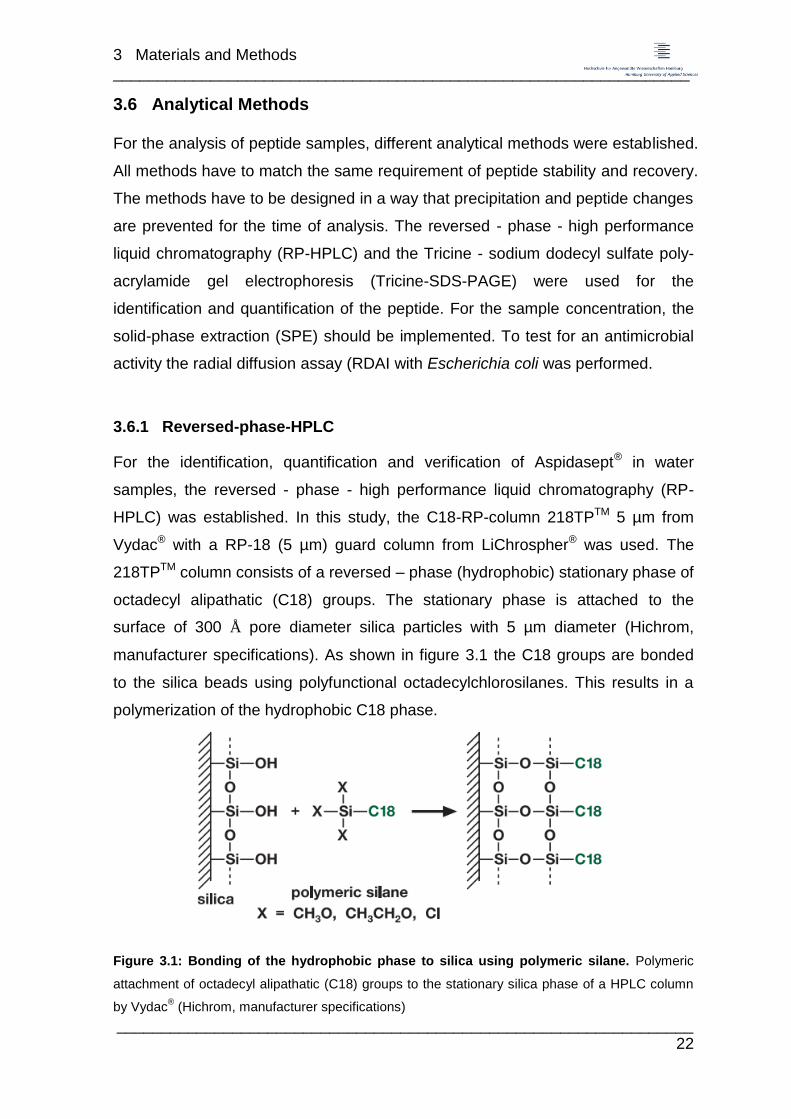
manufacturer specifications). As shown in figure 3.1 the C18 groups are bonded
to the silica beads using polyfunctional octadecylchlorosilanes. This results in a
polymerization of the hydrophobic C18 phase.
Figure 3.1: Bonding of the hydrophobic phase to silica using polymeric silane. Polymeric
attachment of octadecyl alipathatic (C18) groups to the stationary silica phase of a HPLC column
by Vydac® (Hichrom, manufacturer specifications)

3 Materials and Methods _________________________________________________________________
_________________________________________________________________ 23
The 218TPTM column was especially selected because it is designed for the
separation of small polypeptides with a molecular weight less than 4 – 5 kDa
(Hichrom, manufacturer specifications). The chromatography was performed with
the Primaide HPLC from HITACHI and analyzed with the Primaide software. A
218TPTM column with the dimensions of 4.6 mm inner diameter and 250 mm
length (4.2 mL column volume) was integrated.
For the HPLC a careful sample preparation was necessary to protect the column
against peptide precipitation, blocking and bacteria contaminations. All samples
were centrifuged for 10 min at 12.100 x g. Samples with higher contaminations,
such as sewage samples, were passed through a 0.45 µm Nylon filter (sterile
filtration). Shortly before injection, the samples were stirred using a Vortexer to
ensure a homogeneous mixing of the sample.
Since Aspidasept® consists of characteristic hydrophobic and hydrophilic residues
this property can be used for the development of an appropriate chromatographic
profile. For this study, the in figure 3.2 described profile was established. Two
buffers were needed. Buffer A contains a polar mobile phase with 0.1 % TFA
(buffer A). Buffer B is a mixture of 70 % acetonitrile (ACN) and 0.1 % TFA (buffer
B). With an increasing gradient of the hydrophobic acetonitrile, the elution of the
peptides was accelerated. Before sample injection, the column was equilibrated
with a mixture of buffer A and B in a ratio of 93:7 which results in a 5 % ACN
solution with 0.1 % TFA. During the whole chromatographic run a flow rate of
1 mL/min was set. The column temperature was set to constant 50 °C. After
sample injection the flow proceeds for 10 min with the buffer ratio of 93:7 to wash
out unbound molecules. To elute the bound molecules, the ACN concentration
was increased resulting in a decrease of interactions between the sample
components and the hydrophobic stationary phase. Within 20 min, the ACN
concentration was increased to 70 % (buffer A:B ratio 0:100). To remove
remaining hydrophobic contaminations the ANC concentration was kept at 70 %
for another 5 min. The run was finished with 10 min of 5 % ACN for a re-
equilibration of the column. The absorbance was measured at 214 nm with a
diode array detector.
3 Materials and Methods _________________________________________________________________
_________________________________________________________________ 24
To reduce permanent bound hydrophobic molecules and other contaminations the
column was cleaned with 100 % methanol and 100 % acetonitrile with a reverse
flow of 0.5 mL/min. For long term storage the column was rinsed with 70 %
methanol.
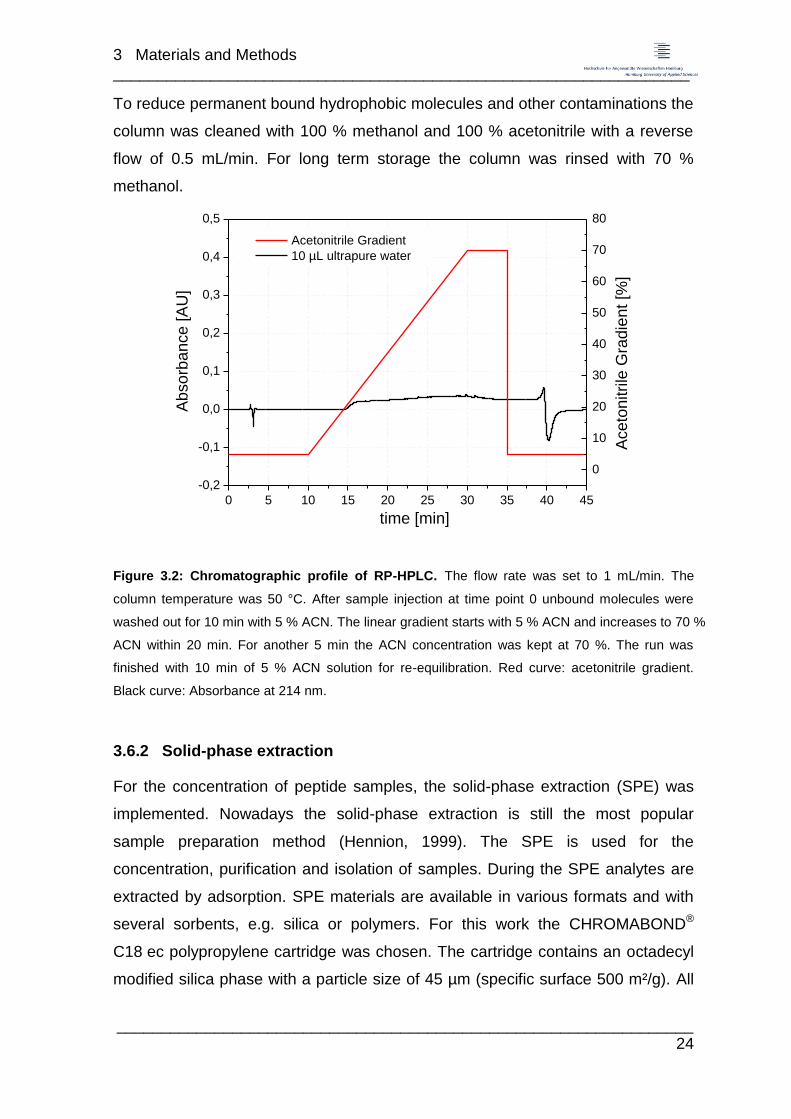
Figure 3.2: Chromatographic profile of RP-HPLC. The flow rate was set to 1 mL/min. The
column temperature was 50 °C. After sample injection at time point 0 unbound molecules were
washed out for 10 min with 5 % ACN. The linear gradient starts with 5 % ACN and increases to 70 %
ACN within 20 min. For another 5 min the ACN concentration was kept at 70 %. The run was
finished with 10 min of 5 % ACN solution for re-equilibration. Red curve: acetonitrile gradient.
Black curve: Absorbance at 214 nm.
3.6.2 Solid-phase extraction
For the concentration of peptide samples, the solid-phase extraction (SPE) was
implemented. Nowadays the solid-phase extraction is still the most popular
sample preparation method (Hennion, 1999). The SPE is used for the
concentration, purification and isolation of samples. During the SPE analytes are
extracted by adsorption. SPE materials are available in various formats and with
several sorbents, e.g. silica or polymers. For this work the CHROMABOND®
C18 ec polypropylene cartridge was chosen. The cartridge contains an octadecyl
modified silica phase with a particle size of 45 µm (specific surface 500 m²/g). All
0 5 10 15 20 25 30 35 40 45
-0,2
-0,1
0,0
0,1
0,2
0,3
0,4
0,5
Acetonitrile Gradient
10 µL ultrapure water
Ab
so
rba
nce
[A
U]
time [min]
0
10
20
30
40
50
60
70
80
Aceto
nitrile
Gra
die
nt [%
]
3 Materials and Methods _________________________________________________________________
_________________________________________________________________ 25
sample preparations were performed with a 3 mL cartridge with an absorbent
weight of 500 mg (specific surface 250 m²).
The conditions of the solid-phase extractions were chosen according to the
manufacturer specification of Macherey-Nagel (see figure 3.3). The prepared
solutions were passed though the cartridge by vacuum. During conditioning,
sample application and washing a drying of the column material should be
prevented. An individual sample preparation prior to the SPE was not performed.
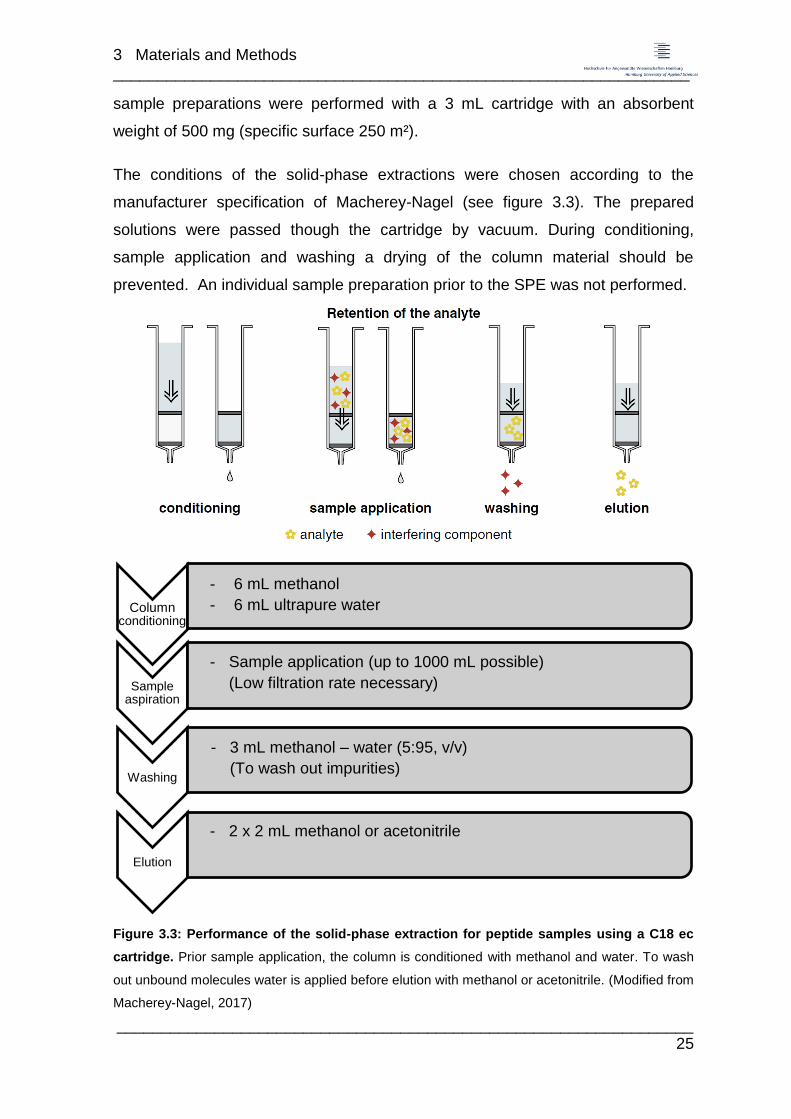
Figure 3.3: Performance of the solid-phase extraction for peptide samples using a C18 ec
cartridge. Prior sample application, the column is conditioned with methanol and water. To wash
out unbound molecules water is applied before elution with methanol or acetonitrile. (Modified from
Macherey-Nagel, 2017)
Column conditioning
Sample aspiration
Washing
Elution
- 6 mL methanol
- 6 mL ultrapure water
- Sample application (up to 1000 mL possible)
(Low filtration rate necessary)
- 3 mL methanol – water (5:95, v/v)
(To wash out impurities)
- 2 x 2 mL methanol or acetonitrile

3 Materials and Methods _________________________________________________________________
_________________________________________________________________ 26
The elution fractions were vaporized using nitrogen und resolved in 0.1 % TFA
using a Vortexer. After resolving, the sample was analyzed by RP-HPLC or
Tricine-SDS-PAGE.
3.6.3 Tricine-SDS-PAGE
To distinguish between proteins and peptides with similar charge and elution
profiles during chromatography, the molecular weight (MW) is an elementary
parameter. For the analytical determination of the molecular weight, the sodium
dodecyl sulfate polyacrylamide gel electrophoresis (SDS-PAGE) is frequently
used. Using SDS-PAGE, the separation of proteins and peptides by MW is
achieved by the migration of chemically negatively charged molecules within an
electrical field in a strongly cross-linked acrylamide gel. Due to the gel matrix,
smaller molecules can migrate faster than larger ones and thus can be found
closer to the anodic side of the gel (Westermeier and Gronau, 2005).
In prior studies a Tricine-SDS-PAGE (modified from Laemmli by Schägger and
Jagow, 1987) was established for the MW separation of small peptides. As listed
in table 3.5, for the preparation of the Tricine-SDS gels three different gel matrices,
which vary in the acryl-/bisacrylamide concentration, were used to improve the
separation. The gel chambers were assembled according to the instruction
manual of Bio-Rad Laboratories. After a polymerization time of 30 minutes, the
gels were used directly or stored in a close plastic bag with 100 µL water to
prevent dehydration at 4 °C. Unreduced samples for the Tricine-SDS-PAGE were
mixed 1:1 with 2x sample buffer (see table 3.7) and boiled at 95 °C for 5 min. For
reduced samples the 2x sample buffer was mixed 10:1 with 1 M dithiothreitol
(DTT). DTT is used to break disulfide bonds between the residues of two amino
acids (e.g. cysteine) and prevent dimerization. The electrophoresis equipment
was set up as described in the manufacturer description (BIO-RAD) and filled with
cathode- and anode-buffer (see table 3.7). After loading of the gel pockets with
3 µg marker-peptides (dissolved in sample buffer), positive controls (1 µg, 0.5 µg
and 0.25 µg Aspidasept® dissolved in sample buffer) and 15 µL of the
sample/sample buffer preparation the Tricine-SDS-PAGE was started with
20 mA/gel (80 mA/4 gels). The electrophoresis run lasts 3 to 3.5 hours and was

3 Materials and Methods _________________________________________________________________
_________________________________________________________________ 27
stopped when the sample buffer was escaping the bottom of the gel. Afterwards
the gels were fixed with gel fixation solution (see table 3.6) for 30 min on the
rocker (40 rpm) and washed in aqua dem. 3 times for 5 min. During this work, the
Tricine-SDS-PAGE gels were stained using Coomassie staining (see table 3.8).
Finally, the gels were destained for 30 min with an ethanol mixture (see table 3.8).
Table 3.5: Composition of the SDS-PAGE for the production of two gels. The components
TEMED and APS were added directly before cast to prevent premature polymerization. Starting
with the separation gel, the spacer and the stacking gels were cast directly after. The composition
of the gelbuffer can be found in table 3.7.
Component Concentration Separation gel
(15 %)
Spacer gel
(9 %)
Stacking gel
(4 %)
Acryl-
/Bisacrylamide 40 % 3.75 mL 2.25 mL 1 mL
Gelbuffer 3x 3.30 mL 3.30 mL 3.30 mL
Glycerol 87 % 2 mL 1 mL -
Aqua dem. 100 % 0.95 mL 3.45 mL 5.70 mL
TEMED 100 % 9 µL 5 µL 5 µL
APS 40 % 12 µL 9 µL 9 µL
Cast volume / gel 3 mL 0.50 mL 1 mL
Table 3.6: Gel fixation solution of the Tricine-SDS-PAGE gels, used before staining.
Glutardialdehyde is added shorty before use to prevent polymerization of the molecule
(polymerized Glutardialdehyde cannot bind to the amino groups of amino acids which however is
necessary for the fixation).
Component Amount
Boric acid 12.37 g
Glutardialdehyde (25 %) 100 mL
Add 300 mL aqua dem., adjust to pH 8.5, fill up to 500 mL (for 4 gels)

3 Materials and Methods _________________________________________________________________
_________________________________________________________________ 28
Table 3.7: Solutions for the SDS-PAGE.
Anode-buffer (10x)
Component Amount
Tris Base (2 M) 24.2 g
Adjust pH to 8.9, fill up to 100 mL, dilute to 1x buffer before use
Cathode-buffer (10x)
Component Amount
Tris Base (1 M) 6.2568 g
Tricine (1 M) 8.98 g
SDS (1 %) 0.5 g
Adjust pH to 8.25, fill up to 50 mL, dilute to 1x buffer before use
Gel-buffer (3x)
Component Amount
Tris Base (3 M) 36.3 g
SDS 0.3 g
NaN3 1 mL from 1 % solution
Adjust pH to 8.44, fill up to 100 mL
Buffer S
Component Amount
Tris Base 6.1 g
SDS 0.4024 g
NaN3 1 mL from 1 % solution
Adjust pH to 6.8, fill up to 100 mL, use for sample-buffer
Sample-buffer
Component Amount
Buffer S 2.5 mL
SDS 2 g
Orange G 40 mg
Glycerol (87 %) 20 mL
Fill up to 100 mL

3 Materials and Methods _________________________________________________________________
_________________________________________________________________ 29
Table 3.8: Solutions for the Coomassie staining of the SDS-PAGE gels (4 gels)
Coomassie staining solution
Component Amount
Roti-Blue (Coomassie 5x) 100 mL
Ethanol (≥99.8 %) 100 mL
Fill up to 500 mL, Mix well to prevent colloids
Destaining solution
Component Amount
Ethanol (≥99.8 %) 50 mL
Acetic acid (100 %) 50 mL
Fill up to 500 mL
3.6.4 Radial diffusion assay
The radial diffusion assay (RDA) or radial activity diffusion assay is an analytical
method for the proof of an antimicrobial activity of any molecule. Agar diffusion
tests are established for the test of antibiotics (Bondi et al., 1947) but can also be
transferred for the proof of the antimicrobial activity of peptides. The RDA was
developed following Lehrer et al. (Lehrer et al., 1991)
The test was performed according to the standard operation procedure (SOP)
‘Agardiffusionstest zur Wirksamkeitsprüfung von toxischen Substanzen; speziell
antimikrobiellen Peptiden’ from Jacob Brandt and Jan Demmer (version
03.06.2016). Due to an exchange of the used Escherichia coli strain to E. coli
WBB01 changes in the execution were necessary. In the following only the
changes are described.
All solutions were prepared according to the SOP. Due to a decreased growth of
E. coli WBB01 the first shaking flask was inoculated with 100 µL (as per SOP
50 µL) of the cryo culture as early as possible at day 1. In the morning of day 2
the second shaking flask was inoculated with 300 µL (as per SOP 200 µL) and
incubated for at least 3.5 h (as per SOP 2.5 h). The agar was cooled down to
42 °C (as per SOP 48 °C) to prevent prematurely cell death during casting of
3 Materials and Methods _________________________________________________________________
_________________________________________________________________ 30
E. coli inoculated agar. The agar was seeded with 4 x 10⁶ colony forming units.
After the application of samples and controls, the second agar layer was casted at
42 °C. The plate was incubated at 30 °C for approx. 40 h (as per SOP 18 h) to
obtain a dense bacterial lawn and evaluated using the software ImageJ.
3.7 Peptide elimination on the model waste water treatment plant
Beside the characterization of Aspidasept® and the development of suitable
analytic methods, the aim of this study was the investigation of the peptide
behavior and elimination on various new steps of the waste water treatment. For
this purpose small scale models of each treatment step were adjusted and used
to simulate the clearance of the peptide. In the following chapters the methods for
peptide elimination on the model waste water treatment plant are described.
3.7.1 Activated carbon adsorption
3.7.1.1 Activated carbon
For all adsorption trials the granulated activated carbon (GAC) Hydraffin AR 8x30
(company: Donau Carbon) was used. In table 3.9 the characteristics based on
manufacturer specifications are listed. Prior starting the adsorption studies the
granulated activated carbon was cleaned according to Worch (2012). To remove
proportions of fines and further impurities the GAC was washed with
demineralized water. Following, the GAC was dried at 110 °C for 24 h. During the
storage of the cleaned and dried GAC it is required to protect it from moisture and
oxygen absorption.

3 Materials and Methods _________________________________________________________________
_________________________________________________________________ 31
Table 3.9: Specifications of the granulated activated carbon
Hydraffin AR 8x30. (Manufacturer specification, Donau Carbon,
2017)
Specification of Hydraffin AR 8x30
Granulation size (mesh) [0.60-2.36mm] 8 x 30
Bulk density [kg/m³] 500 ± 30
Water content [wt. %] (during packaging)
< 5
Iodine adsorption [mg/g] > 950
Hardness [wt. %] > 90
Bulk density [kg/m³] (after classification of backwash)
App. 450
Inner Surface [m²/g] (BET-method)
App. 1100
Ash content [wt. %] < 50
3.7.1.2 Adsorption kinetic on granulated activated carbon
To determine the time to an adsorption equilibrium of a known Aspidasept®
concentration on a known GAC mass adsorption kinetics were performed. For the
kinetic trials Aspidasept® was dissolved in 0.1 % DMSO and added to a constant
volume (VL) of deminerized water (end concentration of DMSO 0.01 %). The
solution was temperated to 10 °C or rather 20 °C in a shaking water bath
(100 rpm). The trials were performed in 25 mL glass bottles. To the peptide
solution, a known amount of GAC was added. The GAC amount varies during the
experiments. To eliminate influences of the test matrix negative and positive
controls were performed. For each positive control and each peptide sample 1 mg
Aspidasept® were weigh in (c0 = 100 mg/L). Table 3.10 shows the composition of
the experiment set up.

3 Materials and Methods _________________________________________________________________
_________________________________________________________________ 32
Table 3.10: Composition of the experiment set up of the adsorption trials. Component
added, x Component absent.
Experiment Volume VL Test matrix Aspidasept® GAC
Negative control
10 mL dem. water with
0.01 % DMSO
x
Positive control x
Peptide sample
For the adsorption kinetics, five different GAC concentrations were tested. In table
3.11, the GAC concentrations are listed.
Table 3.11: GAC concentrations prepared for the adsorption
kinetic trials.
GAC concentration [g/L] GAC mass [g] / 10 mL
5 0.05
7.5 0.075
10 0.1
20 0.2
50 0.5
During the experiments samples (100 µL) at different time points were taken and
centrifuged for 10 min at 12.100 x g. After centrifugation 50 µL of the supernatant
were taken and analyzed using RP-HPLC and Tricine-SDS-PAGE. For the
analysis 10 µL sample volume were applied to the RP-HPLC and 7.5 µL to the
Tricine-SDS-PAGE. The sampling times are shown in table 3.12. During the
experiments, the temperature was measured to ensure constant test conditions.
3 Materials and Methods _________________________________________________________________
_________________________________________________________________ 33
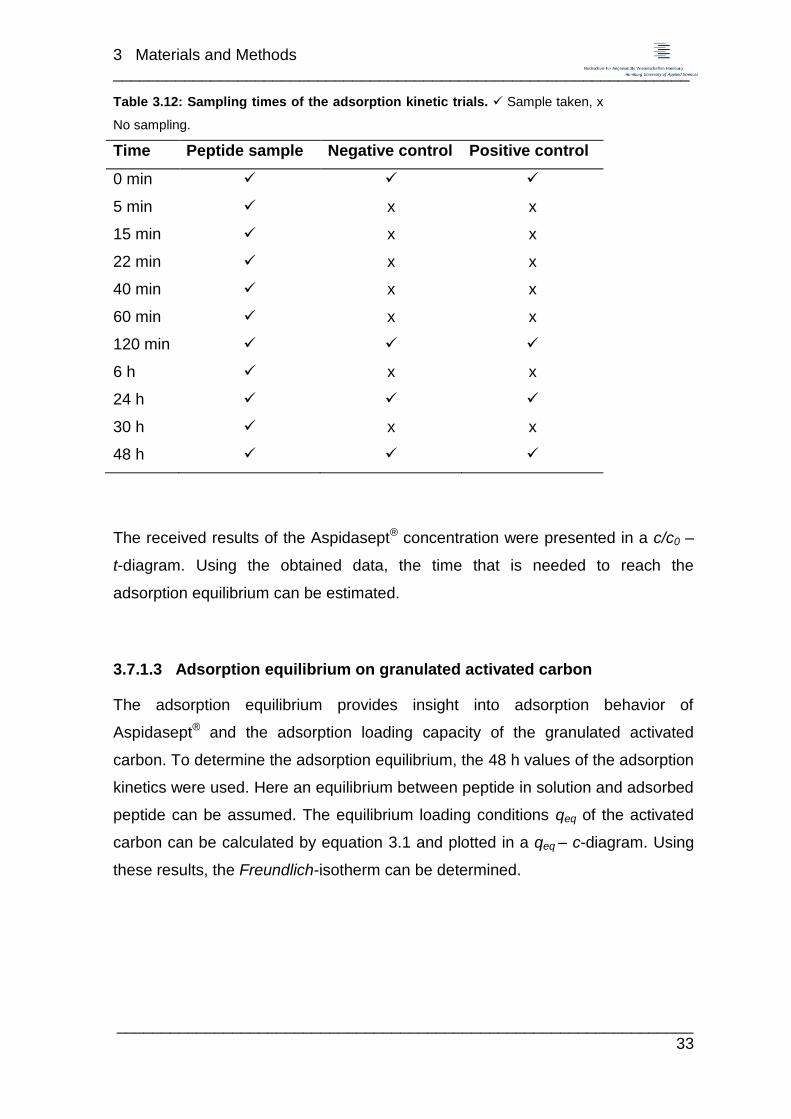
Table 3.12: Sampling times of the adsorption kinetic trials. Sample taken, x
No sampling.
Time Peptide sample Negative control Positive control
0 min
5 min x x
15 min x x
22 min x x
40 min x x
60 min x x
120 min
6 h x x
24 h
30 h x x
48 h
The received results of the Aspidasept® concentration were presented in a c/c0 –
t-diagram. Using the obtained data, the time that is needed to reach the
adsorption equilibrium can be estimated.
3.7.1.3 Adsorption equilibrium on granulated activated carbon
The adsorption equilibrium provides insight into adsorption behavior of
Aspidasept® and the adsorption loading capacity of the granulated activated
carbon. To determine the adsorption equilibrium, the 48 h values of the adsorption
kinetics were used. Here an equilibrium between peptide in solution and adsorbed
peptide can be assumed. The equilibrium loading conditions qeq of the activated
carbon can be calculated by equation 3.1 and plotted in a qeq – c-diagram. Using
these results, the Freundlich-isotherm can be determined.
3 Materials and Methods _________________________________________________________________
_________________________________________________________________ 34
(Equation 3.1)
qeq Loading of GAC during equilibrium [µg/g]
c0 Start concentration of Aspidasept® [µg/L]
c End concentration of Aspidasept® [µg/L]
mGAC Granulated activated carbon mass [g]
VL Test volume [L]
3.7.2 Membrane filtration
3.7.2.1 Membrane for peptide filtration
For the peptide filtration trials, a nano-/ultrafiltration membrane was chosen.
Before starting the filtration trials, the adsorption of Aspidasept® on various
membranes were analyzed. For this purpose, various flat membranes of the
company DOW Filmtec were used. A membrane for reverse osmosis (XLE) and
two membranes for nano-filtration (NF-90 and NF-270) were tested. All
membranes are made of polyamide but with different pore sizes. From small to
large: XLE NF90 NF270.
With the largest pores distribution, the membrane TRISEP® UA60 of the company
MICRODYN-NADIR was chosen for the peptide filtration. With a Cut-Off in the
range of 1000 Da, it belongs to the range between ‘tight’ ultra-filtration
membranes and ‘open’ nano-filtration membranes. It is based on a piperazine-
based thin-film composite membrane. With a NaCl rejection of 10 % and an
MgSO4 rejection between 70 – 90 % a peptide recovery of nearly 100 % should
be achieved (manufacturer specification, MICRODYN-NADIR). The specifications
can be found in table 3.13.

3 Materials and Methods _________________________________________________________________
_________________________________________________________________ 35
Table 3.13: Specifications of the used reverse osmosis and nano membranes. All
membranes are available in spiral-wounded modules and flat sheets. (Manufacturer specifications,
DOW & MICRODYN-NADIR)
Membrane XLE NF90 NF270 TRISEP® UA60
Vendor DOW DOW DOW MICRODYN-
NADIR
Specification Reverse
Osmosis
Reverse
Osmosis
Reverse
Osmosis
Nano-(loose)/
Ultrafiltration(tight)
Cut-Off ~ 100 Da 200 - 400 Da 200 - 400
Da Approx. 1000 Da
Material polyamide polyamide polyamide Piperazine amide
Polarity polar polar polar polar
Commercially
available
Commercial
usage
water
treatment
drinking Water/
industrial water
demineralization
local
drinking
water
water treatment
3.7.2.2 Membrane adsorption and buffer recovery of Aspidasept®
Before starting the peptide filtration trials the short time recovery of Aspidasept® in
presence of various buffer salts and pH values and the adsorption affinity of the
peptide and different membranes was essential to select appropriate filtration
conditions for later experiments.
The pretests were performed in small-scale glass vials in a test volume (VL) of
1 mL. To assess the impact of buffer and pH positive controls without membrane
were prepared. For this purpose, six different buffer conditions (see table 3.14)
were evaluated. For all positive controls 10 µL of 1 µg/µL Aspidasept® (dissolved
in 0.01 % TFA) were added to 990 µL buffer. After 0 min, 30 min, 1 h and 3 h
samples were taken.

3 Materials and Methods _________________________________________________________________
_________________________________________________________________ 36
Table 3.14: Buffer compositions used for the stability pretests of Aspidasept®. All buffers
were filtrated through a 0.45 µm syringe filter.
Buffer salt / component Molarity / concentration pH NaCl molarity
Trifluoroacetic acid 0.1 % - -
Dem. H2O - - -
Acetate 10 mM
10 mM
10 mM
10 mM
5.5 50 mM
50 mM
50 mM
50 mM
HEPES 7.5
Tris 7.0
Tris 9.0
To exclude the influence of possible membrane extractables on the sample
analysis, negative controls with buffer and membrane without peptide were
prepared. Therefore, 1 x 1 cm pieces of the membrane were stored for 3 h in 0.1 %
TFA respectively Tris-buffer pH 7 (for composition see table 3.14).
To examine the adsorption of Aspidasept® to nano- and ultrafiltration membranes,
four different flat membranes were used (for specifications see table 3.13). Such
as for the negative control 1 x 1 cm pieces were added to 990 µL 0.1 % TFA
respectively Tris-buffer pH 7 and 10 µL 1 µg/µL Aspidasept® (dissolved in 0.01 %
TFA). Samples were taken at time point zero and after 30 min, 1 h and 3 h. For
the analysis of all control and adsorption samples, 99.5 µL sample volume were
applied onto the RP-HPLC. All experiments were realized at room temperature.
3.7.2.3 Cut-Off determination of membrane UA60
To confirm the Cut-Off, specified by the manufacturer, experiments were
performed with various substances. For each filtration, 2 mg substance was
dissolved in 200 mL Tris buffer (10 mM Tris, 50 mM NaCl, pH 7). Table 3.15 lists
the used substances with corresponding molecular weight. The solution were
filled into the filtration cell and 1 mL feed sample were taken for the analysis. The
filtration was started by applying overpressure. Each filtration was performed at
8 bar with a magnetic stirrer speed of 200 rpm. The filtration was stopped after
100 mL permeate were reached (measured by balance). For analysis, 1 mL

3 Materials and Methods _________________________________________________________________
_________________________________________________________________ 37
permeate and 1 mL retentate were sampled. All samples were analyzed using a
UV/VIS-Spectrometer at different wavelength (see table 3.15).
Table 3.15: Substances used for the Cut-Off determination of membrane UA60.
The molecular weight and the used wavelength are given.
Substance Molecular Weight [Da] Wavelength [nm]
Lysozyme 14300 280
Vitamin B12 1355 361
Bromophenol blue 670 590
L-Glutathione 307 219
DL-Tryptophan 204 280
After each filtration for the Cut-Off determination, a reference filtration with 200 mL
dem. water (100 mL permeate) was carried out. The reference filtrations were
executed at 8 bar with a magnetic stirrer speed of 100 rpm. Reference test were
necessary to monitor the fouling (clogging of the membrane) by molecules used
for the Cut-Off determination. With increasing clogging, the flux decreases and the
filtration time increases.
The recovery in % of each substance can be calculated from the measured
absorbance using equation 3.2.
(
) (Equation 3.2)
R Recovery [%]
Abper Absorbance of permeate [AU]
Abfeed Absorbance of feed [AU]
Abret Absorbance of retentate [AU]

3 Materials and Methods _________________________________________________________________
_________________________________________________________________ 38
3.7.2.4 Aspidasept® membrane filtration
After verifying the Cut-Off, the membrane was used to investigate the filtration
behavior of Aspidasept®. For this purpose a filtration series with increasing
pressure was performed. First, 2 mg Aspidasept® was dissolved in 1 mL
0.1 % TFA and diluted with Tris-buffer (20 mM Tris, 50 mM NaCl, pH 7) to 200 mL
(end concentration 10 mg/L). To decrease the amount of peptide, necessary for
the filtrations it was planned to perform the series with one peptide solution. Due
to the rapidly decrease of Aspidasept® during the first filtration run, a second
peptide solution was required.
Before starting each filtration, 1 mL feed sample was taken. Each filtration was
started with 200 mL peptide solution with a magnetic stirrer speed of 200 rpm and
different pressures. The filtration was stopped when 50 mL permeate were
reached. Samples of permeate and retentate were taken for the analysis. The
filtration series was started with pressures of 8 and 10 bar. After the filtration at
10 bar, the second solution was used for the last three filtration runs at 10, 12 and
16 bar. Each filtration run was repeated with a second UA60 membrane. Between
every peptide run, a reference filtration with dem. water was performed to observe
the fouling of the membrane.
3.7.3 Biological treatment
The elimination of substances by biological reduction is probable the most well-
known method of waste water treatment. Although the biological treatment is an
established method for the waste water treatment is was necessary to examine
the impact of an antimicrobial peptide on the bacteria and protozoa used in this
step. For the degradation, trials of Aspidasept® two experiments were made. Both
experiments were performed in small scale because it was not possible to use the
laboratory waste treatment system (KLD4N/SR) of the company Behr Labor-
Technik. However, the waste water used for the Aspidasept® clarification was
gathered of the laboratory waste treatment system (KLD4N/SR). In this case two
different waste waters can be named. The first one is the synthetic waste water.

3 Materials and Methods _________________________________________________________________
_________________________________________________________________ 39
The composition can be found in table 3.16 and 3.17. The second one is the
clarified waste water.
Table 3.16: Composition of the trace element in the synthetic waste water. The medium is
cooled at 4 °C to decrease degradation.
Compound c synthetic waste water [mg/L]
Calcium chloride (CaCl2) 5,000
Sodium hydrogen carbonate (NaHCO3) 25,000
Ferric(II)-sulfate-hepta hydrate (FeSO4 · 7 H2O) 10,000
Copper(II)-chloride-dihydrate (CuCl2 · 2 H2O) 0,480
Cobalt(II) chloride hexahydrate (CoCl2 · 6 H2O) 0,050
Zinc chloride (ZnCl2) 0,180
Manganese(II) Sulfate Monohydrate (MnSO4 · H2O)
0,100
Sodium molybdate (Na2MoO4) 0,170
Chromium(III)-nitrate-nonahydrate (Cr(NO3)3 · 9 H2O)
0,680
Nickel(II) sulfate hexahydrate (NiSO4 · 6 H2O) 0,300
Table 3.17: Composition of the medium in the synthetic
waste water. The medium is cooled at 4 °C to decrease
degradation.
Compound c synthetic waste water [g/L]
Peptone 0,160
Meat extract 0,110
Urea 0,030
NaCl 0,007
CaCl2 · 2 H2O 0,004
MgSO4 · 7 H2O 0,002
K2HPO4 0,028

3 Materials and Methods _________________________________________________________________
_________________________________________________________________ 40
As it must be assumed that Aspidasept® will adsorbed at particles present in the
waste water, two experiments were planned. For the first experiment, almost
particle free waste water was used obtained by centrifugation to investigate the
recovery in the environmental conditions of waste water. The second trial was
performed with untreated waste water to observe the adsorption and elimination
of the peptide on the particles of the waste water.
3.7.3.1 Recovery tests in particle free waste water
The recovery test was performed with the feed solution of the laboratory waste
treatment system (KLD4N/SR) and the cleared waste water. To obtain particle
free waste water a centrifugation step at 12.100 x g for 10 min was performed.
The supernatant was used for the experiments. For a 1 µg/7.5 µL peptide
concentration 950 µL particle free waste water and 50 µL 1 mM Aspidasept® were
mixed in a 1.5 mL glass vial. The experiment was performed at 4 °C. Samples
were taken at the time points: 0 min, 30 min, 1.5 h, 3.25 h, 20.75 h, 27.25 h, 48 h,
72 h and 6 days. The samples were analyzed by RP-HPLC.
3.7.3.2 Elimination in waste water
The peptide elimination was performed in waste water coming from the
denitrification step of the laboratory waste treatment system (KLD4N/SR). Using a
1 mM Aspidasept® solution waste water samples with various peptide
concentrations (0, 1, 5, 10, 25, 50, 100 µg/mL) were prepared. The solutions were
incubated overnight for 21 h in glass vials at room temperature. After incubation
the samples were centrifuged (10 min, 12.100 x g). The supernatant was
analyzed using the RP-HPLC. The pellets were resuspended in 100 µL SDS-
PAGE sample puffer and analyzed by Tricine-SDS-PAGE.

4 Results _________________________________________________________________
_________________________________________________________________ 41
4 Results
In the following chapters, the results of the peptide characterization by various
analytical procedures are described. Based on new implemented methods for
peptide analysis, the elimination studies with different waste water treatment models
are displayed. The adsorption at granulated activated carbon, membrane filtration
and the biological treatment were examined.
4.1 Characterization of the antiseptic peptide Aspidasept®
To establish a strategy for the elimination of Aspidasept® on a model waste water
treatment plant the antiseptic peptide was characterized using reversed-phase-
HPLC, solid-phase extraction, Tricine-SDS-PAGE and radial activity diffusion assay.
Whereas the RP-HPLC and the Tricine-SDS-PAGE was primary used for the
identification and quantity determination of the peptide, the solid-phase extraction
should be developed for the concentration of larger sample volumes. For a proof of
antimicrobial activity, the radial activity diffusion assay was implemented. All
performed experiments were performed according to the prior described methods.
4.1.1 Verification of Aspidasept® by RP-HPLC
For the analysis of particle free peptide samples the RP-HPLC were established.
First trails showed that 1 µL pure Aspidasept® dissolved in 0.01 % TFA results in two
clearly baseline separated peaks. The first one elutes with a retention time of
23.027 min, which corresponds to an acetonitrile concentration of 47.5 %. A second
peak is detected after 23.980 min (acetonitrile concentration of 51 %). To gather
more information about the unexpected second peak a sample with dithiothreitol
(DTT) reduced peptide was applied. With a final DTT concentration of 3.33 mM 1 µL
was applied resulting in a single peak at 23.013 min. The retention time is complying
with the first peak of the untreated peptide leading to the assumption that
Aspidasept® forms dimers in aqueous solutions. As well, it can be presumed that,
the monomer experience less retention on the RP-HPLC column and elutes first.
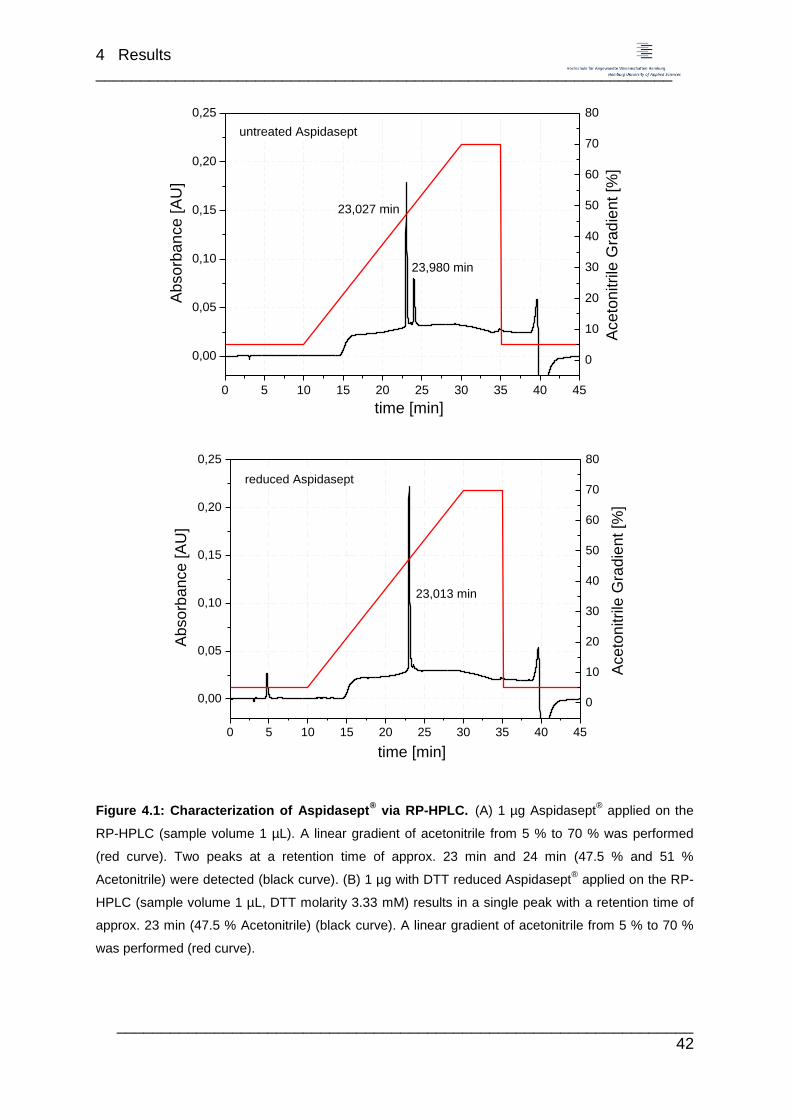
4 Results _________________________________________________________________
_________________________________________________________________ 42
Figure 4.1: Characterization of Aspidasept® via RP-HPLC. (A) 1 µg Aspidasept
® applied on the
RP-HPLC (sample volume 1 µL). A linear gradient of acetonitrile from 5 % to 70 % was performed
(red curve). Two peaks at a retention time of approx. 23 min and 24 min (47.5 % and 51 %
Acetonitrile) were detected (black curve). (B) 1 µg with DTT reduced Aspidasept® applied on the RP-
HPLC (sample volume 1 µL, DTT molarity 3.33 mM) results in a single peak with a retention time of
approx. 23 min (47.5 % Acetonitrile) (black curve). A linear gradient of acetonitrile from 5 % to 70 %
was performed (red curve).
0 5 10 15 20 25 30 35 40 45
0,00
0,05
0,10
0,15
0,20
0,25
untreated Aspidasept
23,980 min
23,027 min
Ab
so
rba
nce
[A
U]
time [min]
0
10
20
30
40
50
60
70
80
Aceto
nitri
le G
rad
ient
[%]
0 5 10 15 20 25 30 35 40 45
0,00
0,05
0,10
0,15
0,20
0,25
reduced Aspidasept
23,013 min
Ab
so
rba
nce
[A
U]
time [min]
0
10
20
30
40
50
60
70
80
Ace
ton
itri
le G
rad
ien
t [%
]

4 Results _________________________________________________________________
_________________________________________________________________ 43
Since the RP-HPLC was the most important analytical method, it was desirable to
determine the accuracy of the system. An evaluation with four different peptide
concentrations and injection volumes were performed. The samples 1 µg/10 µL,
1 µg/50 µL, 5 µg/10 µL and 5 µg/50 µL were injected 10 times. All samples series
were repeated twice with a new sample solution. Figure 4.2 shows the results of
both injection series. Whereby, the data of the injections of 1 µg results in equal
values between the two series, the injection with 5 µg only shows similar values
within a series. In comparison to the first injection series, the second series reached
unlikely higher values.
Figure 4.2: HPLC evaluation with injection series of 4 peptide concentration and injection
volumes. The samples 1 µg/10 µL, 1 µg/50 µL, 5 µg/10 µL and 5 µg/50 µL were injected 10 times
per series. For the complete series is n = 2.
Using the obtained mean of the integrated RP-HPLC results and the standard
deviation, the coefficient of variation can be calculated (see table 4.1). For the used
sample preparations values between 1.0 and 7.3 % were obtained. No significant
volume dependent differences in the accuracy of the analytic can be recognized.
1 µg/10 µL 1 µg/50 µL 5 µg/10 µL 5 µg/50 µL0,00
0,01
0,02
0,03
0,04
0,05
0,06
0,07
0,08
Are
a u
nd
er
the c
urv
e [A
U m
in]
Peptide mass [µg] / Injection volume [µL]
1. injection series
2. injection series

4 Results _________________________________________________________________
_________________________________________________________________ 44
Table 4.1: Coefficient of variation of the RP-HPLC evaluation.
Experiment Deviation [%] / series 1 Deviation [%] / series 2
1 µg/10 µL 5.11 2.65
1 µg/50 µL 3.12 7.30
5 µg/10 µL 5.50 1.06
5 µg/50 µL 2.95 5.29
4.1.2 Reference curve and level of detection on the RP-HPLC
To estimate the amount of peptide during the experiments by analyzing the area
under the curve, a reference curve was necessary. Due to an absence of data for
Aspidasept® on RP-HPLC, the peptide was applied without reduction first (see figure
4.3). The samples were untreated to obtain the LOD for the unreduced peptide.
However, since the ratio between monomer and dimer is dependent on the storage
conditions and the storage time, a second approach (reduced peptide) was made as
reference for the quantification.
Figure 4.3: Level of detection chromatograms of Aspidasept® on the RP-HPLC. 1 µg, 3 µg and
5 µg Aspidasept were applied onto the column. The peptide elutes in two clearly separated peaks at
23 min and 24 min.
22,5 23,0 23,5 24,0 24,5
0,0
0,5
1,0
1,5
2,0
1 µg Aspidasept
3 µg Aspidasept
5 µg Aspidasept
Absorb
ance [A
U]
time [min]

4 Results _________________________________________________________________
_________________________________________________________________ 45
Thus, the reference curve was created using reduced peptide samples from 0.1 µg
to 6 µg (see figure 4.4). The experiment showed that an increasing peptide amount
results in increasing peaks. Independent from the sample amount or volume the
peptide is characterized by the same retention time (23 min, 47.5 % acetonitrile)
each run which indicates the RP-HPLC as an appropriate and reproducible
analytical method. It should be noted that sample amounts larger than 10 µg cannot
be detected properly due to the detector limit.
By integrating the area under the curve with the Origin software the reference curve
was set. Using the following equation and the area under the curve of each sample
the peptide amount can easily calculated.
(Equation 4.1)
As it was proved that with the application of buffer without peptide no peak will
detected it can be assumed that the reference curve passes through zero. Thus, the
intersection was neglected during the evaluation of the RP-HPLC chromatogram.
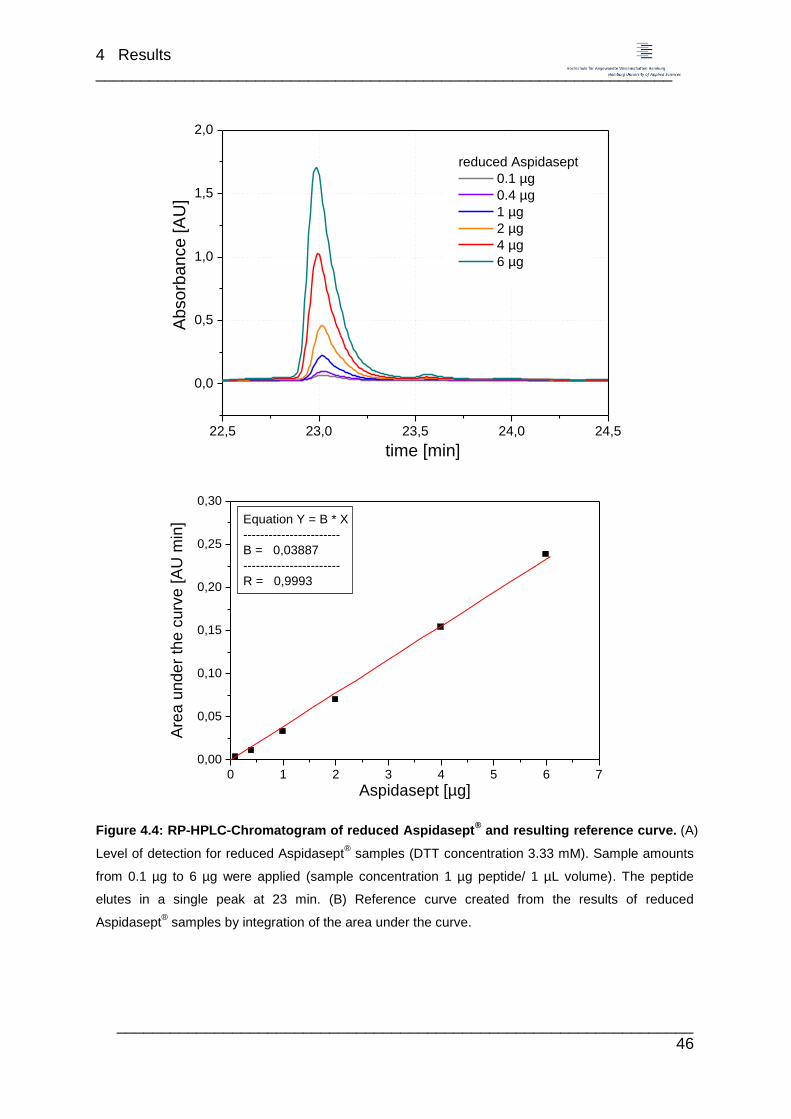
4 Results _________________________________________________________________
_________________________________________________________________ 46
Figure 4.4: RP-HPLC-Chromatogram of reduced Aspidasept® and resulting reference curve. (A)
Level of detection for reduced Aspidasept® samples (DTT concentration 3.33 mM). Sample amounts
from 0.1 µg to 6 µg were applied (sample concentration 1 µg peptide/ 1 µL volume). The peptide
elutes in a single peak at 23 min. (B) Reference curve created from the results of reduced
Aspidasept® samples by integration of the area under the curve.
22,5 23,0 23,5 24,0 24,5
0,0
0,5
1,0
1,5
2,0
reduced Aspidasept
0.1 µg
0.4 µg
1 µg
2 µg
4 µg
6 µg
Ab
so
rba
nce
[A
U]
time [min]
0 1 2 3 4 5 6 7
0,00
0,05
0,10
0,15
0,20
0,25
0,30
Equation Y = B * X
-----------------------
B = 0,03887
-----------------------
R = 0,9993
Are
a u
nd
er
the
cu
rve
[A
U m
in]
Aspidasept [µg]

4 Results _________________________________________________________________
_________________________________________________________________ 47
4.1.3 Verification of Aspidasept® by Tricine-SDS-PAGE
For the verification of Aspidasept®, a Tricine-SDS-PAGE was performed to analyze
the molecular weight. The peptide was applied unreduced and with DTT reduced
(see figure 4.5). The first lane shows the standard peptide marker with a molecular
weight range of 2.5 kDa to 17.0 kDa. Lane 2 to 4 shows the peptide Aspidasept®
without further treatment in sample amounts of 1 µg, 0.5 µg and 0.35 µg. In all
concentrations three peptide bands can be seen with molecular weights of 3.3 kDa,
3.8 kDa and 6.0 kDa. Whereby the bands with lower molecular weight seem to get
fainter, the band with the highest molecular weight increases its intensity with
decreasing peptide mass. In the last three lanes reduced peptide was applied. An
intense peptide band is detected at a molecular weight of 3.8 kDa. Beneath the
intense band a fainter band at a molecular weight of 3.3 kDa can be seen.
Figure 4.5: Tricine-SDS-PAGE with unreduced and reduced Aspidasept®. The first lane contains
the marker peptide marker with standard molecular weight. Lanes 2 to 4 show the unreduced peptide
in sample amounts of 1 µg, 0.5 µg and 0.35 µg. Lanes 5 to 7 show the with 3.33 mM DTT reduced
peptide in sample amounts of 1 µg, 0.5 µg and 0.35 µg.
4 Results _________________________________________________________________
_________________________________________________________________ 48
The calculated molecular weight of the peptide Aspidasept® is 2.7 kDa. Since
peptides can show a different behavior compared to proteins on the SDS-PAGE the
standard peptide marker was used only as reference point. Nonetheless, it can be
assumed that due to its lack in the reduced samples, the peptide band with the
molecular weight of 6.0 kDa (unreduced peptide) represents the dimer of
Aspidasept®. Because the band with a molecular weight of 3.8 kDa gains intensity
after reduction, it can be presumed as the peptide monomer. The band with the
lowest molecular weight is probably peptide with different conformation or degraded
peptide.
4.1.4 Reference curve and level of detection on the Tricine-SDS-PAGE
For some Aspidasept® samples it was assumed that the peptide adsorbs to particles
of the sample matrix. For these samples only the analysis by Tricine-SDS-PAGE
was possible to protect the HPLC column. A reference curve is necessary for the
quantification. Figure 4.6 displays an exemplary Tricine-SDS-PAGE for a reference
curve. Because the intensity of the peptide bands can vary strongly from gel to gel a
reference curve on every gel is necessary. Figure 4.6 shows 0.1 µg to 1 µg peptide.
If necessary, smaller peptide amounts can be included in the reference curve of the
SDS-PAGE. The level of detection (LOD) is between 0.025 and 0.05 µg. By
evaluating the intensity of the peptide bands the equation of the reference curve can
be determined.
(Equation 4.2)

4 Results _________________________________________________________________
_________________________________________________________________ 49
Figure 4.6: Tricine-SDS-PAGE of reduced Aspidasept® and reference curve. (A) Level of
detection for reduced Aspidasept® samples. Sample amounts from 0.1 µg to 1 µg were applied
(sample concentration 1 µg peptide/10 µL volume). (B) Reference curve created from the results of
reduced Aspidasept® samples by evaluating the intensity of the peptide bands.
500 600 700 800 900 1000
0,0
0,2
0,4
0,6
0,8
1,0
Equation Y = A + B * X
-----------------------------
A = -1,2961
B = 0,0023
-----------------------------
R = 0,96642
Aspid
asept [µ
g]
Volume intensity

4 Results _________________________________________________________________
_________________________________________________________________ 50
4.1.5 Recovery of Aspidasept®
Before starting the experiments with Aspidasept® for this study, it was necessary to
test the recovery of the peptide under defined conditions. The peptide was solved in
0.01 % TFA and diluted to a 1 µg peptide / 10 µL 0.001 % TFA solution. During the
experiments, the peptide preparation was stored at room temperature (approx.
22 °C), 4 °C or -20 °C. The analysis was performed using RP-HPLC.
The series at 4 °C showed only a slight decrease in the peptide concentration (see
figure 4.7). After 168 h (7 days) still 97 % peptide was available. During the storage
at room temperature, the recovery decreased to 78 % in 168 h (7 days). Samples,
which were frozen and thawed after 1 day, showed an increase of dimers. Whereas
a sample that is applied immediately after dissolving has a monomer/ dimer ratio of
3/1, the frozen sample is characterized by a ratio of 1/1. However, the same total
peptide mass was detected independent from storage procedure.
Based on the results of the recovery experiments it was defined that peptide
standard solutions (1 mM in 0.01 % TFA) were stored at -20 °C to avoid peptide loss.
Samples with lower molarity were stored at 4 °C.
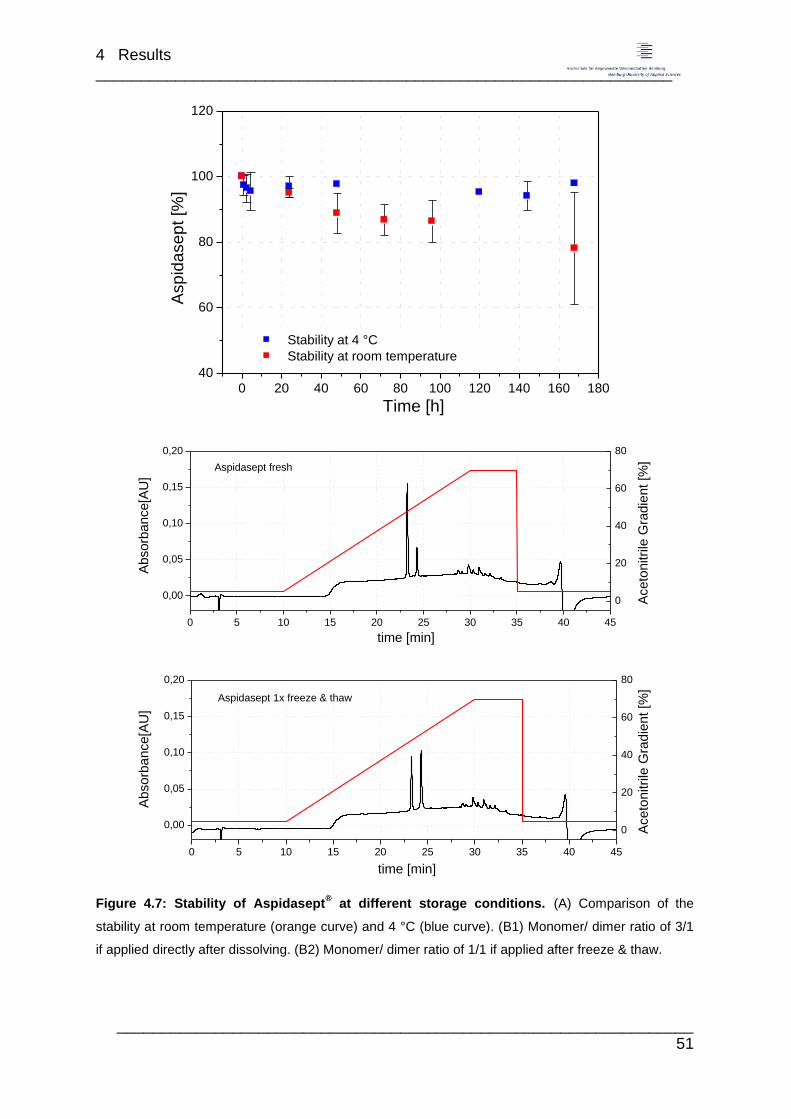
4 Results _________________________________________________________________
_________________________________________________________________ 51
Figure 4.7: Stability of Aspidasept® at different storage conditions. (A) Comparison of the
stability at room temperature (orange curve) and 4 °C (blue curve). (B1) Monomer/ dimer ratio of 3/1
if applied directly after dissolving. (B2) Monomer/ dimer ratio of 1/1 if applied after freeze & thaw.
0 20 40 60 80 100 120 140 160 180
40
60
80
100
120
Stability at 4 °C
Stability at room temperature
Asp
ida
se
pt
[%]
Time [h]
0 5 10 15 20 25 30 35 40 45
0,00
0,05
0,10
0,15
0,20
Aspidasept fresh
Absorb
ance[A
U]
time [min]
0
20
40
60
80
Aceto
nitrile
Gra
die
nt [%
]
0 5 10 15 20 25 30 35 40 45
0,00
0,05
0,10
0,15
0,20
Aspidasept 1x freeze & thaw
Ab
so
rba
nce
[AU
]
time [min]
0
20
40
60
80
Ace
ton
itrile
Gra
die
nt [%
]

4 Results _________________________________________________________________
_________________________________________________________________ 52
4.1.6 Verification of antimicrobial activity by radial diffusion assay
To assess the antimicrobial activity of the peptide Aspidasept® a radial diffusion
assay (RDA) was performed. Figure 4.8 shows an exemplary result of the performed
RDA. As positive controls Melittin, an antibiotic peptide found in bee`s venom, and
synthetic ALK-OH, an antimicrobial peptide were chosen. Both peptides showed an
inhibiting effect on the microbial growth at previous tests. For a negative control dem.
water was applied. To examine the impact of TFA, used for the dissolving and
storage of Aspidasept®, two different concentrations were tested.
Positive and negative controls showed the expected results. Melittin, at position 1
(50 µg/mL) and 2 (10 µg/mL) at the shown agar plate both displayed an inhibitory
effect. Dem. water (position 3) showed no impact on the bacterial growth. Whereas 1%
TFA (position 6) leaded to an inhibition zone, 0.01 % TFA (position 5) had no effect.
The inhibition of 1 % TFA can be classified as unproblematic. During this study
Aspidasept® was dissolved only in 0.01 % or 0.1 % TFA. The synthetic peptide ALK-
OH (40 µg/mL, position 4) displayed a similar positive inhibition effect as Melittin
(50 µg/mL).
However, Aspidasept®, among high tested concentrations, showed no growth
inhibition. At position 8 (5 µg/mL, lowest concentration) and at position (500 µg/mL,
highest concentration) exemplary results for Aspidasept® are displayed. But more
concentrations were tested (all concentrations were tested twice on different agar
plates, results shown in appendix C). Nevertheless, still the highest applied
concentration had no negative effect on the bacterial growth.

4 Results _________________________________________________________________
_________________________________________________________________ 53
Figure 4.8: Radial diffusion assay with Aspidasept® and synthetic ALK-OH. Substances were
applied at the positions 1 to 8: 1) Melittin [50 µg/mL], 2) Melittin [10 µg/mL], 3) dem. H2O, 4) synthetic
ALK-OH [40 µg/mL], 5) 0.01 % TFA, 6) 1 % TFA, 7) Aspidasept® [500 µg/mL], 8) Aspidasept
®
[5 µg/mL].
4.1.7 Sample concentration by solid-phase extraction
The solid-phase extraction should be developed for the concentration of larger
sample volumes. A sample concentration is often necessary due to the limitations of
the analytical methods, such as RP-HPLC and Tricine-SDS-PAGE. As described in
chapter 3.6.2 the SPE was performed with different sample volumes and
concentrations.
Until the end of the study it was not possible to obtain the desired results. The
elution fraction of the SPE only contains a small part of the applied Aspidasept®. The
Aspidasept® amount varies during the different experiments from 0 to only 10 %.
The waste of the sample application and washing steps were analyzed as well to
exclude a low binding of the peptide to the cartridge material. However, only very
small peptide amounts (3 – 10 % of the applied peptide amount) were found in these
samples.

4 Results _________________________________________________________________
_________________________________________________________________ 54
To investigate in the low recovery of Aspidasept® during the SPE procedure, the
sample evaporation with nitrogen was examined. Five samples (10 µg/mL) in
acetonitrile (100 %) were prepared, evaporated under nitrogen and dissolved in
200 µL 0.1 % TFA. RP-HPLC analysis showed that only a peptide recovery of 76.5 %
was obtained. This results in an approx. 25 % peptide loss during the evaporation
step.
Nevertheless, these results do not explain the low Aspidasept® amount in the elution
fraction of the SPE. An explanation for a possible loss is an uncompleted elution if
acetonitrile is applied or an irreversible adsorption of the peptide onto the
polypropylene material of the cartridge.
4.2 Elimination of Aspidasept® by activated carbon adsorption
The adsoption on activated carbon is one of the newest approaches for the
elimination of pharmaceuticals. During this trial the adsorption of Aspidasept® on
defined amounts of activated carbon at 10 °C or 20 °C was investigated. Using the
results of the 10 °C experiments the Freundlich-Isotherm was determined.
4.2.1 Adsorption in demineralized water at 10 °C
In a first approach, the kinetic (time course of the adsorption) was evaluated.
Keeping the initial peptide concentration c0 constant, a granulated activated carbon
(GAC) variation with five different concentrations was performed. The time
dependent adsorption of the peptide in solution was observed for 48 h. Figure 4.9
displays the adsorption kinetics at 10 °C. For any GAC concentration the
concentration equilibrium ceq between peptide in solution and adsorbed peptide were
reached after 24 h. In case of the highest GAC amount (0.5 g) the adsorption
equilibrium was attained after 5 h.

4 Results _________________________________________________________________
_________________________________________________________________ 55
Figure 4.9: Activated carbon adsorption of Aspidasept® on varying amounts of activated
carbon at 10 °C. The adsorption was observed for 48 h. The activated carbon quantities 0.05, 0.075,
0.1, 0.2 and 0.5 g were tested (n = 2).
Using the end concentrations of the kinetic experiments, the adsorption equilibriums
were determined and thereof the resulting Freundlich-Isotherm (see equation 2.3)
was calculated. In table 4.2 the results of the GAC loading calculations are listed.
For the calculation equation 2.2 was used.
Table 4.2: Equilibrium concentration and calculated GAC
loading.
mGAC [g] ceq [g/L] qeq [µg/gGAC]
0.05 0.065 7.028
0.075 0.045 7.332
0.1 0.034 6.624
0.2 0.022 3.892
0.5 0.010 1.798
In double logarithmic qeq/ceq – diagram the linear regression can be used for the
parameter calculation of the Freundlich-Isotherm. For the calculation of the
0 100 200 300 2000 3000
0
20
40
60
80
100 activated carbon
0.05 g 0.075 g
0.1 g 0.2 g
0.5 g
Asp
ida
se
pt
in s
olu
tio
n [
%]
time [min]

4 Results _________________________________________________________________
_________________________________________________________________ 56
Freundlich-Isotherm the experiments with the lowest GAC concentration was
excluded. These experiments were performed with a too low concentration. Figure
4.10 displays the double logarithmic qeq/ceq – diagram with calculated linear
regression.
Figure 4.10: Double logarithmic qeq/ceq – diagram with calculated linear regression. The
equation of the linear regression can be used for the determination of the Freundlich-Isotherm. The
red data is excluded from the calculation for the Freundlich-Isotherm.
The equation for the Freundlich-Isotherm was calculated using equation 2.3.
Whereas the parameter n is equal the slope of the linear regression, the parameter
K can be calculated with the values of any experiment. For the Freundlich-Isotherm
the mean of the K-values were used. For the performed experiment series a rather
linear Freundlich-Isotherm was determined (n ~ 1).
Linear regression: (Equation 4.3)
Freundlich-Isotherm: (Equation 4.4)
10 100
1
10
Equation Y = A + B * X
-----------------------
A = - 0.72937
B = 0.98484
-----------------------
R = 0.99304
qeq [µ
g/g
GA
C]
ceq
[µg/L]

4 Results _________________________________________________________________
_________________________________________________________________ 57
4.2.2 Adsorption in demineralized water at 20 °C
To examine the impact of the temperature of the peptide adsorption on granulated
activated carbon the 10 °C values were compared with the data of the 20 °C
experiments. The experiments at 20 °C were performed with 0.1 g and 0.5 g
activated carbon. Figure 4.11 shows the comparison between the obtained data. In
both cases, the exponential curves located closely together. For both temperatures
equal adsorption equilibriums were determined. The experiments with 0.1 g
activated carbon, results in approx. 34 % peptide in solution after 48 h. For the tests
with 0.5 g the equilibrium was 10 %. Although the equilibrium seems to be
temperature independent, the speed of adsorption indicates minor differences. For
both activated carbon concentrations a slightly faster adsorption at a temperature of
20 °C was obtained.
Figure 4.11: Comparison of activated carbon adsorption at 10 °C and 20 °C with 0.1 g and 0.5 g
activated carbon. The adsorption was observed for 48 h. No significant differences in terms of
adsorption speed and equilibrium between the temperatures were determined.
0 100 200 300 2000 3000
0
20
40
60
80
100 10 °C with 0.5 g activated carbon
20 °C with 0.5 g activated carbon
20 °C with 0.1 g activated carbon
10 °C with 0.1 g activated carbon
Asp
ida
se
pt
in s
olu
tio
n [
%]
time [min]

4 Results _________________________________________________________________
_________________________________________________________________ 58
4.3 Membrane filtration
The next chapter deals with the Aspidasept® filtration. Starting with the test of
recovery in different buffers and the adsorption of the peptide on various membranes
the filtration was planned. Prior filtration the Cut-Off of the membrane UA60 was
determined. The peptide filtration was than performed with pressure variances. The
filtration trials were performed with the help of Lukas Cordts (Bachelor Thesis, 2018).
4.3.1 Membrane adsorption and buffer recovery of Aspidasept®
Before starting the membrane filtration trails it is required to investigate the recovery
of Aspidasept® under different buffer conditions and the adsorption behavior of the
peptide in presence of various membranes. Figure 4.12 displays the results of the
recovery test in selected buffers. For each tested buffer the composition is listed in
chapter 3.7.2.2. It can be seen, that for each buffer the peptide in solution has not
decreased fewer than 20 % within the sample period of 3 h. No significant
differences in recovery results from the used buffers. Only 0.1 % TFA showed an
increased recovery in comparison to physiological buffer systems.
Figure 4.12: Aspidasept® recovery in the presence of different buffers and salt. The peptide
recovery of 0.1 % TFA, dem. H2O and the buffers acetate, HEPES and Tris (pH 7 and pH 9) were
tested over 3 h. Samples were taken after 0 min, 30 min, 1 h and 3 h. After 3 h in all buffer systems a
peptide concentration of over 80 % was left.
TFA H2O Acetat HEPES Tris pH 7 Tris pH 90
20
40
60
80
100
Sample time:
0 min
30 min
1 h
3 hAsp
ida
se
pt
in s
olu
tio
n [
%]

4 Results _________________________________________________________________
_________________________________________________________________ 59
Subsequently it was essential to verify the adsorption of the peptide at membranes
used for the filtration. Although only the membrane UA60 was used for the filtration,
the membranes XLE, NF90 and NF270 were tested as well to examine the influence
of the pore size distribution on the adsorption behavior. The test series with all four
membranes was performed in 0.1 % TFA. As buffer system Tris with a pH of 7 was
chosen but only tested with the membrane UA60.
Figure 4.13 shows the results of the membrane adsorption within 3 h. For each
membrane a strong decrease of the peptide concentration during 3 h was obtained.
The results for the adsorption of the XLE and NF90 membranes in 0.1 % TFA give
values around 90 % Aspidasept® in solution (10 % loss). The prior performed
recovery tests showed a peptide concentration of 95 % after 3 h in 0.1 % TFA
without membrane. Thus, only a small amount of peptide is adsorbed to the XLE and
NF90 membranes. For the NF270 (65 % in solution) and UA60 (56 % in solution) a
much higher adsorption rate is observed. Thus, it must be assumed, that with
surpassing of a certain pore size the adsorption of the peptide takes place not only
on the surface of the membrane but as well in the pores of the membrane. If
changing 0.1 % TFA to Tris (pH 7) a similar adsorption result for the UA60
membrane is achieved. Even tough 47 % of the peptide is left in solution it has to be
mentioned that the peptide recovery in Tris (pH 7) is significantly lower than in 0.1 %
TFA.

4 Results _________________________________________________________________
_________________________________________________________________ 60
Figure 4.13: Aspidasept® adsorption on the membranes XLE, NF90, NF270 and UA60 in 0.1 %
TFA and Tris (pH 7). Samples were taken after 0 min, 30 min, 1 h and 3 h. After 3 h an extremely
high decrease of the Aspidasept® concentration in solution was determined. With increase of the pore
sizes of the membranes the decrease of the peptide concentration enlarged.
To exclude the impact of the membrane to the RP-HPLC analysis negative controls
with all membranes in all buffers were performed. Since the results showed that the
RP-HPLC analysis showed no membrane extractables (data not shown) it was
assumed that the membrane sample matrix has no influences on the RP-HPLC
measurement.
4.3.2 Cut-Off determination of UA60 membrane
The Cut-Off of the membrane UA60 was determined to confirm the manufacturer
specifications which were declared at a range of 1000 Da. Using the substances DL-
Tryptophan, L-Glutathione, Bromophenol blue, Vitamin B12 and Lysozyme
(molecular weight 204 – 14300 Da, see table 3.15) the Cut-Off at a recovery rate of
90 % was calculated. With the help of these substances a Cut-Off of approx. 670 Da
was estimated. This is lower than expected. Different options are possible for the
deviations. On one side is the manufacturer specification only range specifications,
TFA XLE TFA NF90 TFA NF270 TFA UA60 Tris pH 7 UA600
20
40
60
80
100
Sample time:
0 min
30 min
1 h
3 h
Asp
ida
se
pt
in s
olu
tio
n [
%]

4 Results _________________________________________________________________
_________________________________________________________________ 61
on the other hand substances with different structure were used. These structures
could affect the interaction of substance and membrane in different ways which is
why the recovery is not only influenced by the molecular weight but as well from the
structure of the individual substance.
Figure 4.14: Cut-Off determination of membrane UA60. The Cut-Off determination was performed
with five substances with different molecular weight (204 – 14300 Da, for specific information about
the used substances and the molecular weight see table 3.15). The Cut-Off was calculated at a
recovery of 90 %. This equals a molecular weight of approx. 670 Da. All filtrations were performed
twice, n = 2.
4.3.3 Aspidasept® filtration with UA60 membrane
The peptide filtration was performed with the UA60 membrane and an Aspidasept®
solution in Tris buffer to obtain a physiological environment. Because the calibration
curve for peptide in 0.01 % TFA was not suitable for peptide dissolved in Tris buffer
a new calibration curve in Tris buffer was necessary. In Tris buffer the obtained
values are significant lower than in 0.01 % TFA, mostly due to a low solubility and a
fast precipitation. Figure 4.15 displays the calibration curve for Aspidasept® in Tris
buffer.
100 1000 10000
0
20
40
60
80
100
Re
co
ve
ry [
%]
Molecular Weight [Da]

4 Results _________________________________________________________________
_________________________________________________________________ 62
Figure 4.15: Calibration curve of Aspidasept® dissolved in Tris buffer determined by RP-HPLC
analysis. The samples were reduced using 3.33 mM DTT. The reference curve was obtained by
calculating the area under the curve.
The peptide filtration experiments were carried out according to chapter 3.7.2.4. The
samples were analyzed by RP-HPLC and calculated by the help of the Tris
reference curve. To obtain reliable results all experiments were repeated with a
second UA60 membrane sheet (see table 4.3 and 4.4). It was necessary to prepare
a second peptide solution after two experiments because the recovery in Tris buffer
was lower than expected.
0 1 2
0,000
0,005
0,010
0,015
0,020
Equation Y = B * X
-----------------------
B = 0,00901
-----------------------
R = 0,9999
Are
a u
nder
the c
urv
e [A
U m
in]
Aspidasept [µg]

4 Results _________________________________________________________________
_________________________________________________________________ 63
Table 4.3: Pressure variation peptide filtration with membrane 1. The pressures 8 – 16 bars were
tested. Between the 10 bar experiments new peptide solution were prepared. The area under the
curve (RP-HPLC) of the Feed, Retentate and Permeate and the total amount of peptide (mg) are
listed. The unit of the area under the curve is AU min. The total recovery is calculated by the recovery
in the retentate and permeate.
Pressure Feed Retentate Permeate Recovery
bar AU min mg AU min mg % AU min % %
8 0.0077 1.7 0.0054 0.9 52.7 0.000 0 52.7
10 0.0036 0.8 0.0041 0.7 85.7 0.000 0 85.7
10 0.0113 2.5 0.0085 1.4 56.2 0.000 0 56.2
12 0.0057 1.3 0.0038 0.6 49.1 0.000 0 49.1
16 0.0021 0.5 0.0020 0.3 71.0 0.000 0 71.0
Table 4.4: Pressure variation peptide filtration with membrane 2. The pressures 8 – 16 bars were
tested. Between the 10 bar experiments new peptide solution were prepared. The area under the
curve (RP-HPLC) of the Feed, Retentate and Permeate and the total amount of peptide (mg) are
listed. The unit of the area under the curve is AU min. The total recovery is calculated by the recovery
in the retentate and permeate.
Pressure Feed Retentate Permeate Recovery
bar AU min mg AU min mg % AU min % %
8 0.0046 1.0 0.0037 0.6 60.7 0.000 0 60.7
10 0.0023 0.5 0.0026 0.4 84.5 0.000 0 84.5
10 0.0092 2.0 0.0077 1.3 63.0 0.000 0 63.0
12 0.0036 0.8 0.0021 0.3 42.6 0.000 0 42.6
16 0.0006 0.1 0.0005 0.1 72.8 0.000 0 72.8
Figure 4.16 displays the means of the performed experiments with two UA60
membranes. The trials with pressure variation showed no tendency in recovery. In
all experiments, the RP-HPLC analysis showed an absence of Aspidasept® in the
permeate. Thus, it can be assumed that the chosen membrane was too tight for the
peptide to pass. However, the obtained values of the retentate showed that it was
not possible to retrieve the peptide concentration of the feed. A high peptide loss
was calculated. Only recovery rates from approx. 40 to 85 % were achieved. The

4 Results _________________________________________________________________
_________________________________________________________________ 64
peptide loss probable can be explained by a high adsorption on the membrane or
the filtration equipment.
Figure 4.16: Recovery of the peptide filtration with pressure variation. The mean was calculated
with the data from table 4.3 and 4.4. The tests were performed from the lowest pressure to the
highest. Between the two 10 bar experiments a new test solution was prepared. n = 2.
During the filtration study reference filtrations with water and constant pressure were
performed to observe possible blocking of the membrane. Figure 4.17 displays the
obtained data. The first reference filtration was performed prior the first filtration with
peptide. A permeate flux of 133 L/(h·m2) was obtained. Reference number 6
corresponds to the filtration with water after the last peptide filtration at 16 bar. The
permeate flux decreased to 90 L/(h·m2). A reduction of the permeate flux of 32 %
were caused by the five peptide filtration steps.
8 10-1 10-2 12 160
20
40
60
80
100R
eco
ve
ry [%
]
Pressure [bar]
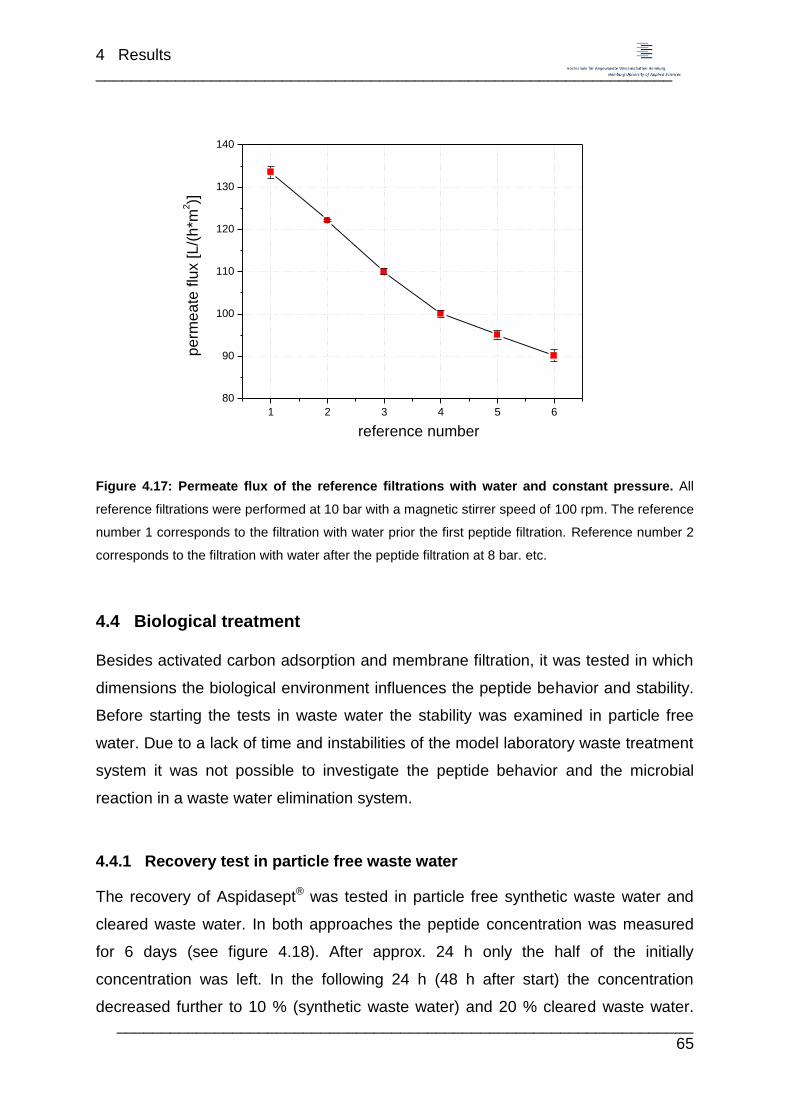
4 Results _________________________________________________________________
_________________________________________________________________ 65
Figure 4.17: Permeate flux of the reference filtrations with water and constant pressure. All
reference filtrations were performed at 10 bar with a magnetic stirrer speed of 100 rpm. The reference
number 1 corresponds to the filtration with water prior the first peptide filtration. Reference number 2
corresponds to the filtration with water after the peptide filtration at 8 bar. etc.
4.4 Biological treatment
Besides activated carbon adsorption and membrane filtration, it was tested in which
dimensions the biological environment influences the peptide behavior and stability.
Before starting the tests in waste water the stability was examined in particle free
water. Due to a lack of time and instabilities of the model laboratory waste treatment
system it was not possible to investigate the peptide behavior and the microbial
reaction in a waste water elimination system.
4.4.1 Recovery test in particle free waste water
The recovery of Aspidasept® was tested in particle free synthetic waste water and
cleared waste water. In both approaches the peptide concentration was measured
for 6 days (see figure 4.18). After approx. 24 h only the half of the initially
concentration was left. In the following 24 h (48 h after start) the concentration
decreased further to 10 % (synthetic waste water) and 20 % cleared waste water.
1 2 3 4 5 6
80
90
100
110
120
130
140
pe
rme
ate
flu
x [
L/(
h*m
2)]
reference number

4 Results _________________________________________________________________
_________________________________________________________________ 66
The experiment showed that the recovery of Aspidasept® in particle free waste water
is significant lower as in dem. water (approx. 80 % after 7 days). Here, it should be
considered, that with centrifugation probable not all particles were removed which
support the adsorption and precipitation of the peptide.
F
Figure 4.18: Aspidasept® recovery in particle free waste water over the time period of 6 days. A)
Recovery in synthetic untreated waste water. B) Recovery in cleared waste water (by laboratory
waste water treatment). All samples were analyzed by RP-HPLC. The control corresponds to an
Aspidasept® concentration of zero.
22,5 23,0 23,5 24,0 24,5
0,00
0,05
0,10
0,15
control
0 h
1.5 h
3.25 h
20.75 h
27.25 h
48 h
72 h
6 d
Ab
so
rba
nce
[A
U]
time [min]
22,5 23,0 23,5 24,0 24,5
0,00
0,05
0,10
0,15
control
0 h
0.5 h
1.5 h
20.75 h
27.25 h
48 h
72 h
6 d
Ab
so
rba
nce
[A
U]
time [min]

4 Results _________________________________________________________________
_________________________________________________________________ 67
4.4.2 Elimination in waste water
For this trial untreated waste water was mixed with Aspidasept®. After a defined
incubation time solid components were centrifuged and analyzed by SDS-PAGE.
The cleaned supernatant was applied on the RP-HPLC. The analysis with RP-HPLC
showed the absence of the peptide in the supernatant. For all peptide
concentrations (up to 100 µg/mL) the RP-HPLC was not able to detect the peptide.
The analysis with SDS-PAGE showed different result. Here it was possible to prove
the presence of Aspidasept®. Table 4.5 shows the results of the SDS-PAGE with the
recovery rates of the peptide. For the quantities 0, 1, 5 µg no peptide band was
observed. It has to be assumed that the quantity is below the detection limit. The
results were excluded in the result table. The original gels can be found in figure
4.19.
Table 4.5: SDS-PAGE results of the peptide elimination in waste water. The results of Gel 3-6
are evaluated. The total quantity is the amount of recovered peptide after the including of all
concentration and dilution steps.
Sample
[µg]
Gel no./
lane no.
Band
intensity
Quantity on
gel [µg]
Total
quantity [µg]
Recovery
[%]
10 3/ 8 1,522,158 2.44 5.94 59.4
10 4/ 8 1,951,554 2.97 4.88 48.8
25 3/ 10 1,379,730 2.15 21.5 86.0
25 4/ 10 1,367,718 1.72 17.2 68.8
50 5/ 8 765,700 0.71 35.5 71.0
50 6/ 8 504,465 0.40 20.0 40.0
100 5/ 10 771,290 0.72 72.0 72.0
100 6/ 10 595,140 0.71 71.0 71.0
Recoveries between 40 % and 86 % were obtained. Samples applied on different
gels show partly strong variances. With increasing start quantity, the recovery,
seems to be higher.

4 Results _________________________________________________________________
_________________________________________________________________ 68
Figure 4.19: Peptide elimination in waste water. Various peptide quantities were added to waste
water. After centrifugation the particle containing solution was applied onto the SDS-PAGE. The
marker is applied on lane 1. Lanes 2 to 6 are used for the reference curve required for quantification.
The lanes 7 to 10 contain the analyzed samples.

5 Discussion _________________________________________________________________
_________________________________________________________________ 69
5 Discussion
An aim of this study was the analytical characterization of the antiseptic peptide
Aspidasept® in terms of general behavior, stability and antimicrobial activity. For that
purpose, methods for RP-high performance liquid chromatography and SDS-PAGE
were established. Furthermore, a radial diffusion assay was used to examine the
antimicrobial activity against Escherichia coli and the solid phase extraction
technology was tested for the sample preparation and concentration.
Both, RP-HPLC and SDS-PAGE demonstrated to be appropriate for the analyses of
peptide samples. Whereas the RP-HPLC needs clean (achieved by centrifugation or
0.45 µm filtration) samples, the SDS-PAGE showed less vulnerability and thus can
be used for the analysis of waste water samples. However, the analytical accuracy
of the methods is different. For the RP-HPLC a coefficient of variation of 1.0 to 7.3 %
was obtained. The SDS-PAGE showed a much lower accuracy not only between
two gels but as well between the same samples at the same gel. In literature a
coefficient of variation for the HPLC of < 1 % is specified as accurate (Kromidas,
2014). However, the coefficient of variation is depending on the used column, the
chromatographic conditions and the substance which is to be analyzed. But as
literature is giving a higher coefficient of variation for research methods, the obtained
results were accepted as sufficiently accurate for the desired purpose. Thus, if
possible, the sample analysis should be performed by RP-HPLC to minimize the
analytic error. Only in cases where it is necessary to examine untreated samples
with sewage particles or other impurities an SDS-PAGE should be chose.
Still both methods showed similar results regarding quality and stability. As well the
quantification with a standard reference curve is for both methods possible even
though it is more precisely if the RP-HPLC is used. If Aspidasept® is examined
chemically untreated two peaks (in RP-HPLC) respectively two bands (SDS-PAGE)
are obtained. The same sample reduced with DTT prior analysis, results in a single
peak (in RP-HPLC) or rather a single band (SDS-PAGE). Thus, it appears that a
dimerization of the peptide is responsible for the second signal. As DTT is reducing
disulfides (Cleland, 1964), only the peptide monomer is detected. Thus, it can be

5 Discussion _________________________________________________________________
_________________________________________________________________ 70
assumed that the dimerization bridge is formed between the amino acid cysteine at
position 2 of the Aspidasept® sequence. Cysteine is based on a sulfhydryl
connection in the side chain. This connection is oxidized in aquatic solution in the
presence of atmospheric oxygen. As well the formation of dimers seems to be a time
and temperature dependent process. Freshly prepared peptide showed a
significantly lower dimer ratio than a peptide solution which is frozen and thawed
after a few days. During the freeze & thaw process the peptide is exposed to oxygen.
As a result, the dimerization process will have more time to develop disulfide bridges.
But not only has the exposure to oxygen an impact on the peptide behavior. Tests at
different temperatures showed a temperature dependent recovery of the peptide. At
room temperature (between 20 °C and 23 °C) only a recovery of approx. 80 % was
obtained over a period of 7 days. At 4 °C almost 100 % of the peptide could be
recovered after 7 days. Even if this test results in acceptable results for this trial,
more tests should be performed to increase the recovery. The application of different
chemical stabilizers could enhance the recovery. As well, the dimerization process
should be examined further.
Although only two peaks in the RP-HPLC (one in reduced samples) are detected,
the SDS-PAGE showed three bands (two in reduced samples). Two bands can be
explained by the prior discussed formation of dimers. The third band, with a smaller
molecular weight as the monomer is independent of the sample treatment and
increases with increase of the applied quantity of sample. However, the intensity of
the band is in any case significantly below the bands for the monomer or dimer.
Even though it is possible that these faint bands correspond to degradation products
of the peptide, it is more likely that the bands indicate a peptide with a different
conformation. The RP-HPLC supports this assumption as well. Degradation
products would show a different retention in the RP-HPLC. Whereat, peptides with
different conformations could have the same retention time. As a result of this it was
decided that the faint bands were included into the calculations for the
quantifications.
The test for antimicrobial activity with the radial diffusion assay showed no growth
inhibitory effect of Aspidasept® on the used Escherichia coli strain. It has to be
assumed, that the peptide has no antimicrobial activity or that the test is not suitable
5 Discussion _________________________________________________________________
_________________________________________________________________ 71
for the proof of an antimicrobial activity. For similar peptides it was possible to prove
the antimicrobial activity with the help of the assay. Thus, the test is definitely
appropriate for the evidence of the inhibition of bacterial growth by peptides.
Nevertheless, in various trials it was possible to detect an antibacterial effect
against gram-negative bacteria such as Escherichia coli (e.g. Gutsmann et al., 2010).
Still in this study a different test approach, microdilution susceptibility assay was
used. The microdilution susceptibility assay is a common method for the first
assessment of bacterial inhibition (Otvos and Cudic, 2007) and is based on the
bacterial growth in broths in the presence of peptides or antibiotics. This assay has
the benefits of a homogenous bacteria-peptide-solution and eliminated the
restrictions of peptide diffusion inside solid agar. For that reason, it should be
considered to perform a microdilution susceptibility assay if an antibacterial activity
should be proved. As well it should be mentioned, that the radial diffusion assay was
performed with an old charge of the peptide which could have an influence on the
activity. Moreover, it the activity was only examined with one Escherichia coli strain.
To assess the impracticality of the radial diffusion assay for Aspidasept® a control
with different bacteria strains should be considered.
The behavior and elimination of the peptide in different waste water treatment
methods was examined afterwards. First, the adsorption on granulated activated
carbon was investigated. With various amounts of GAC and two different
temperatures the adsorption equilibrium was determined and the kinetics were
examined. The investigation of the adsorption equilibrium confirmed the expected
results. With increasing amount of GAC the equilibrium was reached in a shorter
period of time. Using the in figure 4.9 displayed data a loading saturation can be
seen. The obtained data converge to a maximum (last three data point, inclusive
excluded data point, displayed in figure 4.9). With increasing amount of peptide still
no increase of the loading of the adsorbent is achieved. To confirm this presumption,
further experiments should be made.
The obtained Freundlich-Isotherm (equation 4.4) can provide information about the
adsorption capability of the substance. The received n for the Freundlich-Isotherm
has a value of approx. 1. This means that the loading of the adsorbents changes
proportional to the concentration of the substance which is adsorbed (Lohrengel,

5 Discussion _________________________________________________________________
_________________________________________________________________ 72
2012). Even though a value below 1 is favorable for the parameter n (the used
amount of adsorbent can be decreased), a value higher than 1 would be not
economically (Lohrengel, 2012). The second parameter K which is used for the
definition of the Freundlich-Isotherm describes the how proficiently a substance is
adsorbing (Worch, 2012). The higher the value is, the higher the loading of the
adsorbent is. During this study a value of K of 0.187 was obtained. In comparison to
values found in literature, this value is low for the adsorption on activated carbon.
Still these values were obtained for the adsorption of antibiotic and thus not really
comparable. Until now two independent studies were performed at the university
investigating the adsorption of different antibiotics. Lichtenberg (2017) observed the
adsorption of Sulfamethoxazole (SMX). During the study K values between 3 - 10
[µgSMX/gGAC]n with n ~ 0.4 – 0.54 was obtained (Lichtenberg, 2017). The second
study is examining the adsorption of Trimethoprim (TMP). Romanow (2017)
achieved as isotherm parameters K ~ 1.4 – 2.4 [µgTMP/gGAC]n and n ~ 0.6 – 0.96. For
the adsorption of antibiotics disparately higher values for K were achieved. Thus it
has to be mentioned that for antibiotics a higher adsorbent loading capacity is
obtained which makes it more economically than the adsorption of Aspidasept®.
The temperature variation from 10 °C to 20 °C showed no changes in terms of the
adsorption equilibrium. Still it can be seen, that the equilibrium at 20 °C was reached
faster for both examined GAC concentrations than for 10 °C. This, however, is in
counter to the common information found in literature. Even though it is known that
the equilibrium is influenced by the concentration of substance which is adsorbed
and the temperature, literature specifies that with increasing temperature the
adsorption decreases (Worch, 2012). Since it cannot be assumed that the obtained
data are not appropriate (all test were performed twice) or the peptide behaves
different to the common scenarios. Reasons for that could be the characteristic
structure of a peptide different from those in the literature. To obtain clarification how
the adsorption process is affected by the temperature further investigations are
necessary.
However, not only the temperature can have an impact on the adsorption capacity.
The pH as well as the ionic strength of the adsorption matrix can show an influence
on the adsorption capability of activated carbons (Al-Degs et al., 2008). During the

5 Discussion _________________________________________________________________
_________________________________________________________________ 73
adsorption the peptide was dissolved in 0.1 % DMSO. After dilution with dem. water
an almost neutral pH was obtained. By reducing the pH to an acidic environment
(e.g. use of TFA) the adsorption capacity could be increased (Al-Degs et al., 2008).
However, in this case, a greater variance from the normal environmental conditions
would be obtained (waste water shows an almost neutral pH). An increase ionic
strength (addition of buffer salt) would help to reduce the peptide in solution. But
most probably the reduction would be obtained not by increasing the adsorption
capability, but rather by increasing the precipitation. This indicates the results of the
recovery tests in various buffer salts (see chapter 4.3.1). In these trials the
precipitation is supported by the addition of buffers and NaCl.
The purification of waste water using activated carbon is a frequently investigated
process. Various studies examined the adsorption possibility of different amino acids
and toxic peptides. A research group studied the adsorption of the toxic compounds
cylindrospermopsin and microcystin (cyclic heptapeptide) from cyanobacteria on
powdered activated carbon (PAC) under simulated conditions of a waste water plant
(Ho et al., 2011). During this study it was possible to remove the toxic substances by
PAC. Here it became evident that the adsorption capacity increased with decreasing
particle diameter. A second study describes the adsorption of single amino acids on
activated carbon (Cermakova et al., 2017). They discovered a strong impact on the
adsorption of different amino acids which is dependent on electrostatic and
hydrophobic interactions. With increasing ionic strength of the solution the
adsorption decreased. With increasing hydrophobicity of the amino acid the
adsorption decreased as well. Both studies provide guidance how the environmental
conditions of the adsorption process influences the adsorption and which steps
could be made to increase the process. Instead of GAC which was used during this
thesis, the adsorption on PAC should be observed as well.
Summarizing it can be seen that the adsorption on activated carbon showed not only
expected results. Nonetheless, the adsorption of Aspidasept® on granulated
activated carbon is readily possible and suitable for the waste water treatment. Still,
a lot of research is necessary to completely understand the influences of the
adsorption and to develop the most economical way of peptide elimination.
Furthermore, only adsorption tests in dem. water were performed. If the trails would

5 Discussion _________________________________________________________________
_________________________________________________________________ 74
be repeated in a synthetic waste water matrix, compounds of the matrix could
influence the adsorption of the peptide. Moreover, components, such as antibiotics,
found in the non-synthetic waste water of local sewage plants will have an impact of
the adsorption of the target compound (Worch, 2012). In addition, it is not possible to
use the Freundlich-isotherm or other common isotherms if a multi-component is
present (Benström, 2017).
A more or less recent sewage treatment method for the elimination of
pharmaceuticals from waste water is the nanofiltration. Before starting the filtration
trials, the peptide stability and the peptide adsorption at the membrane was
observed. The recovery test in various solutions showed similar trends for the
different tested buffers. After 3 h the Aspidasept® concentration decreased to approx.
80 %. The used buffers consist of similar components. The buffers salt in a low
concentration and NaCl in a higher concentration which is equal for each buffer.
Thus, it can be assumed, that the ionic strength of each buffer is very similar. The
ionic strength as well as the pH has an impact on the stability of peptides (Léonil,
1994). Since no significant differences between the buffers in terms of recovery were
observed, the Tris buffer and 0.1 % TFA were used for further membrane adsorption
tests. These tests showed that with increasing pore size the adsorption at the
membrane increases. The peptide seems to be small enough to diffuse into the
pores. With increasing pore size an easier entrance into the pore is guaranteed
which is why the adsorption increases. This adsorption can only be prevented by
using a membrane which does not support the interaction with the peptide. Still more
investigations should be made to examine if at a specific pore size the membrane
adsorption reaches a maximum.
To specify the used membrane, the Cut-Off was determined. The Cut-Off is used for
the determination of the recovery of different molecular weights (Melin and
Rautenbach, 2007). According to manufacturer specification the Cut-Off should be in
the range of 1000 Da. During this study only a cut-off of approx. 670 Da was
determined. For this deviation various reasons could be named. If determining the
Cut-Off it is necessary to prevent the formation of surface layer (Melin and
Rautenbach, 2007). This layer would increase the recovery of the substances used
for the trials (Melin and Rautenbach, 2007). During this study a larger volume than

5 Discussion _________________________________________________________________
_________________________________________________________________ 75
required was filtrated for the Cut-Off determination. Thus, a formation of a surface
layer is likely. For some substances (e.g. Bromophenol blue, Vitamin B12) a surface
layer even could be observed. On the assumption that these surface layers change
the filtration behavior of the membrane a too low Cut-Off was determined. But as
well other reasons could be assumed. For the determination of the Cut-Off
significantly different substances were used. These substances show different
interactions with the membrane which will influence the filtration behavior. In
considerations of the named factors the obtained Cut-Off can only be seen as an
approximate value. Nevertheless, the membrane was used for first filtration trials of
Aspidasept®.
The filtration with the membrane UA60 showed no Aspidasept® in the permeate at
any time. Still it was not possible to recover 100 % peptide in the retentate.
Depending on the applied pressure, the recovery of the peptide fluctuates. No clear
trend can be determined. A blocking of the membrane however can be recognized.
The reference filtrations with water performed prior and after each peptide filtration,
show a strong decrease of the flux. Thus, it must be assumed, that the peptide is
irreversible interacting with the membrane. The low recovery is probably favored by
the low stability of the peptide in Tris buffer which leads to precipitation and further
blocking of the membrane. As well interactions of the peptide with the stainless steel
filtration housing and the magnetic stirrer cannot be excluded. Further filtration
studies using membrane UA60 should not be implemented. If the nanofiltration of
Aspidasept® should be examined further a different membrane should be chosen. To
exclude the interactions of the peptide with the membrane a coating with a protein
such as bovine serum albumin or e.g. with cross-linked poly (ethylene glycol)
diacrylate should be considered (Ju et al., 2009). Coatings like that could prevent
the fouling of the membrane by the peptide. Furthermore, it is necessary to spend
time for the establishment of a different buffer. If Tris buffer is continuously used, the
recovery issue will remain.
The last part of this study was the examination of Aspidasept® behavior in differently
treated waste water samples. Peptide samples were added to synthetic waste water
and cleared waste water (both purified by centrifugation). The course of the peptide
concentration over 6 days showed a strong decrease. With only 50 % of the initial
5 Discussion _________________________________________________________________
_________________________________________________________________ 76
concentration a significant lower amount is left than in the recovery studies in dem.
water. This is confirmed by the further course of the study (only 10 % left after 6
days). In cleared waste water a slightly higher recovery is detected. The low
obtained recovery rate in both experimental designs can be explained by remaining
particles which were not removed during the pretreatment of the waste water. The
particles have an effect as adsorbent and the peptide will be adsorbed over the time
which leads to a reduction of measurable Aspidasept® in solution. But a second
reason has to be discussed as well. The waste water samples were not filtrated or
treated in a similar way to obtain a sterile environment. As well it was necessary to
open the sample vial for the sampling. Thus, additional germs could enter the vial.
Until now it is not known if microbial contaminations have an impact on the peptide
stability. Possible effects were degradation or a supported precipitation of the
peptide. Unfortunately it is not feasible to detect these processes using the available
methods. For the investigation of these processes a mass spectrometer is required.
Further studies shall examine degradation process to distinguish them from simple
adsorption.
To examine the influence of particles on Aspidasept® untreated waste water was
used. After the incubation period is was not possible to detect peptide in solution.
The waste water particles show a peptide adsorption. Recoveries from 40 % to 86 %
were obtained. Not only between two samples with equal initial peptide
concentration but also over the whole experimental setup large deviations appeared.
Many reasons could be named trying to explain this variability. Even though the
used waste water was homogenized before splitting up into the single experiments is
cannot be excluded that in some sample vials more particles are present. As well is
the analysis with SDS-PAGE not that reliable than with RP-HPLC. The evaluation of
the SDS-PAGE is more error-prone. Moreover, a higher recovery with increasing
initial peptide amount can be noticed. To examine if the initial peptide amount have
an effect on the recovery it is necessary to perform more experiments with varying
peptide concentrations. Still it cannot be excluded that the peptide is adsorbing onto
the equipment used during this study which would lead to a lower recovery.
During this study it was only possible to start the investigation of the peptide
behavior in synthetic waste water. Though the first obtained results showed that the

5 Discussion _________________________________________________________________
_________________________________________________________________ 77
peptide tend to adsorb on the particles it is not known until now if a degradation
process takes place. As well it could be interesting to explore the behavior of the
microbes and protozoa in the presence of Aspidasept®.

6 Conclusion and Outlook _________________________________________________________________
_________________________________________________________________ 78
6 Conclusion and Outlook
During this study a characterization of the peptide Aspidasept® was successfully
performed. Analytical methods were established and the formation of dimers was
observed. Still it was not possible to prove the antimicrobial activity of the peptide.
The handling of the peptide provides some great challenges. In the presence of
buffer salts low recovery rates were received. First results in terms of peptide
elimination on different stages of waste water plants were obtained. The results of
the adsorption study on activated carbon indicate the good feasibility of the method
for the purification of peptide contaminated waste water. The membrane filtration
with a 1000 Da flat filter results in a complete peptide retention but as well in a low
recovery due to precipitation and adsorption of the peptide. First experiment in
synthetic and clarified waste water showed an adsorption of the peptide on waste
water particles and thus purification is achieved.
Even though good results were obtained during this study a lot of work has to be
performed to fully understand the behavior of Aspidasept® in different environmental
conditions. It has to be determined in which case peptide precipitation, adsorption or
degradation takes place. To prove the antimicrobial activity and to find a process for
peptide concentrations more tests are necessary.
Further investigations have to be made to determine the economic efficiency of the
use of activated carbon and membrane filtration in the waste water treatment. After
the examination of the adsorption under optimal conditions in dem. water, the
adsorption in clarified waste water should be observed. As well more experiments
should be performed to determine the temperature dependency of the adsorption
process. To increase the adsorption capacity powdered activated carbon should be
evaluated. It is characterized by a larger surface and a higher capacity can be
obtained.
For the filtration trials of Aspidasept® a different membrane is necessary. With the
application of a membrane with larger Cut-Off a higher flow rate at a lower pressure
can be achieved which increase the economic efficiency of the process. Possible is
the use of the SBNF flat membrane with a Cut-Off of 2000 Da from MICRODYN-

6 Conclusion and Outlook _________________________________________________________________
_________________________________________________________________ 79
NADIR made out of cellulose acetate. Of course it is required to examine the
recovery of the peptide with the suggested membrane first. As well it is necessary to
reduce the fouling effect of the peptide on the membrane to increase the recovery in
the retentate. The above mentioned membrane could provide this. It is made out of
cellulose acetate which is a hydrophilic polymer. This shows a low fouling effect in
the presence of hydrophobic elements. A coating of the membrane with protein
could as well decrease the membrane fouling.
To gather further information about the influence of Aspidasept® on the bacteria and
protozoa used in the biological treatment long-term studies in the laboratory waste
water treatment plant should be performed. In this case not only the recovery and
stability of the peptide but as well the impact of the peptide on the bacterial
functioning is of high relevance. For this, the established methods are not sufficient.
To determine the stability of the peptide mass spectroscopy is necessary. The
impact on the bacteria and protozoa can be observed via microscopy.
But even though there is a lot of research necessary it was possible to achieve great
results in the, during this work, developed methods.

7 References _________________________________________________________________
_________________________________________________________________ 80
7 References
Ahuja, S. (1999): Chromatography and Separation Chemistry: Advances and
Developments. American Chemical Society.
Al-Degs, Y.S.; El-Barghouthi, M.I.; El-Sheikh, A.H. and Walker, G.M. (2008):
Effect of solution pH, ionic strength, and temperature on adsorption behavior of
reactive dyes on activated carbon. Dyes and Pigments, Volume 77, Issue 1, pp. 16 –
23.
Arnold, C. (2017): Adsorptionsisotherme, Teil 1. Dr. Arnold Chemie-Beratung.
URL: https://www.arnold-chemie.de/2017/10/ueber-adsorptionsisothermen-teil-i/
[accessed 25.02.2018]
Basile, A. and Charcosset, C. (2016): Integrated membrane systems and
processes. 1. Edition. Wiley-VCH Verlag, United Kingdom.
Benström, F. (2017): Granulierte Aktivkohle zur Elimination organischer
Spurenstoffe aus kommunalem Abwasser, PhD thesis, Rheinisch-Westfälische
Technische Hochschule, Aachen.
Bérdy, J. (2005): Bioactive microbial metabolites: a personal view. The Journal of
Antibiotics, 58(1), 1 – 26.
Bérdy, J. (2012): Thoughts and facts about antibiotics: Where we are now and
where we are heading. The Journal of Antibiotics, 65, 385 – 395.
Bondi, A.; Spaulding, E.; Smith, D. and Dietz, E. (1947): A Routine Method for the
Rapid Determination of Susceptibility to Penicillin and other Antibiotics. American
Journal of Medical Sciences, Vol.213 No.2 pp. 221-5 ref.16.
Brandenburg K. and Schürholz T. (2015): Lack of new anti-infective agents:
Passing into the pre-antibiotic age? World J Biol Chem, 6(3): 71-77.
Brogden, K.A. (2005): Antimicrobial peptides: Pore formers or metabolic inhibitors
in bacteria? Nature reviews. Microbiology, 3, pp. 238–250.

7 References _________________________________________________________________
_________________________________________________________________ 81
Cermakova, L.; Kopecka, I.; Pivokonsky, M.; Pivokonska, L. and Janda, V.
(2017): Removal of cyanobacterial amino acids in water treatment by activated
carbon adsorption. Separation and purification technology. Volume 173, pp. 330 -
338
Chang, Q.; Wang, W.; Regev-Yochay, G.; Lipsitch, M. and Hanage, W.P. (2014):
Antibiotics in agriculture and the risk to human health: how worried should we be?
Evolutionary Applications. Volume 8, Issue 3, pp. 240 – 247.
Cleland, W.W. (1964): Dithiothreitol, a new protective reagent for SH groups.
Biochemistry 3, 4, 480-482.
Demain, A.L. and Sanchez, S. (2009): Microbial drug discovery: 80 years of
progress. The Journal of Antibiotics, 62, 5 – 16.
Deutsche Sepsis-Hilfe (2004): Häufigkeit von Sepsis: dritthäufigste Todesursache.
URL: http://sepsis-hilfe.org/de/informationen-zur-sepsis/haeufigkeit.html
[accessed 03.03.2018]
Ebert, I.; Conradi, S.; Hein, A. and Amato, R. (2014): Arzneimittel in der Umwelt
vermeiden, reduzieren, überwachen. Technical report, Umweltbundesamt.
Eisenächer, K. and Neumann, U. (1982): Weitergehende Reinigung von
Abwässern der Chemischen Industrie mit Hilfe von Aktivkohle. Chemie Ingenieur
Technik, Volume 5, Issue 5, pp. 442 – 448.
El-Safty, S. and Hoa, N.D. (2012): Organic–Inorganic Mesoporous Silica Nanotube
Hybrid Anodic Alumina Membranes for Ultrafine Filtration of Noble Metal
Nanoparticles. InTech, Noble Metals, pp. 130 – 158.
Fjell, C.D; Hiss, A.J; Hancock R.E.W and Schneider, G. (2011): Designing anti-
microbial peptides: form follows function. Nature Review Drug Discovery, 11(1), 37 –
51.
Gezawa, S.M. (2014): Biotechnology in industrial waste water treatment. Cyprus
international university, biotechnology.

7 References _________________________________________________________________
_________________________________________________________________ 82
Gutsmann, T.; Razquin-Olazarán, I.; Kowalski, I.; Kaconis, Y.; Howe, J.; Bartels,
R.; Hornef, M.; Schürholz, T.; Rössle, M.; Sanchez-Gómez, S.; Moriyon, I.;
Martinez de Tejada, G. and Klaus Brandenburg (2010): New Antiseptic Peptides
To Protect against Endotoxin-Mediated Shock, Antimicrobial agents and
chemotherapy, pp. 3817–3824.
Hale, J.D.F and Hancock, R.E.W (2014): Alternative mechanisms of action of
cationic antimicrobial peptides on bacteria. Expert Review of anti-infective therapy,
pp. 951 – 959.
Heinbockel, L.; Marwitz, S.; Barcena Varela S.; Ferrer-Espada R.; Reiling N.;
Goldmann T.; Gutsmann, T.; Mier, W.; Schürholz, T.; Drömann, D.;
Brandenburg, K. and Martinez de Tejada, G. (2015): Therapeutical Administration
of Peptide Pep19-2.5 and Ibuprofen Reduces Inflammation and Prevents Lethal
Sepsis. PLoS ONE 10(7): e0133291.
Hennion, M.C. (1999): Solid-phase extraction: method development, sorbents, and
coupling with liquid chromatography. Journal of Chromatography A, 856, 3–54.
Hichrom Limited: Vydac 218TPª C18 Reversed-Phase Columns for Polypeptides –
Application guide. URL: http://www.westernanalytical.com/pdf/cat_84.pdf
[accessed 23.11.2017]
Ho, L.; Lambling, P.; Bustamante, H.; Duker, P. and Newcombe, G. (2011):
Application of powdered activated carbon for the adsorption of cylindrospermopsin
and microcystin toxins from drinking water supplies. Water research. Volume 45,
Issue 9, pp. 2954 – 2964.
Hollis, A. and Ahmed, Z. (2013): Preserving Antibiotics, Rationally. The New
England journal of medicine. 369, pp. 2474 – 2476.
Ju, H.; McCloskey, B.D.; Sagle, A.C.; Kusuma, V.A. and Freeman, B.D. (2009):
Preparation and characterization of crosslinked poly(ethylene glycol) diacrylate
hydrogels as fouling-resistant membrane coating materials. Journal of membrane
science, Volume 330, Issues 1 – 2, pp. 180 – 188.

7 References _________________________________________________________________
_________________________________________________________________ 83
Kaconis, Y. (2013): Präklinische Untersuchungen zur Wechselwirkung von
antimikrobiellen Peptiden mit Gram-negativen Bakterien und deren
Pathogenitätsfaktor Endotoxin. PhD Thesis. Universität Lübeck, Medizinische Klinik
III.
Kaltenböck, K. (2008): Chromatographie für Einsteiger. 1. Edition, Wiley-VCH
Verlag, Weinheim, Germany.
Kårelid, V.; Larsson, G. and Björlenius, B. (2017): Pilot-scale removal of
pharmaceuticals in municipal wastewater: Comparison of granular and powdered
activated carbon treatment at three wastewater treatment plants. Journal of
Environmental Management, 193, 491 - 502.
KomS: Kompetenzzentrum Spurenstoffe-BW (2018): Adsorptive Verfahren –
Granulierte Aktivkohle. URL: http://koms-bw.de/technologien/adsorptive_verfahren/
[accessed 25.02.2018]
Kromidas, S. (2014): Der HPLC-Experte: Möglichkeiten und Grenzen der modernen
HPLC. 1. Edition, Wiley-VCH Verlag, Weinheim, Germany.
Kromidas, S.: Methodenvalidierung in der Analytik.
URL: http://www.kromidas.de/Uploads/Dokumente/ValidierunginderAnalytik.pdf
[accessed 25.02.2018]
Kumar, R.R.; Lee, J.T. and Cho, J.Y. (2012): Fate, occurrence, and toxicity of
veterinary antibiotics in environment. Journal of the Korean Society for Applied
Biological Chemistry. Volume 55, Issue 6, pp. 701 – 709.
Kumar, A. (2014): An alternate pathophysiologic paradigm of sepsis and septic
shock: implications for optimizing antimicrobial therapy. Virulence, 5(1), pp. 80–97.
Lehrer, R.; Rosenman, M.; Harwig, S.; Jackson, R. and Eisenhauer P. (1991):
Ultrasensitive assays for endogenous antimicrobial polypeptides. Journal of
Immunological Methods Volume 137, Issue 2, Pages 167-173.
7 References _________________________________________________________________
_________________________________________________________________ 84
Léonil, J.; Mollé, D.; Bouhallab, S. and Henry, G. (1994): Precipitation of
hydrophobic peptides from tryptic casein hydrolysate by salt and pH. Enzyme and
Microbial Technology, Volume 16, Issue 7, pp. 591 – 595.
Lichtenberg, S. (2017): PharmCycle - Untersuchung des Adsorptionsverhaltens
von Antibiotika an granulierter Aktivkohle am Beispiel von Sulfamethoxazole.
Bachelor Thesis, HAW Hamburg.
Lohrengel, B. (2012): Einführung in die thermischen Trennverfahren: Trennung von
Gas-, Dampf- und Flüssigkeitsgemischen. De Gruyter Studium. 1. Edition,
Oldenbourg Wissenschaftsverlag.
Lundanes, E.; Reubsaet L. and Greibokk T. (2013): Chromatography: Basic
Principles, Sample Preparations and Related Methods. 1. Edition, Wiley-VCH Verlag,
Weinheim, Germany.
Macherey-Nagel (2017): Solid Phase Extraction - Application Guide.
URL: ftp://ftp.mn-net.com/english/FlyerCatalogs/Chromatography/ SPE_Applis.pdf
[accessed 10.01.2018]
Mangoni, M.L.; Shai, Y. (2011): Short native antimicrobial peptides and engineered
ultrashort lipopeptides: similarities and differences in cell specificities and modes of
action. Cellular and Molecular Life Sciences, 68:2267.
Mangoni, M.L.; McDermott, A.L and Zasloff M. (2016): Antimicrobial peptides and
wound healing: biological and therapeutic considerations. Exp. Dermatol. 25(3):
167–173.
Melin, T. and Rautenbach, R. (2007): Membranverfahren: Grundlagen der Modul-
und Anlagenauslegung. 3. Edition. Springer Verlag.
Meyer, V.R. (2009): Praxis der Hochleistungs-Flüssigchromatographie. 10. Edition,
Wiley-VCH Verlag, Weinheim, Germany.
MICRODYN-NADIR (2017): Product specification: TRISEP® UA60 – NF elements
for separation and purification.
7 References _________________________________________________________________
_________________________________________________________________ 85
Ohlrogge, K. and Ebert, K. (2006): Membranen: Grundlagen, Verfahren und
industrielle Anwendungen. Wiley-VCH Verlag, Weinheim, Germany.
Otvos, L. and Cudic, M. (2007): Broth Microdilution Antibacterial Assay of Peptides.
Published: Peptide Characterization and Application Protocols (Field, G.B.). Humana
Press Inc., Volume 386, pp. 309 - 320.
Parry, W. (2012): Water Pollution Caused by Birth Control Poses Dilemma. Life
Science. Nature.
Peri, F.; Piazza, M.; Calabrese, V.; Damore, G. and Cighetti, R. (2010): Exploring
the LPS/TLR4 signal pathway with small molecules. Biochemical society
transactions. Volume 38, Issue 5, pp. 1390 – 1395.
Pfalzgraff, A.; Heinbockel, L.; Su, Q.; Gutsmann, T.; Brandenburg, K. and
Weindl, G. (2016): Synthetic antimicrobial and LPS-neutralising peptides suppress
inflammatory and immune responses in skin cells and promote keratinocyte
migration, Sci Rep, 6: 31577.
Romanow, M. (2017): PharmCycle – Untersuchung des Adsorptionsverhaltens von
Antibiotika an granulierter Aktivkohle am Beispiel von Trimethoprim. Bachelor Thesis,
HAW Hamburg.
Schägger, H. and von Jagow, G. (1987): Tricine-Sodium Dodecyl Sulfate-
Polyacrylamide Gel Electrophoresis for the Separation of Proteins in the Range from
1 to 100 kDa. Analytical Biochemistry 166, 368-379.
Schürholz, T.; Deomming, S.; Hornef, M.; Martin, L.; Simon, T.P.; Heinbockel,
L.; Brandenburg, K. and Marx, G. (2013): The anti-inflammatory effect of the
synthetic antimicrobial peptide 19-2.5 in a murine sepsis model: a prospective
randomized study. Critical care, 17:R3.
Stephenson, J. (2001): Antibiotics and Agriculture. The world of medicine.
286(6):663.
Wang, B.; Sun, C. and Hu, G. (2007): Residue Antibiotics in Environment: Potential
Risks and Relevant Studies. Environmental Science and Technology. 2007-3.

7 References _________________________________________________________________
_________________________________________________________________ 86
Wang, G.; Li, X; Wang, Z. (2016): APD3: the antimicrobial peptide database as a
tool for research and education. Nucleic Acids Res, 44 (D1): D1087-D1093.
Westermeier, R. and Gronau, S. (2005): Electrophoresis in practice: a guide to
methods and applications of DNA and protein separations, 4. Edition, Wiley-VCH.
Worch, E. (2012): Adsorption technology in water treatment: Fundamentals,
processes and modeling. De Gruyter.
Appendix _________________________________________________________________
_________________________________________________________________ i
Appendix
A Figure index
Figure 2.1: Annual amount [kg] of antibiotics used in the USA. .......................... 3
Figure 2.2: Schematic representation of the spectrum of activity of
antimicrobial and antiseptic peptides relating to wound healing. ....................... 6
Figure 2.3: Schematic view on the immune response without and in the
presence of Aspidasept®. ........................................................................................ 8
Figure 2.4: Typically 3-stage waste water treatment plant. .................................. 9
Figure 2.5: Schematic drawing of the Freundlich-Isotherm with different values
of n. .......................................................................................................................... 12
Figure 2.6: Treatment with granulated activated carbon (GAC). ........................ 13
Figure 2.7: Two procedures for the membrane filtration: Cross-flow filtration
and dead-end filtration. .......................................................................................... 14
Figure 2.8: Typical assembly of a HPLC instrument. .......................................... 17
Figure 3.1: Bonding of the hydrophobic phase to silica using polymeric silane.
................................................................................................................................. 22
Figure 3.2: Chromatographic profile of RP-HPLC. .............................................. 24
Figure 3.3: Performance of the solid-phase extraction for peptide samples
using a C18 ec cartridge. ....................................................................................... 25
Figure 4.1: Characterization of Aspidasept® via RP-HPLC. ................................ 42
Figure 4.2: HPLC evaluation with injection series of 4 peptide concentration
and injection volumes. ........................................................................................... 43
Figure 4.3: Level of detection chromatograms of Aspidasept® on the RP-HPLC.
................................................................................................................................. 44
Figure 4.4: RP-HPLC-Chromatogram of reduced Aspidasept® and resulting
reference curve. ..................................................................................................... 46
Figure 4.5: Tricine-SDS-PAGE with unreduced and reduced Aspidasept®. ...... 47
Figure 4.6: Tricine-SDS-PAGE of reduced Aspidasept® and reference curve. . 49
Figure 4.7: Stability of Aspidasept® at different storage conditions. ................ 51
Figure 4.8: Radial diffusion assay with Aspidasept® and synthetic ALK-OH. .. 53
Figure 4.9: Activated carbon adsorption of Aspidasept® on varying amounts of
activated carbon at 10 °C. ...................................................................................... 55

Appendix _________________________________________________________________
_________________________________________________________________ ii
Figure 4.10: Double logarithmic qeq/ceq – diagram with calculated linear
regression. .............................................................................................................. 56
Figure 4.11: Comparison of activated carbon adsorption at 10 °C and 20 °C
with 0.1 g and 0.5 g activated carbon. .................................................................. 57
Figure 4.12: Aspidasept® recovery in the presence of different buffers and salt.
................................................................................................................................. 58
Figure 4.13: Aspidasept® adsorption on the membranes XLE, NF90, NF270 and
UA60 in 0.1 % TFA and Tris (pH 7). ....................................................................... 60
Figure 4.14: Cut-Off determination of membrane UA60. ..................................... 61
Figure 4.15: Calibration curve of Aspidasept® dissolved in Tris buffer
determined by RP-HPLC analysis. ........................................................................ 62
Figure 4.16: Recovery of the peptide filtration with pressure variation. ........... 64
Figure 4.17: Permeate flux of the reference filtrations with water and constant
pressure. ................................................................................................................. 65
Figure 4.18: Aspidasept® recovery in particle free waste water over the time
period of 6 days. ..................................................................................................... 66
Figure 4.19: Peptide elimination in waste water. ................................................. 68
Figure C.1: Radial diffusion assay with Aspidasept® and synthetic ALK-OH. .... ii
Figure C.2: Radial diffusion assay with Aspidasept® and synthetic ALK-OH. ... iii

Appendix _________________________________________________________________
_________________________________________________________________ i
B Table index
Table 2.1: Amino acid sequence of the antiseptic peptide Aspidasept® (Pep19-
2.5). ............................................................................................................................ 6
Table 2.2: Minimal inhibitory concentration (MIC) of Aspidasept®. ..................... 7
Table 3.1: List of used equipment ......................................................................... 18
Table 3.2: List of used materials ........................................................................... 19
Table 3.3: List of used chemicals ......................................................................... 20
Table 3.4: List of used peptides and proteins ..................................................... 21
Table 3.5: Composition of the SDS-PAGE for the production of two gels. ....... 27
Table 3.6: Gel fixation solution of the Tricine-SDS-PAGE gels, used before
staining. .................................................................................................................. 27
Table 3.7: Solutions for the SDS-PAGE. ............................................................... 28
Table 3.8: Solutions for the Coomassie staining of the SDS-PAGE gels (4 gels)
................................................................................................................................. 29
Table 3.9: Specifications of the granulated activated carbon Hydraffin AR 8x30.
................................................................................................................................. 31
Table 3.10: Composition of the experiment set up of the adsorption trials. ..... 32
Table 3.11: GAC concentrations prepared for the adsorption kinetic trials. .... 32
Table 3.12: Sampling times of the adsorption kinetic trials. .............................. 33
Table 3.13: Specifications of the used reverse osmosis and nano membranes.
................................................................................................................................. 35
Table 3.14: Buffer compositions used for the stability pretests of Aspidasept®.
................................................................................................................................. 36
Table 3.15: Substances used for the Cut-Off determination of membrane UA60.
................................................................................................................................. 37
Table 3.16: Composition of the trace element in the synthetic waste water. .... 39
Table 3.17: Composition of the medium in the synthetic waste water. ............. 39
Table 4.1: Coefficient of variation of the RP-HPLC evaluation. .......................... 44
Table 4.2: Equilibrium concentration and calculated GAC loading. .................. 55
Table 4.3: Pressure variation peptide filtration with membrane 1. .................... 63
Table 4.4: Pressure variation peptide filtration with membrane 2. .................... 63
Table 4.5: SDS-PAGE results of the peptide elimination in waste water. .......... 67

Appendix _________________________________________________________________
_________________________________________________________________ ii
C Radial diffusion assay – Results
In the following figures the agar plates of the radial diffusion assay are displayed. All
samples were applied twice on different plates. Three plates were used. The third
one is displayed in the result chapter. As shown in the results: Aspidasept® showed
no growth inhibition.
Figure C.1: Radial diffusion assay with Aspidasept®
and synthetic ALK-OH. Substances were
applied at the positions 1 to 8: 1) Melittin [50 µg/mL], 2) Melittin [10 µg/mL], 3) dem. H2O, 4)
Aspidasept® [500 µg/mL], 5) Aspidasept
® [200 µg/mL], 6) Aspidasept
® [100 µg/mL], 7) Aspidasept
®
[70 µg/mL], 8) Aspidasept® [50 µg/mL], 9) Aspidasept
® [10 µg/mL].

Appendix _________________________________________________________________
_________________________________________________________________ iii
Figure C.2: Radial diffusion assay with Aspidasept® and synthetic ALK-OH. Substances were
applied at the positions 1 to 8: 1) ALK-OH [40 µg/mL], 2) 0.01 % TFA, 3) 1 % TFA, 4) Aspidasept® [5
µg/mL], 5) Aspidasept® [10 µg/mL], 6) Aspidasept
® [50 µg/mL], 7) Aspidasept
® [70 µg/mL], 8)
Aspidasept® [100 µg/mL], 9) Aspidasept
® [200 µg/mL].
Appendix _________________________________________________________________
_________________________________________________________________ iv
Eidesstattliche Erklärung
Hiermit versichere ich, dass ich die vorliegende Master Thesis mit dem Titel
„Establishment of RP-HPLC and SDS-PAGE analytics of an antiseptic peptide to
investigate its elimination on a model waste water plant“ ohne fremde Hilfe
selbstständig verfasst und nur die angegebenen Quellen und Hilfsmittel verwendet
habe. Wörtlich oder dem Sinn nach aus anderen Werken entnommene Stellen sind
unter Angabe der Quellen kenntlich gemacht.
Ettlingen, 12.03.2018 ____________________
Silke Allers