establishment & production costs for grapes in ontario grape cost... · establishment and...
TRANSCRIPT

Establishment & Production
Costs for Grapes in Ontario 2014 Economic Report


Establishment and Production Costs for Grapes in Ontario
2014 Economic Report
Editors John Molenhuis, Business Analysis and Cost of Production Lead, OMAFRA
Acknowledgements This report was prepared with the help of the following: Amanda Green, Tender Fruit and Grape Specialist, OMAFRA; Hugh Fraser, Agricultural Engineer, OMAFRA; Dr. Wendy McFadden-Smith, Tender Fruit and Grape IPM Specialist, OMAFRA; John Barkovic, Regional Claims Manager, AGRICORP; Grape Growers of Ontario; the growers and several custom operators that participated in the survey; Carolyn Prieur, Client Service Representative, OMAFRA; and Ken Slingerland, contracted by GGO to interview growers for the surveys, input and summarize data; Vineland Growers Co-operative Ltd., Niagara and Fruit and Vegetable Growers Ltd., Louth Niagara Ltd., Lakeview Vineyard Equipment, St. Catharines New Holland Ltd., Redtrac International Ltd., Vanden Bussche Irrigation, C Frensch Ltd. This report was reviewed by Dr. Helen Fisher, retired, Department of Plant Agriculture, University of Guelph.
Need technical and business information? Contact the Agricultural Information Contact Centre at 1-877-424-1300 or [email protected] A complete listing of all OMAFRA products and services is available on the OMAFRA website. To obtain copies of ministry publications, contact Service Ontario through the Service Ontario Publications website at www.ServiceOntario.ca/publications, or by phone at 1-800-668-9938 or 416-326-5300 or TTY 1-800-268-7095. The report was published by the Ontario Ministry of Agriculture, Food and Rural Affairs.

Table of Contents
1. Introduction
Objectives .................................................................................................................................................................. 1 Methods and Procedures ......................................................................................................................................... 1 Assumptions .............................................................................................................................................................. 1 Changes for the 2014 Economic Report ............................................................................................................... 2
Vinifera and Hybrid Grapes
2. Cabernet Franc
Preplant year .............................................................................................................................................................. 4 Planting year .............................................................................................................................................................. 5 Second year ................................................................................................................................................................ 7 Third year ................................................................................................................................................................... 9 Fourth year ............................................................................................................................................................... 11 Total establishment cost ........................................................................................................................................ 12 Mature Vineyard: Annual Costs ............................................................................................................................ 13 Break even point ..................................................................................................................................................... 15 Graph: Cost of Production 1997 - 2014 at 3.5 tonne per acre ....................................................................... 17 Graph: Cost of Production 1997 - 2014 at 4.5 tonne per acre ....................................................................... 17
3. Chardonnay
Preplant year ............................................................................................................................................................ 18 Planting year ............................................................................................................................................................ 19 Second year .............................................................................................................................................................. 21 Third year ................................................................................................................................................................. 23 Fourth year ............................................................................................................................................................... 25 Total establishment cost ........................................................................................................................................ 26 Mature Vineyard: Annual Costs ............................................................................................................................ 27 Break even point ..................................................................................................................................................... 29 Graph: Cost of Production 1997 - 2014 at 4 tonne per acre .......................................................................... 31 Graph: Cost of Production 1997 - 2014 at 5 tonne per acre .......................................................................... 31
4. Vidal
Preplant year ............................................................................................................................................................ 32 Planting year ............................................................................................................................................................ 33 Second year .............................................................................................................................................................. 35 Third year ................................................................................................................................................................. 37 Fourth year ............................................................................................................................................................... 39 Total establishment cost ........................................................................................................................................ 40 Mature Vineyard: Annual Costs ............................................................................................................................ 41 Break even point ..................................................................................................................................................... 43 Graph: Cost of Production 1997 - 2014 at 5 tonne per acre .......................................................................... 45 Graph: Cost of Production 1997 - 2014 at 7 tonne per acre .......................................................................... 45
Labrusca Grapes
5. Concord
Mature Vineyard: Annual Costs ............................................................................................................................ 47
i
1
1. Introduction This report tries to reflect the management practices used by growers today. Soil condition, cultivar selections, personal grower management decisions and the unique meso-climates of Ontario result in many different grower practices in training systems, pest management programs and fertilizer rates. The four grape cultivars in this document are the same as those used four years ago. Concord, Vidal, Chardonnay and Cabernet Franc reflect some of the most significant cultivars in Ontario. They represent Labrusca, French Hybrid and Vinifera types of grapes.
Objectives
The grape industry utilizes the cost of establishment and cost of production models extensively to deter-mine the profitability of the industry and to help growers make business decisions and planting plans. Growers can use the input costs as general guidelines to help identify strengths and weaknesses in their business.
Methods and procedures The information used in this report is derived from previous economic reports, surveys with growers and private consultants, and data from researchers, extensions and agribusiness. Since 2014 had significant winter injury in some locations, growers were asked to provide information based on a more typical year such as 2013. Input costs are organized into variable and measurable fixed costs. Variable costs include plants, seed, fertilizers, pesticides, marketing charges, hired labour, tractor and machine costs and interest on operating capital. Measurable fixed costs are interest on investment, depreciation and other overhead cost items such as a portion of utilities, equipment storage, insurance, accounting, farm vehicles and general maintenance.
Assumptions The contribution margin is obtained by subtracting the total variable costs from the gross income. Contribution margin is the amount of funds that the crop contributes to cover fixed costs and provide returns for owner management and investment.
Hired Labour is charged at $13.45 per hour, which includes benefits (Workers’ Compensation, Employment Insurance and Canada Pension Plan). A blended base price of $13.45 is used to reflect the workforce in the grape industry, which is made up of both local and offshore labour. Offshore labour includes an allowance for additional costs such as air flight, housing and local transportation. Hired machine operator labour is charged at $ 20.60 per hour (includes benefits). Machinery and equipment costs are based on a commercial farm size of 50 acres. Machinery costs are calculated based on the purchase price for 2014, useful life, annual use and trade-in value. Interest on investment is calculated at 2.0 %, which is the average interest rate paid by chartered banks on Guaranteed Investment Certificates. The interest rate applied to the operating capital is based on the prime lending rate of 3.0 % plus 1.0% = 4.0%. Interest on operating capital is compounded annually until the vineyard generates revenue to first pay down the accumulated interest and then the outstanding principal. Operating capital includes cost of materials, fuel, repairs, labour and other cash items but does not include farm overhead expenses. Fuel costs are based on the size of each tractor, truck or self-propelled machine used in production. The following farm-gate fuel prices are used: gasoline 1.20 $/litre and diesel 1.11 $/litre. Fuel costs are net of all 2014 provincial and federal rebates. Yields are given as both a low and high range to reflect the wide differences of commercial production and conditions for each farm. Yields used are 25% of annual yield for year 3 and 50% for year 4 (high range). The prices listed are the 2014 payments for each cultivar sold through the Grape Growers of Ontario.
2
Chardonnay and Cabernet Franc vines are spaced at 9 x 4 feet and 1210 vines per acre. 1 acre = 9 rows with approximately 134 vines per row. Vidal vines are spaced at 9 x 5 feet and 968 vines per acre. 1 acre = 9 rows with approximately 108 vines per row. Labrusca vines are spaced at 10 x 6 feet and 728 vines per acre. 1 acre = 8 rows with approximately 91 vines per row. The training system for Vinifera grapes is a vertical shoot position system (i.e. Pendelbogen), while Labrusca and French Hybrid grapes are trained to four-cane kniffin. The establishment of the vineyard covers a 4.5 year period: a half-year for pre-plant preparation, one year for planting and three years for the vine to grow to full cropping potential. Crop Services includes several items such petiole and soil sampling, pest monitoring, etc. The establishment costs will need to be recovered over the productive life of the vineyard. An estimate of the annual costs to recover establishment costs is included in the Total Establishment Costs section for each variety. They are amortized over the 21 years of full production at a rate of interest of 2.0%. Due to rounding, figures may not add to the total shown.
Changes for the 2014 Economic Report Yields – Yields for each cultivar increased from 2009. Cabernet Franc High yield - 5.0t (+0.5t increase) Low Yield - same Chardonnay High yield - 6.0t (+1.0t increase) Low Yield - same Vidal High yield - 10.0t (+3.0t increase) Low Yield – 7.0t (2.0t increase) Concord High yield - 6.0t (+1.0t increase) Low Yield – 4.0t (0.5t increase)
Hand labour wages rose 8.5% while skilled tractor driver wages climbed 20% since 2009. Expected yields were increased and gross revenue per tonne increased 1-7.6% since 2009 for the wine grape varieties. Hand operations; shoot thinning, shoot positioning and tucking were all combined. Trellis Maintenance was combined together with other operations. Cultivating and Discing were combined into one category Other minor changes include – using less fertilizer and two additional pesticide sprays. Land costs and carrying charges are not included as part of the establishment or production costs because of the extreme variance in land prices. Land ownership and rental prices vary considerably from farm to farm depending on road location, services, soil types, access to water, and potential for urban development or establishing a new winery. For this reason a space is provided to insert land rental cost in the variable cost section and land ownership in the fixed cost section. Costs should be added into vineyard establishment and cost of production. A management allowance is not included as a cost. All labour costs are charged to the project whether the owner performs the task or whether it was hired out. These assumptions reflect the current practices in the industry and do not necessarily represent recommendations from the contributors. Newer plantings of these varieties may involve higher vine densities, alternative training systems and other innovative cultural practices. The authors assume no liability or responsibility as a result of the reader relying or acting upon the information contained herein. Any use or misuse of the information is the sole responsibility of the reader.
VINIFERA AND HYBRID
GRAPES
3

4
2. Cabernet Franc
Preplant Year
Cost per acre ($)
Variable Costs Actual Budget
Labour: Machinery operator, 4.5 hrs 93
Custom plowing 24
Cover crop 52
Machine costs :Repairs and maintenance 30
Fuel 57
Consulting fees 50
Interest on operating capital 103
Land rental
Land preparation (levelling etc.) 1000
Tile drainage (9 foot) 3869
Total Variable Costs 5278
Fixed Costs
Machine costs: Depreciation 55
Interest on investment 12
Other overhead 200
Land ownership
Measurable Fixed Costs 267
Total Measurable "Preplant Year” Costs 5545
Operation
Labour
(hours)
Labour
Costs
Machine
Costs*
Fixed
Costs
Total
Costs
Machine:
Discing, cultivating (3.5x) 2.8 58 49 27 134
Sub soiling 1.0 21 19 10 50
Sow cover crop 0.7 14 19 29 62
Total Machinery Operator 4.5 93 87 67 247
*Includes maintenance, fuel and repair
Operation Costs
Ca
be
rne
t Fra
nc
- Pre
pla
nt Y
ea
r

5
Cost per acre ($)
Variable Costs Actual Budget
Labour: Hand, 29.0 hrs 390
Machine operator, 21.6 hrs 445
Fertilizer: Ammonium nitrate 0 kg 0
Muriate of potash, 0 kg 0
Insecticides 0
Fungicides 46
Grape vines 3388
Custom trellis: Materials, labour 6034
Training: Stakes, material 932
Cover crop seed 52
Machine costs: Repairs and maintenance 114
Fuel 256
Custom planting 770
Irrigation 166
Consulting fees 50
Interest on operating capital 717
Land rental
Total Variable Costs 13360
Fixed Costs
Machine costs: Depreciation 176
Interest on investment 38
Other overhead 400
Land ownership
Measurable Fixed Costs 615
Total Measurable "Planting Year” Costs 13975
Planting Year
Ca
be
rne
t F
ran
c -
Pla
nti
ng
Ye
ar

6
Operation
Labour
(hours)
Labour
Costs
Machine
Costs*
Fixed
Costs
Total
Costs
Hand
Weed control: Hand hoeing 14.0 188 188
Summer training, tying, trunk est 15.0 202 202
Total Hand Labour 29.0 390 390
Machine
Weed control: Grape hoeing (3x) 6.0 124 90 26 239
Discing, cultivating (3.5x) 2.8 58 47 24 129
Pesticide spraying (4x) 1.3 27 56 66 149
Fertilizing (0x) 0.0 0 0 0 0
Sow cover crop 0.7 14 18 28 61
Mowing (4x) 2.8 58 46 17 121
Hilling up 3.0 62 51 29 142
Vineyard maintenance 3.0 62 48 20 130
Picking up vines & supplies 2.0 41 12 4 57
Total Machinery Operator 21.6 445 369 215 1029
*Includes maintenance, fuel and repair
Ca
be
rne
t Fra
nc
- Pla
ntin
g Y
ea
r
Operation Costs
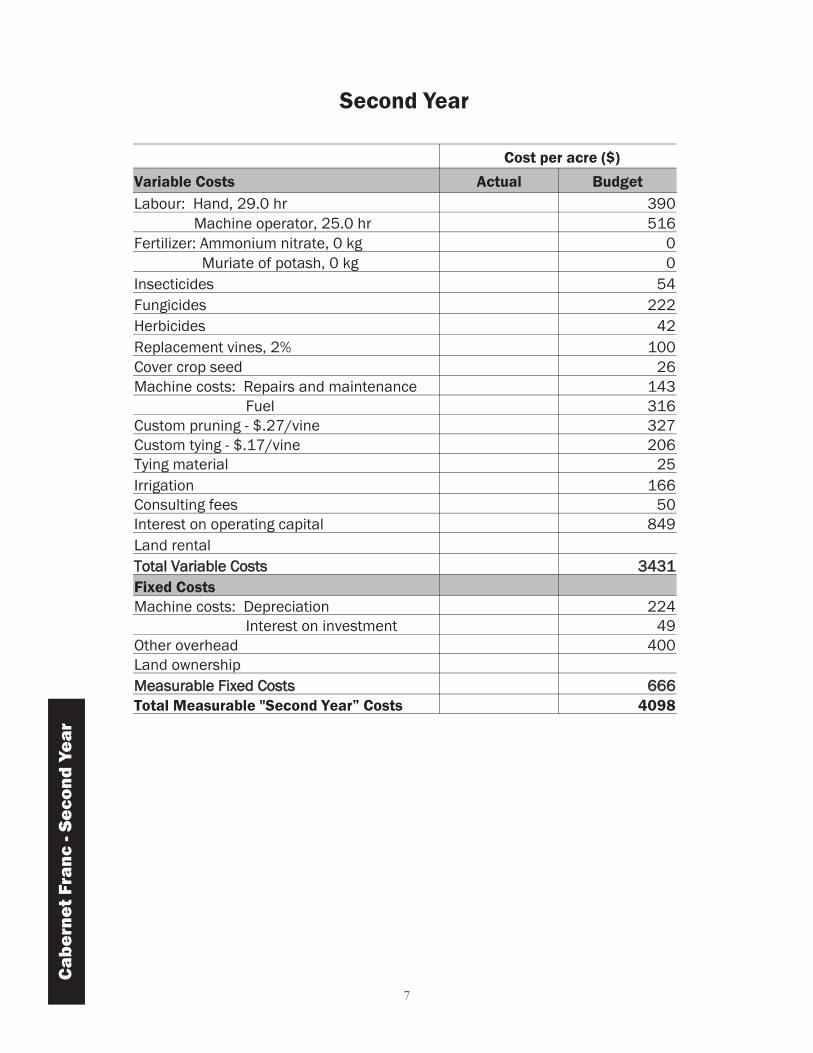
Second Year
Ca
be
rne
t F
ran
c -
Se
co
nd
Ye
ar
Cost per acre ($)
Variable Costs Actual Budget
Labour: Hand, 29.0 hr 390
Machine operator, 25.0 hr 516
Fertilizer: Ammonium nitrate, 0 kg 0
Muriate of potash, 0 kg 0
Insecticides 54
Fungicides 222
Herbicides 42
Replacement vines, 2% 100
Cover crop seed 26
Machine costs: Repairs and maintenance 143
Fuel 316
Custom pruning - $.27/vine 327
Custom tying - $.17/vine 206
Tying material 25
Irrigation 166
Consulting fees 50
Interest on operating capital 849
Land rental
Total Variable Costs 3431
Fixed Costs
Machine costs: Depreciation 224
Interest on investment 49
Other overhead 400
Land ownership
Measurable Fixed Costs 666
Total Measurable "Second Year” Costs 4098
7

Ca
be
rne
t Fra
nc
- Se
co
nd
Ye
ar
Operation
Labour
(hours)
Labour
Costs
Machine
Costs*
Fixed
Costs
Total
Costs
Hand
Weed Control: Hand hoeing 14.0 188 188
Summer training, tying, trunk est 15.0 202 202
Total Hand Labour 29.0 390 390
Machine
Weed control: Grape hoeing (3x) 6.0 124 94 32 250
Spraying (2x) 1.4 29 25 13 67
Discing, cultivating (3.5x) 2.8 58 49 27 134
Pesticide spraying (8x) 2.6 54 77 75 206
Fertilizing (0x) 0.0 0 0 0 0
Sow cover crop 0.7 14 19 29 62
Mowing (5x) 3.5 72 59 24 155
Hilling up and removal 3.0 62 53 32 147
Vineyard maintenance 3.0 62 50 20 132
Replacing vines 2.0 41 33 14 87
Total Machinery Operator 25.0 516 459 266 1241
*Includes maintenance, fuel and repair
Operation Costs
8

Third Year
Ca
be
rne
t F
ran
c -
Th
ird
Ye
ar
1.25 tonne (25% Yield) Cost per acre ($)
Variable Costs Actual Budget
Labour: Hand, 61.0 hrs 820
Machine operator, 28.1 hrs 578
Fertilizer: Ammonium nitrate, 10 kg 6
Muriate of potash, 40 kg 24
Insecticides 108
Fungicides 445
Herbicides 53
Replacement vines, 1% 50
Cover crop seed 26
Machine Costs: Repairs and maintenance 170
Fuel 355
Custom pruning - $.38/vine 460
Custom tying - $.19/vine 230
Tying material 25
Irrigation 166
Bird control 190
Board license and R&D fees ($24.30 per tonne) 30
Crop insurance 98
Consulting fees (soil,leaf, spray) 50
Interest on operating capital 1038
Land rental
Total Variable Costs 4923
Fixed Costs
Machine costs: Depreciation 249
Interest on investment 54
Other overhead 400
Land ownership
Measurable Fixed Costs 703
Total Measurable "Third Year” Costs 5625
Contribution Margin
Gross Income ($1693 per tonne) 2116
Total Variable Costs 4923
Contribution Margin (no land costs) -2806
9
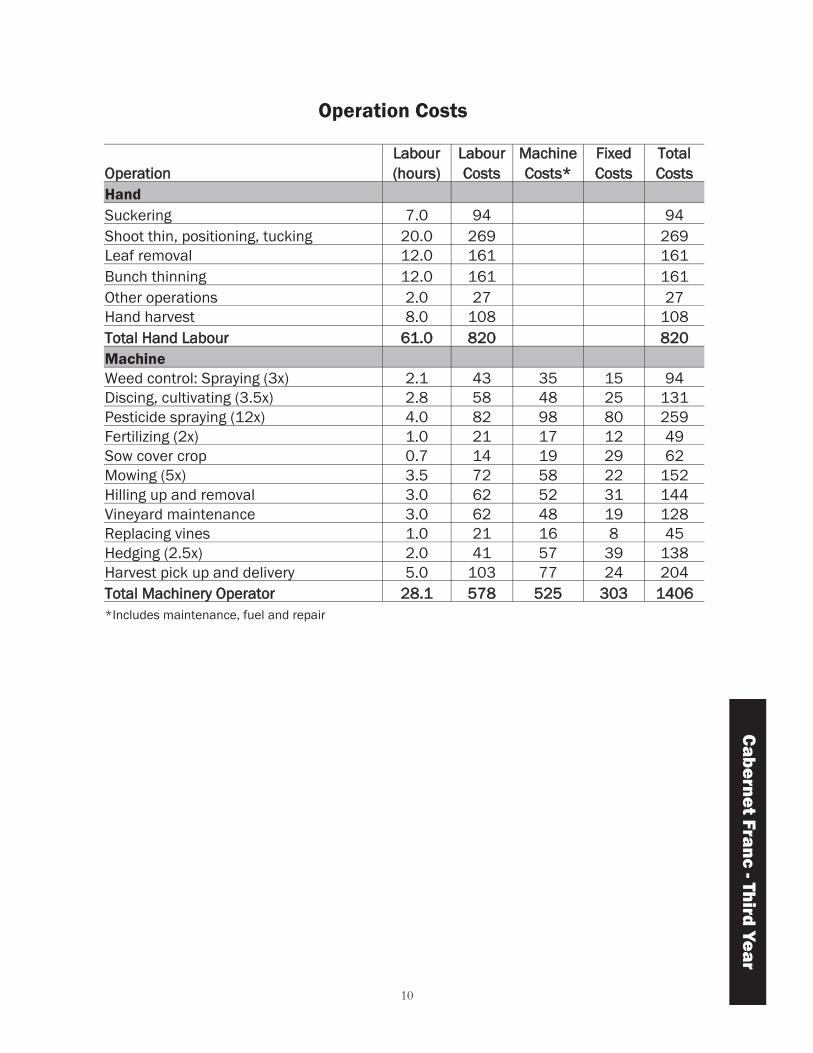
Operation Costs
Ca
be
rne
t Fra
nc
- Th
ird Y
ea
r
Operation
Labour
(hours)
Labour
Costs
Machine
Costs*
Fixed
Costs
Total
Costs
Hand
Suckering 7.0 94 94
Shoot thin, positioning, tucking 20.0 269 269
Leaf removal 12.0 161 161
Bunch thinning 12.0 161 161
Other operations 2.0 27 27
Hand harvest 8.0 108 108
Total Hand Labour 61.0 820 820
Machine
Weed control: Spraying (3x) 2.1 43 35 15 94
Discing, cultivating (3.5x) 2.8 58 48 25 131
Pesticide spraying (12x) 4.0 82 98 80 259
Fertilizing (2x) 1.0 21 17 12 49
Sow cover crop 0.7 14 19 29 62
Mowing (5x) 3.5 72 58 22 152
Hilling up and removal 3.0 62 52 31 144
Vineyard maintenance 3.0 62 48 19 128
Replacing vines 1.0 21 16 8 45
Hedging (2.5x) 2.0 41 57 39 138
Harvest pick up and delivery 5.0 103 77 24 204
Total Machinery Operator 28.1 578 525 303 1406
*Includes maintenance, fuel and repair
10
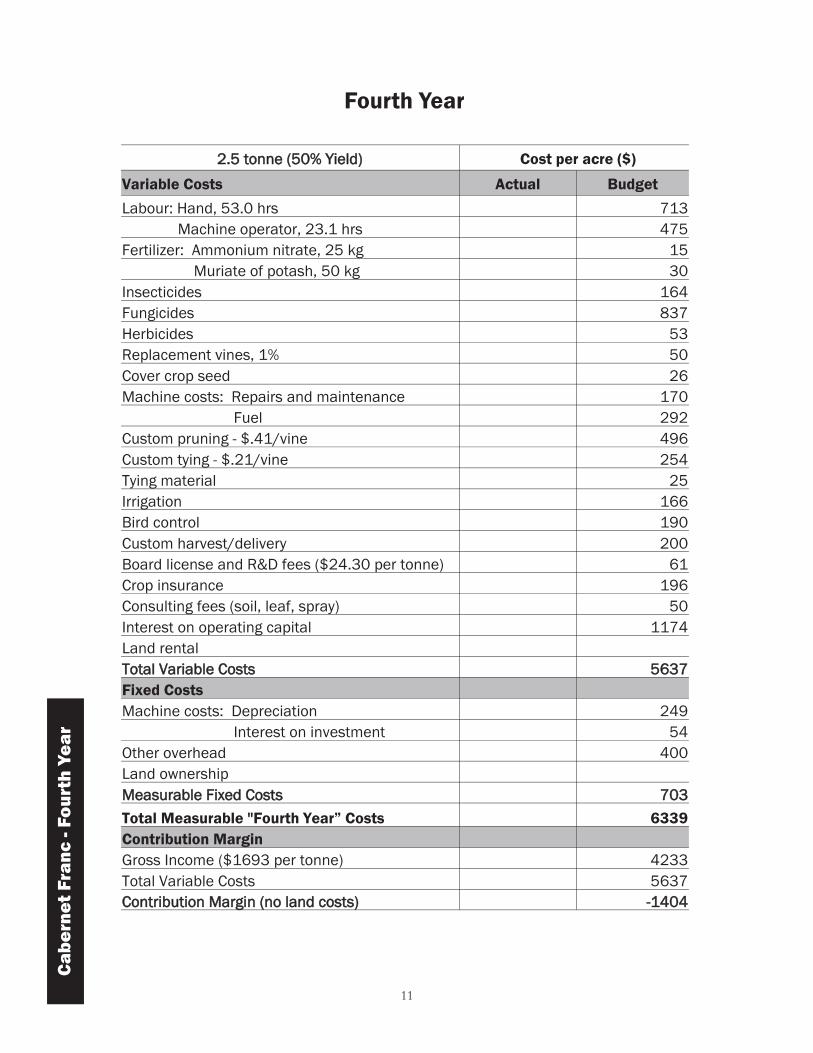
Fourth Year
Ca
be
rne
t F
ran
c -
Fo
urt
h Y
ea
r
2.5 tonne (50% Yield) Cost per acre ($)
Variable Costs Actual Budget
Labour: Hand, 53.0 hrs 713
Machine operator, 23.1 hrs 475
Fertilizer: Ammonium nitrate, 25 kg 15
Muriate of potash, 50 kg 30
Insecticides 164
Fungicides 837
Herbicides 53
Replacement vines, 1% 50
Cover crop seed 26
Machine costs: Repairs and maintenance 170
Fuel 292
Custom pruning - $.41/vine 496
Custom tying - $.21/vine 254
Tying material 25
Irrigation 166
Bird control 190
Custom harvest/delivery 200
Board license and R&D fees ($24.30 per tonne) 61
Crop insurance 196
Consulting fees (soil, leaf, spray) 50
Interest on operating capital 1174
Land rental
Total Variable Costs 5637
Fixed Costs
Machine costs: Depreciation 249
Interest on investment 54
Other overhead 400
Land ownership
Measurable Fixed Costs 703
Total Measurable "Fourth Year” Costs 6339
Contribution Margin
Gross Income ($1693 per tonne) 4233
Total Variable Costs 5637
Contribution Margin (no land costs) -1404
11

Ca
be
rne
t Fra
nc
- Fo
urth
Ye
ar
Operation
Labour
(hours)
Labour
Costs
Machine
Costs*
Fixed
Costs
Total
Costs
Hand
Suckering 7.0 94 94
Shoot thin, positioning, tucking 20.0 269 269
Leaf removal 12.0 161 161
Bunch thinning 12.0 161 161
Other operations 2.0 27 27
Total Hand Labour 53.0 713 713
Machine
Weed control: Spraying (3x) 2.1 43 37 17 97
Discing, cultivating (3.5x) 2.8 58 50 28 136
Pesticide spraying (12x) 4.0 82 100 84 266
Fertilizing (2x) 1.0 21 17 13 51
Sow cover crop 0.7 14 19 29 63
Mowing (5x) 3.5 72 60 26 158
Hilling up and removal 3.0 62 54 34 149
Vineyard maintenance 3.0 62 50 22 133
Replacing vines 1.0 21 17 9 46
Hedging (2.5x) 2.0 41 58 41 141
Total Machinery Operator 23.1 475 462 303 1240
*Includes maintenance, fuel and repair
Operation Costs
Actual Budget
Preplant year 5545
Planting year 13975
Second year 4098
Third year 5270
Fourth year 6068
Total 34955
Total Establishment Cost
Excludes Board fees, harvest costs and does not include revenues for years 3 and 4.
Does not include land costs.
Actual Budget
Annual cost to recover establishment costs 1718 per year
(amortized over remaining 21 years of vineyard life)
12

Cost per acre ($)
Your Farm Yield Yield
Variable Costs 3.5 Tonne 5 Tonne
Labour: Hand, 60 hrs 807 807
Machine operator 27.4 hrs 564 564
Fertilizer: Ammonium nitrate, 30 kg 18 18
Muriate of potash, 60 kg 36 36
Insecticides 164 164
Fungicides 837 837
Herbicides 53 53
Replacement vines 1% 50 50
Cover crop seed 26 26
Wind machine 252 252
Machine costs: Repairs & maintenance 237 237
Fuel 346 346
Custom pruning $.41/vine 496 496
Custom tying - $.21/vine 254 254
Tying material 25 25
Irrigation 166 166
Bird control 190 190
Custom harvest/delivery 280 400
Board license and R&D fees ($24.30 per tonne) 85 122
Crop insurance 275 393
Consulting fees (soil, leaf, spray) 50 50
Interest on operating capital 208 219
Land rental
Total Variable Costs 5420 5705
Fixed Costs
Machine costs: Depreciation 331 331
Interest on investment 68 68
Other overhead 400 400
Land ownership
Measurable Fixed Costs 799 799
Total Measurable Cost 6219 6504
Contribution Margin
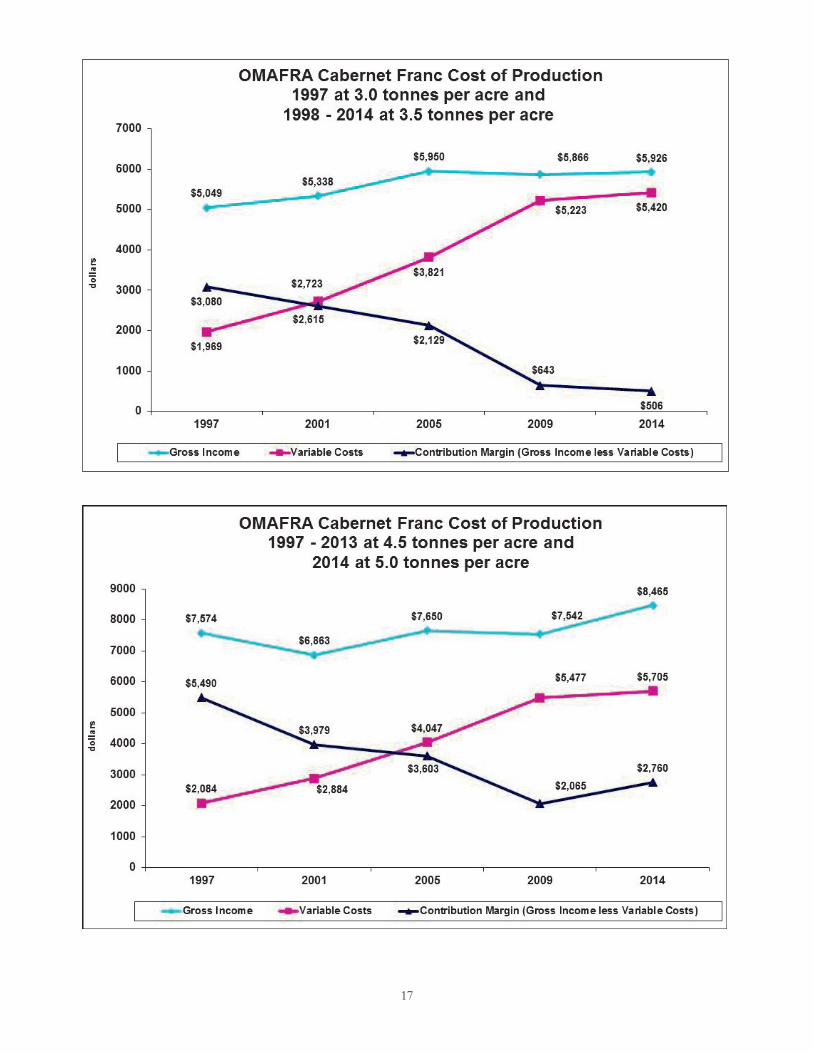
Gross Income ($1693 per tonne) 5926 8465
Total Variable Costs 5420 5705
Contribution Margin (no land costs) 506 2760
Mature Vineyard: Annual cost
Ca
be
rne
t F
ran
c -
An
nu
al
Co
st
13

Ca
be
rne
t Fra
nc
- An
nu
al C
os
t
Mature Vineyard: Annual Operation Costs
Operation
Labour
(hours)
Labour
Costs
Machine
Costs*
Fixed
Costs
Total
Costs
Hand
Suckering 7.0 94 94
Shoot thin, positioning, tucking 20.0 269 269
Leaf removal 12.0 161 161
Bunch thinning 17.0 229 229
Other operations 4.0 54 54
Total Hand Labour 60.0 807 807
Machine
Weed control: Spraying (3x) 2.1 43 36 15 94
Discing, cultivating (3.5x) 2.8 58 48 26 132
Pesticide spraying (12x) 4.0 82 98 80 260
Fertilizing (2x) 1.0 21 17 12 49
Sow cover crop 1.0 21 23 30 74
Mowing (5x) 3.5 72 58 23 153
Hilling up and removal 3.0 62 52 31 145
Subsoiling/aerating 1.0 21 19 10 49
Vineyard maintenance 3.0 62 48 19 129
Replacing vines 1.0 21 17 8 45
Hedging (2.5x) 2.0 41 57 44 143
Leaf removal (1.5x) 1.5 31 73 72 176
Brush shredding/flail 1.5 31 38 29 98
Total Machinery Operator 27.4 564 583 399 1546
*Includes maintenance, fuel and repair
14

Ca
be
rne
t F
ran
c -
Bre
ak
Eve
n
Break Even and Profitability Worksheet
Year
Yield
% Revenue
Variable
Costs
Fixed
Costs
Total
Costs
Net Cash
Flow
Accum.
Profit
Pre-plant 0% 0 5278 267 5545 -5545 -5545
Planting 0% 0 13360 615 13975 -13975 -19520
2 0% 0 3431 666 4097 -4097 -23617
3 25% 2116 4923 703 5625 -3509 -27126
4 50% 4233 5636 703 6339 -2106 -29233
5 100% 5926 6472 799 7271 -1345 -30578
6 100% 5926 6494 799 7292 -1367 -31945
7 100% 5926 6516 799 7315 -1390 -33334
8 100% 5926 6540 799 7339 -1413 -34748
9 100% 5926 6564 799 7363 -1438 -36185
10 100% 5926 6590 799 7389 -1463 -37649
11 100% 5926 6617 799 7415 -1490 -39139
12 100% 5926 6644 799 7443 -1518 -40656
There is no breakeven at the 3.5 tonne/acre yield level (does not include land costs).
3.5 tonne/acre yield
Year
Yield
% Revenue
Variable
Costs
Fixed
Costs
Total
Costs
Net Cash
Flow
Accum.
Profit
Pre-plant 0% 0 5278 267 5545 -5545 -5545
Planting 0% 0 13360 615 13975 -13975 -19520
2 0% 0 3431 666 4097 -4097 -23617
3 25% 2116 4923 703 5625 -3509 -27126
4 50% 4233 5636 703 6339 -2106 -29233
5 100% 8465 6757 799 7555 910 -28323
6 100% 8465 6688 799 7487 978 -27346
7 100% 8465 6617 799 7416 1049 -26297
8 100% 8465 6543 799 7342 1123 -25174
9 100% 8465 6466 799 7265 1200 -23974
10 100% 8465 6387 799 7185 1280 -22694
11 100% 8465 6303 799 7102 1363 -21332
12 100% 8465 6217 799 7016 1449 -19882
Breakeven in Year 22 (does not include land costs).
5 tonne/acre yield
15

Yield
MT/ac Revenue
Variable costs excluding harvest
and operating interest costs
Harvest
costs
Operating
interest
Total Variable
Costs
Contribution
Margin
2.5 4233 4906 261 204 5371 -1138
2.6 4402 4906 271 205 5382 -980
2.7 4571 4906 282 205 5393 -822
2.8 4740 4906 292 206 5404 -663
2.9 4910 4906 302 206 5414 -505
3.0 5079 4906 313 206 5425 -346
3.1 5248 4906 323 207 5436 -188
3.2 5418 4906 334 207 5447 -29
3.3 5587 4906 344 208 5458 129
3.4 5756 4906 355 208 5469 288
3.5 5926 4906 365 208 5479 446
3.6 6095 4906 375 209 5490 604
3.7 6264 4906 386 209 5501 763
3.8 6433 4906 396 210 5512 921
Breakeven yield to cover annual variable costs is 3.3 tonnes / acre.
Yield
MT/ac Revenue
Annual costs excl.
harvest and operating
interest costs
Harvesting
costs
Operating
interest
Annualized
Est. Costs
Total Costs
with Est.
Costs
Net Cash
Flow
3.8 6433 5705 396 210 1718 8029 -1596
3.9 6603 5705 407 210 1718 8040 -1437
4.0 6772 5705 417 211 1718 8051 -1279
4.1 6941 5705 428 211 1718 8062 -1121
4.2 7111 5705 438 211 1718 8073 -962
4.3 7280 5705 448 212 1718 8084 -804
4.4 7449 5705 459 212 1718 8094 -645
4.5 7619 5705 469 213 1718 8105 -487
4.6 7788 5705 480 213 1718 8116 -328
4.7 7957 5705 490 213 1718 8127 -170
4.8 8126 5705 501 214 1718 8138 -11
4.9 8296 5705 511 214 1718 8149 147
5.0 8465 5705 522 215 1718 8159 306
5.1 8634 5705 532 215 1718 8170 464
Breakeven yield to cover total annual costs is 4.9 tonnes / acre.
(Includes annualized establishment costs, does not include land costs)
Ca
be
rne
t Fra
nc
- Bre
ak
Eve
n
Break Even Yield to Cover Total Costs
Break Even Yield to Cover Variable Costs
16
17

3. Chardonnay
Preplant Year
Cost per acre ($)
Variable Costs Actual Budget
Labour: Machinery operator, 4.5 hrs 93
Custom plowing 24
Cover crop 52
Machine costs: Repairs and maintenance 30
Fuel 57
Consulting fees 50
Interest on operating capital 103
Land rental
Land preparation (levelling etc.) 1000
Tile drainage (9 foot) 3869
Total Variable Costs 5278
Fixed Costs
Machine costs: Depreciation 55
Interest on investment 12
Other overhead 200
Land ownership
Measurable Fixed Costs 267
Total Measurable "Preplant Year” Costs 5545
Operation
Labour
(hours)
Labour
Costs
Machine
Costs*
Fixed
Costs
Total
Costs
Machine
Discing, cultivating (3.5x) 2.8 58 49 27 134
Sub soiling 1.0 21 19 10 50
Sow cover crop 0.7 14 19 29 62
Total Machinery Operator 4.5 93 87 67 247
*Includes maintenance, fuel and repair
Operation Costs
Ch
ard
on
na
y - P
rep
lan
t Ye
ar
18
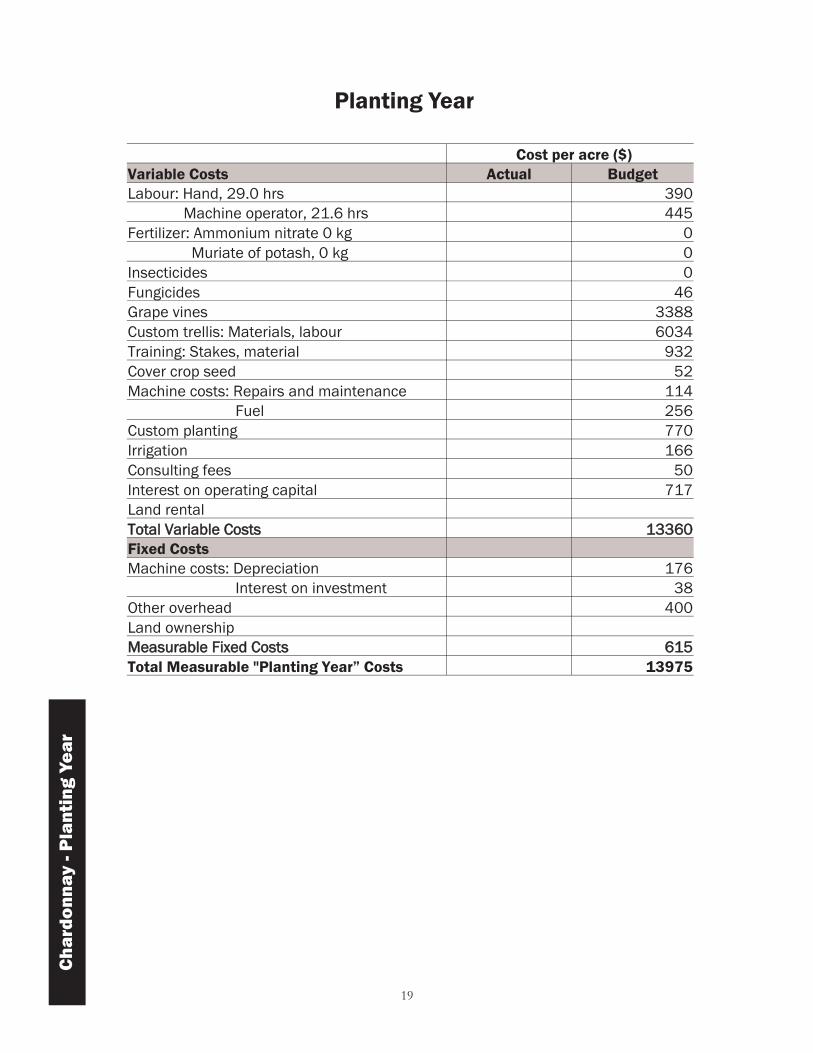
Cost per acre ($)
Variable Costs Actual Budget
Labour: Hand, 29.0 hrs 390
Machine operator, 21.6 hrs 445
Fertilizer: Ammonium nitrate 0 kg 0
Muriate of potash, 0 kg 0
Insecticides 0
Fungicides 46
Grape vines 3388
Custom trellis: Materials, labour 6034
Training: Stakes, material 932
Cover crop seed 52
Machine costs: Repairs and maintenance 114
Fuel 256
Custom planting 770
Irrigation 166
Consulting fees 50
Interest on operating capital 717
Land rental
Total Variable Costs 13360
Fixed Costs
Machine costs: Depreciation 176
Interest on investment 38
Other overhead 400
Land ownership
Measurable Fixed Costs 615
Total Measurable "Planting Year” Costs 13975
Planting Year
Ch
ard
on
na
y -
Pla
nti
ng
Ye
ar
19

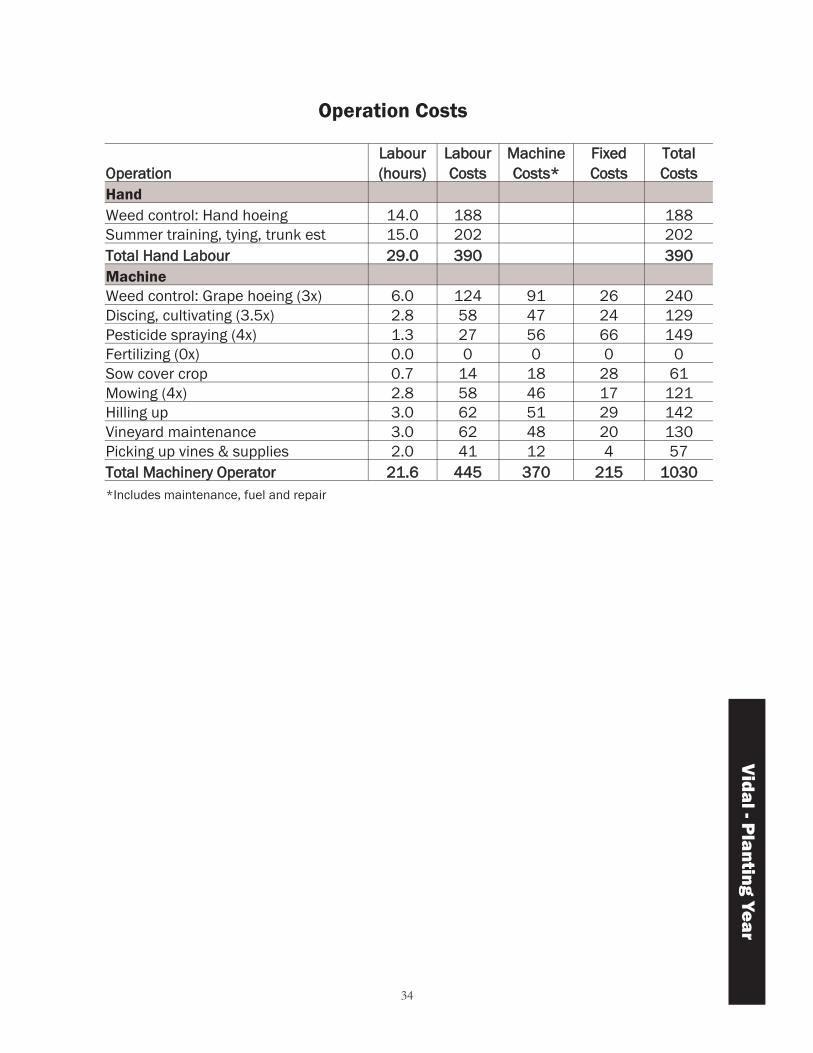
Operation
Labour
(hours)
Labour
Costs
Machine
Costs*
Fixed
Costs
Total
Costs
Hand
Weed control: Hand hoeing 14.0 188 188
Summer training, tying, trunk est 15.0 202 202
Total Hand Labour 29.0 390 390
Machine
Weed control: Grape hoeing (3x) 6.0 124 91 26 240
Discing, cultivating (3.5x) 2.8 58 47 24 129
Pesticide spraying (4x) 1.3 27 56 66 149
Fertilizing (0x) 0.0 0 0 0 0
Sow cover crop 0.7 14 18 28 61
Mowing (4x) 2.8 58 46 17 121
Hilling up 3.0 62 51 29 142
Vineyard maintenance 3.0 62 48 20 130
Picking up vines & supplies 2.0 41 12 4 57
Total Machinery Operator 21.6 445 370 215 1030
*Includes maintenance, fuel and repair
Ch
ard
on
na
y - P
lan
ting
Ye
ar
Operation Costs
20

Cost per acre ($)
Variable Costs Actual Budget
Labour: Hand, 29.0 hr 390
Machine operator, 25.0 hr 516
Fertilizer: Ammonium nitrate, 0 kg 0
Muriate of potash, 0 kg 0
Insecticides 54
Fungicides 222
Herbicides 42
Replacement vines, 2% 100
Cover crop seed 26
Machine costs: Repairs and maintenance 143
Fuel 316
Custom pruning - $.27/vine 327
Custom tying - $.17/vine 206
Tying material 25
Irrigation 166
Consulting fees 50
Interest on operating capital 849
Land rental
Total Variable Costs 3431
Fixed Costs
Machine costs: Depreciation 218
Interest on investment 48
Other overhead 400
Land ownership
Measurable Fixed Costs 666
Total Measurable "Second Year” Costs 4098
Second Year
Ch
ard
on
na
y -
Se
co
nd
Ye
ar
21

Ch
ard
on
na
y - S
ec
on
d Y
ea
r
Operation Costs
Operation
Labour
(hours)
Labour
Costs
Machine
Costs*
Fixed
Costs
Total
Costs
Hand
Weed control: Hand hoeing 14.0 188 188
Summer training, tying, trunk est 15.0 202 202
Total Hand Labour 29.0 390 390
Machine
Weed control: Grape hoeing (3x) 6.0 124 94 32 250
Spraying (2x) 1.4 29 25 13 67
Discing, cultivating (3.5x) 2.8 58 49 27 134
Pesticide spraying (8x) 2.6 54 77 75 206
Fertilizing (0x) 0.0 0 0 0 0
Sow cover crop 0.7 14 19 29 62
Mowing (5x) 3.5 72 59 24 155
Hilling up and removal 3.0 62 53 32 147
Vineyard maintenance 3.0 62 50 20 132
Replacing vines 2.0 41 33 14 87
Total Machinery Operator 25.0 516 459 266 1241
*Includes maintenance, fuel and repair
22
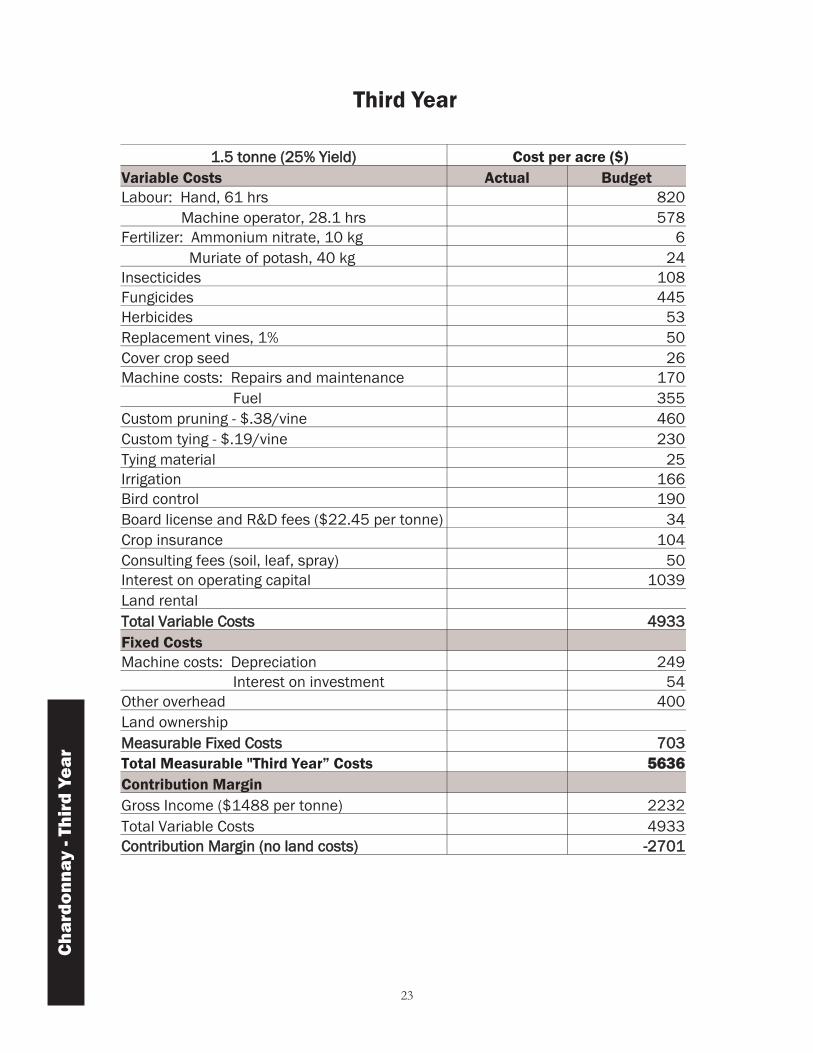
1.5 tonne (25% Yield) Cost per acre ($)
Variable Costs Actual Budget
Labour: Hand, 61 hrs 820
Machine operator, 28.1 hrs 578
Fertilizer: Ammonium nitrate, 10 kg 6
Muriate of potash, 40 kg 24
Insecticides 108
Fungicides 445
Herbicides 53
Replacement vines, 1% 50
Cover crop seed 26
Machine costs: Repairs and maintenance 170
Fuel 355
Custom pruning - $.38/vine 460
Custom tying - $.19/vine 230
Tying material 25
Irrigation 166
Bird control 190
Board license and R&D fees ($22.45 per tonne) 34
Crop insurance 104
Consulting fees (soil, leaf, spray) 50
Interest on operating capital 1039
Land rental
Total Variable Costs 4933
Fixed Costs
Machine costs: Depreciation 249
Interest on investment 54
Other overhead 400
Land ownership
Measurable Fixed Costs 703
Total Measurable "Third Year” Costs 5636
Contribution Margin
Gross Income ($1488 per tonne) 2232
Total Variable Costs 4933
Contribution Margin (no land costs) -2701
Third Year
23
Ch
ard
on
na
y -
Th
ird
Ye
ar

Operation
Labour
(hours)
Labour
Costs
Machine
Costs*
Fixed
Costs
Total
Costs
Hand
Suckering 7.0 94 94
Shoot thin, positioning, tucking 20.0 269 269
Leaf removal 12.0 161 161
Bunch thinning 12.0 161 161
Other operations 2.0 27 27
Hand harvest 8.0 108 108
Total Hand Labour 61.0 820 820
Machine
Weed control: Spraying (3x) 2.1 43 35 15 94
Discing, cultivating (3.5x) 2.8 58 48 25 131
Pesticide spraying (12x) 4.0 82 98 80 259
Fertilizing (2x) 1.0 21 17 12 49
Sow cover crop 0.7 14 19 29 62
Mowing (5x) 3.5 72 58 22 152
Hilling up and removal 3.0 62 52 31 144
Vineyard maintenance 3.0 62 48 19 128
Replacing vines 1.0 21 16 8 45
Hedging (2.5x) 2.0 41 57 39 138
Harvest pick up and delivery 5.0 103 77 24 204
Total Machinery Operator 28.1 578 525 303 1406
*Includes maintenance, fuel and repair
Operation Costs
24
Ch
ard
on
na
y - T
hird
Ye
ar

3 tonne (50% Yield) Cost per acre ($)
Variable Costs Actual Budget
Labour: Hand, 53.0 hrs 713
Machine operator, 23.1 hrs 475
Fertilizer: Ammonium nitrate, 25 kg 15
Muriate of potash, 50 kg 30
Insecticides 164
Fungicides 837
Herbicides 53
Replacement vines, 1% 50
Cover crop seed 26
Machine Costs: Repairs and maintenance 170
Fuel 292
Custom pruning - $.41/vine 496
Custom tying - $.21/vine 254
Tying material 25
Irrigation 166
Bird control 190
Custom harvest/delivery 240
Board license and R&D fees ($22.45 per tonne) 67
Crop insurance 207
Consulting fees (soil, leaf, spray) 50
Interest on operating capital 1172
Land rental
Total Variable Costs 5692
Fixed Costs
Machine costs: Depreciation 249
Interest on investment 54
Other overhead 400
Land ownership
Measurable Fixed Costs 703
Total Measurable "Fourth Year” Costs 6395
Contribution Margin
Gross Income ($1488) per tonne) 4464
Total Variable Costs 5692
Contribution Margin (no land costs) -1228
Fourth Year
25
Ch
ard
on
na
y -
Fo
urt
h Y
ea
r

Operation
Labour
(hours)
Labour
Costs
Machine
Costs*
Fixed
Costs
Total
Costs
Hand
Suckering 7.0 94 94
Shoot thin, positioning, tucking 20.0 269 269
Leaf removal 12.0 161 161
Bunch thinning 12.0 161 161
Other operations 2.0 27 27
Total Hand Labour 53.0 713 713
Machine
Weed control: Spraying (3x) 2.1 43 37 17 97
Discing, cultivating (3.5x) 2.8 58 50 28 136
Pesticide spraying (12x) 4.0 82 100 84 266
Fertilizing (2x) 1.0 21 17 13 51
Sow cover crop 0.7 14 19 29 63
Mowing (5x) 3.5 72 60 26 158
Hilling up and removal 3.0 62 54 34 149
Vineyard maintenance 3.0 62 50 22 133
Replacing vines 1.0 21 17 9 46
Hedging (2.5x) 2.0 41 58 41 141
Total Machinery Operator 23.1 475 462 303 1240
*Includes maintenance, fuel and repair
Operation Costs
Actual Budget
Preplant year 5545
Planting year 13975
Second year 4098
Third year 5277
Fourth year 6075
Total 34969
Total Establishment Cost
Excludes Board fees, harvest costs and does not include revenues for years 3 and 4.
Does not include land costs.
Actual Budget
Annual cost to recover establishment costs 1702 per year
(amortized over remaining 21 years of vineyard life)
26
Ch
ard
on
na
y - F
ou
rth Y
ea
r

Cost per acre ($)
Your Farm Yield Yield
Variable Costs 4 Tonne 6 Tonne
Labour: Hand, 60.0 hrs 807 807
Machine operator 27.4 hrs 564 564
Fertilizer: Ammonium nitrate, 30 kg 18 18
Muriate of potash, 60 kg 36 36
Insecticides 164 164
Fungicides 837 837
Herbicides 53 53
Replacement vines 1% 50 50
Cover crop seed 26 26
Wind machine 252 252
Machine costs: Repairs & maintenance 237 237
Fuel 346 346
Custom pruning $.41/vine 496 496
Custom tying - $.21/vine 254 254
Tying material 25 25
Irrigation 166 166
Bird control 95 95
Custom harvest/delivery 320 480
Board license and R&D fees ($22.45 per tonne) 90 135
Crop insurance 276 414
Consulting fees (soil, leaf, spray) 50 50
Interest on operating capital 206 220
Land rental
Total Variable Costs 5368 5725
Fixed Costs
Machine costs: Depreciation 331 331
Interest on investment 68 68
Other overhead 400 400
Land ownership
Measurable Fixed Costs 799 799
Total Measurable Cost 6167 6524
Contribution Margin
Gross Income ($1488 per tonne) 5952 8928
Total Variable Costs 5368 5725
Contribution Margin (no land costs) 584 3203
Mature Vineyard: Annual Costs
27
Ch
ard
on
na
y -
Ma
ture
Vin
eya
rd

Operation
Labour
(hours)
Labour
Costs
Machine
Costs*
Fixed
Costs
Total
Costs
Hand
Suckering 7.0 94 94
Shoot thin, positioning, tucking 20.0 269 269
Leaf removal 12.0 161 161
Bunch thinning 17.0 229 229
Other operations 4.0 54 54
Total Hand Labour 60.0 807 807
Machine
Weed control: Spraying (3x) 2.1 43 36 15 94
Discing, cultivating (3.5x) 2.8 58 48 26 132
Pesticide spraying (12x) 4.0 82 98 80 260
Fertilizing (2x) 1.0 21 17 12 49
Sow cover crop 1.0 21 23 30 74
Mowing (5x) 3.5 72 58 23 153
Hilling up and removal 3.0 62 52 31 145
Subsoiling/aerating 1.0 21 19 10 49
Vineyard maintenance 3.0 62 48 19 129
Replacing vines 1.0 21 17 8 45
Hedging (2.5x) 2.0 41 57 44 143
Leaf removal (1.5x) 1.5 31 73 72 176
Brush shredding/flail 1.5 31 38 29 98
Total Machinery Operator 27.4 564 583 399 1546
*Includes maintenance, fuel and repair
Mature Vineyard: Annual Operation Costs
28
Ch
ard
on
na
y - M
atu
re V
ine
ya
rd

Break Even and Profitability Worksheet
Year
Yield
% Revenue
Variable
Costs
Fixed
Costs
Total
Costs
Net Cash
Flow
Accum.
Profit
Pre-plant 0% 0 5278 267 5545 -5545 -5545
Planting 0% 0 13360 615 13975 -13975 -19520
2 0% 0 3431 666 4097 -4097 -23617
3 25% 2232 4933 703 5635 -3403 -27020
4 50% 4464 5692 703 6395 -1931 -28951
5 100% 5952 6408 799 7207 -1255 -30206
6 100% 5952 6427 799 7226 -1274 -31480
7 100% 5952 6446 799 7244 -1292 -32772
8 100% 5952 6465 799 7264 -1312 -34084
9 100% 5952 6486 799 7285 -1333 -35417
10 100% 5952 6507 799 7306 -1354 -36771
11 100% 5952 6530 799 7328 -1376 -38148
12 100% 5952 6553 799 7351 -1399 -39547
There is no breakeven at the 4 tonne/acre yield level (does not include land costs).
4 tonne/acre yield
Year
Yield
% Revenue
Variable
Costs
Fixed
Costs
Total
Costs
Net Cash
Flow
Accum.
Profit
Pre-plant 0% 0 5278 267 5545 -5545 -5545
Planting 0% 0 13360 615 13975 -13975 -19520
2 0% 0 3431 666 4097 -4097 -23617
3 25% 2232 4933 703 5635 -3403 -27020
4 50% 4464 5692 703 6395 -1931 -28951
5 100% 8928 6765 799 7564 1364 -27587
6 100% 8928 6679 799 7477 1451 -26136
7 100% 8928 6589 799 7387 1541 -24596
8 100% 8928 6495 799 7294 1634 -22962
9 100% 8928 6398 799 7197 1731 -21230
10 100% 8928 6297 799 7095 1833 -19398
11 100% 8928 6191 799 6990 1938 -17460
12 100% 8928 6082 799 6881 2047 -15413
Breakeven in Year 19 (does not include land costs).
6 tonne/acre yield
29
Ch
ard
on
na
y -
Bre
ak
Eve
n
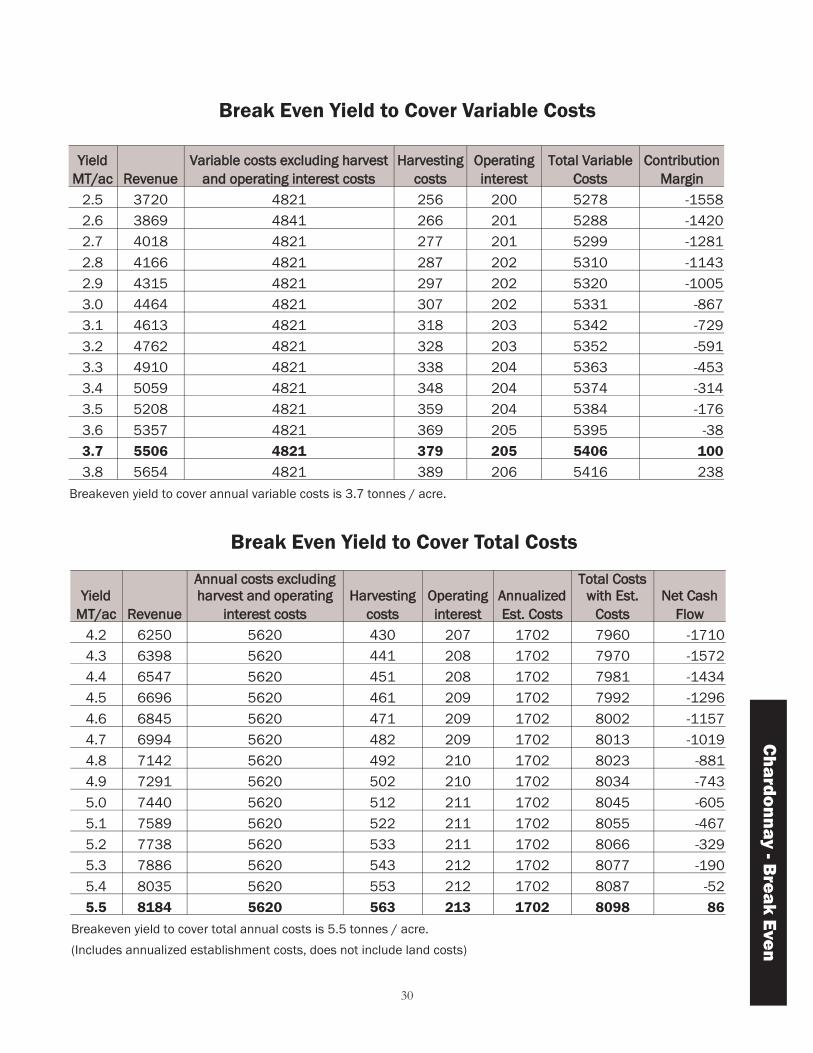
Yield
MT/ac Revenue
Variable costs excluding harvest
and operating interest costs
Harvesting
costs
Operating
interest
Total Variable
Costs
Contribution
Margin
2.5 3720 4821 256 200 5278 -1558
2.6 3869 4841 266 201 5288 -1420
2.7 4018 4821 277 201 5299 -1281
2.8 4166 4821 287 202 5310 -1143
2.9 4315 4821 297 202 5320 -1005
3.0 4464 4821 307 202 5331 -867
3.1 4613 4821 318 203 5342 -729
3.2 4762 4821 328 203 5352 -591
3.3 4910 4821 338 204 5363 -453
3.4 5059 4821 348 204 5374 -314
3.5 5208 4821 359 204 5384 -176
3.6 5357 4821 369 205 5395 -38
3.7 5506 4821 379 205 5406 100
3.8 5654 4821 389 206 5416 238
Breakeven yield to cover annual variable costs is 3.7 tonnes / acre.
Yield
MT/ac Revenue
Annual costs excluding
harvest and operating
interest costs
Harvesting
costs
Operating
interest
Annualized
Est. Costs
Total Costs
with Est.
Costs
Net Cash
Flow
4.2 6250 5620 430 207 1702 7960 -1710
4.3 6398 5620 441 208 1702 7970 -1572
4.4 6547 5620 451 208 1702 7981 -1434
4.5 6696 5620 461 209 1702 7992 -1296
4.6 6845 5620 471 209 1702 8002 -1157
4.7 6994 5620 482 209 1702 8013 -1019
4.8 7142 5620 492 210 1702 8023 -881
4.9 7291 5620 502 210 1702 8034 -743
5.0 7440 5620 512 211 1702 8045 -605
5.1 7589 5620 522 211 1702 8055 -467
5.2 7738 5620 533 211 1702 8066 -329
5.3 7886 5620 543 212 1702 8077 -190
5.4 8035 5620 553 212 1702 8087 -52
5.5 8184 5620 563 213 1702 8098 86
Breakeven yield to cover total annual costs is 5.5 tonnes / acre.
(Includes annualized establishment costs, does not include land costs)
Break Even Yield to Cover Variable Costs
30
Ch
ard
on
na
y - B
rea
k E
ve
n
Break Even Yield to Cover Total Costs

31

32
4. Vidal
Cost per acre ($)
Actual Budget
Variable Costs
Labour: Machinery operator, 4.5 hrs 93
Custom plowing 24
Cover crop 52
Machine costs: Repairs and maintenance 30
Fuel 57
Consulting fees 50
Interest on operating capital 103
Land rental
Land preparation (levelling etc.) 1000
Tile drainage (9 foot) 3869
Total Variable Costs 5278
Fixed Costs
Machine costs: Depreciation 55
Interest on investment 12
Other overhead 200
Land ownership
Measurable Fixed Costs 267
Total Measurable "Preplant Year” Costs 5545
Operation
Labour
(hours)
Labour
Costs
Machine
Costs*
Fixed
Costs
Total
Costs
Machine
Discing, cultivating (3.5x) 2.8 58 49 27 134
Sub soiling 1.0 21 19 10 50
Sow cover crop 0.7 14 19 29 62
Total Machinery Operator 4.5 93 87 67 247
*Includes maintenance, fuel and repair
Operation Costs
Vid
al - P
rep
lan
t Ye
ar
Preplant Year

33
Cost per acre ($)
Variable Costs Actual Budget
Labour: Hand, 29.0 hrs 390
Machine operator, 21.6 hrs 445
Fertilizer: Ammonium nitrate 0 kg 0
Muriate of potash, 0 kg 0
Insecticides 0
Fungicides 46
Grape vines 2710
Custom trellis: Materials, labour 6034
Training: Stakes, material 745
Cover crop seed 52
Machine costs: Repairs and maintenance 114
Fuel 256
Custom planting 661
Irrigation 166
Consulting fees 50
Interest on operating capital 678
Land rental
Total Variable Costs 12348
Fixed Costs
Machine costs: Depreciation 176
Interest on investment 38
Other overhead 400
Land ownership
Measurable Fixed Costs 615
Total Measurable "Planting Year” Costs 12962
Planting Year
Vid
al
- P
lan
tin
g Y
ea
r
34
Operation
Labour
(hours)
Labour
Costs
Machine
Costs*
Fixed
Costs
Total
Costs
Hand
Weed control: Hand hoeing 14.0 188 188
Summer training, tying, trunk est 15.0 202 202
Total Hand Labour 29.0 390 390
Machine
Weed control: Grape hoeing (3x) 6.0 124 91 26 240
Discing, cultivating (3.5x) 2.8 58 47 24 129
Pesticide spraying (4x) 1.3 27 56 66 149
Fertilizing (0x) 0.0 0 0 0 0
Sow cover crop 0.7 14 18 28 61
Mowing (4x) 2.8 58 46 17 121
Hilling up 3.0 62 51 29 142
Vineyard maintenance 3.0 62 48 20 130
Picking up vines & supplies 2.0 41 12 4 57
Total Machinery Operator 21.6 445 370 215 1030
*Includes maintenance, fuel and repair
Operation Costs
Vid
al - P
lan
ting
Ye
ar

35
Cost per acre ($)
Variable Costs Actual Budget
Labour: Hand, 29.0 hr 390
Machine operator, 24.5 hr 506
Fertilizer: Ammonium nitrate, 20 kg 12
Muriate of potash, 20 kg 12
Insecticides 54
Fungicides 222
Herbicides 42
Replacement vines, 2% 80
Cover crop seed 26
Machine Costs: Repairs and maintenance 141
Fuel 310
Custom pruning - $.27/vine 261
Custom tying - $.17/vine 165
Tying material 50
Irrigation 166
Consulting fees 25
Interest on operating capital 803
Land rental
Total Variable Costs 3264
Fixed Costs
Machine costs: Depreciation 218
Interest on investment 48
Other overhead 400
Land ownership
Measurable Fixed Costs 666
Total Measurable "Second Year” Costs 3929
Vid
al
- S
ec
on
d Y
ea
r
Second Year

36
Operation
Labour
(hours)
Labour
Costs
Machine
Costs*
Fixed
Costs
Total
Costs
Hand
Weed control: Hand hoeing 14.0 188 188
Summer training, tying, trunk est 15.0 202 202
Total Hand Labour 29.0 390 390
Machine
Weed control: Grape hoeing (3x) 6.0 124 94 31 249
Spraying (2x) 1.4 29 25 12 66
Discing, cultivating (3.5x) 2.8 58 49 27 133
Pesticide spraying (8x) 2.6 54 77 74 206
Fertilizing (2x) 1.0 21 17 12 50
Sow cover crop 0.7 14 19 29 62
Mowing (5x) 3.5 72 59 24 154
Hilling up and removal 1.5 31 29 24 84
Vineyard maintenance 3.0 62 50 20 131
Replacing vines 2.0 41 32 13 87
Total Machinery Operator 24.5 506 450 266 1221
*Includes maintenance, fuel and repair
Vid
al - S
ec
on
d Y
ea
r
Operation Costs

37
Third Year
2.5 tonne (25% Yield) Cost per acre ($)
Variable Costs Actual Budget
Labour: Hand, 17.0 hrs 229
Machine operator, 25.1 hrs 516
Fertilizer: Ammonium nitrate, 40 kg 24
Muriate of potash, 60 kg 37
Insecticides 108
Fungicides 445
Herbicides 53
Replacement vines, 1% 40
Cover crop seed 26
Machine costs: Repairs and maintenance 160
Fuel 317
Custom pruning - $.38/vine 368
Custom tying - $.19/vine 184
Tying material 50
Irrigation 166
Bird control 90
Board license and R&D fees ($14.75 per tonne) 37
Crop insurance 31
Consulting fees (soil, leaf, spray) 25
Interest on operating capital 952
Land rental
Total Variable Costs 3858
Fixed Costs
Machine costs: Depreciation 229
Interest on investment 50
Other overhead 400
Land ownership
Measurable Fixed Costs 679
Total Measurable "Third Year” Costs 4537
Contribution Margin
Gross Income ($633 per tonne) 1583
Total Variable Costs 3858
Contribution Margin (no land costs) -2276
Vid
al
- Th
ird
Ye
ar

Operation
Labour
(hours)
Labour
Costs
Machine
Costs*
Fixed
Costs
Total
Costs
Hand
Suckering 7.0 94 94
Shoot thin, positioning, tucking 0.0 0 0
Leaf removal 0.0 0 0
Bunch thinning 0.0 0 0
Other operations 2.0 27 27
Hand harvest 8.0 108 108
Total Hand Labour 17.0 229 229
Machine
Weed control: Spraying (3x) 2.1 43 36 16 95
Discing, cultivating (3.5x) 2.8 58 48 26 132
Pesticide spraying (12x) 4.0 82 99 81 261
Fertilizing (2x) 1.0 21 17 12 50
Sow cover crop 0.7 14 19 29 62
Mowing (5x) 3.5 72 59 23 154
Hilling up and removal 0.0 0 0 0 0
Vineyard maintenance 3.0 62 48 19 130
Replacing vines 1.0 21 17 8 45
Hedging (2.5x) 2.0 41 57 40 138
Harvest pick up and delivery 5.0 103 78 25 206
Total Machinery Operator 25.1 516 478 279 1273
*Includes maintenance, fuel and repair
Operation Costs
Vid
al - T
hird
Ye
ar
38
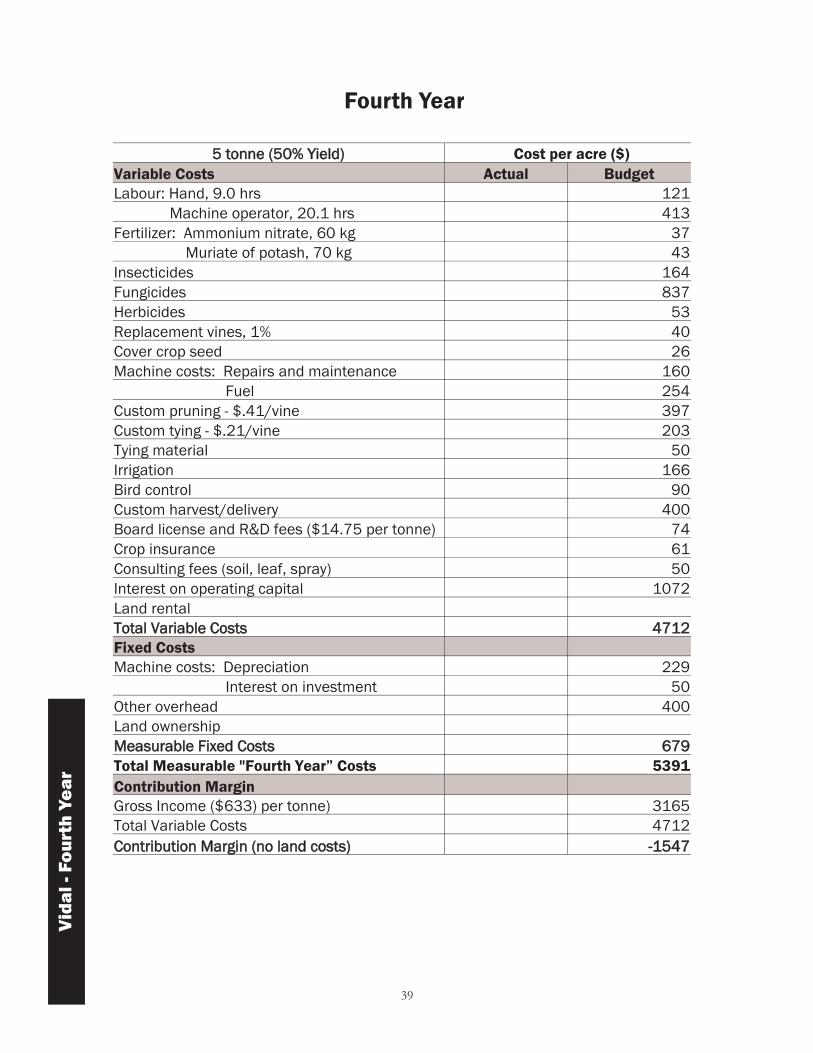
5 tonne (50% Yield) Cost per acre ($)
Variable Costs Actual Budget
Labour: Hand, 9.0 hrs 121
Machine operator, 20.1 hrs 413
Fertilizer: Ammonium nitrate, 60 kg 37
Muriate of potash, 70 kg 43
Insecticides 164
Fungicides 837
Herbicides 53
Replacement vines, 1% 40
Cover crop seed 26
Machine costs: Repairs and maintenance 160
Fuel 254
Custom pruning - $.41/vine 397
Custom tying - $.21/vine 203
Tying material 50
Irrigation 166
Bird control 90
Custom harvest/delivery 400
Board license and R&D fees ($14.75 per tonne) 74
Crop insurance 61
Consulting fees (soil, leaf, spray) 50
Interest on operating capital 1072
Land rental
Total Variable Costs 4712
Fixed Costs
Machine costs: Depreciation 229
Interest on investment 50
Other overhead 400
Land ownership
Measurable Fixed Costs 679
Total Measurable "Fourth Year” Costs 5391
Contribution Margin
Gross Income ($633) per tonne) 3165
Total Variable Costs 4712
Contribution Margin (no land costs) -1547
Fourth Year
Vid
al
- F
ou
rth
Ye
ar
39
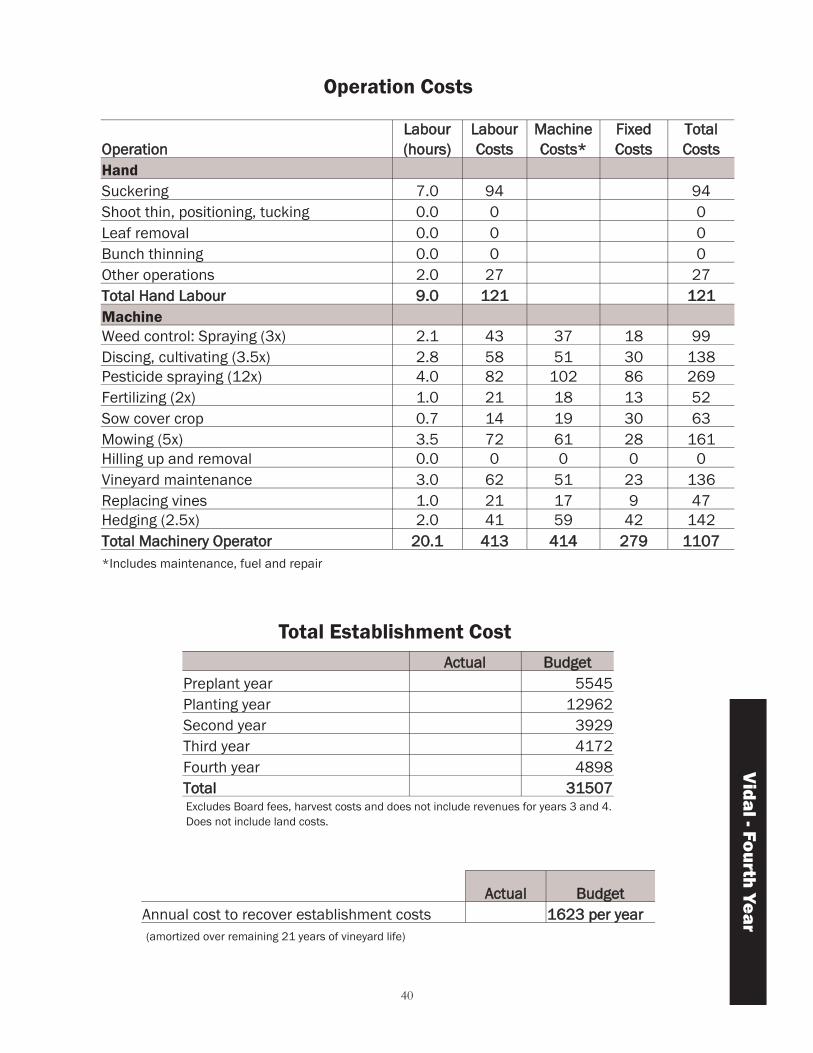
Operation
Labour
(hours)
Labour
Costs
Machine
Costs*
Fixed
Costs
Total
Costs
Hand
Suckering 7.0 94 94
Shoot thin, positioning, tucking 0.0 0 0
Leaf removal 0.0 0 0
Bunch thinning 0.0 0 0
Other operations 2.0 27 27
Total Hand Labour 9.0 121 121
Machine
Weed control: Spraying (3x) 2.1 43 37 18 99
Discing, cultivating (3.5x) 2.8 58 51 30 138
Pesticide spraying (12x) 4.0 82 102 86 269
Fertilizing (2x) 1.0 21 18 13 52
Sow cover crop 0.7 14 19 30 63
Mowing (5x) 3.5 72 61 28 161
Hilling up and removal 0.0 0 0 0 0
Vineyard maintenance 3.0 62 51 23 136
Replacing vines 1.0 21 17 9 47
Hedging (2.5x) 2.0 41 59 42 142
Total Machinery Operator 20.1 413 414 279 1107
*Includes maintenance, fuel and repair
Actual Budget
Preplant year 5545
Planting year 12962
Second year 3929
Third year 4172
Fourth year 4898
Total 31507
Total Establishment Cost
Excludes Board fees, harvest costs and does not include revenues for years 3 and 4.
Does not include land costs.
Actual Budget
Annual cost to recover establishment costs 1623 per year
(amortized over remaining 21 years of vineyard life)
Vid
al - F
ou
rth Y
ea
r
Operation Costs
40
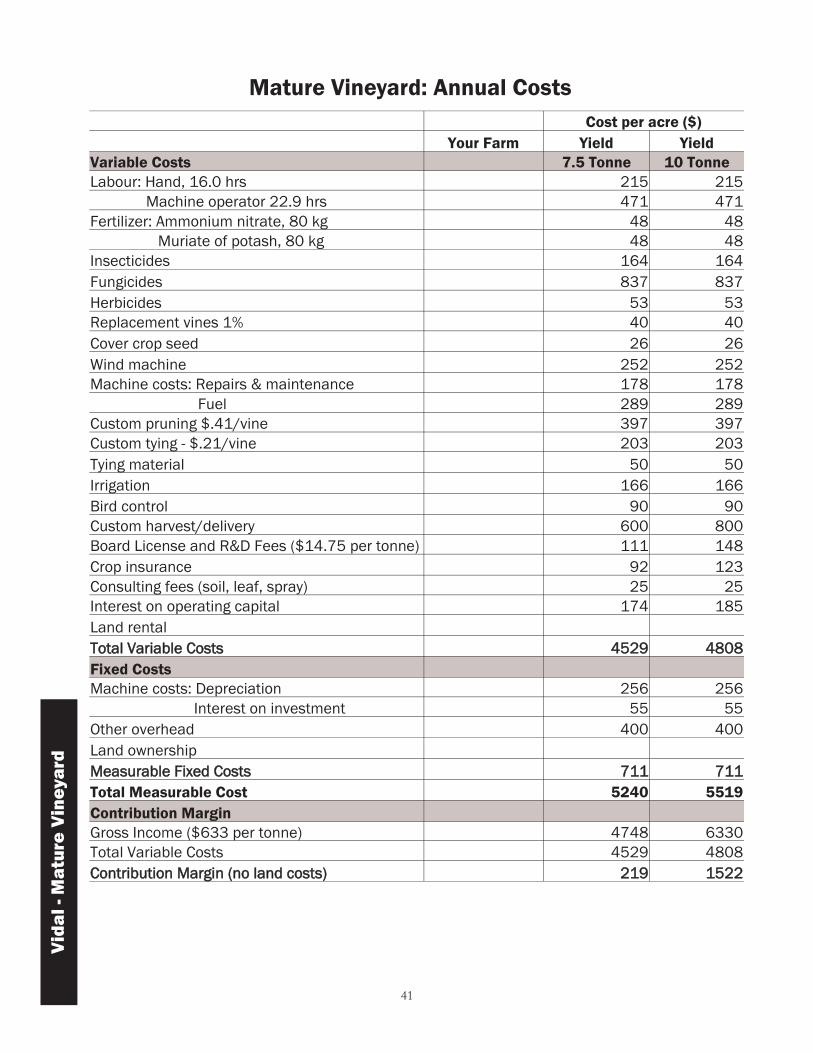
Cost per acre ($)
Your Farm Yield Yield
Variable Costs 7.5 Tonne 10 Tonne
Labour: Hand, 16.0 hrs 215 215
Machine operator 22.9 hrs 471 471
Fertilizer: Ammonium nitrate, 80 kg 48 48
Muriate of potash, 80 kg 48 48
Insecticides 164 164
Fungicides 837 837
Herbicides 53 53
Replacement vines 1% 40 40
Cover crop seed 26 26
Wind machine 252 252
Machine costs: Repairs & maintenance 178 178
Fuel 289 289
Custom pruning $.41/vine 397 397
Custom tying - $.21/vine 203 203
Tying material 50 50
Irrigation 166 166
Bird control 90 90
Custom harvest/delivery 600 800
Board License and R&D Fees ($14.75 per tonne) 111 148
Crop insurance 92 123
Consulting fees (soil, leaf, spray) 25 25
Interest on operating capital 174 185
Land rental
Total Variable Costs 4529 4808
Fixed Costs
Machine costs: Depreciation 256 256
Interest on investment 55 55
Other overhead 400 400
Land ownership
Measurable Fixed Costs 711 711
Total Measurable Cost 5240 5519
Contribution Margin
Gross Income ($633 per tonne) 4748 6330
Total Variable Costs 4529 4808
Contribution Margin (no land costs) 219 1522
Mature Vineyard: Annual Costs
Vid
al
- M
atu
re V
ine
ya
rd
41
Vid
al - M
atu
re V
ine
ya
rd
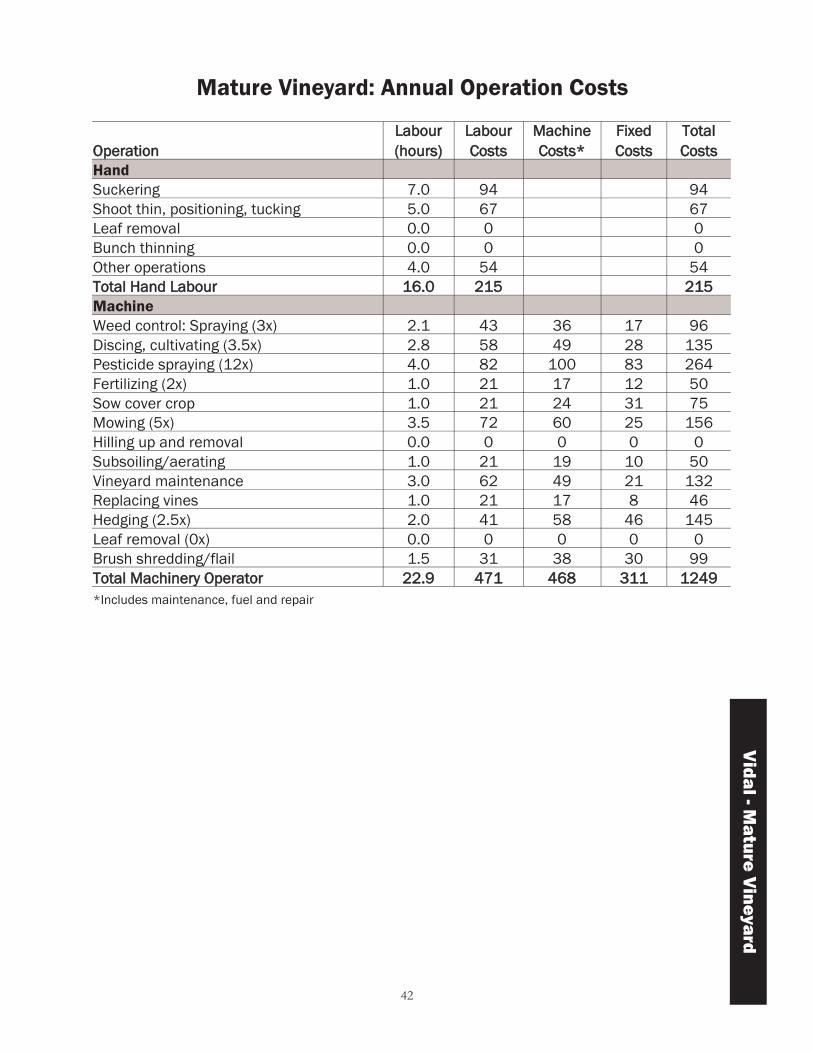
Operation
Labour
(hours)
Labour
Costs
Machine
Costs*
Fixed
Costs
Total
Costs
Hand
Suckering 7.0 94 94
Shoot thin, positioning, tucking 5.0 67 67
Leaf removal 0.0 0 0
Bunch thinning 0.0 0 0
Other operations 4.0 54 54
Total Hand Labour 16.0 215 215
Machine
Weed control: Spraying (3x) 2.1 43 36 17 96
Discing, cultivating (3.5x) 2.8 58 49 28 135
Pesticide spraying (12x) 4.0 82 100 83 264
Fertilizing (2x) 1.0 21 17 12 50
Sow cover crop 1.0 21 24 31 75
Mowing (5x) 3.5 72 60 25 156
Hilling up and removal 0.0 0 0 0 0
Subsoiling/aerating 1.0 21 19 10 50
Vineyard maintenance 3.0 62 49 21 132
Replacing vines 1.0 21 17 8 46
Hedging (2.5x) 2.0 41 58 46 145
Leaf removal (0x) 0.0 0 0 0 0
Brush shredding/flail 1.5 31 38 30 99
Total Machinery Operator 22.9 471 468 311 1249
*Includes maintenance, fuel and repair
Mature Vineyard: Annual Operation Costs
42
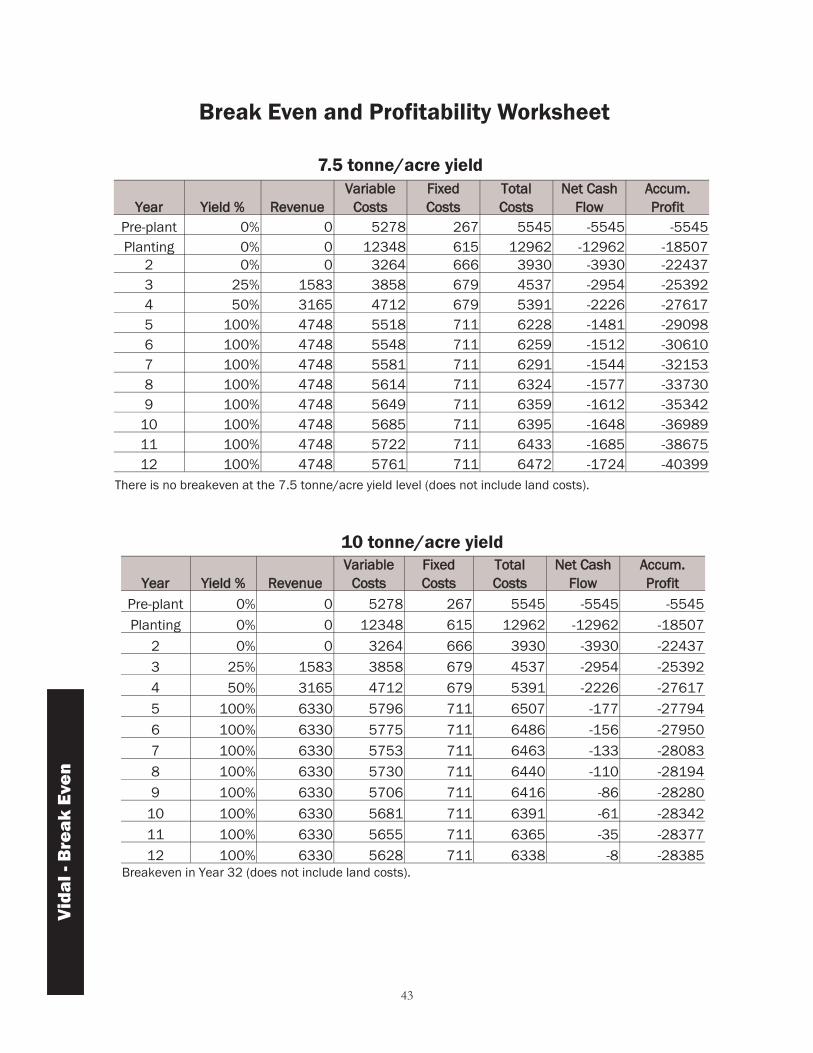
Break Even and Profitability Worksheet
Year Yield % Revenue
Variable
Costs
Fixed
Costs
Total
Costs
Net Cash
Flow
Accum.
Profit
Pre-plant 0% 0 5278 267 5545 -5545 -5545
Planting 0% 0 12348 615 12962 -12962 -18507
2 0% 0 3264 666 3930 -3930 -22437
3 25% 1583 3858 679 4537 -2954 -25392
4 50% 3165 4712 679 5391 -2226 -27617
5 100% 6330 5796 711 6507 -177 -27794
6 100% 6330 5775 711 6486 -156 -27950
7 100% 6330 5753 711 6463 -133 -28083
8 100% 6330 5730 711 6440 -110 -28194
9 100% 6330 5706 711 6416 -86 -28280
10 100% 6330 5681 711 6391 -61 -28342
11 100% 6330 5655 711 6365 -35 -28377
12 100% 6330 5628 711 6338 -8 -28385
Breakeven in Year 32 (does not include land costs).
10 tonne/acre yield
Year Yield % Revenue
Variable
Costs
Fixed
Costs
Total
Costs
Net Cash
Flow
Accum.
Profit
Pre-plant 0% 0 5278 267 5545 -5545 -5545
Planting 0% 0 12348 615 12962 -12962 -18507
2 0% 0 3264 666 3930 -3930 -22437
3 25% 1583 3858 679 4537 -2954 -25392
4 50% 3165 4712 679 5391 -2226 -27617
5 100% 4748 5518 711 6228 -1481 -29098
6 100% 4748 5548 711 6259 -1512 -30610
7 100% 4748 5581 711 6291 -1544 -32153
8 100% 4748 5614 711 6324 -1577 -33730
9 100% 4748 5649 711 6359 -1612 -35342
10 100% 4748 5685 711 6395 -1648 -36989
11 100% 4748 5722 711 6433 -1685 -38675
12 100% 4748 5761 711 6472 -1724 -40399
There is no breakeven at the 7.5 tonne/acre yield level (does not include land costs).
7.5 tonne/acre yield
Vid
al
- B
rea
k E
ve
n
43

Yield
MT/ac Revenue
Variable costs excluding harvest
and operating interest costs
Harvesting
costs
Operating
interest
Total
Variable Costs
Contribution
Margin
4.2 2659 3660 398 162 4220 -1561
4.3 2722 3660 407 162 4229 -1507
4.4 2785 3660 417 162 4239 -1454
4.5 2849 3660 426 163 4249 -1401
5.5 3482 3660 521 167 4348 -866
6.5 4115 3660 616 170 4446 -332
7.5 4748 3660 711 174 4545 203
8.5 5381 3660 805 178 4643 737
9.5 6014 3660 900 182 4742 1272
10.5 6647 3660 995 186 4840 1806
11.5 7280 3660 1090 189 4939 2341
12.5 7913 3660 1184 193 5037 2875
13.5 8546 3660 1279 197 5136 3410
14.5 9179 3660 1374 201 5234 3944
Breakeven yield to cover annual variable costs is 7.5 tonnes / acre.
Vid
al - B
rea
k E
ve
n
44
Break Even Yield to Cover Variable Costs
Break Even Yield to Cover Total Costs
Yield
MT/ac Revenue
Annual costs excluding
harvest and operating
interest costs
Harvesting
costs
Operating
interest
Annualized
Est. Costs
Total Costs
with Est.
Costs
Net Cash
Flow
5.2 3292 4370 541 167 1623 6702 -3410
5.3 3355 4370 551 168 1623 6713 -3358
5.4 3418 4370 562 168 1623 6724 -3306
5.5 3482 4370 572 169 1623 6735 -3253
6.5 4115 4370 676 173 1623 6843 -2728
7.5 4748 4370 780 177 1623 6951 -2203
8.5 5381 4370 884 181 1623 7059 -1679
9.5 6014 4370 988 185 1623 7167 -1154
10.5 6647 4370 1092 189 1623 7275 -629
11.5 7280 4370 1196 194 1623 7383 -104
12.5 7913 4370 1300 198 1623 7492 421
13.5 8546 4370 1404 202 1623 7600 946
14.5 9179 4370 1508 206 1623 7708 1471
15.5 9812 4370 1612 210 1623 7816 1995 Breakeven yield to cover total annual costs is 12.5 tonnes / acre.
(Includes annualized establishment costs, does not include land costs)

45
46
LABRUSCA
GRAPES

47
5. Concord
Cost per acre ($)
Your Farm Yield Yield
Variable Costs 4 Tonne 6 Tonne
Labour: Hand, 4.0 hrs 54 54
Machine operator 16.9 hrs 349 349
Fertilizer: Ammonium nitrate, 80 kg 48 48
Muriate of potash, 80 kg 48 48
Insecticides 105 105
Fungicides 112 112
Herbicides 53 53
Replacement vines 1% 40 40
Cover crop seed 26 26
Wind machine 252 252
Machine costs: Repairs & maintenance 149 149
Fuel 144 144
Custom pruning $.40/vine 291 291
Custom tying - $.32/vine 233 233
Tying material 25 25
Irrigation 166 166
Bird control 90 90
Custom harvest/delivery 280 400
Board License and R&D Fees ($7.00 per tonne) 28 42
Crop insurance 47 71
Consulting fees (soil, leaf, spray) 0 0
Interest on operating capital 102 108
Land rental
Total Variable Costs 2642 2806
Fixed Costs
Machine costs: Depreciation 222 222
Interest on investment 49 49
Other overhead 400 400
Land ownership
Measurable Fixed Costs 671 671
Total Measurable Cost 3313 3477
Contribution Margin
Gross Income ($487 per tonne) 1948 2922
Total Variable Costs 2642 2806
Contribution Margin (no land costs) -694 116
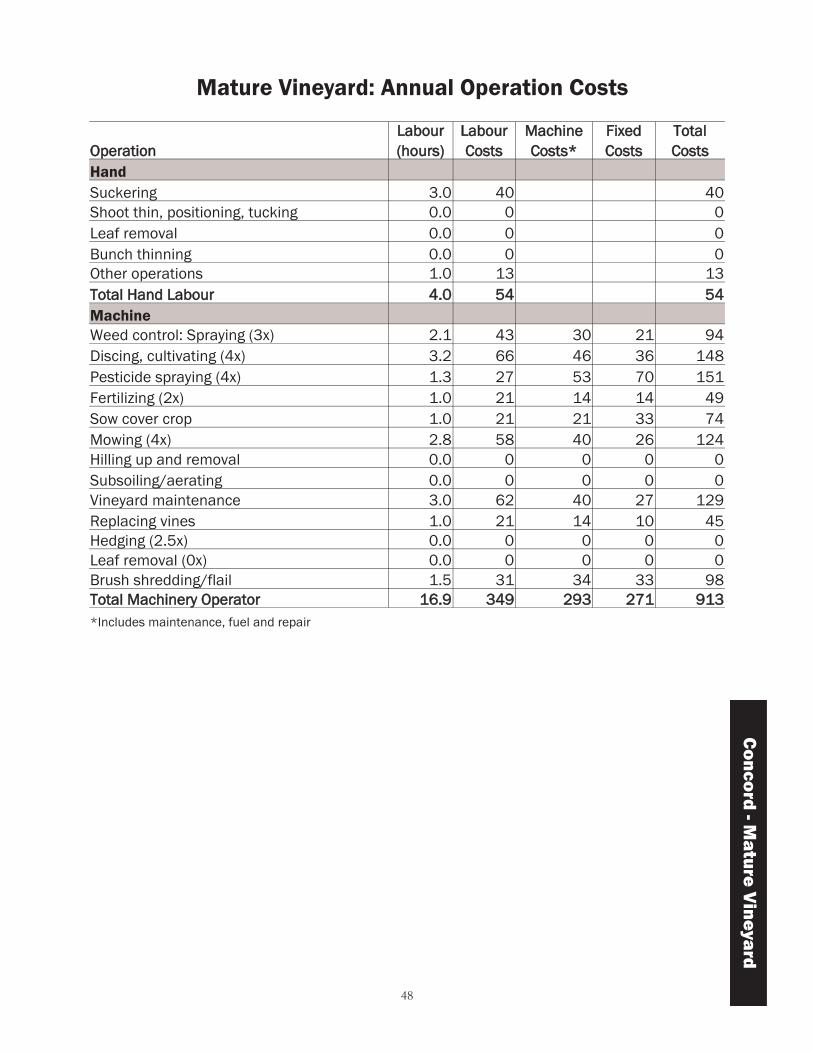
Mature Vineyard: Annual Costs
Co
nc
ord
- M
atu
re V
ine
ya
rd
48
Operation
Labour
(hours)
Labour
Costs
Machine
Costs*
Fixed
Costs
Total
Costs
Hand
Suckering 3.0 40 40
Shoot thin, positioning, tucking 0.0 0 0
Leaf removal 0.0 0 0
Bunch thinning 0.0 0 0
Other operations 1.0 13 13
Total Hand Labour 4.0 54 54
Machine
Weed control: Spraying (3x) 2.1 43 30 21 94
Discing, cultivating (4x) 3.2 66 46 36 148
Pesticide spraying (4x) 1.3 27 53 70 151
Fertilizing (2x) 1.0 21 14 14 49
Sow cover crop 1.0 21 21 33 74
Mowing (4x) 2.8 58 40 26 124
Hilling up and removal 0.0 0 0 0 0
Subsoiling/aerating 0.0 0 0 0 0
Vineyard maintenance 3.0 62 40 27 129
Replacing vines 1.0 21 14 10 45
Hedging (2.5x) 0.0 0 0 0 0
Leaf removal (0x) 0.0 0 0 0 0
Brush shredding/flail 1.5 31 34 33 98
Total Machinery Operator 16.9 349 293 271 913
*Includes maintenance, fuel and repair
Mature Vineyard: Annual Operation Costs C
on
co
rd - M
atu
re V
ine
ya
rd