estec testbed capabilities for the...
TRANSCRIPT

ESTEC TESTBED CAPABILITIES FOR THE PERFORMANCE CHARACTERIZATION OF PLANETARY ROVER LOCALIZATION SENSORS
FIRST RESULTS ON IMU INVESTIGATIONS
Javier Hidalgo(1), Pantelis Poulakis(2), Johan Köhler(3), Antonio Barrientos(1), Jaime Del-Cerro(1)
(1)Robotics and Cybernetics Group Universidad Politécnica de Madrid.
José Gutiérrez Abascal 2, 28006, Madrid, Spain [email protected], [email protected], [email protected]
(2)Automation and Robotics Section
European Space Research and Technology Centre ESA/ESTEC, Keplerlaan 1, 2200 AG Noordwijk. The Netherlands.
(3)Swedish National Space Board, Solna, Sweden [email protected]
ABSTRACT During the last year internal research activities have been carried out at ESTEC in the line of testing high-grade inertial sensors. This article shows the performance characterization of prototype Inertial Measurement Units (IMUs) in terms of facilities and methodologies within ESTEC, with focus on MEMS inertial sensors for planetary rovers. Specifically, this article shows the system level demonstration and capabilities of the test facilities of the ESTEC Automation & Robotics section as well as first performance results of MEMS inertial sensors for attitude estimation on typical planetary rover manoeuvres.
1 INTRODUCTION The Automation and Robotics (A&R) section of ESA/ESTEC is performing internal investigations on localization schemes for rovers, both in the algorithmic development and system level integration. Within the context of a mission, the correct combination of Localization, Navigation and Locomotion control will allow the rover to safely reach interesting targets assigned in advance by the scientists from the Ground station. Specifically, Attitude and Heading Reference System (AHRS) is part of a whole Inertial Navigation System and is essential in a system level [1]. In particular, rover attitude determination will be used from ground operations to supervise and command the rover for a wide range of activities (navigation, science, power management, etc.). Due to advances in Microsystems technology recent improvements in the field of micro-fabrication allow
better quality and performance of the Micro Electro-Mechanical Systems (MEMS) with a special interest in the aerospace sector. The use of MEMS based inertial sensors have made Inertial Navigation Systems (INS) more affordable, achieving navigations system of small size and weight, with modest power consumption and cost. This shows on a new area of robust and small sensors and actuators with potential in the space domain allowing the sector to progress towards miniaturized robots and any spacecraft in general. In space rover applications the mass and volume available in a scout vehicle to be sent to space is extremely limited. In addition, ground vehicle involves many vibrations sources that deteriorate the accuracy of position and attitude estimation while operating in celestial bodies. However, test campaigns and technology demonstration are not always an easy task. ESTEC has a wide range of testing facilities to perform representative tests. Testing is an important part in the design in order to achieve the desirable level of maturity before performing the next step on the development. This work is focused the particular case of evaluating the performance on a system level of a high-grade Inertial Measurement Unit (IMU) using suitable test equipment and representative rover platforms for exploration concepts. This paper is organized as follows. The first section of the document describes the ESTEC testing capabilities. The prototype IMU tested during this activity is presented in Section 2. The test preparation and performance is described in Section 3. Afterwards, the results of testing the IMU are further discussed in Section 4. The manuscript is concluded with a review and future lines of work.

2 ESTEC TESTBED CAPABILITIES System level demonstration involves a number of capabilities in order to perform and demonstrate the usability of a technology in a specific application and domain. It requires sensor analysis, system integration and representative target platforms as well as competences to reproduce similar testing condition for a reliable proof-of-concept. In the context of IMUs a good understanding of the stochastic error existing in inertial sensors is desirable in order to achieve a reliable performance in data fusion algorithm. Consequently, sensor incorporation in rover platform is necessary to system level demonstration in a localization scheme. Finally, test setup and equipment deployment for a reliable testing campaign is performed for acquiring significant results.
Within this line the European Space Research and Technology Center (ESTEC) has numerous test facilities. These are described with detail in the following sections.
2.1 Metrology laboratory ESTEC Test Centre division supports aerospace programs with a wide range of laboratories and test equipment for engineering development mainly related with ESA projects. In particular, the metrology laboratory (see Figure 1) is a semi-clean room equipped - among others - with a seismic block or anti-vibration table to perform accurate measurement with high restrictions in alignment, positioning and external noise isolation.
Figure 1 Metrology laboratory general view with the seismic block in the foreground.
It is interested to first test the inertial sensors in a static position for a sufficient time in order to characterize and model the stochastic error underlying sensors signal. Therefore, the seismic block is a suitable location for collecting static values from inertial sensors isolated of external perturbations. This is a very suitable mode to
collect sensor measurements to afterwards analyse potential stochastic errors that might affect sensor readout. The selected analysis technique has been the Allan variance for its simplicity and easy adaptation on the analysis of a wide range of sensors. In the following section the technique and its implementation are briefly explained.
2.2 Allan Variance Toolbox The Allan variance 𝜎! 𝜏 directly provides information on the type and magnitude of various stochastic noise terms [2]. The method computes a statistical variance among cluster of same size from collected values of sensors. In order to characterize the noise terms [3], the Allan variance is plotted in a log-log graph as the standard deviation against the cluster time 𝜏. Basically, the noise terms are identified using fitting methods at various frequencies varying 𝜏 (see Figure 2).
Allan variance software can be either commercially obtained or specially written. In this case, the A&R section has developed his own software using R1, a language for statistical computing. In any case, verification and validation of the software is desirable. It can be done by processing generated random-number and seeing whether the expected plots are obtained. Moreover, IEEE standard recommendation [4] for testing inertial sensors gives some technique to correctly test the Allan variance implementation. In addition, the toolbox includes plotting function to correctly depict the results.
Figure 2 Allan variance plot from data analysis [5].
2.3 Planetary Utilization TestBed Evaluation of inertial sensors performance at a system level requires representative test-bed facilities. In this line, the Planetary Utilization TestBed (PUTB) resembles a Martian surface of approximately 9 x 9 meters (see Figure 3). It is comprised of three kinds of ground surface: gravel, small stones and large boulders. Around the PUTB a set of eight infrared emitting and sensing cameras are mounted to the walls, which sense
1 http://www.r-project.org
reflective markers mounted on rover platforms. These cameras are part of the Vicon Motion Tracking system, which can deduct and track position and orientation of objects marked with reflective marks.
Figure 3 PUTB general view (left) and detail of a Vicon camera (right).
2.4 Rover platforms Two representative rover platforms were considered for these investigations. They can be observed in Figure 4. The ExoMars Demonstration Rover (ExoMaDeR) a half-size rover prototype of the early study phase of the current ExoMars program and the Lunar Rover Module (LRM) a four driving wheels rover prototype considering lunar exploration activities. ExoMaDeR is a two bogies rover design composed of six driving wheels [6]. LRM, although not representative of any real mission, it has fairly advanced locomotion capabilities as articulated suspensions [7]. Both rovers are wirelessly controlled and can execute Ackerman turns, turn-on-spot and straight runs at different speeds.
Figure 4 LRM (left) and ExoMaDeR (right) rovers during tests performance in the PUTB
ExoMaDeR is equipped with a PC-104 running a Linux Mini-Kernel OS and FPGA to deal with the power-stage and motors control on-board the rover. The LRM only has the power-stage and the electronics on-board to control the motors based on two CANopen bus channels, one for the locomotion and other for the robotic arm [7].
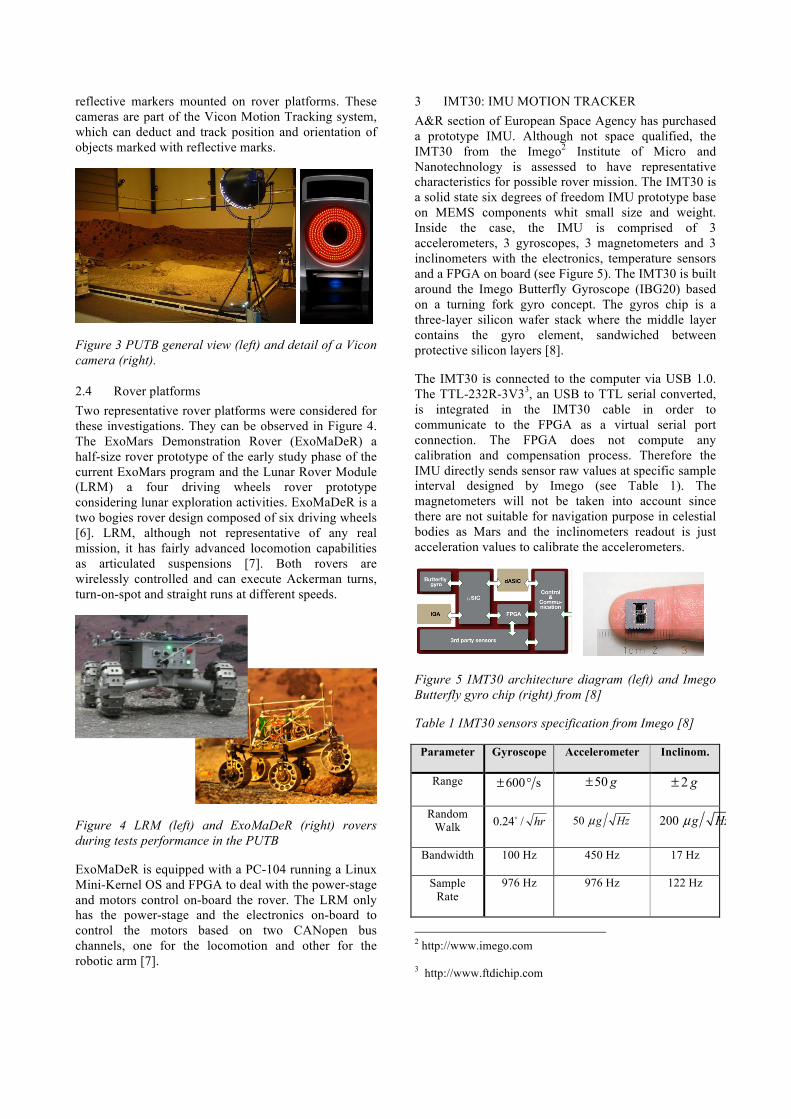
3 IMT30: IMU MOTION TRACKER A&R section of European Space Agency has purchased a prototype IMU. Although not space qualified, the IMT30 from the Imego2 Institute of Micro and Nanotechnology is assessed to have representative characteristics for possible rover mission. The IMT30 is a solid state six degrees of freedom IMU prototype base on MEMS components whit small size and weight. Inside the case, the IMU is comprised of 3 accelerometers, 3 gyroscopes, 3 magnetometers and 3 inclinometers with the electronics, temperature sensors and a FPGA on board (see Figure 5). The IMT30 is built around the Imego Butterfly Gyroscope (IBG20) based on a turning fork gyro concept. The gyros chip is a three-layer silicon wafer stack where the middle layer contains the gyro element, sandwiched between protective silicon layers [8].
The IMT30 is connected to the computer via USB 1.0. The TTL-232R-3V33, an USB to TTL serial converted, is integrated in the IMT30 cable in order to communicate to the FPGA as a virtual serial port connection. The FPGA does not compute any calibration and compensation process. Therefore the IMU directly sends sensor raw values at specific sample interval designed by Imego (see Table 1). The magnetometers will not be taken into account since there are not suitable for navigation purpose in celestial bodies as Mars and the inclinometers readout is just acceleration values to calibrate the accelerometers.
Figure 5 IMT30 architecture diagram (left) and Imego Butterfly gyro chip (right) from [8]
Table 1 IMT30 sensors specification from Imego [8]
Parameter Gyroscope Accelerometer Inclinom.
Range
Random Walk
Bandwidth 100 Hz 450 Hz 17 Hz
Sample Rate
976 Hz 976 Hz 122 Hz
2 http://www.imego.com
3 http://www.ftdichip.com
600 s± ° 50 g± 2 g±
hr/24.0 50 g Hzµ 200 g Hzµ

4 TESTS PREPARATION AND PERFORMANCE
4.1 Allan Variance Test Five tests were conducted at room temperature at the Metrology laboratory. Four hours were collected per test on the seismic block for gyroscopes and accelerometers controlled by the FPGA, with 16 bits resolution and recorded in an external PC. The test layout and equipment is observed in Figure 6. The recorded data were consequently analysed using the Allan variance toolbox. The following analysis procedure [4] were performed for angular rate and acceleration:
1. Plot the angular rate or acceleration. 2. If some noise sources are masked by other noise
sources, then remove all deterministic behaviour such as thermal drift that could be compensated with temperature sensor information.
3. If sudden bias change is still observed. Process the Allan variance on a continuous part of the dataset not affected by this event. This process is necessary to be able to determine high frequency noise such as quantization noise and angle random walk.
4. Compute the Allan variance. Plot the standard deviation versus cluster time 𝜏.
5. Identify the noise terms observed in Figure 2 and subtract the noise coefficients of dominant errors.
Figure 6 Test setup (left) and data logging (right) at the metrology laboratory.
4.2 On-board Experimental Demonstration System level demonstration of sensors performance needs of a suitable PUTB configuration, a correct coordinate systems definition and an adequate sensor fusion scheme.
4.2.1 PUTB Configuration The Vicon system is an active tracking system, which in this case will help to verify the attitude computed on-board, using inertial values. The fully deployed system in the PUTB manages to have a precision to tenths of a degree, in the order 0.1-0.2 degrees. Rover platforms are marked with reflective marks attached on the platform
or stiff frame in case of the ExoMaDeR. Consequently, a subject skeleton is defined in the Vicon software coincident with the body frame on the rover. Vicon software computes attitude Euler angles of the defined skeleton on the rover. The angles are sent using UDP via the ROBOTICS network and consequently recorded in the Control Station PC. Furthermore, the Control Station wirelessly commands the rover to perform the scheduled trajectories. The process unit of the rover acquires the inertial values from the IMT30 mounted on-board, computes the sensor fusion scheme, controls rover’s motors and sends the on-board attitude estimation to the Control Station PC. The AHRS on-board the rover is further explained in next subsection.
Figure 7 PUTB configuration and coordinate systems.
4.3 Attitude and Heading Reference System The acquisition software reads sensor raw values directly coming from the IMT30 (see Figure 8). Afterwards, those values are calibrated and compensated using temperature values. The values are low-pass filtered at 10Hz, since planetary rovers do not have high dynamics. Finally, the sensor fusion scheme runs in the last stage, filtering and combining inertial information. Sensor fusion scheme is based on quaternions [9] and Kalman filter [10] making use of gyros model from the sensor analysis using the Allan variance technique. Accelerometers are dynamically used as inclinometers in order to complete pitch and roll estimation.
Figure 8 Four functional stages of the software.

4.3.1 Coordinate Systems INS needs of a proper definition of coordinate frames in order to define navigation dynamic model. Generally, INS considers four frames [9]:
• Inertial frame (i-frame): it is fixed with the centre of the planet and axes are non-rotating pointing to a fixed star.
• Planet frame (i.e.: Mars frame): in coincides with the i-frame but it rotates with the planet.
• Navigation/geographic frame (n-frame): it is used for local navigation purpose. Fitting a tangent plane to the geodetic reference ellipse.
• Body frame (b-frame): is an orthogonal axis set, which is fixed the rover body and rotates with it. It is normally set in the centre of mass (see Figure 9). The sign convention for angles typically depends on the particular vehicle.
Same cases need to make a difference between navigation and geographic frame (g-frame). That is the case if this work in which a n-frame was defined in the absolute origin of the PUTB (see Figure 3). The n-frame coincides with the reference frame of the Vicon system since all the tracking values are defined with respect an absolute origin. A proper transformation was defined to correctly transform attitude from n-frame to g-frame in order to subtract Earth rotation. The b-frame is located on rover's platform aligned to the IMT30 internal frame. Reflective markers were located in order to correctly define the b-frame in the Vicon system.
Figure 9 Defined body frame on rovers and sign conventions for angles.
5 TESTS RESULTS AND DISCUSSION The section discusses the tests results for the IMT30: the analysis of the most dominant stochastic errors using
the Allan variance technique and the system level demonstration of the sensor fusion performance on-board rover platforms.
5.1 Allan Variance Test Results The results of applying the Allan variance for the gyroscopes can be observed in Figure 10. The graph shows that the Angle Random Walk is the dominant error for short cluster time. This part of the curve fits a line of slope -1/2. The noise coefficient N is obtained by reading the slope line at 𝜏 = 1 (see Table 2). The curve for long cluster time fits a line of slope +1/2, characteristic of a Rate Random Walk. This noise coefficient K is obtained by reading the slope line at 𝜏 = 3 (see Table 2). The centre of the curve shows a small flat part identified by a zero slope. It characterizes a Bias Instability B, which represents the best stability of the run. The convention unit in the inertial sensor community for the Angle Random Walk and Rate Random Walk is º/ ℎ and º/ℎ/ ℎ respectively [11].
Figure 10 Allan variance analysis for IMT30 gyros.
Table 2 Dominant noise coefficients for IMT30 gyros. Mean value of the five tests.
Noise Coef. Gyro X Gyro Y Gyro Z
N 0.208!/ ℎ 0.239!/ ℎ 0.205!/ ℎ
K 32.8!/ℎ/ ℎ 49.6!/ℎ/ ℎ 64.2!/ℎ/ ℎ
B 3.8!/ℎ 5. 9!/ℎ 5.3!/ℎ

Figure 11 depicts the results of applying the Allan variance to the recorded accelerometers values. The Velocity Random Walk is the dominant error for short cluster time. The curve increases gradually to zero and positive and negative slopes for long cluster time. It characterizes a Correlated noise by an exponential decaying function with a finite correlated noise. The correlation time Tc has been defined following IEEE recommendation. The lowest part in the curve is also characterized as the best stability of the run as the Bias Instability [5]. Table 3 and Table 4 depict noise coefficients. For further reading on sensor characterization the reader is referred to [4].
Figure 11 Allan variance analysis for IMT30 accelerometers.
Table 3 Velocity random walk and bias instability coefficients for IMT30 accelerometers. Mean value of the five tests.
Noise Coef.
Acc X Acc Y Acc Z
N 0.0015𝑚/𝑠/ 𝑠 0.002𝑚/𝑠/ 𝑠 0.0021𝑚/𝑠/ 𝑠
B 0.09mg 0.14mg 0.10mg
Table 4 Correlated noise coefficient and correlation time for IMT30 accelerometers. Mean value of five tests.
Noise Coef.
Acc X Acc Y Acc Z
Qc 9×10!!𝑚/𝑠!/ 𝑠
1×10!!𝑚/𝑠!/ 𝑠
1×10!!𝑚/𝑠!/ 𝑠
Tc 248.2𝑠 341𝑠 341𝑠
According to the bias instability coefficient obtained the IMT30 gyroscopes and accelerometers categorize as tactical-grade and navigation grade respectively.
Table 5 Inertial sensors drift for IMU grades [12].
Inertial system grade
Gyros drift (º/h) Accelerometer drift (mg)
Strategic 0.0001 0.001
Navigation 0.015 0.1
Tactical 1 to 10 1.0
Consumer 1000 20
It is also interesting to compare here the performance of the IMT30 with the LN-200. The LN-200 is a fibre optic IMU developed by Northrop Grumman and has been used by JPL for the Mars Exploration Rovers [13]. Table 6 summarizes gyros comparison between both IMUs. It is clearly visible that the LN-200 has better performance due to optic readout. However LN-200 IMU is one-kilogram weight and IMT30 is 200 grams fully based on MEMS technology.
Table 6 IMT30 results comparison with MER IMU
Noise Coef. IMT30 LN-200
N 0.208!/ ℎ 0.07!/ ℎ
B 5!/ℎ 1!/ℎ
5.2 On-board Experimental Results A typical path of approximately four meters based on a straight line and an Ackerman steering composes ExoMaDeR test (see Figure 7). LRM rover size is too big for the PUTB terrain in order to perform compound manoeuvres. Therefore, five meters straight line, 180º Ackerman steering and Turn-on-Spot separately compose the test. Final ExoMars rover will move at a nominal speed of 1cm/s on Mars, being slower (0.5cm/s) when the rover tracks interesting goals and potentially faster (2cm/s) when the environmental conditions allow it. All the tests were performed at nominal velocity.
Table 7 Errors in attitude for LRM tests on the PUTB
Trajectory Pitch Roll Yaw
Straight line 0.2º 0.1º 0.35º
Ackerman 0.3º 0.3º 1.4º
Turn-on-spot 0.2º 0.4º 6.5º

Table 7 summarizes the maximum error between the estimation computed by the AHRS on-board and the Vicon ground reference. The results show good performance of the IMT30 into the sensor fusion scheme. Higher errors are observed in the heading angle. However, it is observed that the heading error is only evident when the rover turns. Specifically, the heading error for Turn-on-spot test is observed in the middle of the curve. It shows that a symmetric scale factor is the dominant error when the rover turns. This behaviour needs further investigation and requires characterizing the scale factor using a precise rate-table. Figure 12 to Figure 15 enlighten the results including a comparison between normal gyros integration and the computation by the sensor scheme (AHRS).
Figure 12 LRM test result for straight-line.
Figure 13 LRM test result for Ackerman steering.
Figure 14 LRM test result for straight-line with boulder.
Figure 15 LRM test results for Turn-on-spot.
Particularly, Figure 14 shows a good dynamic combination of the accelerometers and gyroscopes to determinate the pitch angle while negotiating an obstacle located in the path.
Table 8 Errors in attitude for ExoMaDeR test on the PUTB
Trajectory Pitch Roll Yaw
ExoMaDeR path
1.11º 1.00º 1.64º

Similar reasoning is deduced from ExoMaDeR test. Table 8 shows the maximum error after covering the four meters path of the ExoMaDeR trajectory on the PUTB. Higher errors than in LRM tests were computed due to some play on the stiff frame of the ExoMaDeR platform. This directly influences in the definition of a precise subject skeleton on the Vicon software. Figure 16 represents the test results for the whole ExoMaDeR trajectory.
Figure 16 ExoMaDeR test results for complete path.
6 CONCLUSIONS AND FUTURE WORK A representative step has been done on testing the performance of inertial sensors integrated in an IMU. This work shows ESTEC capabilities for testing a prototype IMU in the field of robotics application in two levels of domain: Inertial sensor analysis and characterization and System level demonstration. Any inertial sensor could also apply the steps and experience describe in this paper. Although there are certain limitations due to equipment requirements and facilities, these tests could also be reproduced in similar conditions for Allan variance analysis and on-board experimental results on target platforms.
The IMU tested during this work is a general-purpose device for common applications. Some research activities led the developed of miniaturized IMUs for particular use in scout rovers where harsh requirement are needed. Specifically in [14] F.Rehrmann et.al. describe the development manufacturing and testing of a IMU breadboard. Although, this activity does not show a final miniaturized space qualified IMU, the manuscript point out the architectural design and technology packing available as well as representative results to improve future IMU developments.
Future research will address characterization of potential deterministic errors that affects sensor accuracy as the scale factor. Furthermore, analysis on the performance of a sun sensor would be desirable in future works. It is also needed to work on complete system level demonstration via field-testing covering longer trajectories for representative mission scenarios.
REFERENCES [1] P. Fortescue, J. Stark, and G. Swinerd,
Spacecraft Systems Engineering 3rd Edition, 3rd ed. Wiley, 2003.
[2] D. W. Allan, “Statistics of atomic frequency standards,” Proceedings of the IEEE, vol. 54, no. 2, p. 221–230, 2005.
[3] N. El-Sheimy, H. Hou, and X. Niu, “Analysis and modeling of inertial sensors using allan variance,” Instrumentation and Measurement, IEEE Transactions on, vol. 57, no. 1, p. 140–149, 2008.
[4] IEEE, “Recommended Practice for Inertial Sensor Test Equipment, Instrumentation, Data Acquisition and Analysis.” IEEE Recommended Practice, 2005.
[5] IEEE, “Specification Format Guide and Test Procedure for Singe-Axis Interferometric Fiber Optic Gyros.” IEEE Standard, R2008-1998.
[6] L.JoudrierN.Silva and A.Davies, “Challenges of ExoMars Rover Control,” AIAA Aerospace Conference, 2009.
[7] A. Frantzis-Gounaris, “Lunar Rover Model Towards the realization of a mobile robotic testbed for ESA research activities,” University of Twente, 2010.
[8] Johannisson P, “IMT30 Document Manual and DataSheet.” 2007.
[9] R. M. Rogers, Applied Mathematics in Integrated Navigation Systems, 2nd ed. AIAA (American Institute of Aeronautics & Ast, 2003.
[10] R. G. Brown and P. Y. C. Hwang, Introduction to Random Signals and Applied Kalman Filtering, 3rd Edition, 3rd ed. Wiley, 1996.
[11] IEEE, “Inertial Sensor Terminology.” IEEE Standard, 2009.
[12] N. Hjortsmarker, “Experimental System for Validating GPS/INS Integration Algorithms,” Luleå University of Technology, 2005.
[13] K. S. Ali et al., “Attitude and position estimation on the Mars Exploration Rovers,” in Systems, Man and Cybernetics, 2005 IEEE International Conference on, 2006, vol. 1, p. 20–27.
[14] F. Rehrmann et.al.,“A Miniaturised Space Qualified MEMS IMU for Rover Navigation Requirements and Testing of a Proof of Concept Hardware Demonstrator,” presented at the 11th Symposium on Advanced Space Technologies in Robotics and Automation, 2011.