estimate of the probable maximum loss … · the 14 th world conference on earthquake engineering...
TRANSCRIPT

The 14th
World Conference on Earthquake Engineering
October 12-17, 2008, Beijing, China
ESTIMATE OF THE PROBABLE MAXIMUM LOSS PML IN LIMA AND
CALLAO: APPLICATION TO THE PERUVIAN INSURANCE INDUSTRY
Jorge Olarte1,2, Zenón Aguilar
1, Carlos Zavala
1, Alberto Martinez
1 and Jorge Gallardo
1,2
1
Professor, Faculty of Civil Engineering, Japan Peru Centre for Earthquake Engineering Research and
Disaster Mitigation -CISMID, National University of Engineering. Av. Tupac Amaru 1150, Lima 25, Perú. E: [email protected]
2
IGR Ingenieros Consultores SAC. C/.Remington 246-Of. 301,Urb. Corpac, San Borja, Lima 41, Perú. E: [email protected]
ABSTRACT:
A methodology to estimate the probable maximum loss (PML) for insurance constructions is presented. The
methodology includes regional seismic hazard analysis, ground motion estimation, structural vulnerability
evaluation and net losses excedance computation. Computed for the first time in Peru, an estimation of the
PML for 42 districts of Lima and Callao was carried out using the proposed approach. Laboratory and field
tests were performed and the geotechnical characteristics of the study zone. The structural analysis was
performed for building with insurance against seismic hazards. A field work was executed to get some
characteristic of the buildings needed to estimate the structural vulnerability like number of stories, lateral
configuration and conservation of the building. A study of the structural vulnerability was carried out based on
the inter-story drift of the buildings. Analysis of the damage and rehabilitation costs were performed, vulnerability curves for different structural configurations were proposed. Finally, the probable maximum loss
(PML) is presented as a function of return period. Based on the results, an insurance company can determine
the constitution of its catastrophic reserve in a reliable way.
KEYWORDS: Probable maximum loss, PML, seismic hazards, structural vulnerability, insurance
company, Lima and Callao.
1. INTRODUCTION
Since ancient times, the cities of Lima and Callao have suffered a series of earthquakes of great intensity,
during which on many occasions have occurred material damage and loss of life. The main source of seismic
events affecting this region is the subduction zone, as defined by the interaction of the Nazca plate and the
Sudamerica plate (Dorbath et al., 1990). This source can generate large-scale events, which historically
(Silgado, 1978), in the area of the central coast can overcome a magnitude of 8 on the moment scale Mw (Table
1). The effects of these earthquakes are raised by different site conditions that occur in districts that make up the
study area. Table 1. Earthquakes significant subduction in the central part of Peru, near Lima.
Year Magnitude1
Intensity2
1586 8.1 IX
1678 8.0 VIII
1687 8.3 VIII
1746 8.6 X
1940 8.2 VIII
1966 8.0 VIII
1974 8.1 VIII
1996 7.7 IV
2007 8.1 VI 1 Moment magnitude scale, Mw
2 Modified Mercalli intensity reported in Lima
The 14th
World Conference on Earthquake Engineering
October 12-17, 2008, Beijing, China
The probable maximum loss (PML) is an estimator of the maximum size of losses that would be reasonable to
expect such a portfolio over a given time of exposure. It depends on individual risks and geographical
distribution, the PML is great if there is a significant concentration in high seismic risk, and is small if the
portfolio is evenly distributed in a wide geographic area. Since the PML is the maximum loss you can expect
the insurer if it did not have coverage with reinsurers, the same reserves should be equal to that of PML. Based
on these calculations, a company can determine their level of exposure reliably and well established financial
planning for the establishment of the reserve and catastrophic risks.
2. OBJECTIVE The aim of this study is to present a model estimate of Seismic Risk for a Portfolio Insured taking into account
the four key modules in the estimate of the probable maximum loss (PML): seismic hazard, structural
vulnerability, distribution and conditions of portfolio insurance. The results of analyses of losses are shown in a
properly loss frequency curve (LFC).
3. SEISMIC HAZARD
The seismic hazard is quantified in terms of return periods of seismic intensity in the behavior of relevant structures. The exceedance rate of a seismic intensity is defined as the average number of times per unit time,
when the value of that seismic intensity is exceeded. It is possible to determine the seismic hazard counting
how many times they have been exceeded in intensity values given on the site of interest. The first part of investigation is the tectonics and the seismicity in a given region.
Using a standard distribution of seismicity Poisson activity of the i-th seismogenic source is specified in terms
of the exceedance rate of the magnitude, λ i(M), which are generated there. The exceedance rates of
magnitudes measures how often are generated in one source, tremors with magnitude higher than a given. In these cases, the seismicity is as follows:
( )u0
u
MM
MM
0ee
eeM
β−β−
β−β−
−
−λ=λ (1)
where Mo is the relevant minimum magnitude. 0λ , iβ , and Mu are parameters that define the exceedance rate
of the seismogenic sources.
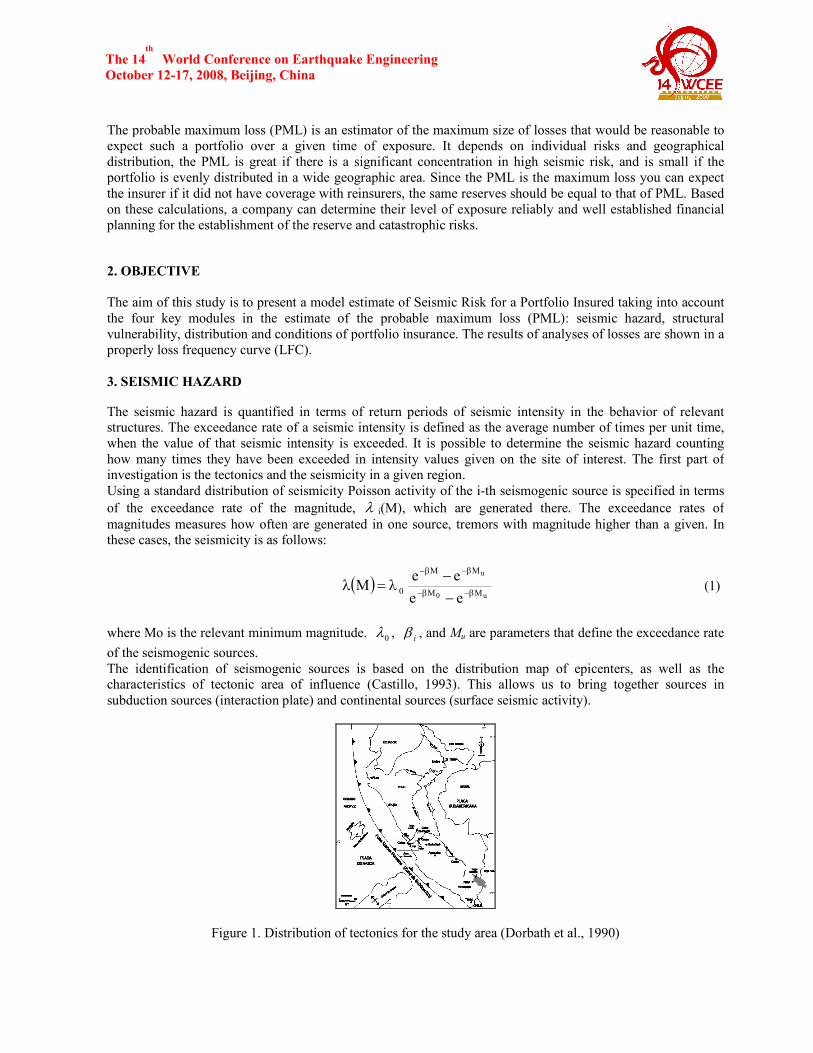
The identification of seismogenic sources is based on the distribution map of epicenters, as well as the characteristics of tectonic area of influence (Castillo, 1993). This allows us to bring together sources in
subduction sources (interaction plate) and continental sources (surface seismic activity).
Figure 1. Distribution of tectonics for the study area (Dorbath et al., 1990)

The 14th
World Conference on Earthquake Engineering
October 12-17, 2008, Beijing, China
3.1 Statistical Analysis of Recurrence
The recurrence of earthquakes is determined according to the Richter expression (1958):
M b-aN =Log (2)
where:
N=number of earthquakes of magnitude M or more per unit of time.
a, b=parameter dependent on the region.
The previous expression can also be written as:
MoeN β−Γ= (3)
where: Γ0 = 10a is the number of earthquakes per unit of time with M > 0.
β = b x ln 10.
The recurrence of statistical parameters for each seismic source have been calculated using the magnitude Ms. We calculated the following relationship between the magnitudes mb y Ms:
mb = 3.30 + 0.40 Ms (4)
In the statistical analysis of the parameters of recurrence, the method of least squares, considering data from
1963 to 1992.
3.2 Attenuation of seismic waves
For purposes of this study, using two laws of attenuation depending on the paths that travel on the waves
on its way from the source to the site.
3.3 Attenuation of subduction accelerations
Clearly, there is a lack of records data of accelerations in Peru. The data are taken from Lima. The
attenuation law of accelerations (Casaverde and Vargas, 1980) is:
a = 68.7 e0.8Ms (R + 25)-1.0 (5)
where: a= acceleration cm/seg2.
Ms=magnitude of the surface waves.
R=hipocentral distance in km.
3.4 Attenuation of continental accelerations
For surface continental sources have been used by attenuation law of accelerations proposed by McGuire
(1974). This law was applied for attenuations West Coast of the United States, which is associated with
continental fault and its expression is:
a= 472 x 10
0.28 Ms (R+25)
-1.3 (6)
that is expressed in logarithmic form:
ln a= 6.156 + 0.64Ms - 1.30 ln (R+25) (7)

The 14th
World Conference on Earthquake Engineering
October 12-17, 2008, Beijing, China
3.5 Local Site Effects
It is widely known that a local site effects is a major factor responsible for damage to buildings during
earthquakes severe. The seismic amplification is an effect of the local site condition and is strongly
dependent on the geological and geotechnical conditions.
To determine the dynamic characteristics of the soil, have been made both microtremors and amplification
of seismic evaluations in the areas most critical. This information has been incorporated into a geographic
information system (GIS) and processed to produce a seismic microzonation based on geotechnical
parameters of the 42 districts analyzed. Figure 2 shows the seismic microzonation in Lima and Callao
considered in this study.
Figure 2. Seismic microzonation of 42 districts of Lima and Callao (CISMID, 2004)
4. SEISMIC HAZARD
Once known the seismic source, attenuation laws of waves generated in each of them, and the local site effects,
seismic hazard can be calculated by considering the sum of the effects of all the seismogenic sources and the distance between each source and the structure site. The seismic hazard, expressed in terms of exceedance rates
of intensities is:
∑ ∫=
=>
∂λ∂
−=υNn
1n
Mu
Moiro dM)R,MaA(P
M)p,R a( (8)
where the sum of all the seismogenic sources N, y Pr(A>a|M,Ri) is the probability that the intensity exceeds a certain value, given the magnitude of the earthquake M, and the distance between the i-th source and site Ri.
The functionsλ i(M) rates are sources of seismic activity (Ordaz et al, 1998; Ordaz, 1999).
Since it is assumed that, given the magnitude and distance, the intensity has lognormal distribution, the
probability Pr(A>a|M,Ri) is calculated as follows:
σφ=>
a
)R,MA(Eln
1)R,M aAPr(
i
Lna
i (9)
being φ (.) standard normal distribution, E(A|M,Ri) the average value of the logarithm of intensity (given by
law corresponding attenuation) and Lnaσ its corresponding standard deviation.

The 14th
World Conference on Earthquake Engineering
October 12-17, 2008, Beijing, China
The seismic hazard is expressed, then in terms of the exceedance rate of values given of seismic intensity
(Figure 3). As indicated, in this case the seismic intensity a, is measure with the spectrum response
seudoaccelerations for 5% of critical damping and natural vibration period of building interest T.
Figure 3. Exceedance rates for peak ground acceleration of Lima (CISMID, 2003)
5. STRUCTURAL VULNERABILITY
The structural vulnerability (Figure 4) is the relationship between seismic intensity and level of damage. In this
approach seismic intensity is measured with the spectrum acceleration. The level of damage can be estimated
by taking the drift, which is calculated as the relative movement between two contiguous levels, divided by the
height of the story. There are a significant number of studies that conclude that this parameter of the structural
response presents the best correlation with structural damage reported (Bertero et al., 1991; 1992; Moehle,
1996; Miranda, 1997; Priestley, 1997; Sozen, 1997; Miranda, 2005). Contrary to the majority of systems based
the estimate of damage in the Modified Mercalli intensity, the method is based on a parameter that presents an excellent correlation with the damage caused by the action of strong earthquakes. From the spectrum
acceleration, it is possible to determine the maximum drift with the following:
)T(SNh4
)N(a2
2
4321
iπ
ηββββ=γ
ρ
(10)
where: β 1=Is the relationship between the maximum lateral displacement at the top level of the structure and
spectrum displacement, considering a model of linear elastic behavior. This factor depends on the
type and number of story of the structure.
β 2=Describes the relationship between the maximum drift and distortion of the complete structure,
which is defined as the maximum lateral displacement on the roof divided by the total height. β 2
depend on the degree of participation of shear and flexural deformations, and structural typology.
β 3=Expresses the relationship between the maximum lateral displacement of the inelastic model, and
the maximum displacement of elastic linear model. This factor depends on the displacement
ductility demand, the fundamental period of vibration of the structure and soil condition that
supports them.
β 4=Is the relationship between factors β 2 elastic and inelastic. This factor takes into account that
lateral strength distribution with the height is different in the elastic and the inelastic model. In the
case of inelastic behavior is a large concentration of strength.

The 14th
World Conference on Earthquake Engineering
October 12-17, 2008, Beijing, China
200
N
3014 +
µ+=β (11)
where: N = is the number of story.
µ = is the ductility demand of the structure.
h = is the height of each story of the structure.
Sa(T) = is the spectrum acceleration, which depends on the fundamental period of vibration, damping of structures and seismic hazard in the site.
Figure 4. Model of Behavior the Structural Vulnerability (Miranda, 2005)
These factors depend on the location of the structure, the typology structure, local soil condition and year of
construction. They take into account the fact that the lateral stiffness of the structures located in areas of high seismic activity is higher than for structures located in areas of low seismicity. We also believe that the
structures on soft soil are more flexible than those built on rigid soil due to the flexibility of the foundation.
These parameters have been calibrated with analytical models, experimental laboratory and different considerations following the seismic codes.
Once it determines the maximum drift of structure, their vulnerability can be increased by several factors such
as vertical and plant irregularities, pounding, soft story, poor conditions, torsion, short columns, etc.
The expected value of damage to the structure, given a maximum value of drift, is calculated as follows:
γ
γ−=γβ
ε
o
ii 5.0lnexp1) (E (12)
where β is the total losses, γ 0 and ε are parameters of structural vulnerability that depends on structural
system and the date of construction, and E(.) is the expected value. Note that by definition, β is the ratio
between the cost of repair and the total cost, and its value is between 0 and 1.
6. PROBABLE MAXIMUM LOSS (PML)
The probable maximum loss (PML) of a portfolio is an estimator of the maximum size of losses that would be
reasonable to expect such a portfolio over a period of seismic exposure. It is used as a fundamental data to
determine the size of the reserves that the insurance company should maintain. In this model is defined as the
estimated loss would occur for a given return period. Therefore, it is necessary to calculate exceedance rates of
net losses of the portfolio, β (PN). If the j-th source is generated an earthquake, the net loss for the portfolio
will be:
∑ β= i NjiiNj VP (13)
where Vi is the value of the i-th structure, β Nij is the net loss in the structure i, if an earthquake occurs with

The 14th
World Conference on Earthquake Engineering
October 12-17, 2008, Beijing, China
certain characteristics in the source j, and the sum is to include all buildings of the portfolio.
In this model assumes that the amount PNj/∑i iV is also distributed as a random variable Beta. So the expected
value of PNj can be easily calculated as follows:
∑ γβ= i ijNjiiNj )(EV)P(E (14)
where γ ij is the maximum drift experienced by the structure I, if an earthquake of magnitude known is
generated at source j. However, to calculate the variance of PNj, be taken into account the correlation between different types of losses that can be generated in the building, contents and business interruption combined.
Once you know the expected value and variance of PNj, the exceedance rates of PN can be calculated as follows
(Ordaz et al, 1998; Ordaz, 1999):
∑ ∫ >λ
−=µ j NNj
Mu
Mo
j
N dM)i_fuente,MPPPr(dM
)M(d)P( (15)
where λ j (M) is the exceedance rate of magnitude M at source j, and sum takes into account the effects of all
seismic sources. Once these calculations can be performed to determine the PML for each case.
Figure 5 shows the flow chart for estimating the frequency curve of losses (Swiss Re, 2003). Finally, Figure 6
shows the integrated methodology for estimating the probable maximum loss for a specific portfolio.
Figure 5. Flowchart for estimating the frequency curve of losses (Swiss Re, 2003)
Figure 6. Flowchart to calculate the probable maximum loss (PML, basic information of a specific portfolio)

The 14th
World Conference on Earthquake Engineering
October 12-17, 2008, Beijing, China
7. VALUE DISTRIBUTION AND INSURANCE CONDITIONS
To process the distribution of risks exposed throughout the portfolio has been necessary to centralize
information in a geographic information system (GIS) in order to incorporate all the necessary parameters for estimating the probable maximum loss (PML). In way of illustration, shows the location of the risks insured
within the Department of Lima and the Constitutional Province of Callao for a specific portfolio (Figure 7).
Figure 7. Location of risks insured in the Department of Lima and Callao province
To characterize the soil condition in each risk analysis is necessary geo-referencing values exhibited according
to their geographic location.
Figure 8 shows the geo-referencing of risks in the district of Chorrillos. Finally, Figure 9 shows the soil
condition according to the seismic zoning geotechnical produced by CISMID (2004). It is important to note that
in Chorrillos you can appreciate the 4 different soil conditions assigned according to the Peruvian Seismic
Design Code (E030-RNC, 2003).
Figure 8. Location of risks insured of Chorrillos district

The 14th
World Conference on Earthquake Engineering
October 12-17, 2008, Beijing, China
Figure 9. Location of risks insured of Chorrillos district
The conditions of insurance vary according to the market, natural hazards and policies of the Insurance Company. The deductibles may be a percentage of the sum insured a percentage of the loss or fixed amount.
Limits may be a percentage of the sum insured or fixed amount. The conditions are applied to insurance losses
and the result is the net loss.
Finally, we obtained a representative PML with a value about 6.1% for a return period of 1000 years, of all the
risks insured of Lima and Callao, which is representative of the average from all the Insurance Companies.
8. CONCLUSIONS AND RECOMMENDATIONS
You can make the following conclusions and recommendations:
We propose a framework for assessing the seismic risk in which it has established the curve of the PML considering modules seismic hazard, structural vulnerability, value distribution and insurance conditions of
portfolio. The procedure followed in estimating the PML is shown with a methodology internationally accepted
by the scientific community to estimate insured losses of portfolios.
There has been a curve PML with different return periods. In general, there are no standard criteria to measure
the PML; however, it is advisable to refer to a period of return between 500 and 2000 years.
Hopefully, those insurance companies reserved an amount equal to the PML or else must reinsure such amount.
Finally, the estimated losses due to earthquake are essential for the government to implement strategic for
earthquakes disasters and management plans.
ACKNOWLEDGEMENTS
The authors acknowledge the support provided by the Faculty of Civil Engineering, Japan Peru Centre for Earthquake Engineering Research and Disaster Mitigation-CISMID, National University of Engineering and all
the technical and administrative staff of the project APESEG/CISMID-EVR-LYC, and the financial support
from the Asociación Peruana de Empresas de Seguros (APESEG) and the Superintendencia de Banca y Seguros
(SBS) del Perú for the realization of this study. In addition, we want to make a special thank to the International
Adviser of the project, Dr. Mario Ordaz, a professor at the National Autonomous University of Mexico.

The 14th
World Conference on Earthquake Engineering
October 12-17, 2008, Beijing, China
9. REFERENCES
Bertero, V.V., Anderson, J.C., Krawinkler, H., and Miranda, E. (1991). "Design Guidelines for Ductility and Drift Limits: Review of the State-of-the-Practice and State-of-the-Art in Ductility and Drift-Based
Earthquake-Resistant Design of Buildings", Report No. UCB/EERC-91/15, Earthquake Engineering Research
Center, University of California, Berkeley, California. Casaverde L. and Vargas J. (1980). "Seismic Zoning of Peru", II Latin American Seminar on Earthquake
Engineering Hardy, Organization of American States and Pontificial Catholic University of Peru, Lima, Perú.
Castillo J. (1993). "Seismic Hazard in Peru", Thesis Grade, Faculty of Civil Engineering, National University
of Engineering, Lima, Peru.
CISMID (2004). “Study of Seismic Risk and Vulnerabillity of Lima and Callao.
APESEG/CISM-EVR-LYC-Final Report”. Asociación Peruana de Empresas de Seguros-APESEG, Japanese
Peruvian Centre for Research and Earthquake Disaster Mitigation-CISM, Lima, Perú.
Dorbath L., Cisternas, A y Dorbath, C. (1990). “Assessment of the size of large and great historical earthquakes
in Peru”, Bulletin of the Seismological Society of America. McGuire R. (1974). "Seismic Structural Response Risk Analysis Incorporating Peak Response Regressions on
Earthquake Magnitude and Distance", MIT Report R74-51, Cambridge, Mass. McGuire R. (1995), “EZ-FRISK,
User’s Manual”, RISK Engineering, Boulder, Co. Miranda, E. (1997). “Estimation of Maximum Interstory Drift Demands in Displacement-Based Design”.
Seismic design Methodologies for the Next Generation of Codes, H. Krawinkler and P. Fajfar editor, Balkema.
Miranda, E. (2005). Simplified Analysis Tools for Rapid Seismic Evaluation of Existing Buildings in Urban
Areas. Stanford University.
Moehle, J.P. (1996). “Displacement-Based Seismic Design Criteria”. Proceedings of the Eleventh World
Conference on Earthquake Engineering, Acapulco, Mexico.
Olarte J., Zavala C., Aguilar Z., Vásquez G., Escobar R. and Romaní S. (2003). “Estimate of the probable
maximum loss PML in 10 districts Greater Lima and Callao: Application to the Peruvian insurance industry”.
XIV National Congreso of Civil Engineering, Iquitos, Peru Collage of Engineers-Departamental Council of
Loreto-Chapter of Civil Engineers. Olarte J., Aguilar Z., Zavala C., Romaní S. and Escobar R. (2005), “Estimate of the probable maximum loss
PML in Lima and Callao: Application to the Peruvian insurance industry”, XIX International Symposium latest
developments in the Engineering and Earthquake Risk Management of Desasters, CISM, Faculty of Civil
Engineering, National University of Engineering.
Ordaz, M., Miranda, E., Reinoso, E., Pérez-Rocha, Luis E. (1998). “Seismic Loss Estimation Model For
México City”.
Ordaz, M. (1999). “Methodology of seismic risk assessment focused on management by Earthquake
Insurance”.
Priestley, M. (1997). “Displacement-Based Seismic Assessment of Reinforced Concrete Buildings”. Journal of Earthquake Engineering, Vol. 1 No. 1, pp. 157-192.
Silgado E. (1978). “History of the most notable earthquakes occurred in Peru (1513-1974)”. Institute of
Geology and Mining, Bulletin N°3, Series C, Geodynamics and Geological Engineering, Lima, Perú. Sozen, M.A. (1997). “Drift-Driven Design for Earthquake Resistance of Reinforced Concrete”. Proc.
EERC-CUREe Symposium in Honor of Vitelmo V. Bertero, Berkeley, California.
Swiss Reinsurance Company (2003). "Natural Catastrophes and Reinsures". Risk perception Natural catastrophes.