estimate performance and capacity requirements for sharepoint
TRANSCRIPT
Estimate performance and capacity requirements for SharePoint Server 2010 Search
This document is provided “as-is”. Information and views expressed in this document, including URL and
other Internet Web site references, may change without notice. You bear the risk of using it.
Some examples depicted herein are provided for illustration only and are fictitious. No real association or
connection is intended or should be inferred.
This document does not provide you with any legal rights to any intellectual property in any Microsoft
product. You may copy and use this document for your internal, reference purposes.
© 2010 Microsoft Corporation. All rights reserved.
Estimate performance and capacity requirements for SharePoint Server 2010 Search
Brion Stone
Microsoft Corporation
April 2010
Applies to: SharePoint Server 2010 Search
Summary: This document provides capacity planning information for different deployments of
SharePoint Server 2010 search, including small, medium, and large Microsoft® SharePoint®
Server 2010 farms. For each of these configurations, this document provides:
Test environment specifications, such as hardware, farm topology, and configuration
The workload used for data generation, including the number and class of users and farm
usage characteristics
Test farm dataset, including database contents, search indexes, and external data
sources
Health and performance data specific to the tested environment
Test data and recommendations for determining the hardware, topology, and
configuration you need to deploy a similar environment, and for optimizing your
environment for appropriate capacity and performance characteristics
Contents
Contents Contents ........................................................................................................................................................... 1 Introduction ...................................................................................................................................................... 3 Planning overview .............................................................................................................................................. 4
Choosing a scenario ..................................................................................................................................... 4
Search lifecycle ............................................................................................................................................ 5 Scenarios .......................................................................................................................................................... 5
Small farm .................................................................................................................................................. 5
Specifications ........................................................................................................................................ 6
Workload ............................................................................................................................................ 10
Dataset .............................................................................................................................................. 10
Health and performance data ................................................................................................................ 11
Test data ............................................................................................................................................ 14
Medium farm ............................................................................................................................................. 16
Specifications ...................................................................................................................................... 16
Workload ............................................................................................................................................ 20
Dataset .............................................................................................................................................. 20
Health and performance data ................................................................................................................ 22
Test data ............................................................................................................................................ 26
Large farm ................................................................................................................................................ 28
Specifications ...................................................................................................................................... 28
Workload ............................................................................................................................................ 33
Dataset .............................................................................................................................................. 33
Health and performance data ................................................................................................................ 34
Test data ............................................................................................................................................ 35 Recommendations and troubleshooting ............................................................................................................... 36
Recommendations ...................................................................................................................................... 36
Hardware recommendations .................................................................................................................. 36
Software limits .................................................................................................................................... 45
Optimizations ............................................................................................................................................ 47
Troubleshooting performance and scale issues ............................................................................................... 53
Performance samples during search lifecycle ........................................................................................... 53
Troubleshooting query performance issues .............................................................................................. 54

Troubleshooting crawl performance issues .............................................................................................. 59
Common bottlenecks and their causes .................................................................................................... 61
Introduction This document provides capacity planning information for collaboration environment
deployments of Microsoft SharePoint Server 2010 search. It includes the following information
for three sample search farm configurations:
Test environment specifications, such as hardware, farm topology, and configuration
The workload used for data generation, including the number and class of users and farm
usage characteristics
Test farm dataset, including database contents and sizes
Health and performance data specific to the tested environment
It also contains common test data and recommendations for how to determine the hardware,
topology, and configuration you need to deploy a similar environment, and how to optimize your
environment for appropriate capacity and performance characteristics.
SharePoint Server 2010 search contains a richer set of features and a more flexible topology
model than earlier versions. Before you employ this architecture to deliver more powerful
features and functionality to your users, you must carefully consider the impact upon your
farm’s capacity and performance.
When you read this document, you will understand how to:
Define performance and capacity targets for your environment
Plan the hardware required to support the number and type of users, and the features
you intend to deploy
Design your physical and logical topology for optimum reliability and efficiency
Test, validate, and scale your environment to achieve performance and capacity targets
Monitor your environment for key indicators
Before you read this document, you should be familiar with the following:
Capacity Planning and Sizing for SharePoint Server 2010
SharePoint Server 2010 Capacity Management: Software Boundaries and Limits
Availability
Redundancy
Database-specific content
Planning overview The scenarios in this document describe small, medium, and large test farms, with assumptions
that allow you to start planning for the correct capacity for your farm. These farm sizes are
approximations based on the following assumptions:
The repositories crawled are primarily SharePoint content.
The vast majority of the user queries can be found in the same 33% of the index. This
means that most users query for the same terms.
The default metadata settings are used, ensuring that the Property database(s) do not
grow at a large rate.
In medium and large farms, dedicated crawl targets (front-end Web servers) exist that
can serve content to these search farms’ crawl components.
Measurements taken on these farms may vary due to network and environmental
conditions. We can expect up to a 10% margin of error.
Choosing a scenario To choose the right scenario, you need to consider the following questions:
Corpus size How much content needs to be searchable? The total number of items
should include all objects, including documents, Web pages, list items, and people.
Availability What are the availability requirements? Do customers need a search
solution that can survive the failure of a particular server?
Content freshness How “fresh” do you need the search results? How long after the
customer modifies the data do you expect searches to provide the updated content in
the results? How often do you expect the content to change?
Throughput How many people will be searching over the content simultaneously?
This includes people typing in a query box, as well as other hidden queries like Web
parts automatically searching for data, or Microsoft Outlook 2010 Social Connectors
requesting activity feeds that contain URLs which need security trimming from the
search system.
Based on the answers to the above questions, choose from one of the following scenarios
• Small farm Includes a single search service application sharing some resources on a
single SharePoint 2010 farm. Typical for small deployments, the amount of content over
which to provide search is limited (less than 10 million items). Depending on the desired
content freshness goals, incremental crawls may occur during business hours.
• Medium farm Includes one or more search service applications in a dedicated farm,
providing search services to other farms. The amount of content over which to provide
search is moderate (up to 40 million items), and to meet freshness goals, incremental
crawls are likely to occur during business hours.
• Large farm Includes one or more search service applications in a dedicated farm,
providing search services to other farms. The amount of content over which to provide
search is large (up to 100 million items), and to meet freshness goals, incremental crawls
are likely to occur during business hours.
Search lifecycle These scenarios allow you to estimate capacity at an early stage of the farm. Farms move
through multiple stages as content is crawled:
Index acquisition This is the first stage of data population. The duration of this stage
depends on the size of your content sources. It is characterized by:
o Full crawls (possibly concurrent) of content
o Close monitoring of the crawl system, to ensure that hosts being crawled are not
a bottleneck for the crawl
o Frequent “master merges” that, for each query component, are triggered when a
certain amount of the index has changed
Index maintenance This is the most common stage of a farm. It is characterized by:
o Incremental crawls of all content
o For SharePoint content crawls, a majority of the changes encountered during the
crawl are security changes
o Infrequent “master merges” that, for each query component, are triggered when
a certain amount of the index has changed
Index cleanup This stage occurs when a content change moves the farm out of the
index maintenance stage; for example, when a content database or site is moved from
one search service application to another. This stage is triggered when:
o A content source and/or start address is deleted from a search service application.
o A host supplying content is not found by the search crawler for an extended
period of time.
Scenarios This section describes the configurations we used for the small, medium, and large farm
scenarios. It also includes the workload, dataset, performance data, and test data for each
environment.
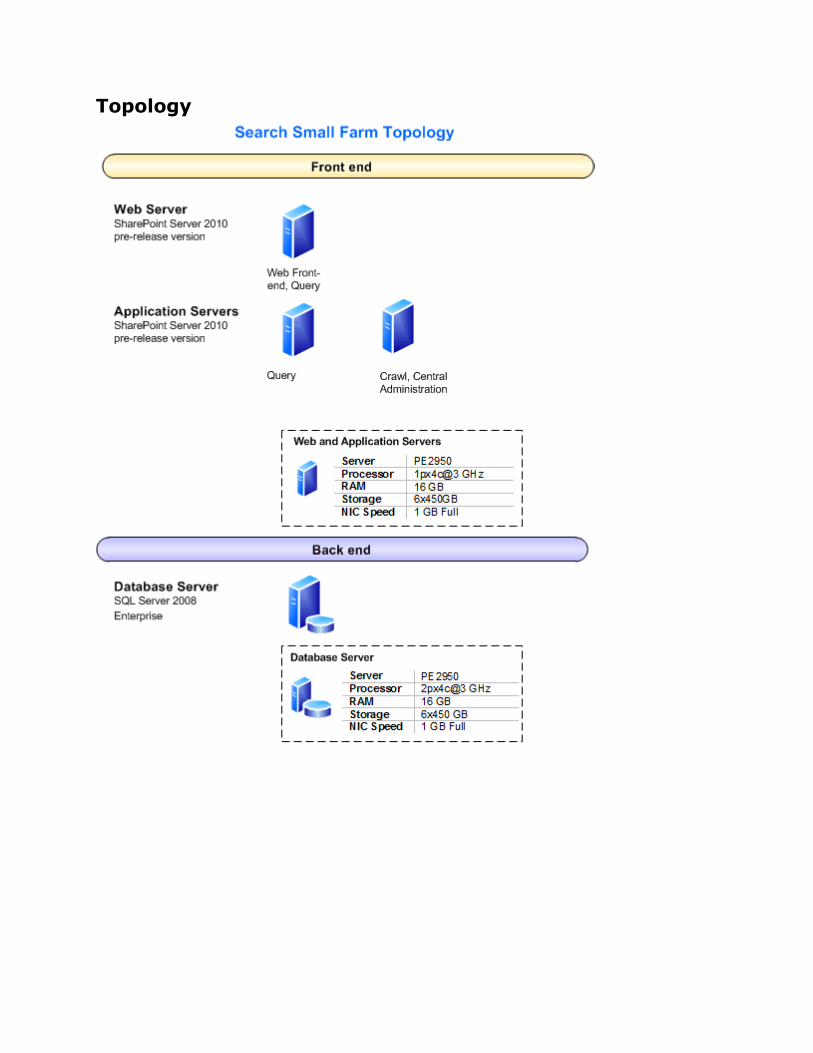
Small farm As the farm is small, multiple roles must be performed by some of the servers. We recommend
combining a query role with a front-end Web server in order to avoid putting crawl and query
components on the same server. This configuration uses three application servers and one
database server, as follows:
Because redundant query servers are generally suggested for enterprise search, we use
two application servers for query, given the following configuration:
o One application server also hosts the Search Center. This configuration can be
omitted if the small farm is used as a service farm, and the search centers are
created on “child” content farms that consume search from this “parent” service
farm.
o The preferred query configuration for less than 10 million items is to have one
index partition. Each server then has one primary query component from the
index partition. This “active/active” query component setup allows the failure of
one of the query components, while still retaining the ability to serve queries from
the remaining query component. Upon query component failure, search sends
queries (round-robin) to the next available query component.
One application server is used for crawling and administration. This means that Central
Administration, the search administration component, and a crawl component are created
on this server.
A single database server to support the farm. The database server should have a
dedicated number of input/output operations per second (IOPS) for crawl and
property/admin databases (for example, use different storage arrays).
Specifications This section provides detailed information about the hardware, software, topology, and
configuration of the test environment.
Topology
Hardware
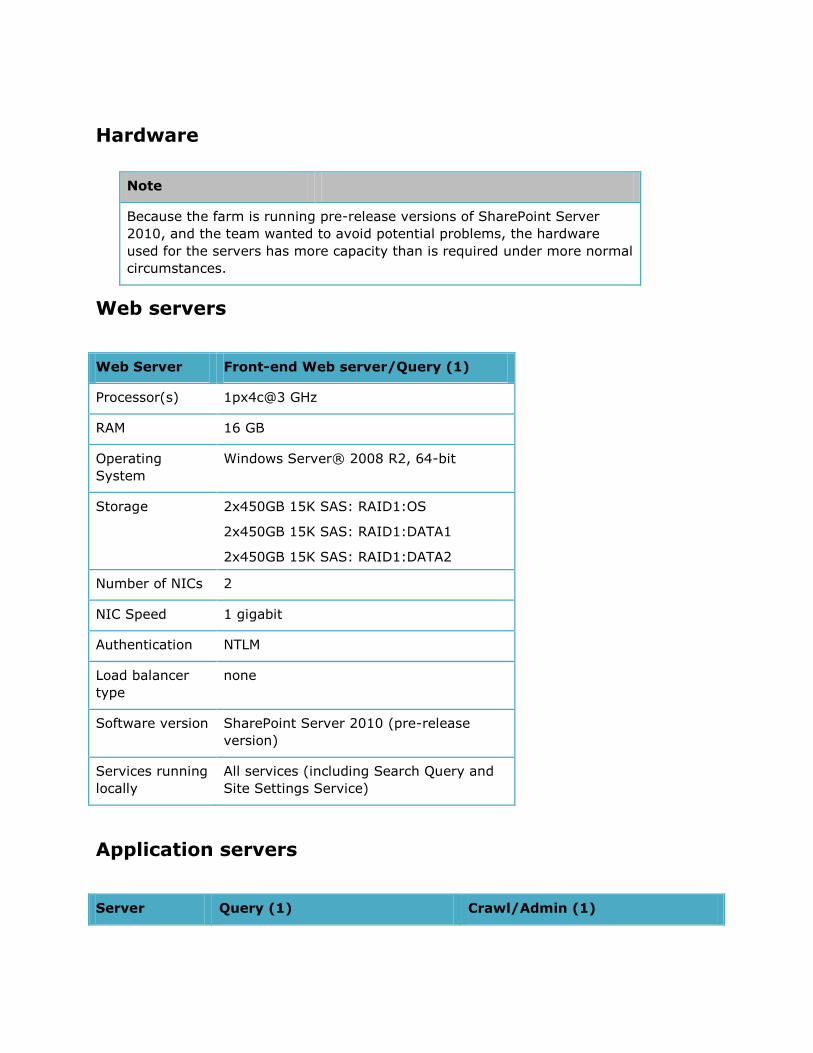
Note
Because the farm is running pre-release versions of SharePoint Server
2010, and the team wanted to avoid potential problems, the hardware
used for the servers has more capacity than is required under more normal
circumstances.
Web servers
Web Server Front-end Web server/Query (1)
Processor(s) 1px4c@3 GHz
RAM 16 GB
Operating
System
Windows Server® 2008 R2, 64-bit
Storage 2x450GB 15K SAS: RAID1:OS
2x450GB 15K SAS: RAID1:DATA1
2x450GB 15K SAS: RAID1:DATA2
Number of NICs 2
NIC Speed 1 gigabit
Authentication NTLM
Load balancer
type
none
Software version SharePoint Server 2010 (pre-release
version)
Services running
locally
All services (including Search Query and
Site Settings Service)
Application servers
Server Query (1) Crawl/Admin (1)
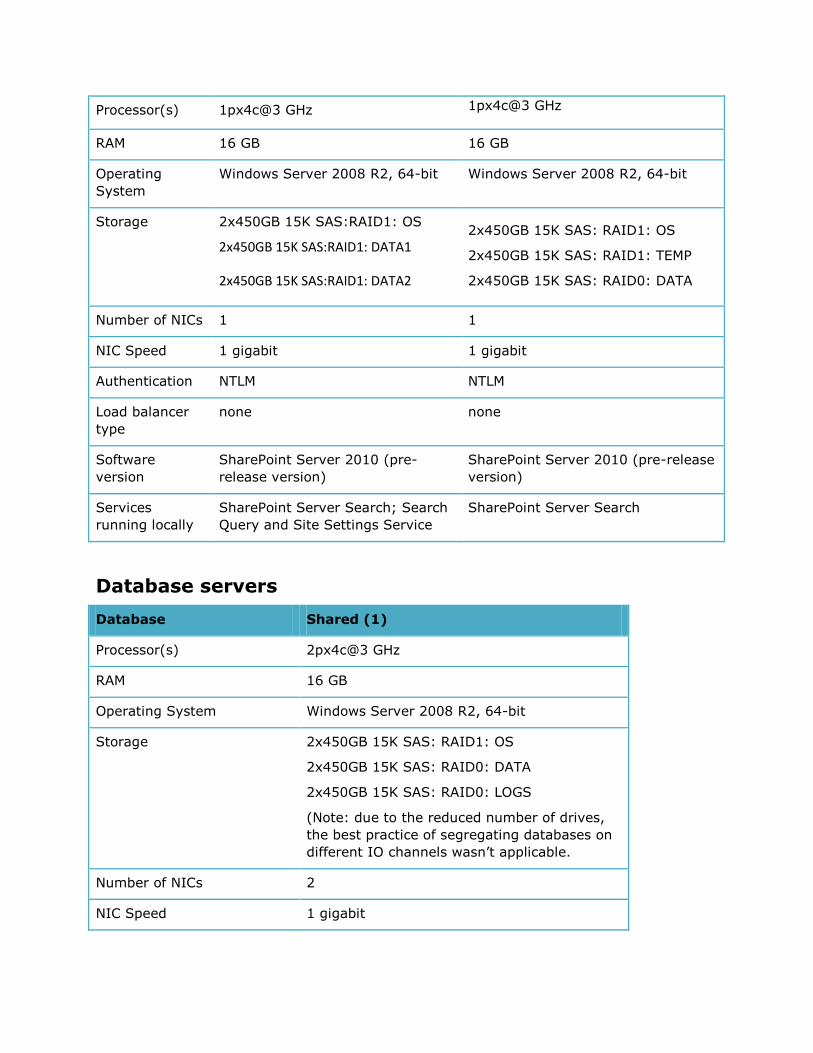
Processor(s) 1px4c@3 GHz 1px4c@3 GHz
RAM 16 GB 16 GB
Operating
System
Windows Server 2008 R2, 64-bit Windows Server 2008 R2, 64-bit
Storage 2x450GB 15K SAS:RAID1: OS
2x450GB 15K SAS:RAID1: DATA1
2x450GB 15K SAS:RAID1: DATA2
2x450GB 15K SAS: RAID1: OS
2x450GB 15K SAS: RAID1: TEMP
2x450GB 15K SAS: RAID0: DATA
Number of NICs 1 1
NIC Speed 1 gigabit 1 gigabit
Authentication NTLM NTLM
Load balancer
type
none none
Software
version
SharePoint Server 2010 (pre-
release version)
SharePoint Server 2010 (pre-release
version)
Services
running locally
SharePoint Server Search; Search
Query and Site Settings Service
SharePoint Server Search
Database servers
Database Shared (1)
Processor(s) 2px4c@3 GHz
RAM 16 GB
Operating System Windows Server 2008 R2, 64-bit
Storage 2x450GB 15K SAS: RAID1: OS
2x450GB 15K SAS: RAID0: DATA
2x450GB 15K SAS: RAID0: LOGS
(Note: due to the reduced number of drives,
the best practice of segregating databases on
different IO channels wasn’t applicable.
Number of NICs 2
NIC Speed 1 gigabit
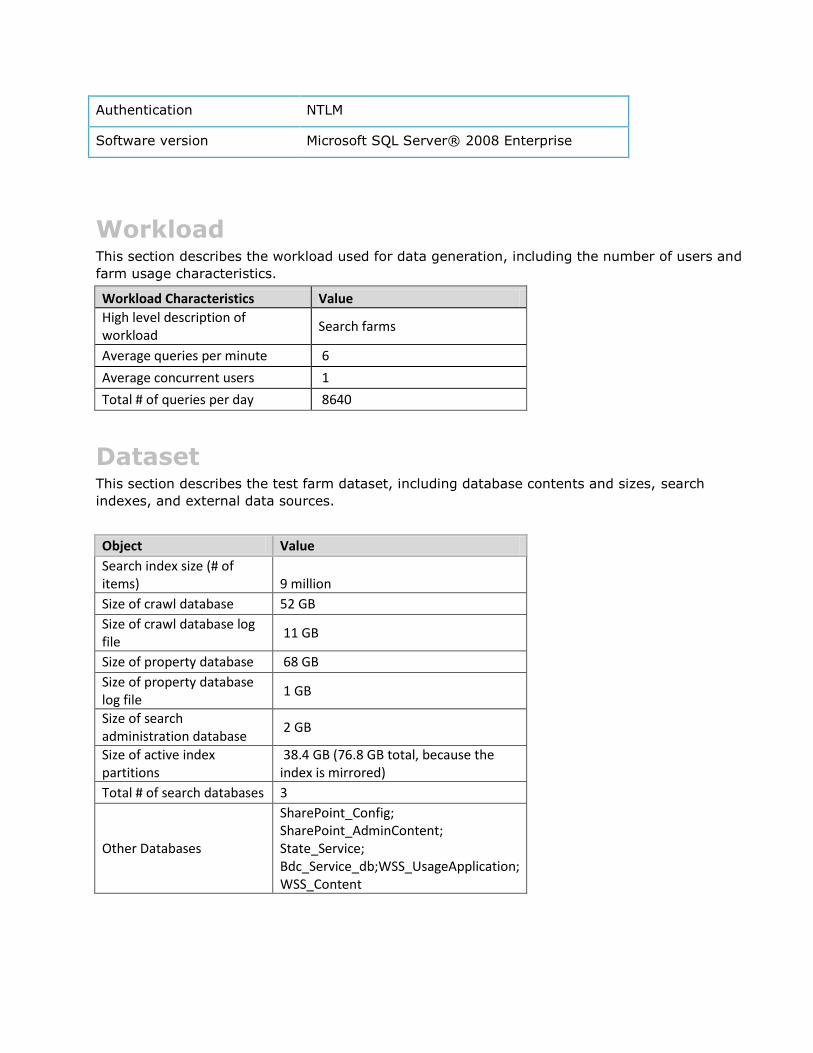
Authentication NTLM
Software version Microsoft SQL Server® 2008 Enterprise
Workload This section describes the workload used for data generation, including the number of users and
farm usage characteristics.
Workload Characteristics Value
High level description of workload
Search farms
Average queries per minute 6
Average concurrent users 1
Total # of queries per day 8640
Dataset This section describes the test farm dataset, including database contents and sizes, search
indexes, and external data sources.
Object Value
Search index size (# of items) 9 million
Size of crawl database 52 GB
Size of crawl database log file
11 GB
Size of property database 68 GB
Size of property database log file
1 GB
Size of search administration database
2 GB
Size of active index partitions
38.4 GB (76.8 GB total, because the index is mirrored)
Total # of search databases 3
Other Databases
SharePoint_Config; SharePoint_AdminContent; State_Service; Bdc_Service_db;WSS_UsageApplication; WSS_Content
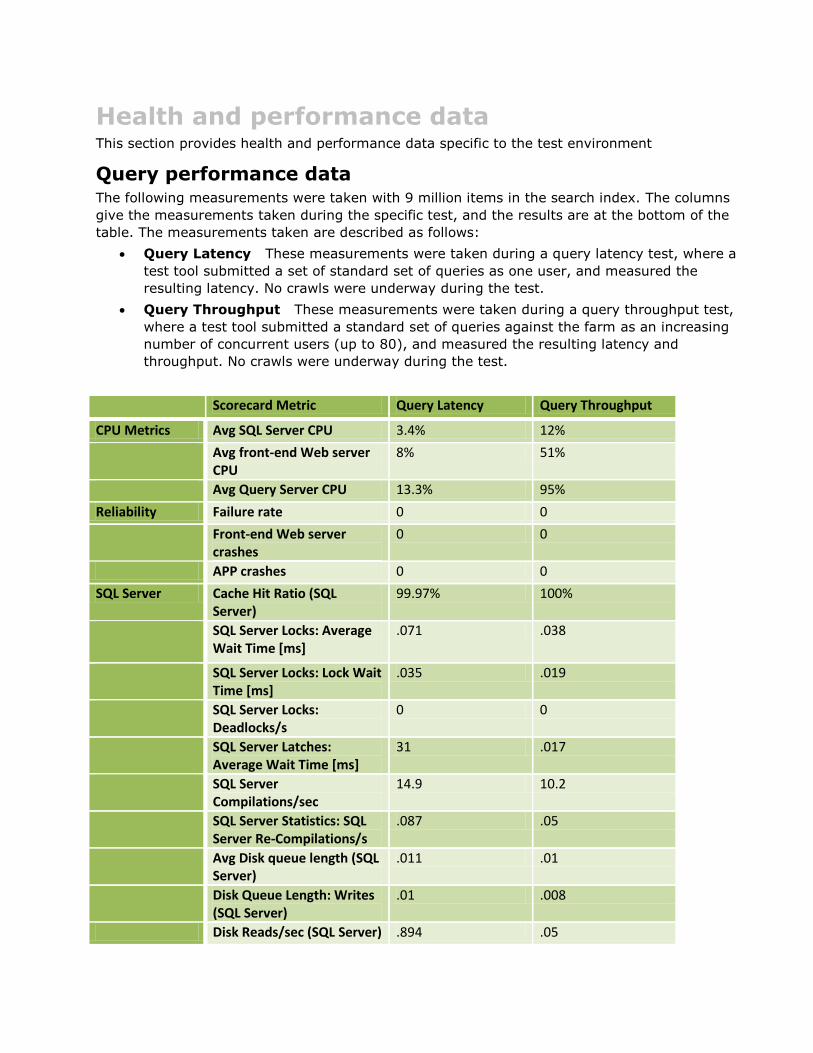
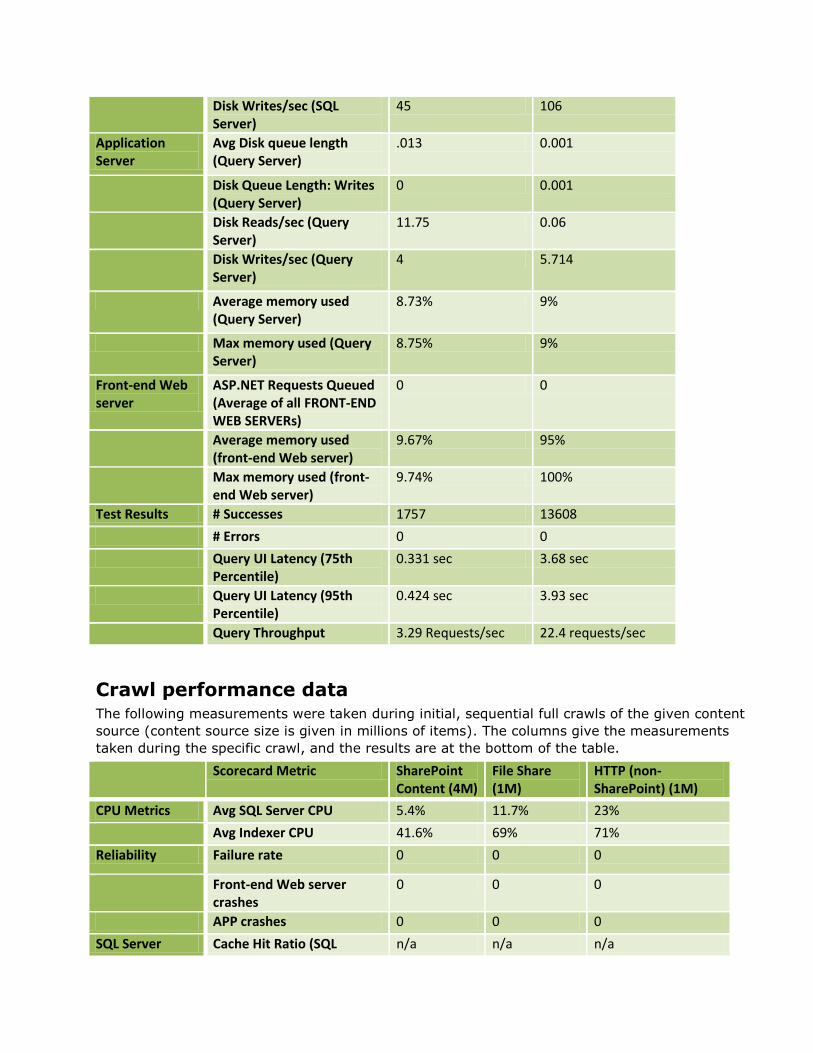
Health and performance data This section provides health and performance data specific to the test environment
Query performance data The following measurements were taken with 9 million items in the search index. The columns
give the measurements taken during the specific test, and the results are at the bottom of the
table. The measurements taken are described as follows:
Query Latency These measurements were taken during a query latency test, where a
test tool submitted a set of standard set of queries as one user, and measured the
resulting latency. No crawls were underway during the test.
Query Throughput These measurements were taken during a query throughput test,
where a test tool submitted a standard set of queries against the farm as an increasing
number of concurrent users (up to 80), and measured the resulting latency and
throughput. No crawls were underway during the test.
Scorecard Metric Query Latency Query Throughput
CPU Metrics Avg SQL Server CPU 3.4% 12%
Avg front-end Web server CPU
8% 51%
Avg Query Server CPU 13.3% 95%
Reliability Failure rate 0 0
Front-end Web server crashes
0 0
APP crashes 0 0
SQL Server Cache Hit Ratio (SQL Server)
99.97% 100%
SQL Server Locks: Average Wait Time [ms]
.071 .038
SQL Server Locks: Lock Wait Time [ms]
.035 .019
SQL Server Locks: Deadlocks/s
0 0
SQL Server Latches: Average Wait Time [ms]
31 .017
SQL Server Compilations/sec
14.9 10.2
SQL Server Statistics: SQL Server Re-Compilations/s
.087 .05
Avg Disk queue length (SQL Server)
.011 .01
Disk Queue Length: Writes (SQL Server)
.01 .008
Disk Reads/sec (SQL Server) .894 .05
Disk Writes/sec (SQL Server)
45 106
Application Server
Avg Disk queue length (Query Server)
.013 0.001
Disk Queue Length: Writes (Query Server)
0 0.001
Disk Reads/sec (Query Server)
11.75 0.06
Disk Writes/sec (Query Server)
4 5.714
Average memory used (Query Server)
8.73% 9%
Max memory used (Query Server)
8.75% 9%
Front-end Web server
ASP.NET Requests Queued (Average of all FRONT-END WEB SERVERs)
0 0
Average memory used (front-end Web server)
9.67% 95%
Max memory used (front-end Web server)
9.74% 100%
Test Results # Successes 1757 13608
# Errors 0 0
Query UI Latency (75th Percentile)
0.331 sec 3.68 sec
Query UI Latency (95th Percentile)
0.424 sec 3.93 sec
Query Throughput 3.29 Requests/sec 22.4 requests/sec
Crawl performance data The following measurements were taken during initial, sequential full crawls of the given content
source (content source size is given in millions of items). The columns give the measurements
taken during the specific crawl, and the results are at the bottom of the table.
Scorecard Metric SharePoint Content (4M)
File Share (1M)
HTTP (non-SharePoint) (1M)
CPU Metrics Avg SQL Server CPU 5.4% 11.7% 23%
Avg Indexer CPU 41.6% 69% 71%
Reliability Failure rate 0 0 0
Front-end Web server crashes
0 0 0
APP crashes 0 0 0
SQL Server Cache Hit Ratio (SQL n/a n/a n/a
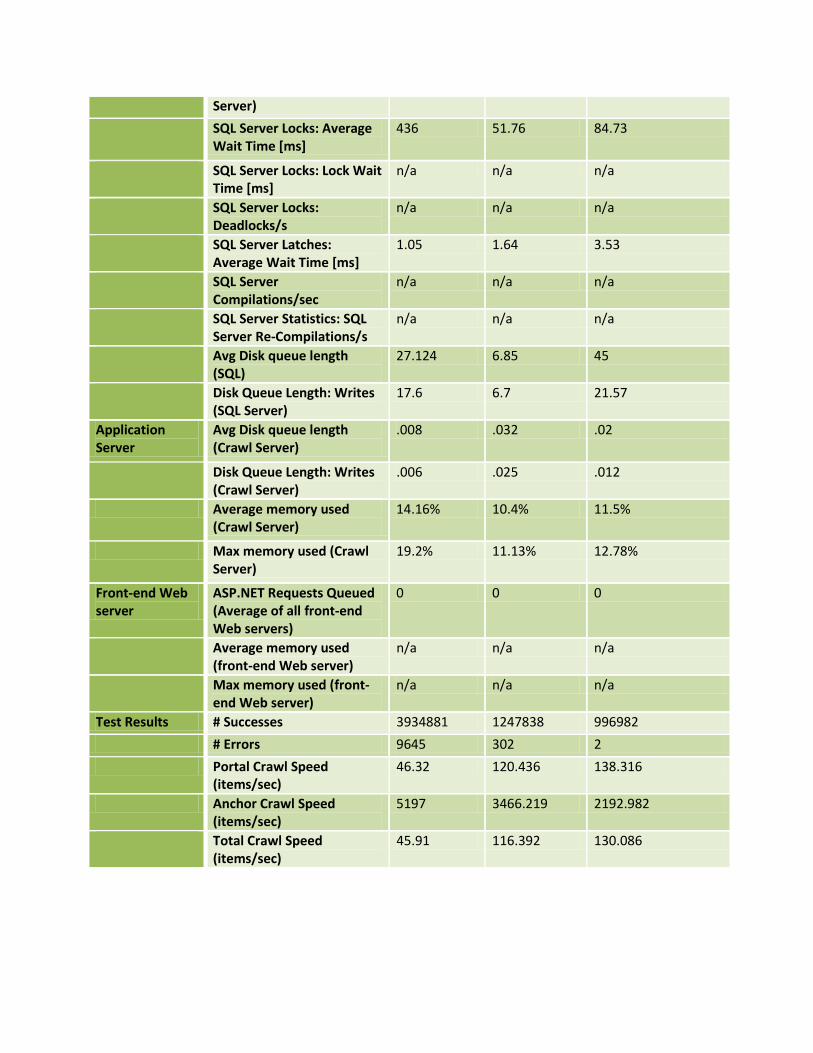
Server)
SQL Server Locks: Average Wait Time [ms]
436 51.76 84.73
SQL Server Locks: Lock Wait Time [ms]
n/a n/a n/a
SQL Server Locks: Deadlocks/s
n/a n/a n/a
SQL Server Latches: Average Wait Time [ms]
1.05 1.64 3.53
SQL Server Compilations/sec
n/a n/a n/a
SQL Server Statistics: SQL Server Re-Compilations/s
n/a n/a n/a
Avg Disk queue length (SQL)
27.124 6.85 45
Disk Queue Length: Writes (SQL Server)
17.6 6.7 21.57
Application Server
Avg Disk queue length (Crawl Server)
.008 .032 .02
Disk Queue Length: Writes (Crawl Server)
.006 .025 .012
Average memory used (Crawl Server)
14.16% 10.4% 11.5%
Max memory used (Crawl Server)
19.2% 11.13% 12.78%
Front-end Web server
ASP.NET Requests Queued (Average of all front-end Web servers)
0 0 0
Average memory used (front-end Web server)
n/a n/a n/a
Max memory used (front-end Web server)
n/a n/a n/a
Test Results # Successes 3934881 1247838 996982
# Errors 9645 302 2
Portal Crawl Speed (items/sec)
46.32 120.436 138.316
Anchor Crawl Speed (items/sec)
5197 3466.219 2192.982
Total Crawl Speed (items/sec)
45.91 116.392 130.086
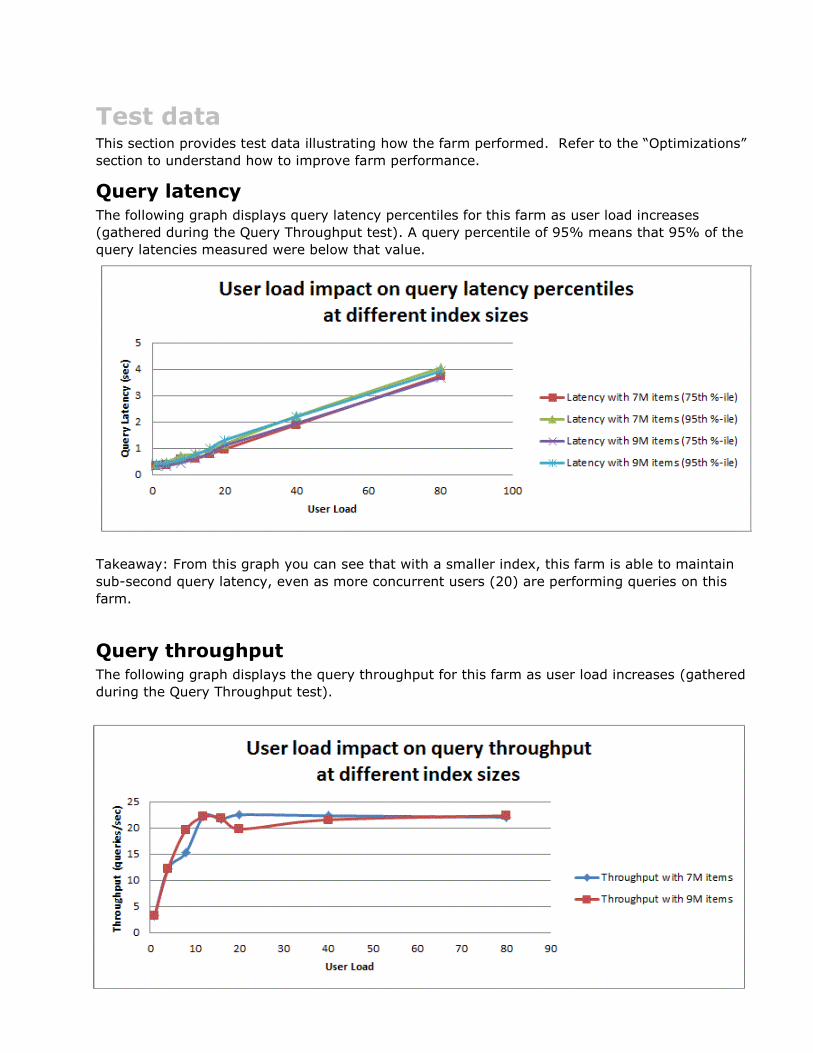
Test data This section provides test data illustrating how the farm performed. Refer to the “Optimizations”
section to understand how to improve farm performance.
Query latency The following graph displays query latency percentiles for this farm as user load increases
(gathered during the Query Throughput test). A query percentile of 95% means that 95% of the
query latencies measured were below that value.
Takeaway: From this graph you can see that with a smaller index, this farm is able to maintain
sub-second query latency, even as more concurrent users (20) are performing queries on this
farm.
Query throughput The following graph displays the query throughput for this farm as user load increases (gathered
during the Query Throughput test).
Takeaway: Taking into account both this graph and the last graph, you can see that adding
additional user load beyond about 20 concurrent users, this farm will get no additional
throughput, and the user latencies will increase.
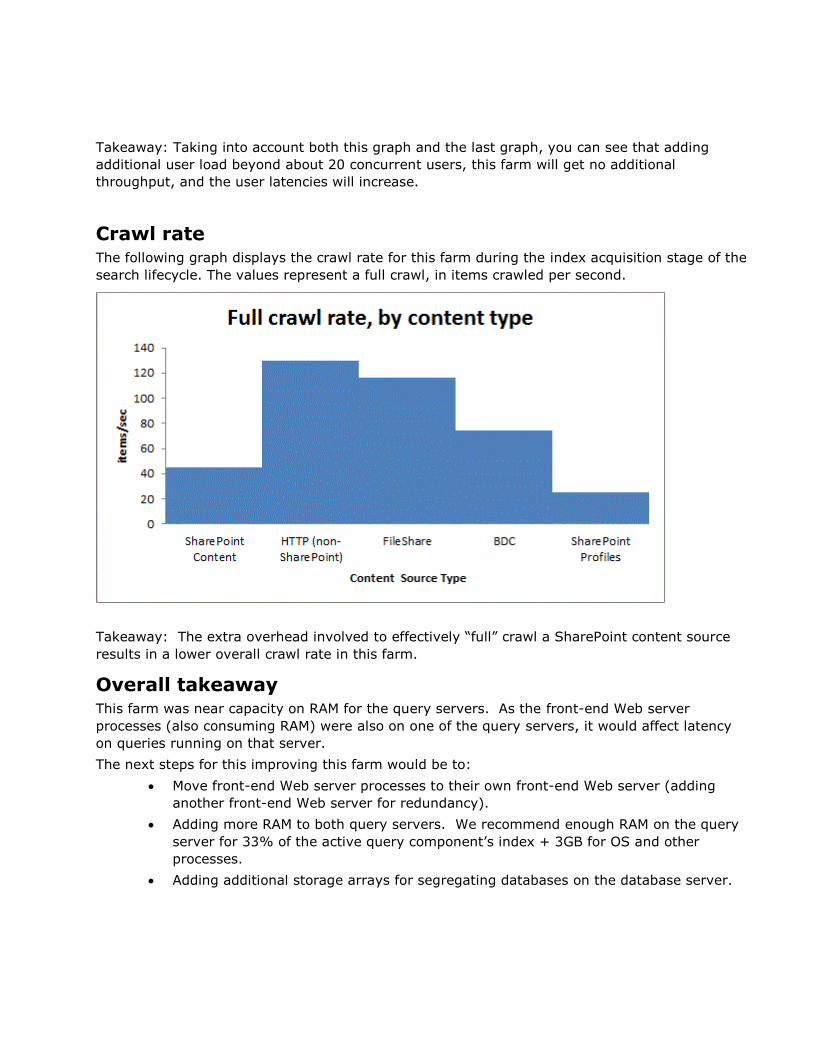
Crawl rate The following graph displays the crawl rate for this farm during the index acquisition stage of the
search lifecycle. The values represent a full crawl, in items crawled per second.
Takeaway: The extra overhead involved to effectively “full” crawl a SharePoint content source
results in a lower overall crawl rate in this farm.
Overall takeaway This farm was near capacity on RAM for the query servers. As the front-end Web server
processes (also consuming RAM) were also on one of the query servers, it would affect latency
on queries running on that server.
The next steps for this improving this farm would be to:
Move front-end Web server processes to their own front-end Web server (adding
another front-end Web server for redundancy).
Adding more RAM to both query servers. We recommend enough RAM on the query
server for 33% of the active query component’s index + 3GB for OS and other
processes.
Adding additional storage arrays for segregating databases on the database server.
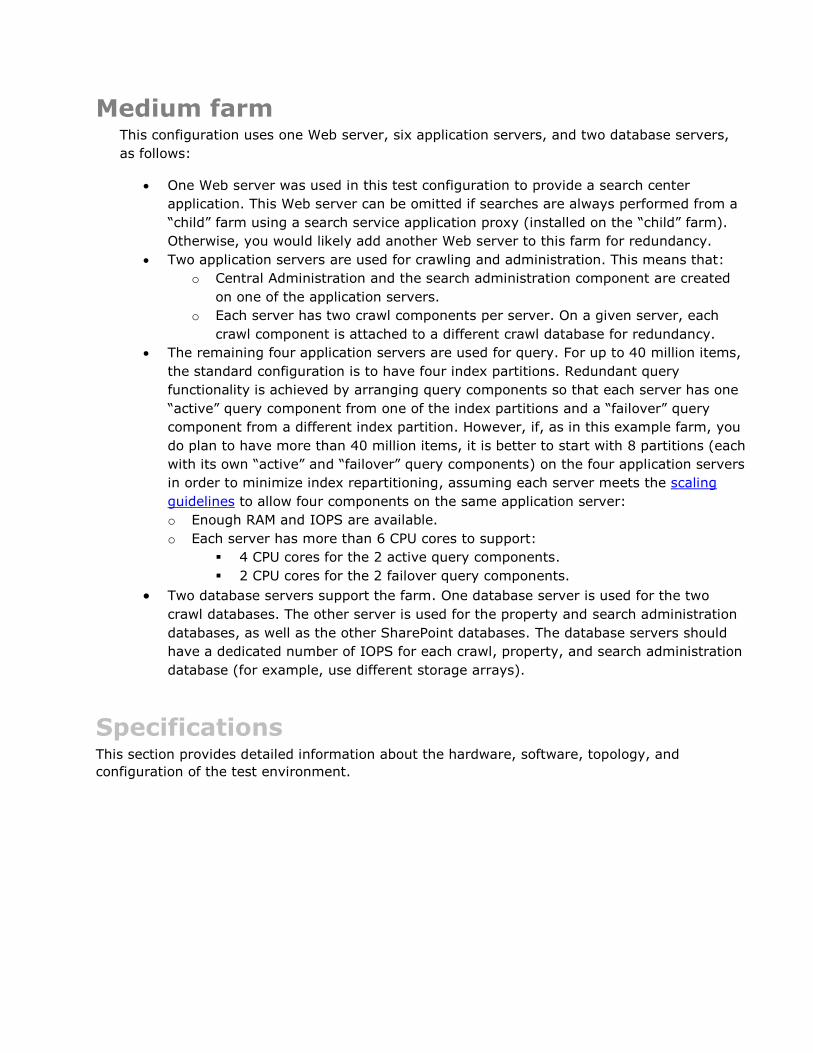
Medium farm This configuration uses one Web server, six application servers, and two database servers,
as follows:
One Web server was used in this test configuration to provide a search center
application. This Web server can be omitted if searches are always performed from a
“child” farm using a search service application proxy (installed on the “child” farm).
Otherwise, you would likely add another Web server to this farm for redundancy.
Two application servers are used for crawling and administration. This means that:
o Central Administration and the search administration component are created
on one of the application servers.
o Each server has two crawl components per server. On a given server, each
crawl component is attached to a different crawl database for redundancy.
The remaining four application servers are used for query. For up to 40 million items,
the standard configuration is to have four index partitions. Redundant query
functionality is achieved by arranging query components so that each server has one
“active” query component from one of the index partitions and a “failover” query
component from a different index partition. However, if, as in this example farm, you
do plan to have more than 40 million items, it is better to start with 8 partitions (each
with its own “active” and “failover” query components) on the four application servers
in order to minimize index repartitioning, assuming each server meets the scaling
guidelines to allow four components on the same application server:
o Enough RAM and IOPS are available.
o Each server has more than 6 CPU cores to support:
4 CPU cores for the 2 active query components.
2 CPU cores for the 2 failover query components.
Two database servers support the farm. One database server is used for the two
crawl databases. The other server is used for the property and search administration
databases, as well as the other SharePoint databases. The database servers should
have a dedicated number of IOPS for each crawl, property, and search administration
database (for example, use different storage arrays).
Specifications This section provides detailed information about the hardware, software, topology, and
configuration of the test environment.
Topology
Hardware
Note
Because the farm is running pre-release versions of SharePoint Server
2010, and the team wanted to avoid potential problems, the hardware
used for the servers has more capacity than is required under more normal
circumstances.
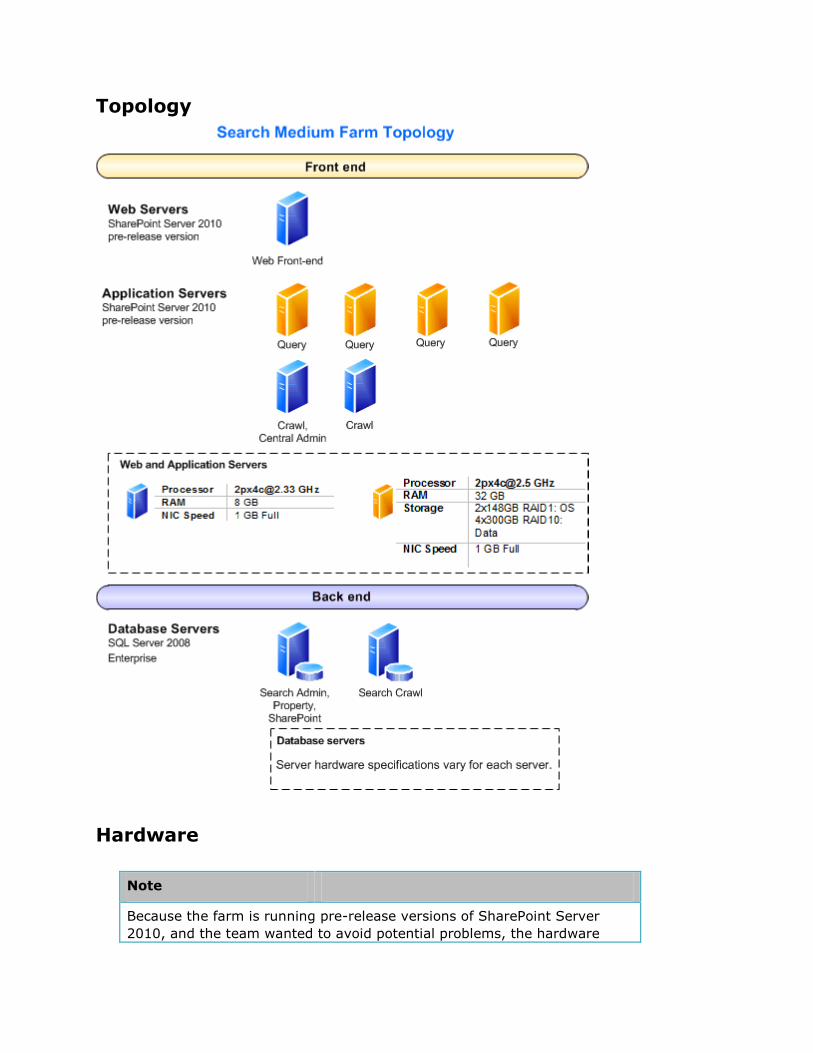
Web servers
Web Server Front-end Web server (1)
Processor(s) [email protected] GHz
RAM 8 GB
Operating
System
Windows Server 2008 R2, 64-bit
Storage 2x148GB 15K SAS: RAID1: OS
Number of NICs 2
NIC Speed 1 gigabit
Authentication NTLM
Load balancer
type
none
Software version SharePoint Server 2010 (pre-
release version)
Services running
locally
All Services
Application servers
There are six application servers in the farm; four servers are used for serving queries and two
servers are used for crawling.
Server (count) Query (4) Crawl (1), Crawl/Admin (1)
Processor(s) [email protected] GHz [email protected] GHz
RAM 32 GB 8 GB
Operating
System
Windows Server 2008 R2, 64-bit Windows Server 2008 R2, 64-bit
Storage 2x148 GB 15K SAS: RAID1: OS 2x148 GB 15K SAS:RAID1: OS/Data
4x300GB 15K SAS:RAID10:Data
Number of NICs 2 2
NIC Speed 1 gigabit 1 gigabit
Authentication NTLM NTLM
Load balancer
type
None None
Software version SharePoint Server 2010 (pre-
release version)
SharePoint Server 2010 (pre-release
version)
Services running
locally
SharePoint Server Search;
Search Query and Site Settings
Service
SharePoint Server Search
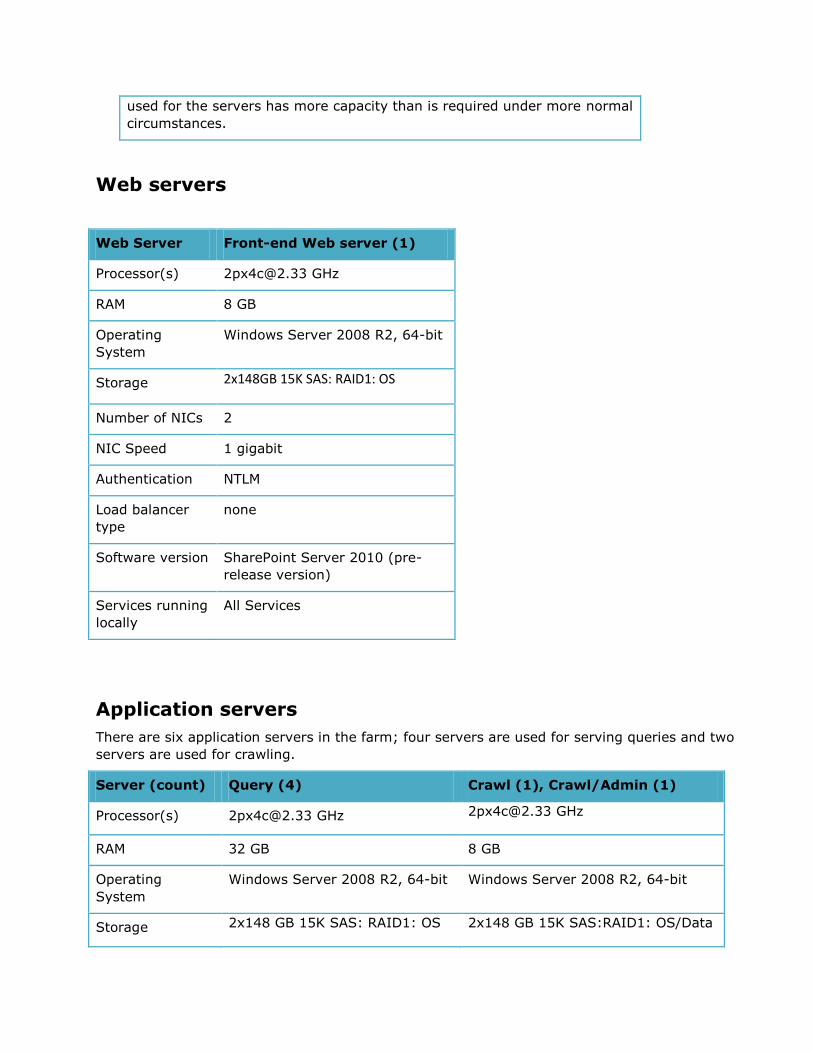
Database servers
There are two database servers. The first server contains the search administration, property,
and other SharePoint databases; the second server contains the two crawl databases. Note that
the storage volumes created optimized the existing hardware available for the test.
Database Server Search Admin
/Property/SharePoint
Crawl Databases
Processor(s) [email protected] GHz [email protected] GHz
RAM 32 GB 16 GB
Operating System Windows Server 2008 R2,
64-bit
Windows Server 2008 R2,
64-bit
Storage 2x148GB 15K SAS
:RAID1: OS
2x148GB 15K SAS
:RAID1: TEMP Log
2x450GB 15K SAS
:RAID1: TEMP DB
6x450GB 15K SAS
:RAID10: Property DB
2x450GB 15K SAS
:RAID1:Search Admin,
SharePoint DBs
2x148GB 15K SAS
:RAID1: OS
2x148GB 15K SAS
:RAID1: TEMP Log
2x300GB 15K SAS
:RAID1: TEMP DB
6x146GB 15K SAS
:RAID10: Crawl DB1
6x146GB 15K SAS
:RAID10: Crawl DB2
2x300GB 15K SAS
2x450GB 15K SAS
:RAID1:Logs
:RAID1:Crawl DB Log1
2x300GB 15K SAS
:RAID1:Crawl DB Log2
Number of NICs 2 2
NIC Speed 1 gigabit 1 gigabit
Authentication NTLM NTLM
Software version SQL Server 2008
Enterprise
SQL Server 2008
Enterprise
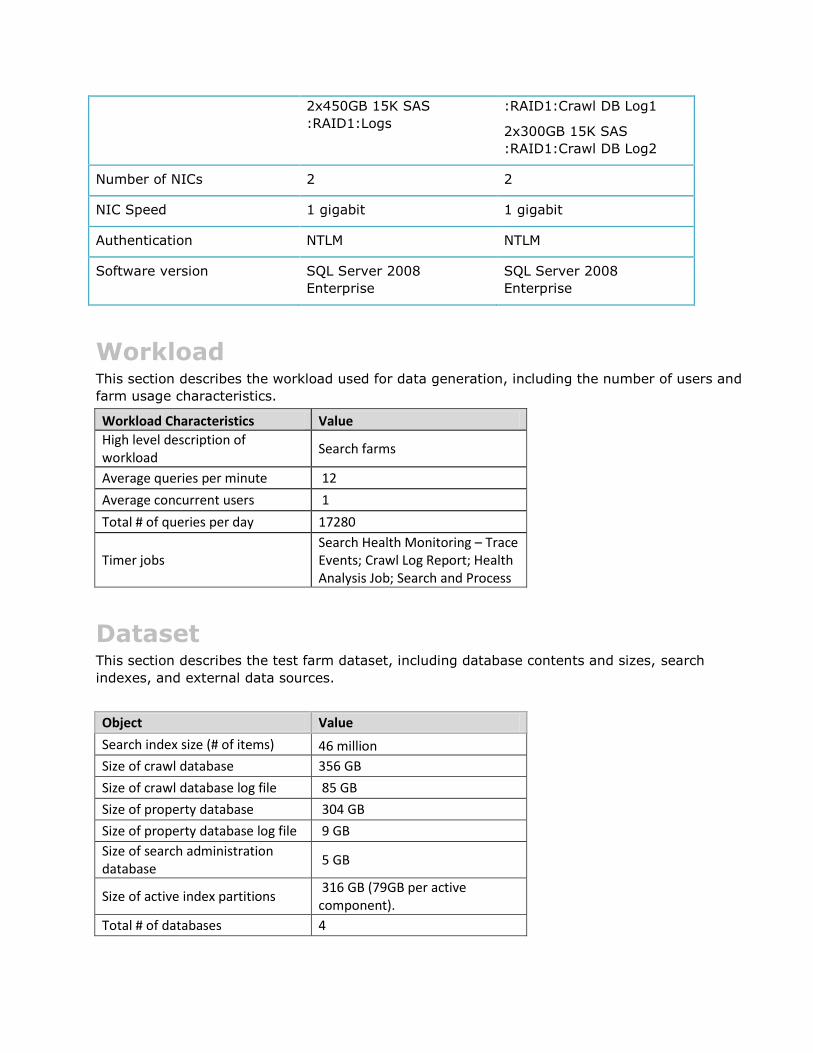
Workload This section describes the workload used for data generation, including the number of users and
farm usage characteristics.
Workload Characteristics Value
High level description of workload
Search farms
Average queries per minute 12
Average concurrent users 1
Total # of queries per day 17280
Timer jobs Search Health Monitoring – Trace Events; Crawl Log Report; Health Analysis Job; Search and Process
Dataset This section describes the test farm dataset, including database contents and sizes, search
indexes, and external data sources.
Object Value
Search index size (# of items) 46 million
Size of crawl database 356 GB
Size of crawl database log file 85 GB
Size of property database 304 GB
Size of property database log file 9 GB
Size of search administration database
5 GB
Size of active index partitions 316 GB (79GB per active component).
Total # of databases 4

Other Databases
SharePoint_Config; SharePoint_AdminContent; State_Service; Bdc_Service_db; WSS_UsageApplication; WSS_Content
Health and performance data This section provides health and performance data specific to the test environment.
Query performance data The following measurements were taken with 46 million items in the search index. The columns
give the measurements taken during the specific test, and the results are at the bottom of the
table. The measurements taken are described as follows:
Query Latency These measurements were taken during a query latency test, where a
test tool submitted a set of standard set of queries as one user, and measured the
resulting latency. No crawls were underway during the test.
Query Throughput These measurements were taken during a query throughput test,
where a test tool submitted a standard set of queries against the farm as an increasing
number of concurrent users (up to 80), and measured the resulting latency and
throughput. No crawls were underway during the test.
Scorecard Metric Query Latency Query Throughput
CPU Metrics Avg SQL Server CPU (property DB server)
5% 98%
Avg front-end Web server CPU
3% 33%
Avg Query Server CPU 3% 47%
Reliability Failure rate 0.07% 0%
Front-end Web server crashes
0 0
APP crashes 0 0
SQL Server (property DB server)
Cache Hit Ratio (SQL) 100% 99.9%
SQL Server Locks: Average Wait Time [ms]
0.000 0.159
SQL Server Locks: Lock Wait Time [ms]
0.000 0.080
SQL Server Locks: Deadlocks/s
0 0
SQL Server Latches: Average Wait Time [ms]
0.041 1.626
SQL Server Compilations/sec
9.776
93.361
SQL Server Statistics: SQL Server Re-Compilations/s
0.059 0.071
Read/Write Ratio (IO Per Database)
.01 .81
Avg Disk queue length (SQL 0.001 0.037
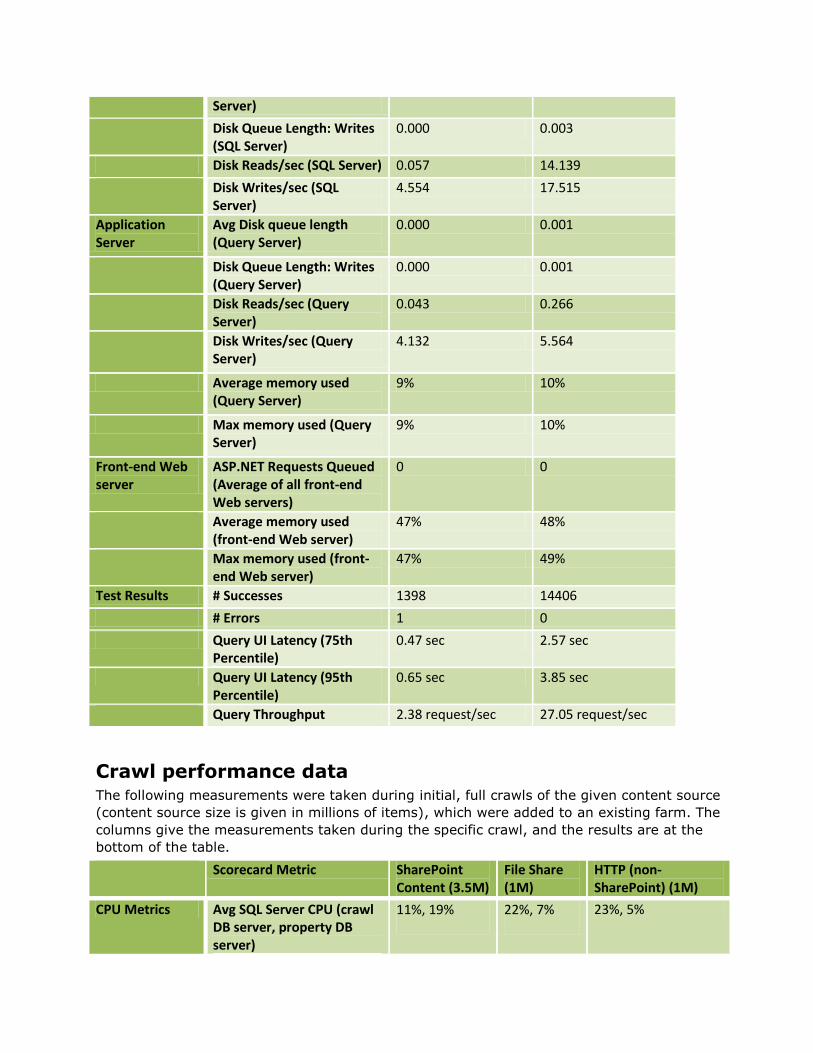
Server)
Disk Queue Length: Writes (SQL Server)
0.000 0.003
Disk Reads/sec (SQL Server) 0.057 14.139
Disk Writes/sec (SQL Server)
4.554 17.515
Application Server
Avg Disk queue length (Query Server)
0.000 0.001
Disk Queue Length: Writes (Query Server)
0.000 0.001
Disk Reads/sec (Query Server)
0.043 0.266
Disk Writes/sec (Query Server)
4.132 5.564
Average memory used (Query Server)
9% 10%
Max memory used (Query Server)
9% 10%
Front-end Web server
ASP.NET Requests Queued (Average of all front-end Web servers)
0 0
Average memory used (front-end Web server)
47% 48%
Max memory used (front-end Web server)
47% 49%
Test Results # Successes 1398 14406
# Errors 1 0
Query UI Latency (75th Percentile)
0.47 sec 2.57 sec
Query UI Latency (95th Percentile)
0.65 sec 3.85 sec
Query Throughput 2.38 request/sec 27.05 request/sec
Crawl performance data The following measurements were taken during initial, full crawls of the given content source
(content source size is given in millions of items), which were added to an existing farm. The
columns give the measurements taken during the specific crawl, and the results are at the
bottom of the table.
Scorecard Metric SharePoint Content (3.5M)
File Share (1M)
HTTP (non-SharePoint) (1M)
CPU Metrics Avg SQL Server CPU (crawl DB server, property DB server)
11%, 19% 22%, 7% 23%, 5%
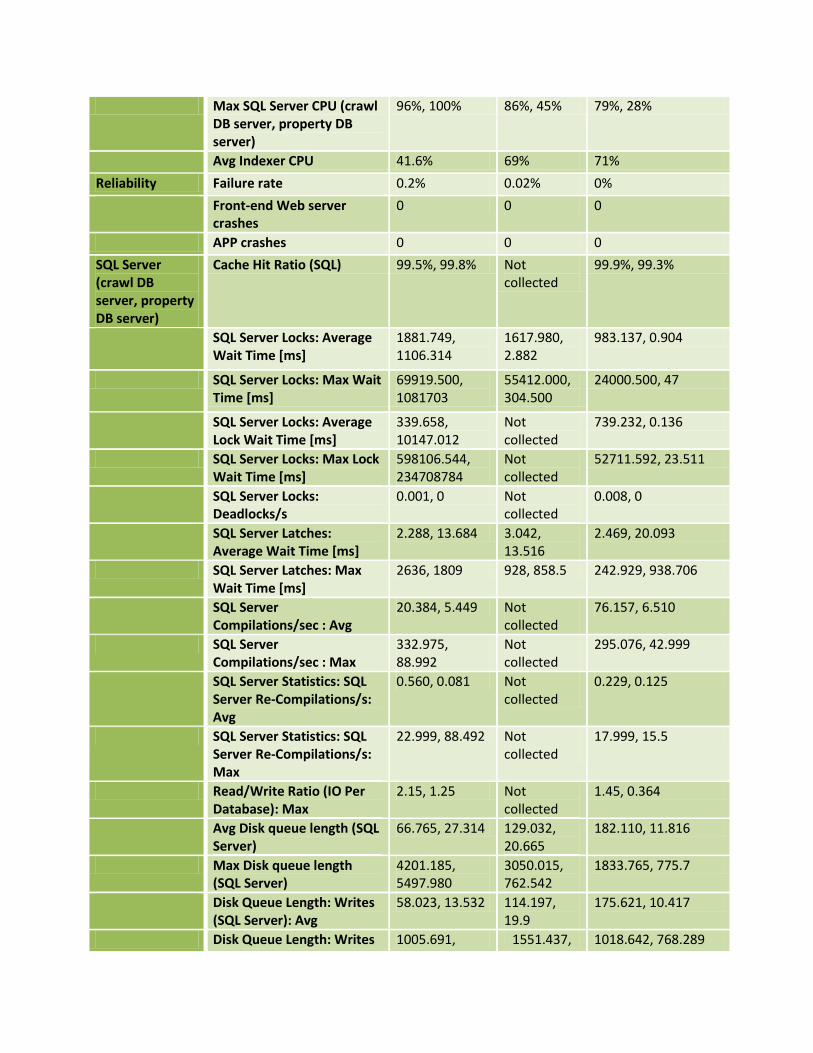
Max SQL Server CPU (crawl DB server, property DB server)
96%, 100% 86%, 45% 79%, 28%
Avg Indexer CPU 41.6% 69% 71%
Reliability Failure rate 0.2% 0.02% 0%
Front-end Web server crashes
0 0 0
APP crashes 0 0 0
SQL Server (crawl DB server, property DB server)
Cache Hit Ratio (SQL) 99.5%, 99.8% Not collected
99.9%, 99.3%
SQL Server Locks: Average Wait Time [ms]
1881.749, 1106.314
1617.980, 2.882
983.137, 0.904
SQL Server Locks: Max Wait Time [ms]
69919.500, 1081703
55412.000, 304.500
24000.500, 47
SQL Server Locks: Average Lock Wait Time [ms]
339.658, 10147.012
Not collected
739.232, 0.136
SQL Server Locks: Max Lock Wait Time [ms]
598106.544, 234708784
Not collected
52711.592, 23.511
SQL Server Locks: Deadlocks/s
0.001, 0 Not collected
0.008, 0
SQL Server Latches: Average Wait Time [ms]
2.288, 13.684 3.042, 13.516
2.469, 20.093
SQL Server Latches: Max Wait Time [ms]
2636, 1809 928, 858.5 242.929, 938.706
SQL Server Compilations/sec : Avg
20.384, 5.449 Not collected
76.157, 6.510
SQL Server Compilations/sec : Max
332.975, 88.992
Not collected
295.076, 42.999
SQL Server Statistics: SQL Server Re-Compilations/s: Avg
0.560, 0.081 Not collected
0.229, 0.125
SQL Server Statistics: SQL Server Re-Compilations/s: Max
22.999, 88.492 Not collected
17.999, 15.5
Read/Write Ratio (IO Per Database): Max
2.15, 1.25 Not collected
1.45, 0.364
Avg Disk queue length (SQL Server)
66.765, 27.314 129.032, 20.665
182.110, 11.816
Max Disk queue length (SQL Server)
4201.185, 5497.980
3050.015, 762.542
1833.765, 775.7
Disk Queue Length: Writes (SQL Server): Avg
58.023, 13.532 114.197, 19.9
175.621, 10.417
Disk Queue Length: Writes 1005.691, 1551.437, 1018.642, 768.289
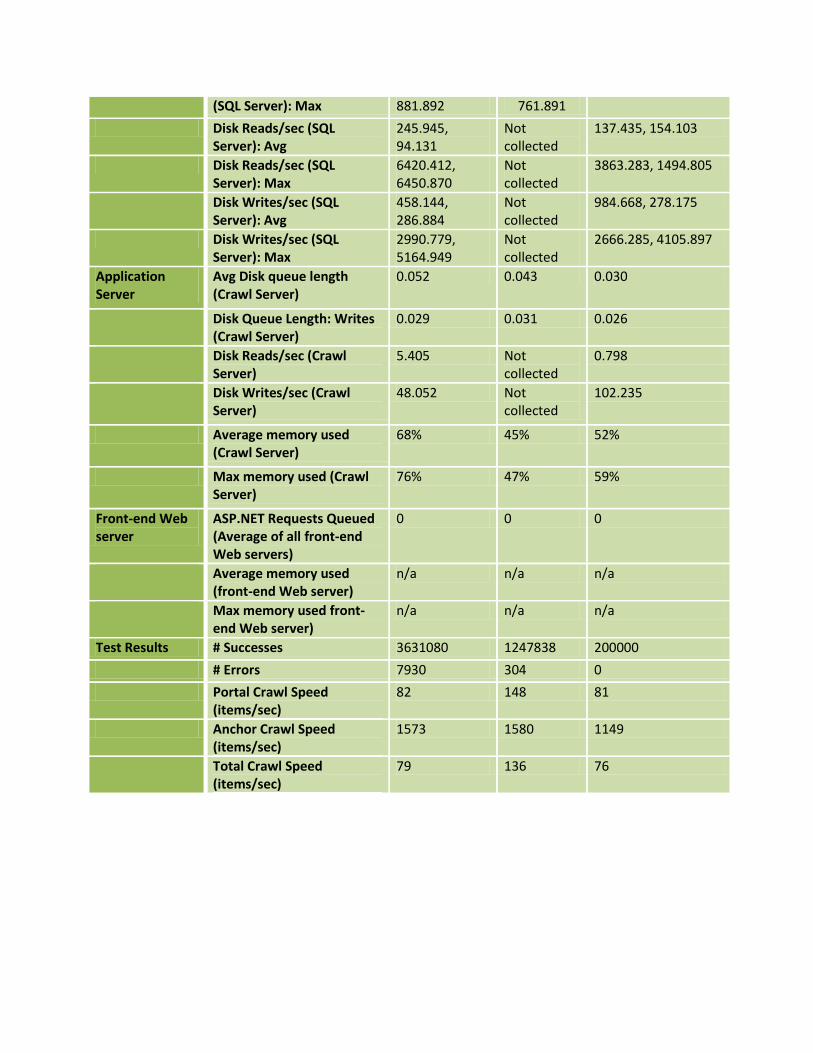
(SQL Server): Max 881.892 761.891
Disk Reads/sec (SQL Server): Avg
245.945, 94.131
Not collected
137.435, 154.103
Disk Reads/sec (SQL Server): Max
6420.412, 6450.870
Not collected
3863.283, 1494.805
Disk Writes/sec (SQL Server): Avg
458.144, 286.884
Not collected
984.668, 278.175
Disk Writes/sec (SQL Server): Max
2990.779, 5164.949
Not collected
2666.285, 4105.897
Application Server
Avg Disk queue length (Crawl Server)
0.052 0.043 0.030
Disk Queue Length: Writes (Crawl Server)
0.029 0.031 0.026
Disk Reads/sec (Crawl Server)
5.405 Not collected
0.798
Disk Writes/sec (Crawl Server)
48.052 Not collected
102.235
Average memory used (Crawl Server)
68% 45% 52%
Max memory used (Crawl Server)
76% 47% 59%
Front-end Web server
ASP.NET Requests Queued (Average of all front-end Web servers)
0 0 0
Average memory used (front-end Web server)
n/a n/a n/a
Max memory used front-end Web server)
n/a n/a n/a
Test Results # Successes 3631080 1247838 200000
# Errors 7930 304 0
Portal Crawl Speed (items/sec)
82 148 81
Anchor Crawl Speed (items/sec)
1573 1580 1149
Total Crawl Speed (items/sec)
79 136 76
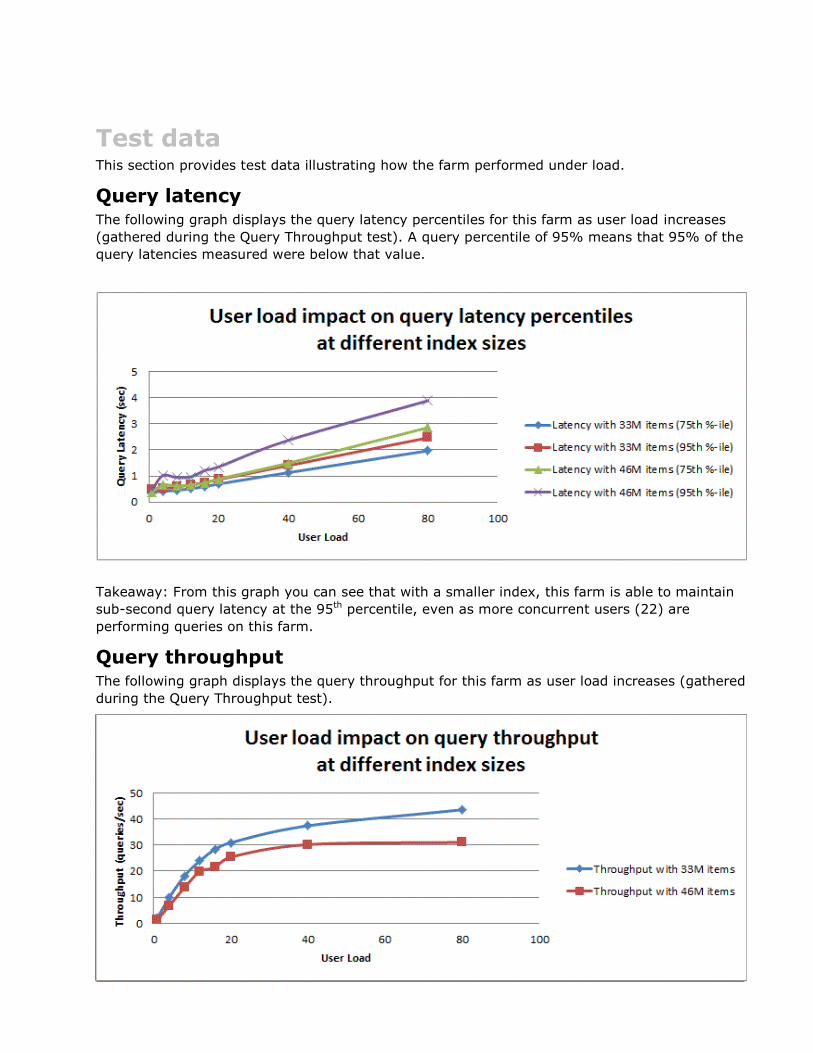
Test data This section provides test data illustrating how the farm performed under load.
Query latency The following graph displays the query latency percentiles for this farm as user load increases
(gathered during the Query Throughput test). A query percentile of 95% means that 95% of the
query latencies measured were below that value.
Takeaway: From this graph you can see that with a smaller index, this farm is able to maintain
sub-second query latency at the 95th percentile, even as more concurrent users (22) are
performing queries on this farm.
Query throughput The following graph displays the query throughput for this farm as user load increases (gathered
during the Query Throughput test).
Takeaway: Taking into account both this graph and the last graph, you can see that, at 33
million items in the index, the farm is able to maintain sub-second latency at the 75th percentile
with about 30 concurrent users; additional concurrent user load can still be accommodated, but
query latency will increase beyond the sub-second mark.
However, at 46 million items in the index, no additional concurrent user load can be
accommodated, and query latency will increase.
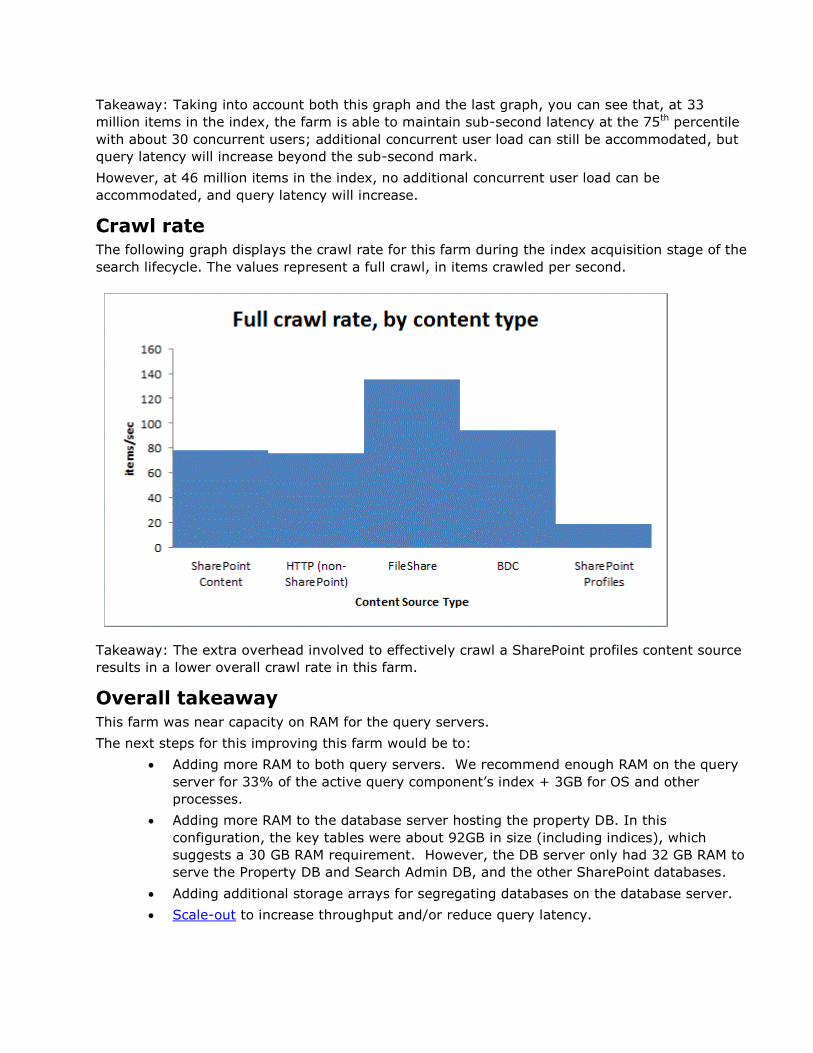
Crawl rate The following graph displays the crawl rate for this farm during the index acquisition stage of the
search lifecycle. The values represent a full crawl, in items crawled per second.
Takeaway: The extra overhead involved to effectively crawl a SharePoint profiles content source
results in a lower overall crawl rate in this farm.
Overall takeaway This farm was near capacity on RAM for the query servers.
The next steps for this improving this farm would be to:
Adding more RAM to both query servers. We recommend enough RAM on the query
server for 33% of the active query component’s index + 3GB for OS and other
processes.
Adding more RAM to the database server hosting the property DB. In this
configuration, the key tables were about 92GB in size (including indices), which
suggests a 30 GB RAM requirement. However, the DB server only had 32 GB RAM to
serve the Property DB and Search Admin DB, and the other SharePoint databases.
Adding additional storage arrays for segregating databases on the database server.
Scale-out to increase throughput and/or reduce query latency.
Although crawl speed is high on this farm with 2 crawl databases and 4 crawl components, it
may be an important goal for your farm to have certain “hot” or fresher parts of the index, that
is, certain content sources that need to be crawled very frequently. Adding another crawl
database dedicated to hosts in the desired content source (via host distribution rules), and
associating two additional crawl components to the database, would support the fresher index
goal.
Large farm The expected configuration uses 14 application servers and three database servers, as follows:
One Web server is used, if desired, to provide a search center application. This Web
server can be omitted if searches are always performed from a content farm using a
search service application proxy (installed on the content farm).
Three application servers are used for crawling and administration. This means that:
o Central Administration and the search administration component are created on
one of the application servers.
o Each server has two crawl components per server. On a given server, each crawl
component is attached to a crawl database.
The remaining ten application servers are used for query. The preferred configuration is
to have ten index partitions. Each server then has one primary query component from
one of the index partitions, in addition to a failover query component from a different
index partition.
Three database servers support the farm. One server is used for the property and search
administration databases. A second server is used for two crawl databases. The third
server is used for one crawl database, as well as the other SharePoint databases. The
database servers should have a dedicated number of IOPS for each crawl, property, and
search administration database (for example, use different storage arrays).
Specifications This section provides detailed information about the hardware, software, topology, and
configuration of the test environment.
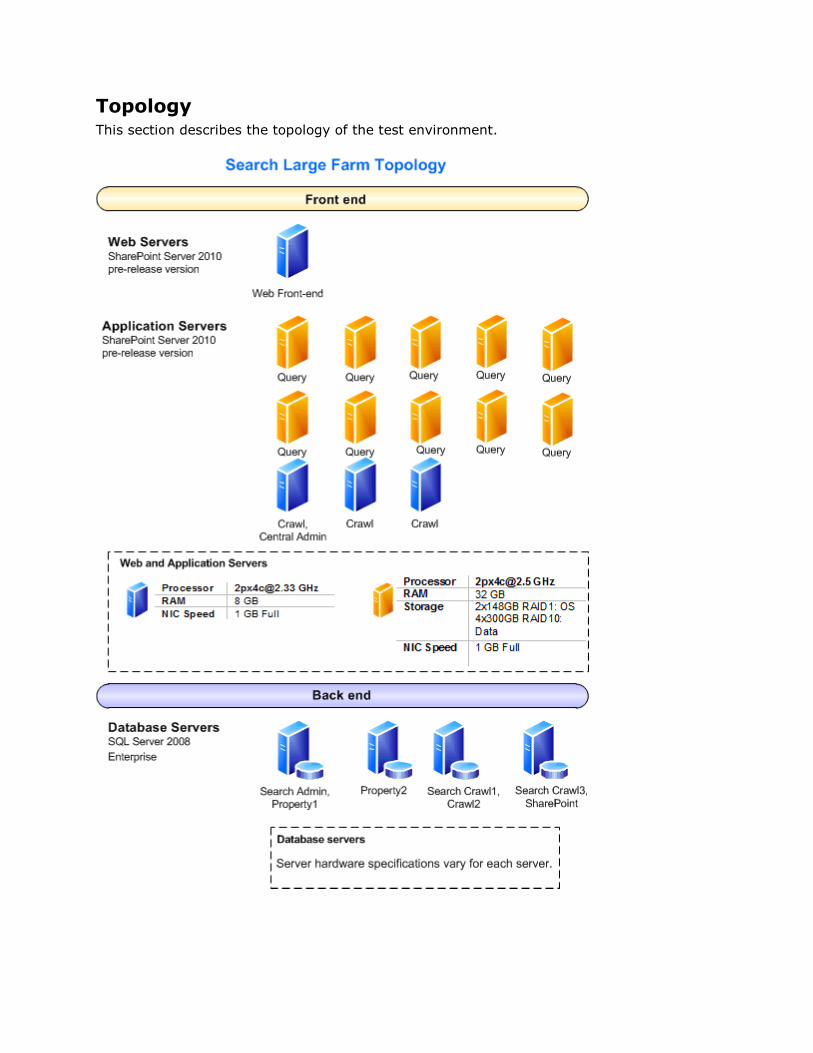
Topology This section describes the topology of the test environment.
Hardware This section describes the hardware used for testing.
Note
Because the farm is running pre-release versions of SharePoint Server
2010, and the team wanted to avoid potential problems, the hardware
used for the servers has more capacity than is required under more normal
circumstances.
Web servers
Web Server Front-end Web server (1)
Processor(s) [email protected] GHz
RAM 8 GB
Operating
System
Windows Server 2008 R2, 64-bit
Storage 2x148GB 15K SAS: RAID1: OS
Number of NICs 2
NIC Speed 1 gigabit
Authentication NTLM
Load balancer
type
none
Software version SharePoint Server 2010 (pre-
release version)
Services running
locally
All Services
Application servers
There are thirteen application servers in the farm; ten servers are used for serving queries and
three servers are used for crawling.
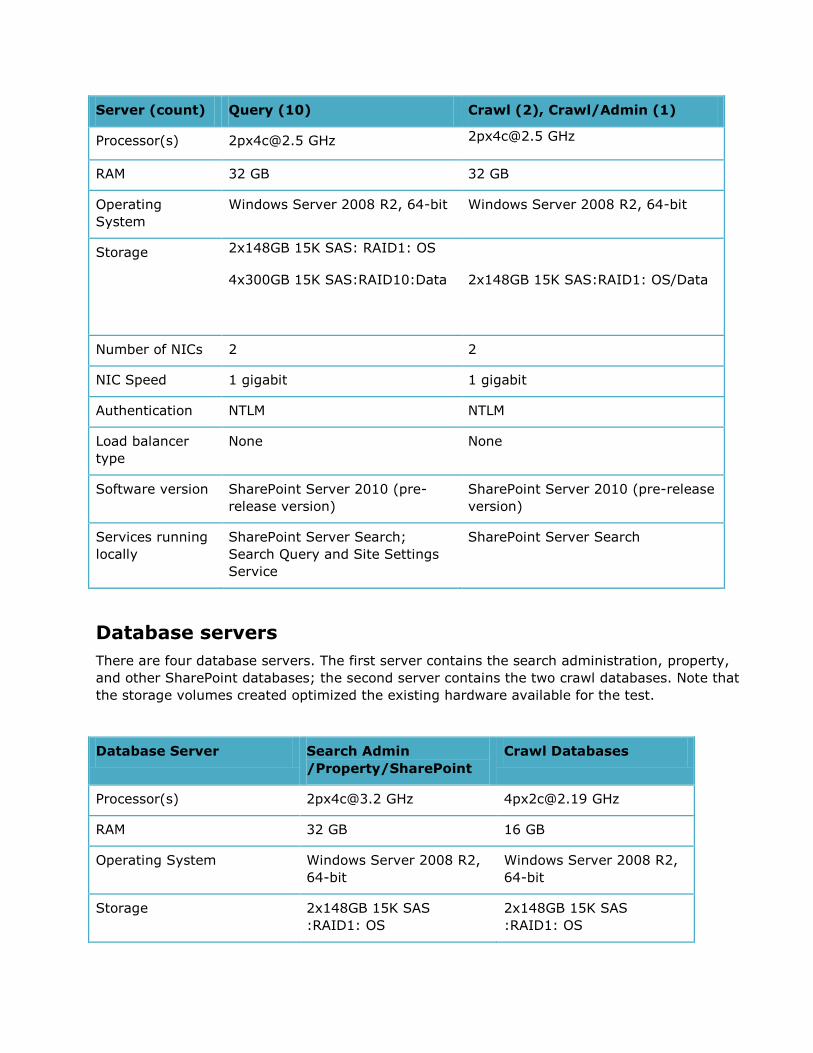
Server (count) Query (10) Crawl (2), Crawl/Admin (1)
Processor(s) [email protected] GHz [email protected] GHz
RAM 32 GB 32 GB
Operating
System
Windows Server 2008 R2, 64-bit Windows Server 2008 R2, 64-bit
Storage 2x148GB 15K SAS: RAID1: OS
4x300GB 15K SAS:RAID10:Data
2x148GB 15K SAS:RAID1: OS/Data
Number of NICs 2 2
NIC Speed 1 gigabit 1 gigabit
Authentication NTLM NTLM
Load balancer
type
None None
Software version SharePoint Server 2010 (pre-
release version)
SharePoint Server 2010 (pre-release
version)
Services running
locally
SharePoint Server Search;
Search Query and Site Settings
Service
SharePoint Server Search
Database servers
There are four database servers. The first server contains the search administration, property,
and other SharePoint databases; the second server contains the two crawl databases. Note that
the storage volumes created optimized the existing hardware available for the test.
Database Server Search Admin
/Property/SharePoint
Crawl Databases
Processor(s) [email protected] GHz [email protected] GHz
RAM 32 GB 16 GB
Operating System Windows Server 2008 R2,
64-bit
Windows Server 2008 R2,
64-bit
Storage 2x148GB 15K SAS
:RAID1: OS
2x148GB 15K SAS
:RAID1: OS
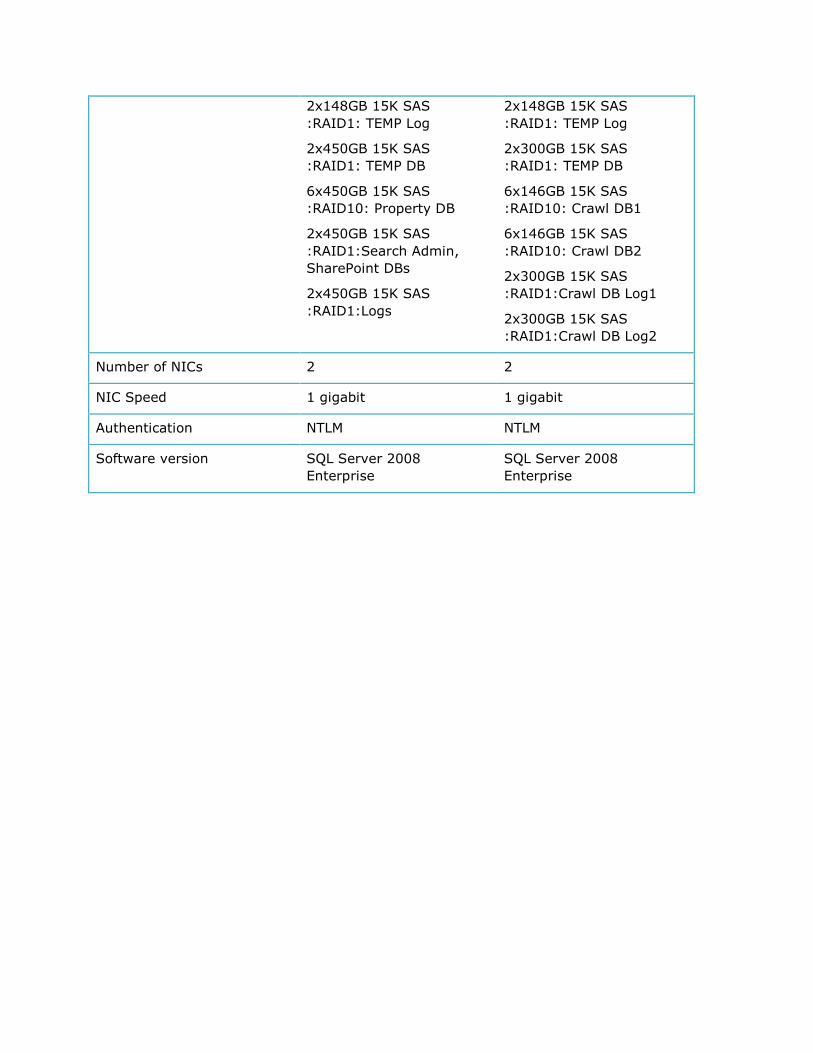
2x148GB 15K SAS
:RAID1: TEMP Log
2x450GB 15K SAS
:RAID1: TEMP DB
6x450GB 15K SAS
:RAID10: Property DB
2x450GB 15K SAS
:RAID1:Search Admin,
SharePoint DBs
2x450GB 15K SAS
:RAID1:Logs
2x148GB 15K SAS
:RAID1: TEMP Log
2x300GB 15K SAS
:RAID1: TEMP DB
6x146GB 15K SAS
:RAID10: Crawl DB1
6x146GB 15K SAS
:RAID10: Crawl DB2
2x300GB 15K SAS
:RAID1:Crawl DB Log1
2x300GB 15K SAS
:RAID1:Crawl DB Log2
Number of NICs 2 2
NIC Speed 1 gigabit 1 gigabit
Authentication NTLM NTLM
Software version SQL Server 2008
Enterprise
SQL Server 2008
Enterprise
Workload This section describes the workload used for data generation, including the number and class of
users, and farm usage characteristics.
(No data yet.)
Dataset This section describes the test farm dataset, including database contents and sizes, Search
indexes, and external data sources.
(No data yet.)

Health and performance data This section provides health and performance data specific to the test environment.
(No data yet.)

Test data This section provides test data that shows how the farm performed under load.
Recommendations and troubleshooting This section provides recommendations for how to determine the hardware, topology, and
configuration you need to deploy environments that are similar to these scenarios, and how to
optimize your environment for appropriate capacity and performance characteristics.
Recommendations This section describes specific actions you can take to optimize your environment for appropriate
capacity and performance characteristics.
Hardware recommendations For specific information about overall minimum and recommended system requirements, see
Determine hardware and software requirements. Note that requirements for servers used for
search supersede those overall system requirements. Follow the recommended guidelines
below for RAM, processor, and IOPS, in order to meet performance goals.
Search sizing This section explains the search system, including sizing requirements and guidelines, per
component.
SharePoint Server 2010 can be deployed and configured in a wide variety of ways. As a result,
there is no simple way to estimate how many users or items can be supported by a given
number of servers. Therefore, make sure that you conduct testing in your own environment
before you deploy SharePoint Server 2010 in a production environment.
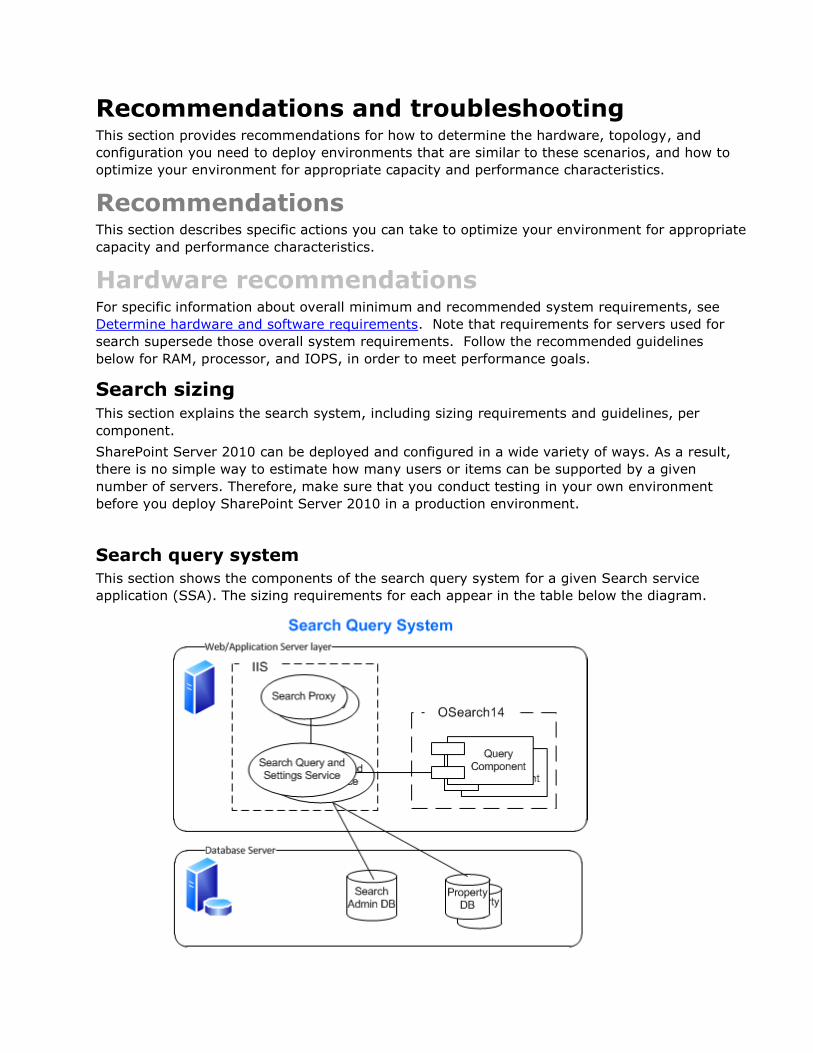
Search query system
This section shows the components of the search query system for a given Search service
application (SSA). The sizing requirements for each appear in the table below the diagram.
Object descriptions
This section defines the search query system objects in the above diagram:
Search proxy This is the SSA proxy that installs on any farm that consumes search
from this SSA. It runs in the context of the Web applications that are associated with the
SSA proxy.
Search Query and Site Settings Service This is also known as the query processor
(QP). Receiving the query from an SSA proxy connection, a QP:
o Sends the query to one active query component for each partition (and/or to the
property database, depending on the query)
o Retrieves Best Bets and removes duplicates to get the results set
o Security trims the results based on security descriptors in the search
administration database
o Retrieves the final results set’s metadata from the property database,
o Sends the query results back to the proxy
Index partition This is a logical group of query components, representing a subset of
the full-text index. The sum of index partitions comprises the full-text index; however,
note that query components contain the actual subset of the index. An index partition is
associated with one property database.
Search query component A query component contains all or part of the full-text
index. When queried by a QP, the query component determines the best results from its
index, and returns those items. A query component can be created as:
o “Active,” which means that it will respond to queries by default. Adding multiple
active query components for the same index partition will increase throughput.
o “Failover,” which means that it will only respond to queries if all “active”
components for the same index partition have failed.
Search administration database Created at the same time as the SSA, the search
administration database contains the SSA-wide data used for queries like Best Bets and
security descriptors, as well as application settings used for administration.
Property database A property database contains the metadata (title, author, related
fields) for the items in the index. The property database is used for property-based
queries as well as retrieving metadata needed for display of the final results. If multiple
index partitions exist, the index partitions can be mapped to different property
databases.
Scaling details
Object Scale Considerations RAM IOPS (read/write)
Search proxy
This scales with the front-end
Web servers on which it is
associated.
N/A N/A
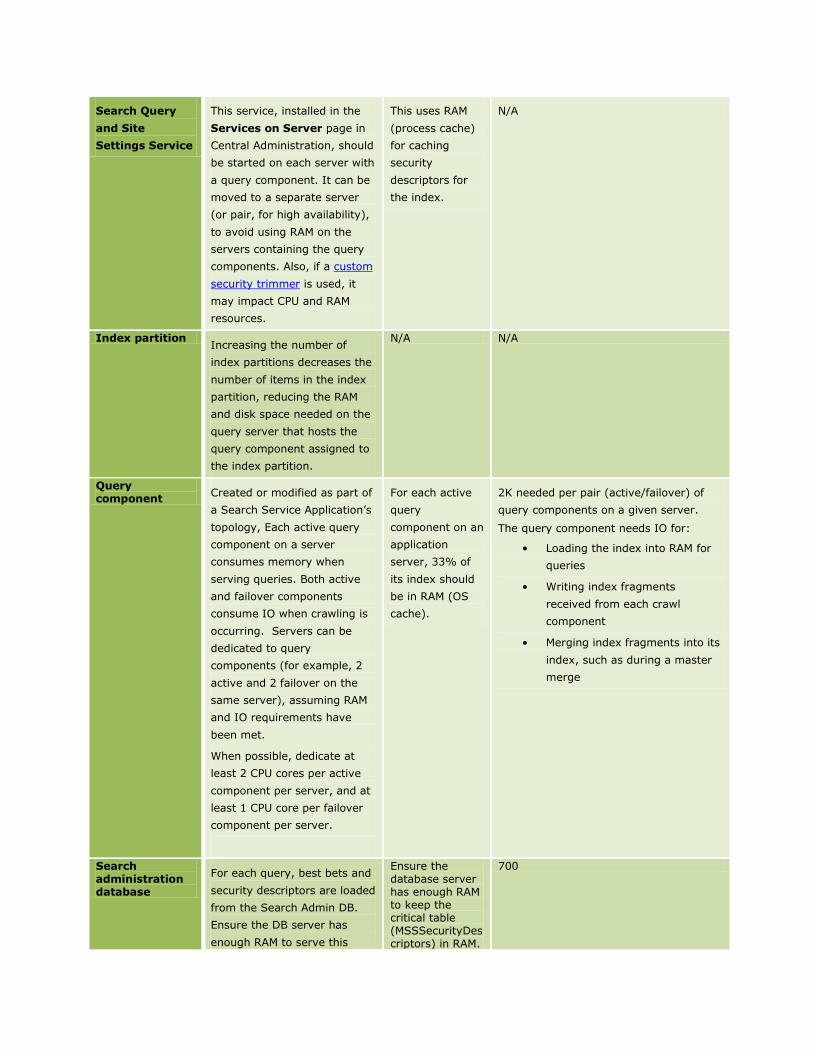
Search Query
and Site
Settings Service
This service, installed in the
Services on Server page in
Central Administration, should
be started on each server with
a query component. It can be
moved to a separate server
(or pair, for high availability),
to avoid using RAM on the
servers containing the query
components. Also, if a custom
security trimmer is used, it
may impact CPU and RAM
resources.
This uses RAM
(process cache)
for caching
security
descriptors for
the index.
N/A
Index partition Increasing the number of
index partitions decreases the
number of items in the index
partition, reducing the RAM
and disk space needed on the
query server that hosts the
query component assigned to
the index partition.
N/A N/A
Query component
Created or modified as part of
a Search Service Application’s
topology, Each active query
component on a server
consumes memory when
serving queries. Both active
and failover components
consume IO when crawling is
occurring. Servers can be
dedicated to query
components (for example, 2
active and 2 failover on the
same server), assuming RAM
and IO requirements have
been met.
When possible, dedicate at
least 2 CPU cores per active
component per server, and at
least 1 CPU core per failover
component per server.
For each active
query
component on an
application
server, 33% of
its index should
be in RAM (OS
cache).
2K needed per pair (active/failover) of
query components on a given server.
The query component needs IO for:
• Loading the index into RAM for
queries
• Writing index fragments
received from each crawl
component
• Merging index fragments into its
index, such as during a master
merge
Search administration database
For each query, best bets and
security descriptors are loaded
from the Search Admin DB.
Ensure the DB server has
enough RAM to serve this
Ensure the database server has enough RAM to keep the critical table (MSSSecurityDescriptors) in RAM.
700
from cache. When possible,
avoid placing this on a server
with a Crawl DB, as the crawl
DB tends to reset the cache of
its DB server.
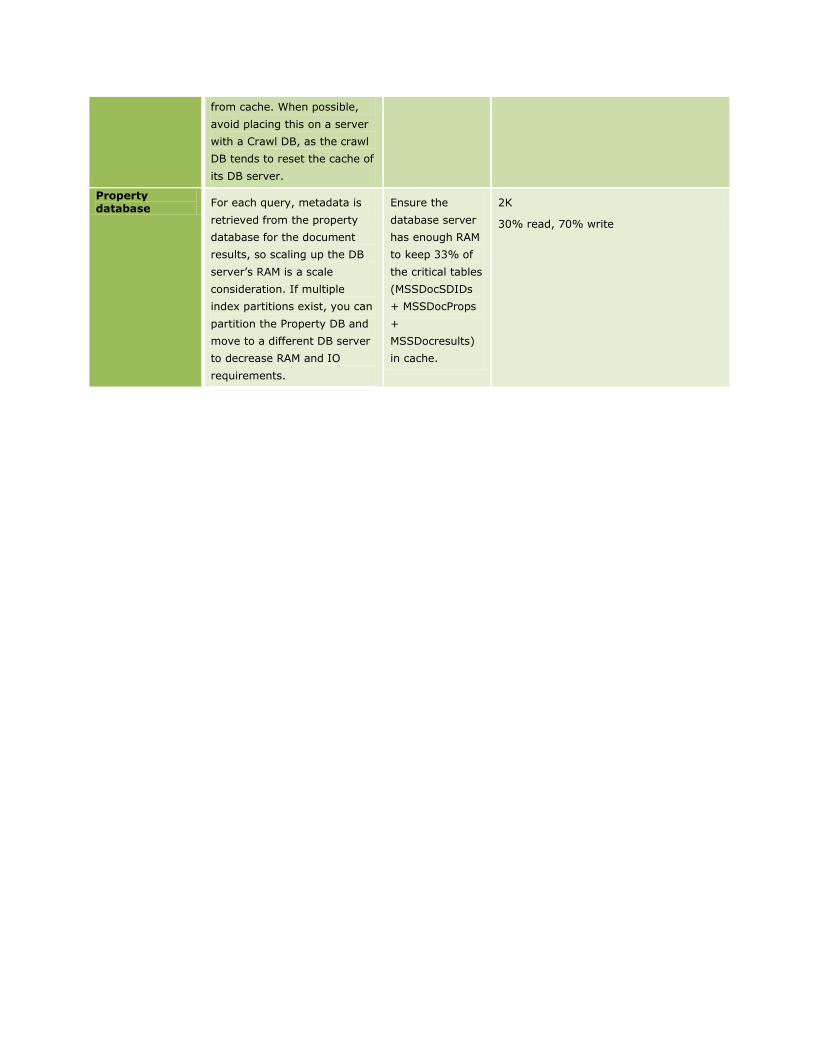
Property database
For each query, metadata is
retrieved from the property
database for the document
results, so scaling up the DB
server’s RAM is a scale
consideration. If multiple
index partitions exist, you can
partition the Property DB and
move to a different DB server
to decrease RAM and IO
requirements.
Ensure the
database server
has enough RAM
to keep 33% of
the critical tables
(MSSDocSDIDs
+ MSSDocProps
+
MSSDocresults)
in cache.
2K
30% read, 70% write
Search crawl system
This section shows the components of the search crawl system. The sizing requirements of each
appear in the table below the diagram.
Object descriptions
This section defines the search crawl system objects in the above diagram:
Administration component An administration component is used when starting a
crawl, as well as when performing an administration task on the crawl system.
Crawl component A crawl component processes crawls of content sources, propagates
the resulting index fragment files to query components, and adds information about the
location and crawl schedule of content sources to its associated crawl database.
Search administration database Created at the same time as the SSA, the search
administration database stores the security descriptors discovered during the crawl, as
well as application settings used for administration.
Crawl database A crawl database contains data related to the location of content
sources, crawl schedules, and other information specific to crawl operations. They can be
dedicated to specific hosts by creating host distribution rules. A crawl database only
stores data; the crawl component(s) associated with the given crawl database do the
crawling.
Search query system
Scaling details
Object Scale Considerations RAM IOPS (Optionally, %
read/write)
Administration The single administration Minimal Minimal
component component is not scalable. By
default, it is placed on a
server hosting a crawl
component (and Central
Administration, on smaller
farms).
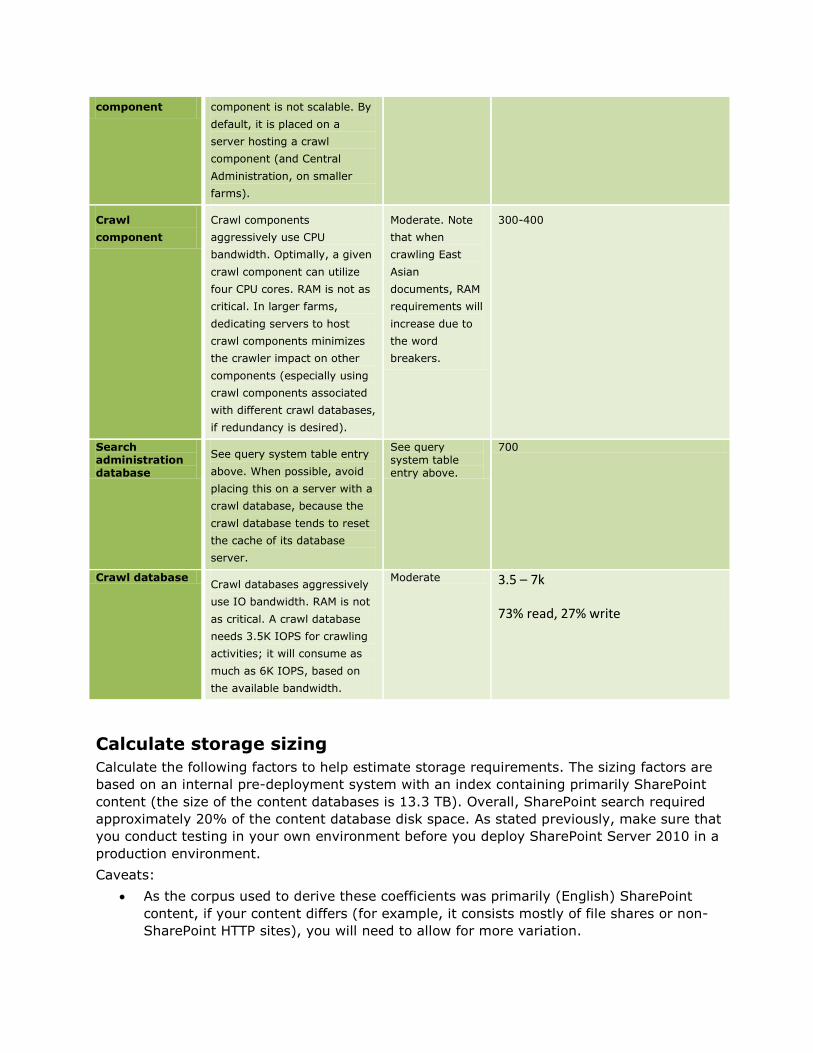
Crawl
component
Crawl components
aggressively use CPU
bandwidth. Optimally, a given
crawl component can utilize
four CPU cores. RAM is not as
critical. In larger farms,
dedicating servers to host
crawl components minimizes
the crawler impact on other
components (especially using
crawl components associated
with different crawl databases,
if redundancy is desired).
Moderate. Note
that when
crawling East
Asian
documents, RAM
requirements will
increase due to
the word
breakers.
300-400
Search administration database
See query system table entry
above. When possible, avoid
placing this on a server with a
crawl database, because the
crawl database tends to reset
the cache of its database
server.
See query system table entry above.
700
Crawl database Crawl databases aggressively
use IO bandwidth. RAM is not
as critical. A crawl database
needs 3.5K IOPS for crawling
activities; it will consume as
much as 6K IOPS, based on
the available bandwidth.
Moderate 3.5 – 7k
73% read, 27% write
Calculate storage sizing
Calculate the following factors to help estimate storage requirements. The sizing factors are
based on an internal pre-deployment system with an index containing primarily SharePoint
content (the size of the content databases is 13.3 TB). Overall, SharePoint search required
approximately 20% of the content database disk space. As stated previously, make sure that
you conduct testing in your own environment before you deploy SharePoint Server 2010 in a
production environment.
Caveats:
As the corpus used to derive these coefficients was primarily (English) SharePoint
content, if your content differs (for example, it consists mostly of file shares or non-
SharePoint HTTP sites), you will need to allow for more variation.
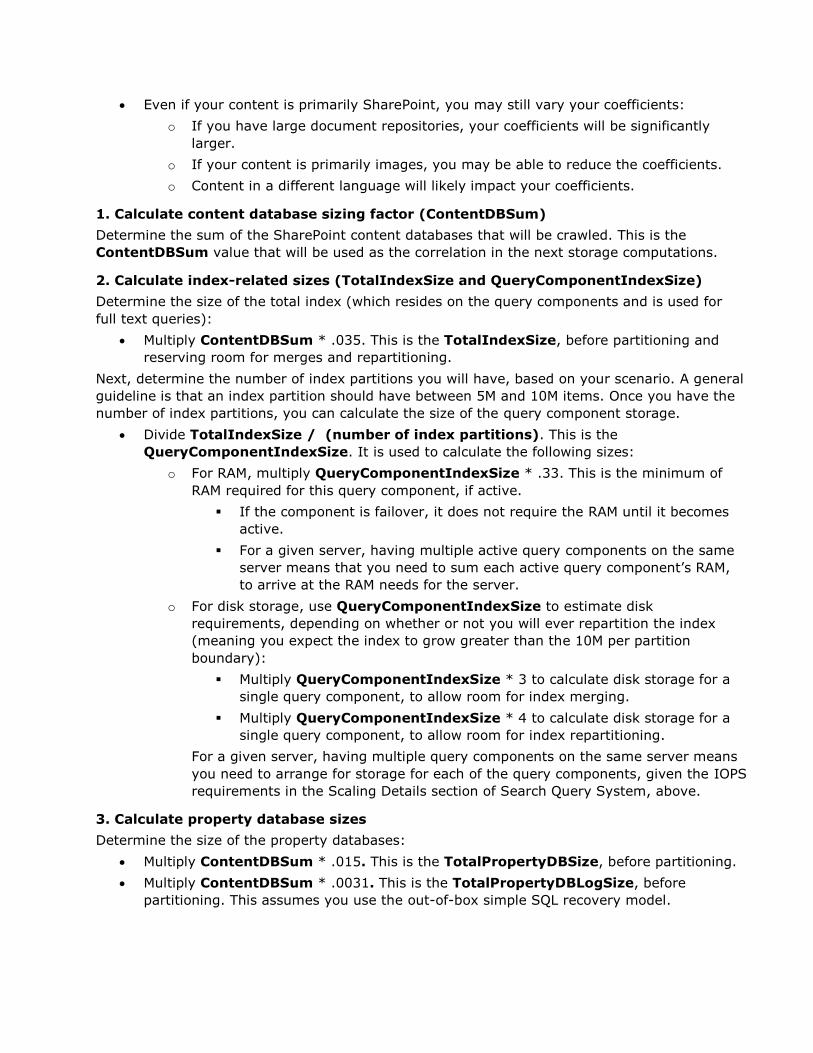
Even if your content is primarily SharePoint, you may still vary your coefficients:
o If you have large document repositories, your coefficients will be significantly
larger.
o If your content is primarily images, you may be able to reduce the coefficients.
o Content in a different language will likely impact your coefficients.
1. Calculate content database sizing factor (ContentDBSum)
Determine the sum of the SharePoint content databases that will be crawled. This is the
ContentDBSum value that will be used as the correlation in the next storage computations.
2. Calculate index-related sizes (TotalIndexSize and QueryComponentIndexSize)
Determine the size of the total index (which resides on the query components and is used for
full text queries):
Multiply ContentDBSum * .035. This is the TotalIndexSize, before partitioning and
reserving room for merges and repartitioning.
Next, determine the number of index partitions you will have, based on your scenario. A general
guideline is that an index partition should have between 5M and 10M items. Once you have the
number of index partitions, you can calculate the size of the query component storage.
Divide TotalIndexSize / (number of index partitions). This is the
QueryComponentIndexSize. It is used to calculate the following sizes:
o For RAM, multiply QueryComponentIndexSize * .33. This is the minimum of
RAM required for this query component, if active.
If the component is failover, it does not require the RAM until it becomes
active.
For a given server, having multiple active query components on the same
server means that you need to sum each active query component’s RAM,
to arrive at the RAM needs for the server.
o For disk storage, use QueryComponentIndexSize to estimate disk
requirements, depending on whether or not you will ever repartition the index
(meaning you expect the index to grow greater than the 10M per partition
boundary):
Multiply QueryComponentIndexSize * 3 to calculate disk storage for a
single query component, to allow room for index merging.
Multiply QueryComponentIndexSize * 4 to calculate disk storage for a
single query component, to allow room for index repartitioning.
For a given server, having multiple query components on the same server means
you need to arrange for storage for each of the query components, given the IOPS
requirements in the Scaling Details section of Search Query System, above.
3. Calculate property database sizes
Determine the size of the property databases:
Multiply ContentDBSum * .015. This is the TotalPropertyDBSize, before partitioning.
Multiply ContentDBSum * .0031. This is the TotalPropertyDBLogSize, before
partitioning. This assumes you use the out-of-box simple SQL recovery model.
Multiply ContentDBSum * .00034. This is the property database TempDBSize. Because
we recommend having 33% of the key tables in the property database in RAM, use of the
temporary database is not heavy.
Next, determine the number of property databases you will have, based on your scenario. A
general guideline is that a property database should contain up to 50M items, assuming there
are no Query Performance Issues, and you have a limited number of managed properties (the
Out-Of-Box configuration).
o Divide TotalPropertyDBSize / (number of property databases). This is the
PropertyDatabaseSize
o Divide TotalPropertyDBLogSize / (number of property databases). This is the
PropertyDatabaseLogSize
o For RAM, multiply PropertyDatabaseSize * .33. This is the minimum amount of
RAM recommended for this property database.
For a given database server, having multiple property databases on the same server
means you need to arrange for storage and RAM for each of the property databases,
given the IOPS and RAM requirements in the Scaling Details section of Search Query
System Scaling, above.
4. Calculate crawl database sizes
Next, determine the size needed for the crawl database(s):
Multiply ContentDBSum * .046. This is the TotalCrawlDBSize, before partitioning.
Multiply ContentDBSum *. 011. This is the TotalCrawlDBLogSize, before partitioning.
This assumes you use the out-of-box simple SQL recovery model.
Multiply ContentDBSum * .0011. This is the crawl database TempDBSize. As the
search crawl system does impact the performance of the temporary database, we do not
recommend locating other databases on servers hosting the crawl database(s) that would
be impacted by this usage.
Next, determine the number of crawl databases you will have, based on your scenario. A general
guideline is that a crawl database should contain up to 25M items, assuming there are no Crawl
Performance Issues.
o Divide TotalCrawlDBSize / (number of crawl databases). This is the
CrawlDatabaseSize.
o Divide TotalCrawlDBLogSize / (number of crawl databases). This is the
CrawlDatabaseLogSize.
For a given database server, having multiple crawl databases on the same server means
you need to arrange for storage for each of the crawl databases, given the IOPS
requirements in the Scaling Details section of Search Crawl System, above. For RAM, we
recommend at least 16 GB on database servers dedicated to crawl databases.
5. Calculate search administration database size
Determine the size of the search administration database (assuming Windows Classic Auth):
Multiply number of items in the index (in millions) * .3 . This is the
SearchAdminDBSize.
For RAM, multiply SearchAdminDBSize * .33. This is the minimum amount of RAM
recommended for this search administration database.
For a given database server, having multiple databases on the same server means you need to
arrange for storage and RAM for each of the databases, given the IOPS and RAM requirements
in the Scaling Details section of Search Query System Scaling, above.
Optional: Calculate backup size
To determine the disk space needed for backing up one search service application:
Add TotalCrawlDBSize + TotalPropertyDBSize + TotalIndexSize +
SearchAdminDBSize to arrive at the basic backup size.
This basic backup size is a starting point. It will also be affected by:
Additional index size included in the TotalIndexSize for any crawling that has
occurred since the last master merge.
Growth over time due to additional items, queries, and security descriptors.
In addition, you will likely want to retain multiple backups from different times, as well as
reserving space for the next backup.
Sizing exercise
Using the sizing factors above, here is a sizing exercise for a 100M item farm that will serve
queries over primarily SharePoint content. Using the “large farm” scenario, you would assume:
10 logical query partitions are needed to accommodate the 100M items.
To serve queries, you need 10 “active” query components, one per query partition.
Query redundancy is important, so you have 10 “failover” query components, one per
query partition (located on a different server than the “active” component).
To determine storage and RAM needs, here are the steps you would follow:
1. You have a SharePoint content farm with multiple content databases. When you sum the
content databases you want to crawl, you get 20 TB.
2. Using the index coefficient above, you multiply 20 TB * .035 (Index Coefficient) =
716.8 GB. This is the TotalIndexSize. If you had only one partition, this would be the
size of the index, at rest.
3. Divide TotalIndexSize by the number of partitions: 716.8 GB /10 = 71.68 GB. This is
the index size required per query component (QueryComponentIndexSize), with one
query partition. The size is the same for either “active” or “failover” query components.
4. Multiply TotalIndexSize by 4 if you plan to repartition; otherwise, multiply by 3 for
supporting master merges. 71.68 GB * 4 = 286.72 GB. You should have this many GB
available on your query server’s disk to support one query component. If you have two
query components on the same application server (as in the active/failover topology we
recommended in the large farm scenario), you would have a disk drive layout as follows:
a. OS Drive (standard size).
b. Extra storage system 1: Query Component1_Share (size= at least 300 GB),
used for active query component from Query partition 1.
c. Extra storage system 2: Query Component2_Share (size = at least 300 GB),
used for failover (mirror) query component from Query partition 2.
Note: On this application server, with one “active” query component, you would want a
minimum of 71.68 GB * .33 = 23.65 GB of RAM + 3GB RAM for the OS, (we use 32
GB), in order to cache most of the queries.
Software limits The following table gives software boundaries imposed to support an acceptable search
experience:
Object Limit Additional Notes
SharePoint
Search service
applications
(SSA)
Recommended maximum of
20 per farm. Absolute
maximum of 256 total service
applications.
You can deploy multiple SharePoint SSAs on the same farm, as
you can assign search components and databases to separate
servers.
Indexed
documents
Overall recommended
maximum of 10 million items
per index partition and 100
million items per SSA.
SharePoint search supports index partitions, which each contain a
subset of the entire search index. The recommended maximum is
10 million items for a given partition. The overall recommended
maximum number of items, including people, list items,
documents, and Web pages is 100 million.
Index partitions Recommended maximum of
20 per SSA
This index partition is a logical subset of the SSA's index. The
recommended limit is 20; increasing the number of index
partitions decreases the number of items in the index partition,
reducing the RAM and disk space needed on the query server
hosting the query component assigned to the index partition.
However, this may affect relevance, because the number of items
in the index partition is decreased. The hard limit of index
partitions is 128.
Property database
Recommended limit is 10 per
SSA
The property database stores the metadata for items in each
associated index partition associated with it. An index partition
can only be associated with one property store. The
recommended limit is 10 per SSA, with a hard limit of 255 (same
as index partitions).
Crawl databases The limit is 32 crawl
databases per application
The crawl database stores the crawl data (including time and
status) about all items that were crawled. The recommended limit
is 25 million items per crawl database, or four total databases for
a SharePoint SSA.
Crawl components
Recommended limit per
application is 16 total crawl
components, with two per
crawl database, and two per
server, assuming the server
has at least eight processors
(cores).
The total number of crawl components per server must be less
than 128/(total query components) to minimize propagation I/O
degradation. Exceeding the recommended limit may not increase
crawl performance; in fact, crawl performance may decrease,
based on available resources on crawl server, database, and
content host.
Query components
Recommended limit per
application is 128, with
64/(total crawl components)
per server.
The total number of query components are limited by the crawl
components' ability to copy files. The maximum number of query
components per server is limited by the query components' ability
to absorb files propagated from crawl components.
Concurrent crawls
Recommended limit is 20 per
SSA
This is the number of crawls underway at the same time. Crawls
are extremely expensive search tasks that can impact database
as well as other application load; exceeding 20 simultaneous
crawls may cause the overall crawl rate to degrade.
Content sources Recommended limit of 50
content sources per SSA.
The recommended limit can be exceeded up to the hard limit of
500 per SSA; however, fewer start addresses should be used, and
the concurrent crawl limit needs to be followed.
Start addresses Recommended limit of 100
start addresses per Content
Source.
The recommended limit can be exceeded up to the hard limit of
500 per content source; however, fewer content sources should
be used. A better approach when you have many start address is
to put them as links on an html page, and have the HTTP crawler
crawl the page, following the links.
Crawl rules Recommended limit of 100
per SSA
The recommendation can be exceeded; however, display of the
crawl rules in search administration is degraded.
Crawl logs Recommended limit of 100
million per application
This is the number of individual log entries in the crawl log. It will
follow the "indexed documents" limit.
Metadata properties recognized per item
The hard limit is 10000. This is the number of metadata properties that, when an item is
crawled, can be determined (and potentially mapped and used for
queries).
Crawled properties
500,000 per SSA These are properties that are discovered during a crawl.
Managed properties
100,000 per SSA These are properties used by the search system in queries.
Crawled properties are mapped to managed properties. We
recommend a maximum of 100 mappings per managed property.
Exceeding this limit may degrade crawl speed and query
performance.
Scopes Recommended limit of 200
per Site
This is a recommended limit per site. Exceeding this limit may
degrade the crawl efficiency as well as impact end-user browser
latency if the scopes are added to the display group. Also, display
of the scopes in search administration degrades as the number of
scopes increases past the recommended limit.
Display groups 25 per site These are used for a grouped display of scopes through the user
interface. Exceeding this limit will start degrading the search
administration scope experience.
Scope rules Recommended limit is 100
scope rules per scope, and
600 total per search
application
Exceeding this limit will degrade crawl freshness, and delay
potential results from scoped queries.
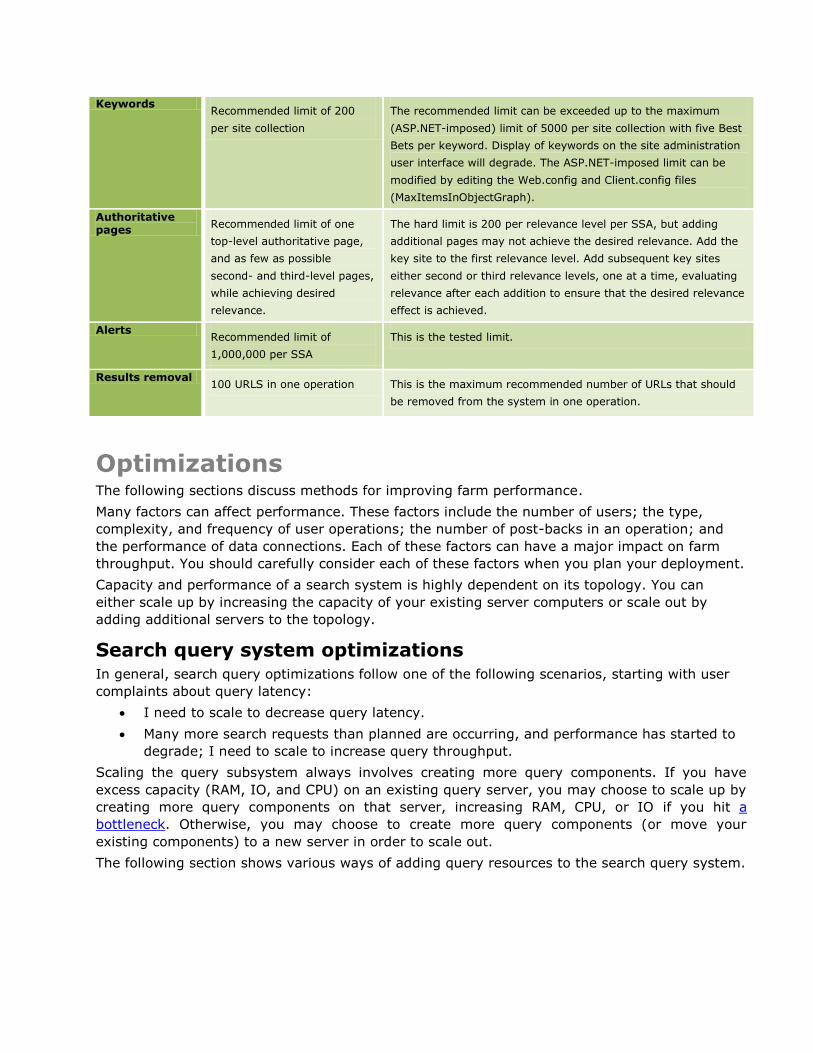
Keywords Recommended limit of 200
per site collection
The recommended limit can be exceeded up to the maximum
(ASP.NET-imposed) limit of 5000 per site collection with five Best
Bets per keyword. Display of keywords on the site administration
user interface will degrade. The ASP.NET-imposed limit can be
modified by editing the Web.config and Client.config files
(MaxItemsInObjectGraph).
Authoritative pages
Recommended limit of one
top-level authoritative page,
and as few as possible
second- and third-level pages,
while achieving desired
relevance.
The hard limit is 200 per relevance level per SSA, but adding
additional pages may not achieve the desired relevance. Add the
key site to the first relevance level. Add subsequent key sites
either second or third relevance levels, one at a time, evaluating
relevance after each addition to ensure that the desired relevance
effect is achieved.
Alerts Recommended limit of
1,000,000 per SSA
This is the tested limit.
Results removal 100 URLS in one operation This is the maximum recommended number of URLs that should
be removed from the system in one operation.
Optimizations The following sections discuss methods for improving farm performance.
Many factors can affect performance. These factors include the number of users; the type,
complexity, and frequency of user operations; the number of post-backs in an operation; and
the performance of data connections. Each of these factors can have a major impact on farm
throughput. You should carefully consider each of these factors when you plan your deployment.
Capacity and performance of a search system is highly dependent on its topology. You can
either scale up by increasing the capacity of your existing server computers or scale out by
adding additional servers to the topology.
Search query system optimizations In general, search query optimizations follow one of the following scenarios, starting with user
complaints about query latency:
I need to scale to decrease query latency.
Many more search requests than planned are occurring, and performance has started to
degrade; I need to scale to increase query throughput.
Scaling the query subsystem always involves creating more query components. If you have
excess capacity (RAM, IO, and CPU) on an existing query server, you may choose to scale up by
creating more query components on that server, increasing RAM, CPU, or IO if you hit a
bottleneck. Otherwise, you may choose to create more query components (or move your
existing components) to a new server in order to scale out.
The following section shows various ways of adding query resources to the search query system.
Scale to reduce query latency
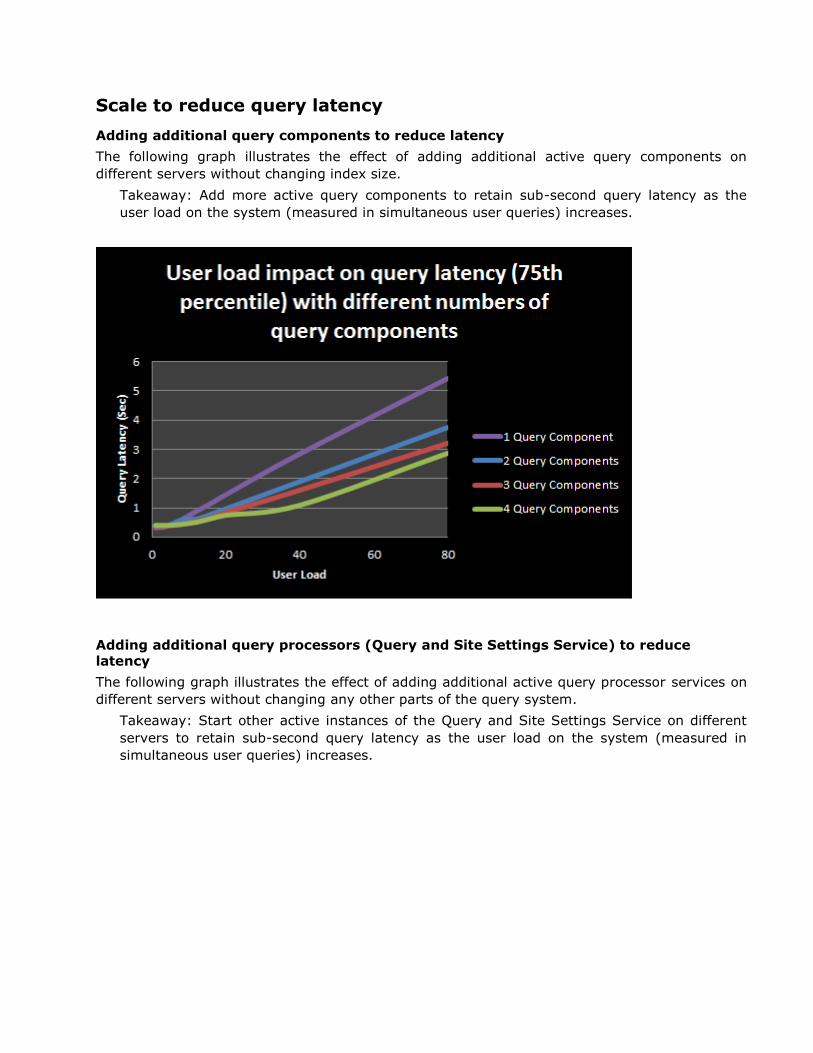
Adding additional query components to reduce latency
The following graph illustrates the effect of adding additional active query components on
different servers without changing index size.
Takeaway: Add more active query components to retain sub-second query latency as the
user load on the system (measured in simultaneous user queries) increases.
Adding additional query processors (Query and Site Settings Service) to reduce latency
The following graph illustrates the effect of adding additional active query processor services on
different servers without changing any other parts of the query system.
Takeaway: Start other active instances of the Query and Site Settings Service on different
servers to retain sub-second query latency as the user load on the system (measured in
simultaneous user queries) increases.
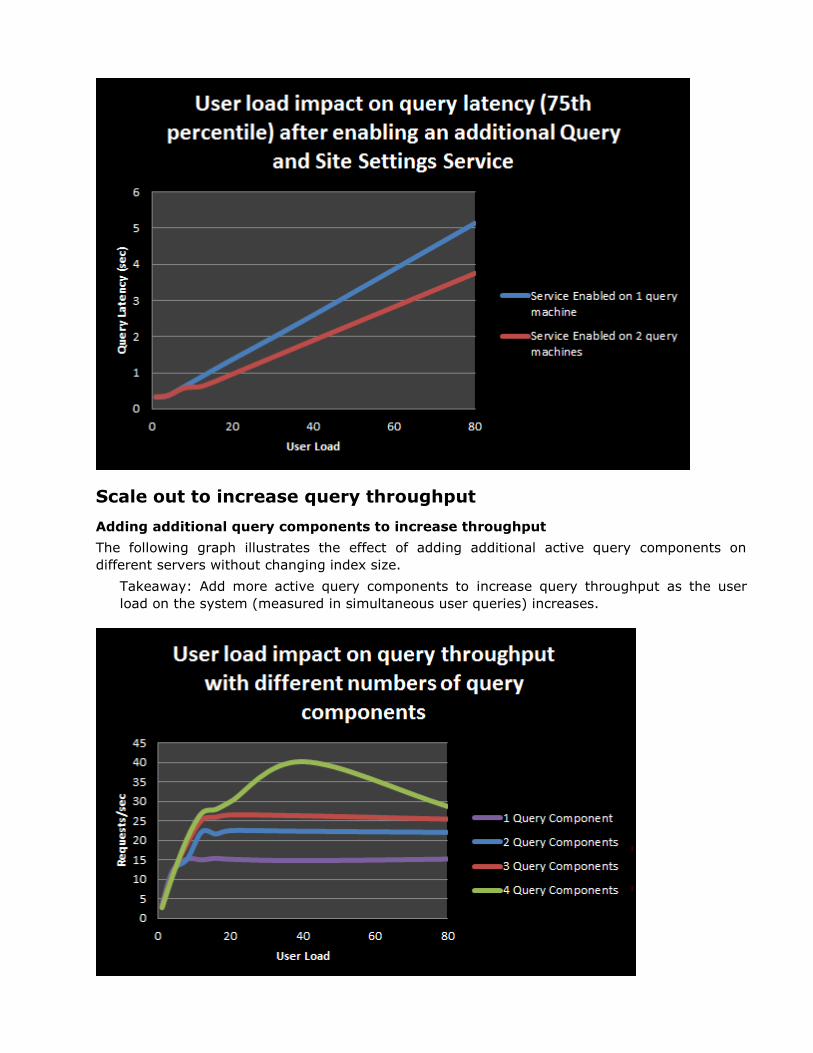
Scale out to increase query throughput
Adding additional query components to increase throughput
The following graph illustrates the effect of adding additional active query components on
different servers without changing index size.
Takeaway: Add more active query components to increase query throughput as the user
load on the system (measured in simultaneous user queries) increases.
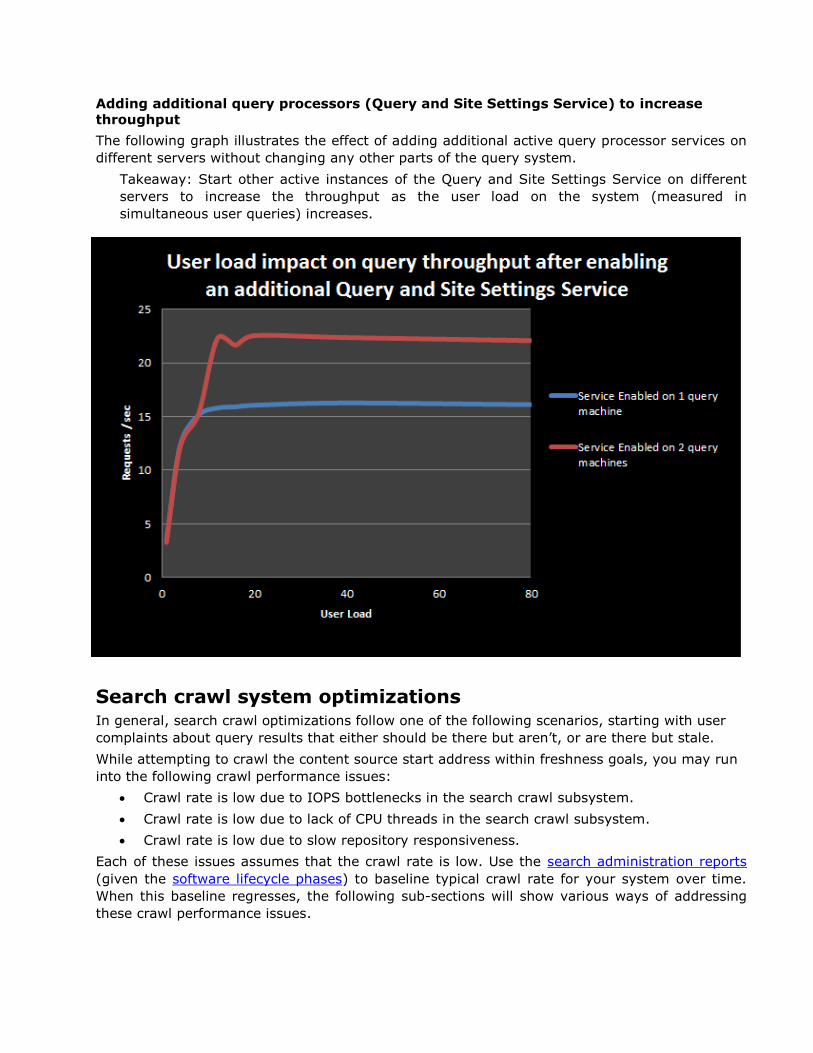
Adding additional query processors (Query and Site Settings Service) to increase throughput
The following graph illustrates the effect of adding additional active query processor services on
different servers without changing any other parts of the query system.
Takeaway: Start other active instances of the Query and Site Settings Service on different
servers to increase the throughput as the user load on the system (measured in
simultaneous user queries) increases.
Search crawl system optimizations In general, search crawl optimizations follow one of the following scenarios, starting with user
complaints about query results that either should be there but aren’t, or are there but stale.
While attempting to crawl the content source start address within freshness goals, you may run
into the following crawl performance issues:
Crawl rate is low due to IOPS bottlenecks in the search crawl subsystem.
Crawl rate is low due to lack of CPU threads in the search crawl subsystem.
Crawl rate is low due to slow repository responsiveness.
Each of these issues assumes that the crawl rate is low. Use the search administration reports
(given the software lifecycle phases) to baseline typical crawl rate for your system over time.
When this baseline regresses, the following sub-sections will show various ways of addressing
these crawl performance issues.
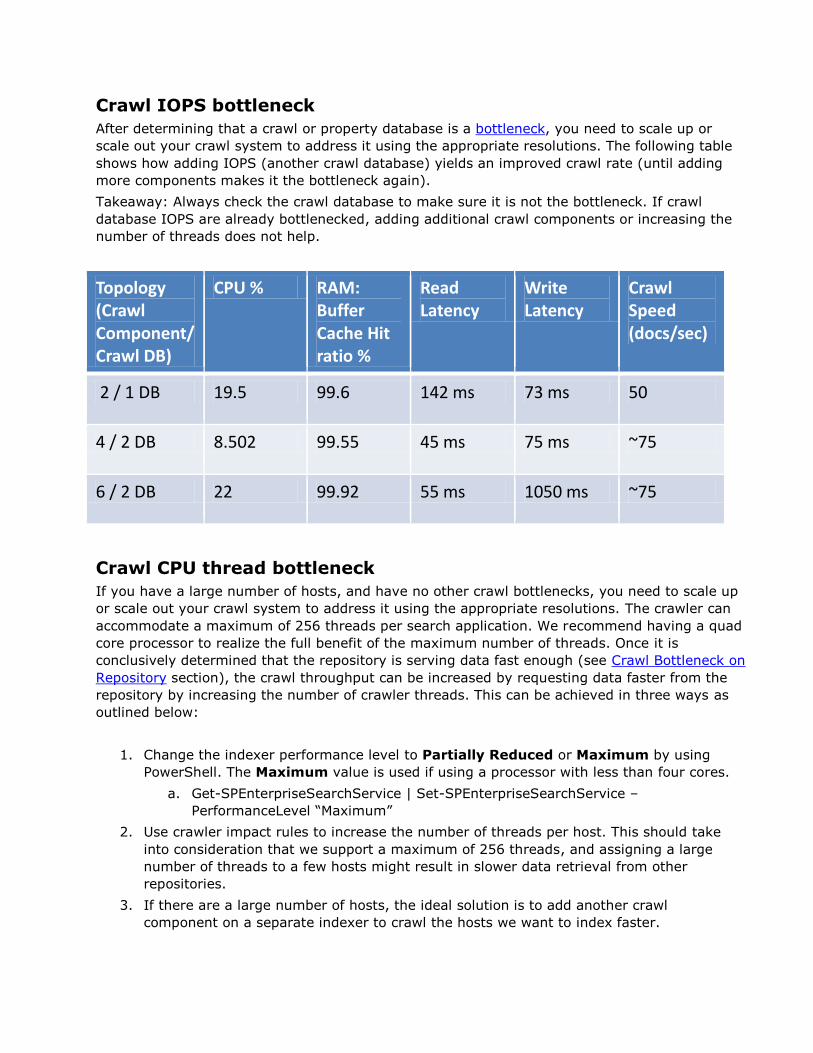
Crawl IOPS bottleneck
After determining that a crawl or property database is a bottleneck, you need to scale up or
scale out your crawl system to address it using the appropriate resolutions. The following table
shows how adding IOPS (another crawl database) yields an improved crawl rate (until adding
more components makes it the bottleneck again).
Takeaway: Always check the crawl database to make sure it is not the bottleneck. If crawl
database IOPS are already bottlenecked, adding additional crawl components or increasing the
number of threads does not help.
Topology (Crawl Component/ Crawl DB)
CPU % RAM: Buffer Cache Hit ratio %
Read Latency
Write Latency
Crawl Speed (docs/sec)
2 / 1 DB 19.5 99.6 142 ms 73 ms 50
4 / 2 DB 8.502 99.55 45 ms 75 ms ~75
6 / 2 DB 22 99.92 55 ms 1050 ms ~75
Crawl CPU thread bottleneck
If you have a large number of hosts, and have no other crawl bottlenecks, you need to scale up
or scale out your crawl system to address it using the appropriate resolutions. The crawler can
accommodate a maximum of 256 threads per search application. We recommend having a quad
core processor to realize the full benefit of the maximum number of threads. Once it is
conclusively determined that the repository is serving data fast enough (see Crawl Bottleneck on
Repository section), the crawl throughput can be increased by requesting data faster from the
repository by increasing the number of crawler threads. This can be achieved in three ways as
outlined below:
1. Change the indexer performance level to Partially Reduced or Maximum by using
PowerShell. The Maximum value is used if using a processor with less than four cores.
a. Get-SPEnterpriseSearchService | Set-SPEnterpriseSearchService –
PerformanceLevel “Maximum”
2. Use crawler impact rules to increase the number of threads per host. This should take
into consideration that we support a maximum of 256 threads, and assigning a large
number of threads to a few hosts might result in slower data retrieval from other
repositories.
3. If there are a large number of hosts, the ideal solution is to add another crawl
component on a separate indexer to crawl the hosts we want to index faster.
Takeaway: The ideal way to seamlessly increase crawl throughput is to add another indexer if
the search subsystem is not bottlenecked on IOPS and the repository is serving content fast.
Crawl bottleneck on repository
At times, when crawling a SharePoint Web application with many nested sites collections or
remote file shares, the search crawler might be bottlenecked on the repository. A repository
bottleneck can be identified if the following two conditions are true:
1. There is a low (<20%) CPU utilization on the indexer boxes.
2. There is a large number of threads (almost all in worst case) waiting on the network.
This is identified by looking at OSS Search Gatherer/Threads Accessing Network
performance counter.
What this situation represents is that the threads are blocked waiting for data from the
repository. In an environment with multiple content sources, it might be useful to identify
the host whose responsiveness is slow by pausing all other crawls and just crawling the
content source having the suspected host as one of its start address.
Once we’ve identified a problematic host, we need to investigate the cause of their slow
response times. For SharePoint content in particular, please refer to the “Capacity Planning
and Sizing for SharePoint Server 2010-based Divisional Portal”.
Takeaway: The crawl throughput can be significantly improved by performance tuning the
crawled data repositories.
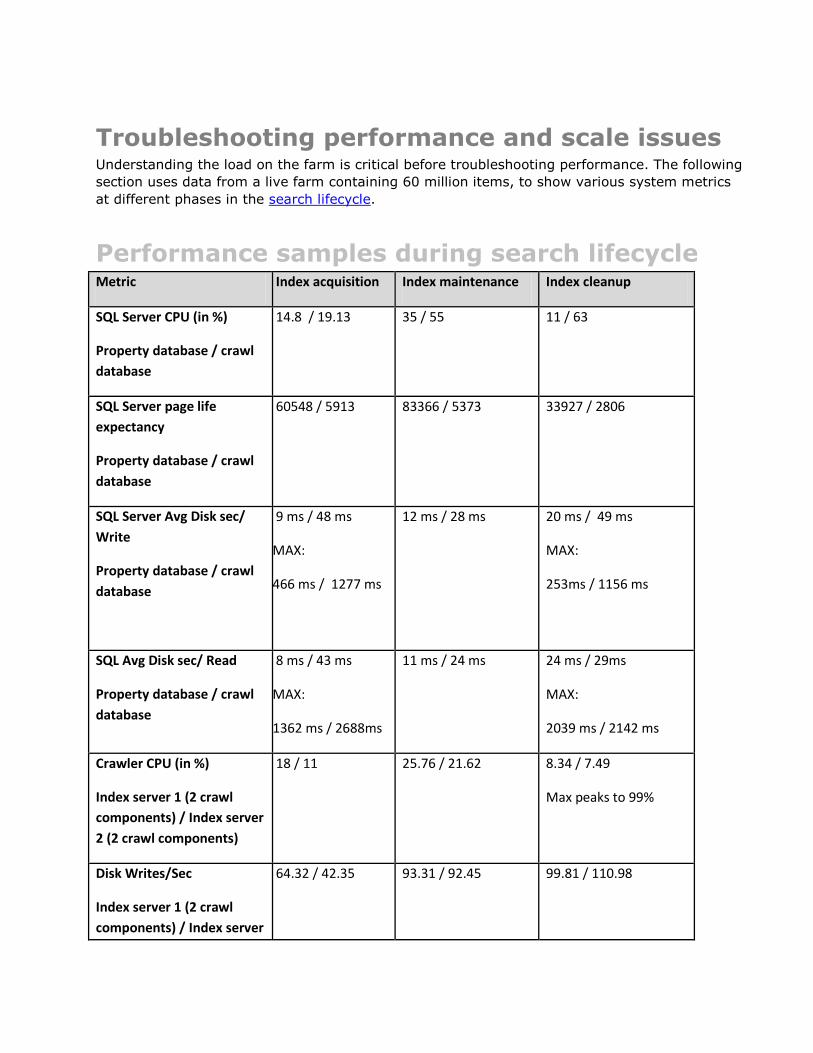
Troubleshooting performance and scale issues Understanding the load on the farm is critical before troubleshooting performance. The following
section uses data from a live farm containing 60 million items, to show various system metrics
at different phases in the search lifecycle.
Performance samples during search lifecycle Metric Index acquisition Index maintenance Index cleanup
SQL Server CPU (in %)
Property database / crawl
database
14.8 / 19.13 35 / 55 11 / 63
SQL Server page life
expectancy
Property database / crawl
database
60548 / 5913 83366 / 5373 33927 / 2806
SQL Server Avg Disk sec/
Write
Property database / crawl
database
9 ms / 48 ms
MAX:
466 ms / 1277 ms
12 ms / 28 ms 20 ms / 49 ms
MAX:
253ms / 1156 ms
SQL Avg Disk sec/ Read
Property database / crawl
database
8 ms / 43 ms
MAX:
1362 ms / 2688ms
11 ms / 24 ms 24 ms / 29ms
MAX:
2039 ms / 2142 ms
Crawler CPU (in %)
Index server 1 (2 crawl
components) / Index server
2 (2 crawl components)
18 / 11 25.76 / 21.62 8.34 / 7.49
Max peaks to 99%
Disk Writes/Sec
Index server 1 (2 crawl
components) / Index server
64.32 / 42.35 93.31 / 92.45 99.81 / 110.98
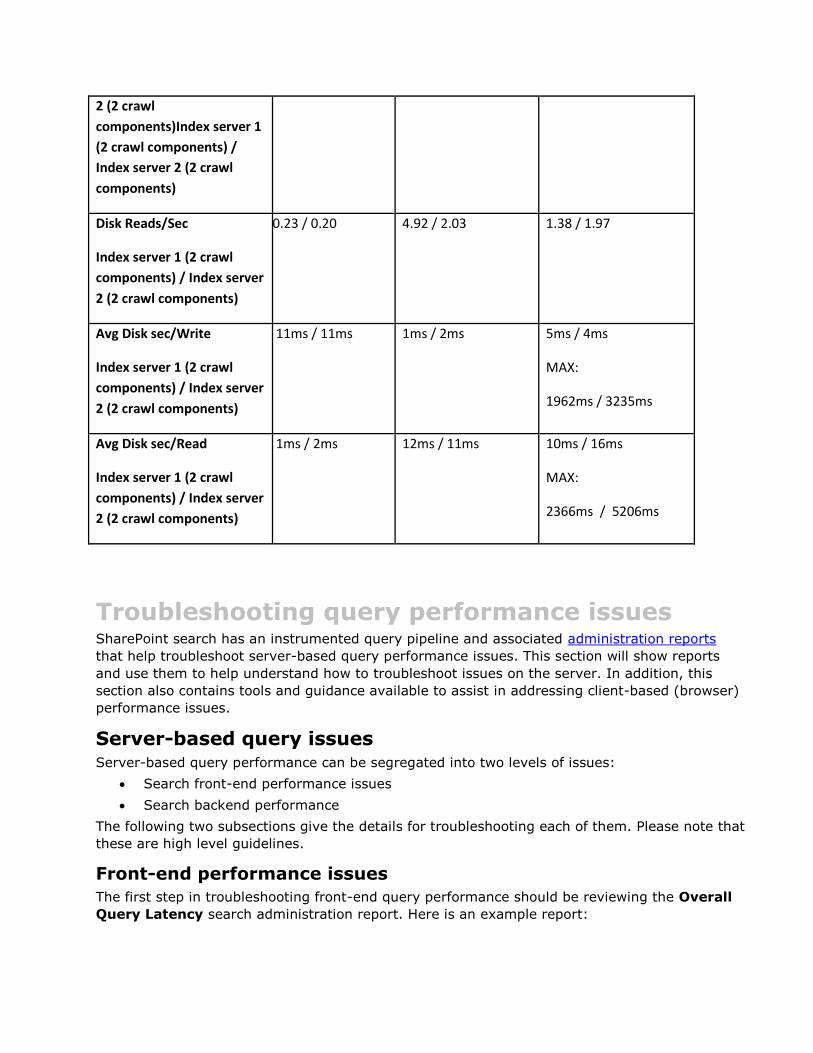
2 (2 crawl
components)Index server 1
(2 crawl components) /
Index server 2 (2 crawl
components)
Disk Reads/Sec
Index server 1 (2 crawl
components) / Index server
2 (2 crawl components)
0.23 / 0.20 4.92 / 2.03 1.38 / 1.97
Avg Disk sec/Write
Index server 1 (2 crawl
components) / Index server
2 (2 crawl components)
11ms / 11ms 1ms / 2ms 5ms / 4ms
MAX:
1962ms / 3235ms
Avg Disk sec/Read
Index server 1 (2 crawl
components) / Index server
2 (2 crawl components)
1ms / 2ms 12ms / 11ms 10ms / 16ms
MAX:
2366ms / 5206ms
Troubleshooting query performance issues SharePoint search has an instrumented query pipeline and associated administration reports
that help troubleshoot server-based query performance issues. This section will show reports
and use them to help understand how to troubleshoot issues on the server. In addition, this
section also contains tools and guidance available to assist in addressing client-based (browser)
performance issues.
Server-based query issues Server-based query performance can be segregated into two levels of issues:
Search front-end performance issues
Search backend performance
The following two subsections give the details for troubleshooting each of them. Please note that
these are high level guidelines.
Front-end performance issues
The first step in troubleshooting front-end query performance should be reviewing the Overall
Query Latency search administration report. Here is an example report:
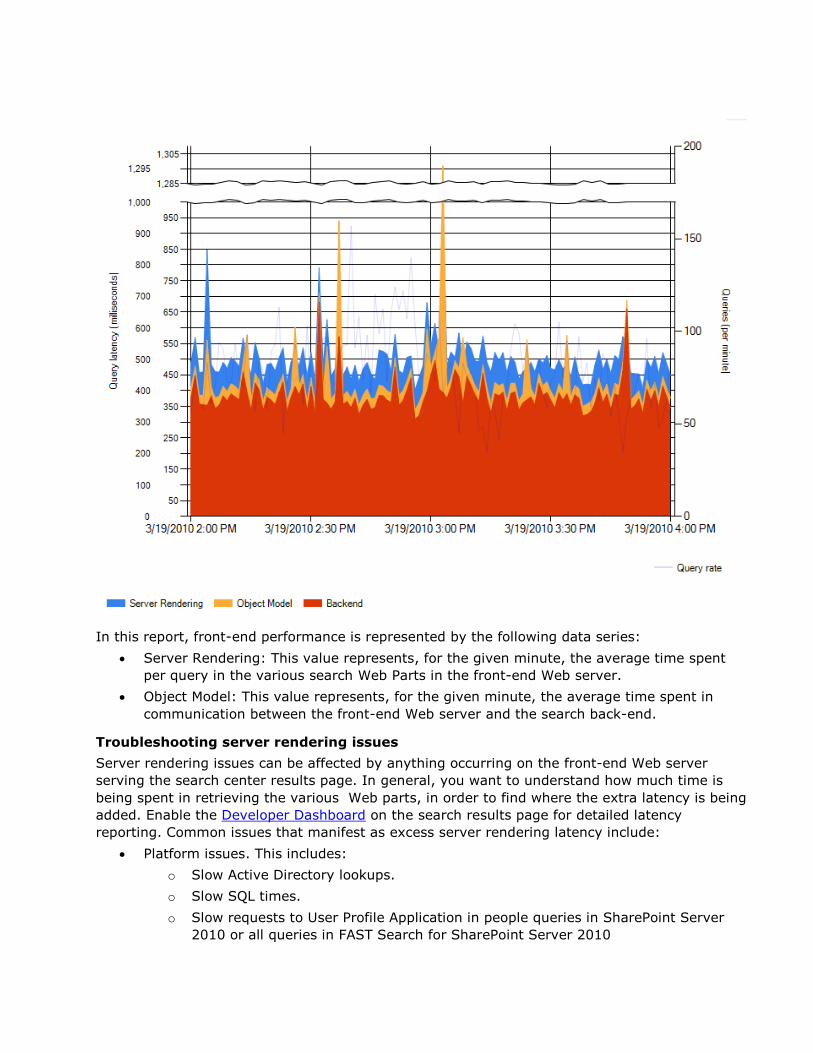
In this report, front-end performance is represented by the following data series:
Server Rendering: This value represents, for the given minute, the average time spent
per query in the various search Web Parts in the front-end Web server.
Object Model: This value represents, for the given minute, the average time spent in
communication between the front-end Web server and the search back-end.
Troubleshooting server rendering issues
Server rendering issues can be affected by anything occurring on the front-end Web server
serving the search center results page. In general, you want to understand how much time is
being spent in retrieving the various Web parts, in order to find where the extra latency is being
added. Enable the Developer Dashboard on the search results page for detailed latency
reporting. Common issues that manifest as excess server rendering latency include:
Platform issues. This includes:
o Slow Active Directory lookups.
o Slow SQL times.
o Slow requests to User Profile Application in people queries in SharePoint Server
2010 or all queries in FAST Search for SharePoint Server 2010
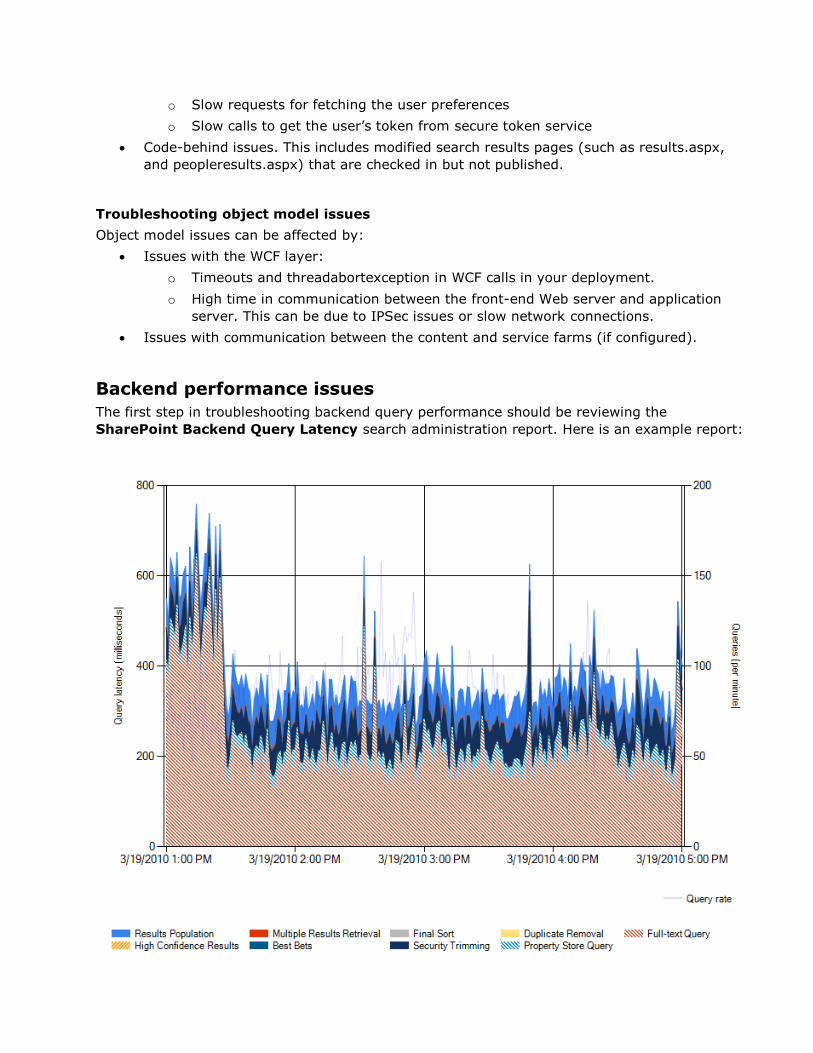
o Slow requests for fetching the user preferences
o Slow calls to get the user’s token from secure token service
Code-behind issues. This includes modified search results pages (such as results.aspx,
and peopleresults.aspx) that are checked in but not published.
Troubleshooting object model issues
Object model issues can be affected by:
Issues with the WCF layer:
o Timeouts and threadabortexception in WCF calls in your deployment.
o High time in communication between the front-end Web server and application
server. This can be due to IPSec issues or slow network connections.
Issues with communication between the content and service farms (if configured).
Backend performance issues
The first step in troubleshooting backend query performance should be reviewing the
SharePoint Backend Query Latency search administration report. Here is an example report:
In this report, backend performance is represented by the following data series (each is average
time spent per query, in the given minute), grouped by functional component:
Query Component:
o Full-text Query: This value shows the average time spent querying the full-text
index for results.
Property DB:
o Multiple Results Retrieval: This value shows the average time spent retrieving
document metadata, such as title or author, to appear in the query results.
o Property Store Query: This value shows the average time spent querying the
property database for property-based queries.
Search Administration DB:
o Best Bets: This value shows the average time spent determining whether there
are best bets available for the query terms.
o High Confidence Results: This value shows the average time spent to retrieve high
confidence results for queries.
Query Processor:
o Security Trimming: This value shows the average time spent removing items the
user does not have access to.
o Duplicate Removal: This value shows the average time spent removing duplicates.
o Results Population: This value shows the average time spent creating the in
memory table to be passed back to the object model.
Troubleshooting query component performance issues
Query components are resource intensive, especially when the component is “active”; that is,
responding to query requests. Troubleshooting query component performance is one of the
more complicated search areas. Here are general areas to consider:
The most resource intensive query component event is the master merge, where shadow
indexes are merged with the master index. This event occurs independently for each
query component. An example of the impact can be seen in the SharePoint Backend
Query Latency report above, at times prior to 1:30 PM. If this event is impacting end-
user query latency, it is possible to define “blackout” periods where a master merge
event is avoided unless the percentage of change exceeds the defined limit.
Sustained high values for your environment mean you should probably:
o Examine the index size for each component on the server. Ensure enough RAM on
the server exists to allow ~33% of the sum of index sizes to be cached.
o Examine the query component IO channel on the server. Ensure you are not
experiencing an IO bottleneck.
o If IO and RAM are not the source of the performance issue, you should repartition
your query components (adding additional index partitions), scaling out the
additional query components to new servers.
Troubleshooting property database issues
Examine SQL Server health using concepts in the “Storage and SQL Server capacity planning
and configuration”. If you are executing custom queries, you may need to look at hints, to guide
the correct query plan.
Troubleshooting search administration database issues
Examine SQL Server health using concepts in the “Storage and SQL Server capacity planning
and configuration”.
Troubleshooting query processor issues
Troubleshooting query processor issues depends on the area of the query processor that is
exhibiting the degraded query latency:
Security trimming:
o For windows claims, examine the Active Directory connection from the server
hosting the query processor.
o For all cases, the cache size used by the QP can be adjusted higher, if there is a
correlation between a large number of SQL Server round trips (determined by SQL
Server profiler). More than 25% of queries should not need a SQL Server call to
retrieve security descriptors from the search administration database. If they do,
adjust the QP cache size using the instructions (link to article on QP cache).
Duplicate removal:
o Look at whether you are crawling the same content in multiple places. Disable
duplicate detection in the search center.
Multiple results retrieval:
o Examine SQL health using concepts in the “Storage and SQL Server capacity
planning and configuration”.
Browser-based query issues Users can be either delighted or exasperated by the speed of search results. Page load time
(PLT) is one of the important factors in a user’s impression of a user experience. Most of the
focus around PLT is on the server-side, namely the time it takes the server to return results.
Client-side rendering, however, can compose a significant portion of PLT and is important to
consider.
The out-of-box search user experience is designed to provide sub-second responses for total
PLT. Out of that time, client rendering typically takes less than 280 milliseconds, depending
upon your browser and rendering measurement. This experience delights users with very fast
results.
Customizations to the results experience can easily degrade rendering performance. Search
administrators and developers must be vigilant in measuring the rendering time after each
modification to ensure performance has not regressed significantly. Every addition to the page
from a new Web Part to a new CSS style will increase rendering time on the browser and delay
results for your users. The amount of delay, however, can vary greatly based on whether certain
best practices are followed when customizing the page.
Here are some general guidelines:
Basic branding and style customizations to the page should not add more than
approximately 25 ms to PLT. Measure PLT before and after implementing customizations
to observe the change.
Users typically notice a change (faster or slower) in an increment of 20%. Keep this in
mind when making your changes; 20% of the out of the box rendering time is only 50
ms. (Source: Designing and Engineering Time)
Cascading Style Sheets (CSS) and JavaScript (JS) are the most common and largest
culprits to high rendering performance. If you must have customized CSS and JS, ensure
they are minimized to one file each.
JS can load on-demand after the page renders to provide the user with visible results
sooner. Details on how to do this are discussed in the performance considerations article.
The more customizations added to the page, the slower it will load. Consider whether the
added functionality and style is worth the extra delay on results for your users.
In addition to these guidelines, there is a wealth of information and tips on the internet about
how to reduce PLT and the effect of slow pages on a user experience. Read up on the literature
and delight your users with fast pages!
Troubleshooting crawl performance issues SharePoint search may experience bottlenecks in the crawl sub-system as the system moves
through content acquisition, maintenance and deletion phases. To effectively troubleshoot crawl
performance issue, the Search Health Monitoring Reports should be used in conjunction with the
common bottlenecks and their causes section to isolate crawl issues.
Troubleshooting during Index Acquisition Phase
The first place to identify crawl issues is the Crawl Rate Per Content Source health report. As
shown below, the report gives an overview of the crawl rate for each of the content sources in
the system. In general , the crawl rate should be greater than 15 docs/sec for people content
source and greater than 35 docs/sec for all other types of content sources.
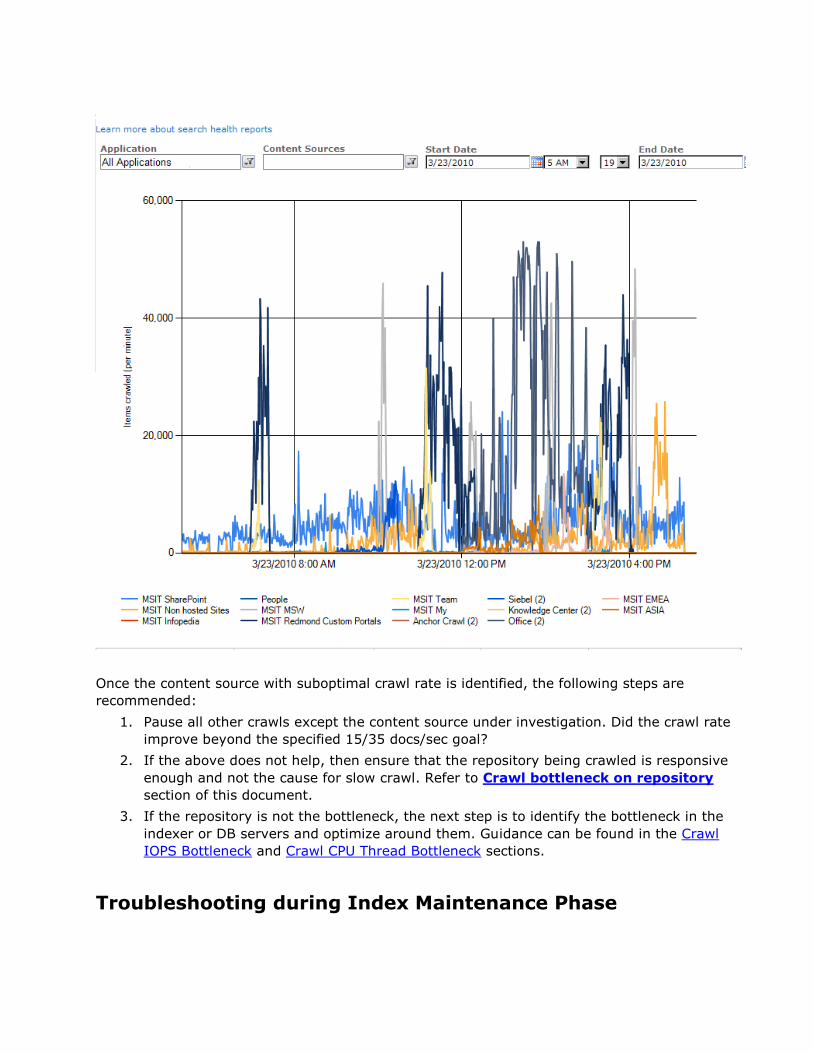
Once the content source with suboptimal crawl rate is identified, the following steps are
recommended:
1. Pause all other crawls except the content source under investigation. Did the crawl rate
improve beyond the specified 15/35 docs/sec goal?
2. If the above does not help, then ensure that the repository being crawled is responsive
enough and not the cause for slow crawl. Refer to Crawl bottleneck on repository
section of this document.
3. If the repository is not the bottleneck, the next step is to identify the bottleneck in the
indexer or DB servers and optimize around them. Guidance can be found in the Crawl
IOPS Bottleneck and Crawl CPU Thread Bottleneck sections.
Troubleshooting during Index Maintenance Phase
The primary goal during the content maintenance phase is to keep the search index as fresh as
possible. Two of the key indicators for this are index freshness and incremental crawl speed.
1. Index freshness : Are the crawls finishing in their budgeted time and in accordance
with the IT guidelines for index freshness?
2. Incremental crawl speed: If the index freshness goal is not met, then the first step is
to investigate if whether the incremental crawl speeds are 10 docs/sec for people content
sources and 25 docs/sec for all other content sources. If the incremental crawl speeds
are suboptimal, a bottleneck analysis should be performed on the crawled repository and
the crawl subsystem as described above.
Common bottlenecks and their causes During performance testing, several different common bottlenecks were revealed. A bottleneck
is a condition in which the capacity of a particular constituent of a farm is reached. This causes a
plateau or decrease in farm throughput.
The following table lists some common bottlenecks and describes their causes and possible
resolutions.
Bottleneck Symptom (perf
counter) Resolution
Database
RAM Property database,
Search administration
database exhibit:
SQL Server
Buffer Manager/
Page Life
Expectancy <
300(s) (should
be > 1000 (s))
SQL Server
Buffer Manager/
Buffer Cache Hit
Ratio < 96%
(should be >
98%)
Add more memory to the database server.
Defragment the property database, if the
weekly defrag rule has been disabled.
Ensure you are using SQL Server 2008
Enterprise edition, to enable page compression.
Move database to separate server, adding
multiple property databases, if necessary.
Database
server
IOPS
A Property DB or
Crawl DB exhibits:
Avg Disc
Sec/Read and
Avg Disc
Sec/Write ~50
ms or > 50 ms
Ensure the database server has enough RAM to
keep 33% of the critical tables (MSSDocSDIDs
+ MSSDocProps + MSSDocresults) in cache.
Increase the dedicated number of IOPS for the
database:
o Use different storage arrays
o Optimize your storage configuration; for
example, by adding spindles (disk
drives) to the storage array.
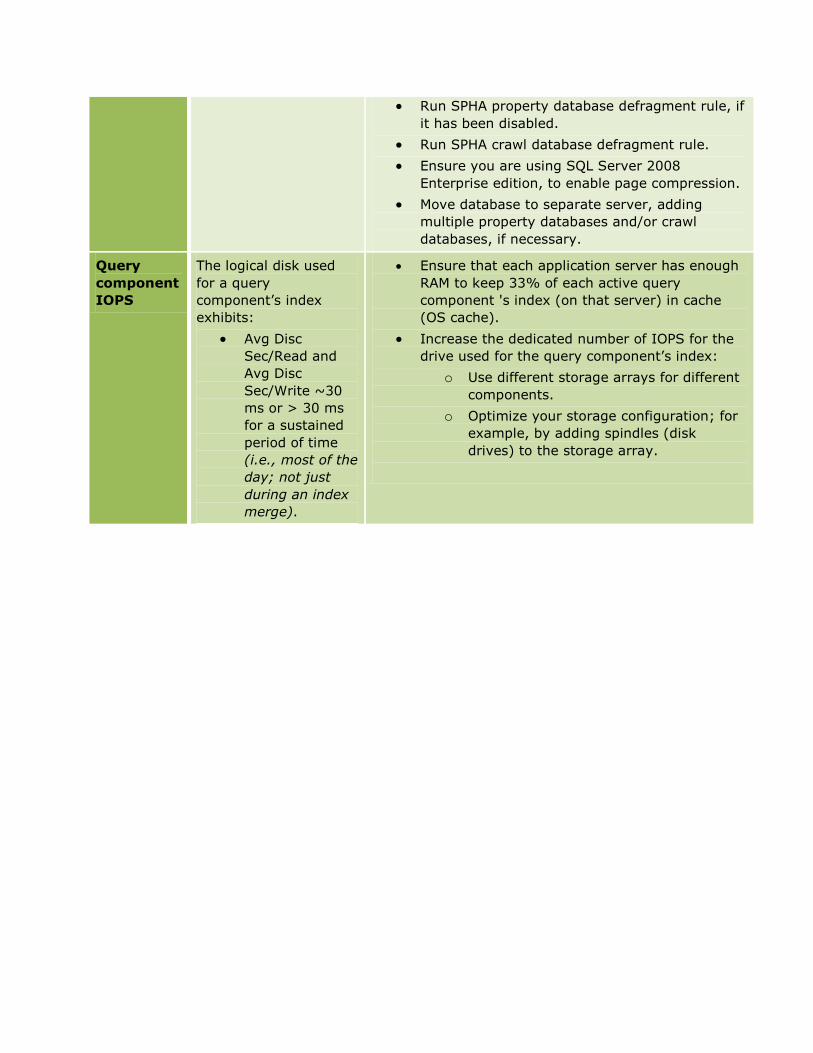
Run SPHA property database defragment rule, if
it has been disabled.
Run SPHA crawl database defragment rule.
Ensure you are using SQL Server 2008
Enterprise edition, to enable page compression.
Move database to separate server, adding
multiple property databases and/or crawl
databases, if necessary.
Query
component
IOPS
The logical disk used
for a query
component’s index
exhibits:
Avg Disc
Sec/Read and
Avg Disc
Sec/Write ~30
ms or > 30 ms
for a sustained
period of time
(i.e., most of the
day; not just
during an index
merge).
Ensure that each application server has enough
RAM to keep 33% of each active query
component 's index (on that server) in cache
(OS cache).
Increase the dedicated number of IOPS for the
drive used for the query component’s index:
o Use different storage arrays for different
components.
o Optimize your storage configuration; for
example, by adding spindles (disk
drives) to the storage array.