estimated sound power radiated by surfaces on a continuous
TRANSCRIPT

Cleveland, OhioNOISE-CON 2003
2003 June 23-25
Estimated Sound Power Radiated by Surfaces on aContinuous Miner Tail Section Using Vibration
MeasurementsDavid S. Yantek
Associate Research FellowHealth Branch
Hearing Loss Prevention SectionNational Institute for Occupational Safety and Health (NIOSH)
626 Cochrans Mill RoadP.O.Box18070
Pittsburgh, PA 15236Phone: (412) 386 – 4498 Fax: (412) 386 – 4865
Email: [email protected]
ABSTRACTMiners in underground coal mines experience prolonged exposure to high noise levels, often with A-weighted soundlevels in excess of 90 dB. Field tests have shown that the continuous miner conveyor is a dominant noise source.This paper will identify the most significant noise-radiating surfaces on the continuous miner tail section usingvibration levels and surface areas to estimate the sound power levels of each surface. In addition, using five testcases, this study will examine the effects of three engineering noise controls on the surface-averaged vibration levelsand average sound levels measured with four microphones located two meters from the tail section. The noise-radiating surfaces of the conveyor’s tail section include the top and bottom decks, the sideboards, and the flex plates.Emphasis is placed on the changes in the estimated sound power levels in the 500 – 2500 Hz 1/3-octave bands sincethis frequency range accounts for 80-85% of the sound energy near the tail section. The results show that the bottomdeck is the most significant noise radiator for the untreated miner. Installing a coated bottom deck reduces theestimated sound power level radiated from the bottom deck by 11 dB and the average sound level by 2 dB. Using acoated tail roller results in reductions of the estimated sound power levels for individual components from 1 to 4 dBand reduces the average sound level by 2 dB. Coating the slide plate has little effect on both the estimated radiatedsound power levels and the average sound level. The test results indicate that modifications that reduce flex platevibration and reduce energy transfer from the tail roller into the tail section will be effective in reducing noise whencombined with a coated tail roller and coated return deck.
1. INTRODUCTIONNoise-induced hearing loss is among the most critical health issues affecting miners today. NIOSH studies of17,260 audiograms for 2871 coal miners show that 80% of coal miners have a moderate to profound high-frequencyhearing loss by age 64.1 In addition, at age 50, 90% of miners have a hearing impairment by the NIOSH definition(an average Hearing Threshold Level of 25 dB or greater for the 1000, 2000, 3000, and 4000 Hz frequencies)compared to only 10% of people without occupational noise exposure.
Mining equipment that is used to drill and cut rock, coal, or other materials radiates noise due to the impactsassociated with the cutting and drilling processes. In addition, conveying mechanisms that move the cut media tothe point where a haulage vehicle carries it away can generate high noise levels. Some conveyors utilize a chainwith metal bars called flight bars to move the material to the loading point. Impacts between the chain and variouscomponents of the conveyor can cause excessive noise levels.

A continuous miner is a machine that uses a rotating cylinder, or cutting drum, with bits attached to its outer surfaceto cut coal. The coal is then loaded onto the gathering pan of the conveyor deck by rotating arms. A conveyor chainwith flight bars moves the cut material along the top deck from the front of the machine to the rear of the minerwhere a haulage vehicle loads the material and carries it away. The conveyor chain is driven from the front of theminer via a sprocket. At the rear of the miner, the tail roller guides the conveyor chain back to the front of themachine via the return deck. The slide plate holds the tail roller in place between the side rails.
The conveyor is one of the dominant noise sources on a continuous miner. Since the operator position is locatednear the rear, or tail section, of the miner, reducing the noise radiated by the tail section is necessary to reduceoperator noise exposure. The tail section noise affecting the operator is due to the flight bars scraping the top deckand impacting the tail roller and other locations on the machine along the return path exciting the structure whichradiates noise.
Huggins and Remington studied the noise generating mechanisms of the conveyor tail section of a loader, which issimilar to a continuous miner without a cutting drum.2 A fixture was fabricated using the tail section of a loader.Noise and vibration measurements were conducted in a reverberation chamber to determine the most significantsources of noise. The dominant noise-generating mechanism was found to be the chain impacting the tail rollerfollowed by the chain impacting and scraping on the top and the bottom conveyor deck. An isolated tail rollerconsisting of a steel sleeve over a rubber coated tail roller and isolation strips for the top and bottom plates weredeveloped. Application of these treatments was found to reduce the overall A-weighted sound level by 11 dB fortests conducted on the test fixture. The researchers point out that, although there is a general similarity in the noisegenerating mechanisms of conveyors, the relative ranking of the noise-generating mechanisms may vary widelybetween machines.
Galaitsis, Madden, and Andersen evaluated the acoustic performance and durability of constrained layer dampingtreatments applied to the top and bottom decks and the side rails of continuous miners.3 Six treated and elevenuntreated continuous miners were tested underground. The results indicated that the average reduction in the A-weighted sound level at the operator’s position was 5 dB with an empty conveyor and no cutting. With a loadedconveyor, the A-weighted sound level was reduced by 2 dB. After one year of operation, no significant reduction inthe acoustic performance of the treatment was observed. The researchers also evaluated the performance of resilientwear strips mounted to the conveyor deck. Above ground tests showed the strips to be both durable and effective atreducing noise. However, underground testing showed excessive wear of the strips. The researchers suggestedmodifying the design of the strips to improve their durability.
2. EXPERIMENTAL PROCEDURES / ANALYSIS METHODVibration measurements were used to estimate the A-weighted sound power radiated from the surfaces of the tailsection of the continuous miner using acceleration measurements.4 The vibration data were measured followingISO/TR 7849:1987 Acoustics – Estimation of airborne noise emitted by machinery using vibration measurement.The major noise-radiating surfaces of the tail section that were examined include the left and right side rails, the leftand right flex plates, the top conveyor deck, and the bottom conveyor deck (see Figure 1).
Four microphones were used to measure the sound pressure during testing (see Figure 2). One microphone waslocated two meters above a reference box encompassing the tail section and centered across the top deck. Threeadditional microphones were positioned at a height of 1.5 m and located two meters from the left, to the rear, and tothe right of the reference box. The microphones to the left and right of the tail section were centered on the lengthof the reference box.
Using beeswax, ten to twelve accelerometers were mounted on the left and right side rails, left and right flex plates,and the return deck. Figures 3 and 4 show the accelerometer locations used on the return deck and left flex plate,respectively. For the top deck, accelerometers were embedded in the underside of the deck by drilling 6-mmdiameter holes approximately 6 mm deep. Epoxy was then used to mount accelerometers into the holes. Shallowgrooves were made in the underside of the top deck to run the cables to the outside of the machine (see Figure 5).

A water spray of approximately 3.79 l/min (1 gal/min) was applied to the top deck to simulate the wet environmentencountered in mining. The conveyor was operated and the resulting accelerations and sound pressures weremeasured at a sample rate of 25 kSamples/sec with 16-bit resolution. The digitized data were subsequently A-weighted. The accelerations were integrated to determine the vibration velocities. Third-octave filtering was thenapplied to the A-weighted sound pressures and vibration velocities. For each test, the surface-averaged mean squarevelocity on each surface and the four-microphone averaged sound levels were calculated. The surface-averagedvibration levels were used with the surface areas to estimate the sound power levels of radiation from each testsurface.
Baseline tests were performed with no engineering noise controls applied to the miner. Following the baseline tests,the effects of several engineering noise controls on the sound power radiated by the test surfaces and the averagesound levels were examined. The additional tests were performed with the following treatments:
1. Coated return deck;2. Coated tail roller;3. Coated return deck and coated tail roller;4. Coated slide plate.
The sound power radiated by a vibrating surface may be determined by
2vcSP σρ= (1)
where σ is the radiation ratio, ρc is the specific acoustic impedance of the fluid, S is the surface area, and 2v is themean square surface-averaged velocity. For the purposes of comparing the radiated sound power from each surface,the radiation ratio of each surface was assumed to be 1. The estimated sound power level in decibels may then befound to by
+
=
20
2
0w
vvlog10
SSlog10L (2)
where S0 is the reference surface area taken to be 1 m2, and 0v is the reference mean square velocity taken to be 50x 10-9 m/s according to ISO/TR 7849.
3. RESULTS & DISCUSSIONBaseline tests were conducted with no treatments applied to the machine and the data were processed according tothe previously discussed procedures. The four-microphone average sound level for the baseline conditions is shownin 1/3-octave bands in Figure 6. The average A-weighted sound level for the baseline tests was found to be 99 dB.The baseline data show that the 500 – 2500 Hz 1/3-octave bands account for 80 – 85 % of the overall A-weightedsound level. Therefore, the estimated A-weighted sound power levels in the 500 – 2500 Hz 1/3-octave bands fromeach surface were examined. Figure 7 shows a bar plot of the estimated A-weighted sound power level attributed toeach test surface in the 500 – 2500 Hz 1/3-octave bands. These data were calculated using equation 2. The soundpower levels due to each surface may not be correct in an absolute sense due to the assumption that the radiationratio is unity. However, the data can be used to assess the relative contribution of each surface. As the figureshows, the return deck is the most significant noise radiator for the baseline conditions followed by the left sideboard, the left flex plate, the right side board, the right flex plate, and the top deck. These findings indicate that thefirst attempt at controlling noise must focus on reducing the vibration of the return deck.
As the flight bars on the conveyor chain begin their return, the flights have been observed to impact the beginning ofthe return deck. This observation correlates with the high vibration levels and estimated sound power for the returndeck under baseline conditions. To address this problem, a urethane coating was applied to the return deck (seeFigure 8) to decrease the energy transmitted to the return deck by the flight bar impacts. Figure 9 shows theestimated A-weighted sound power levels in the 500 Hz – 2500 Hz 1/3-octave bands for each test surface with the

coated return deck compared to the baseline tests. The figure shows that the sound power level from the return deckdropped by 11 dB with the coated return deck. Reductions of 1 to 2 dB occurred on the other test surfaces. With thecoated return deck, the figure shows that the most significant noise radiators are the left side board and left flex platefollowed by the right side board and right flex plate. The return deck is shown to be the least significant noiseradiator. The average overall A-weighted sound level dropped to 97 dB, a 2-dB reduction from the baseline soundlevel. The results show that the coated return deck is effective at both reducing the average sound level and thereturn deck radiated sound power. However, the significantly lower sound power level reductions on the other testsurfaces indicate that other sources of excitation may be controlling the A-weighted sound level.
The flight bars also impact the steel tail roller transmitting energy into the tail section via the tail roller guides, slideplate, and tension springs along the tail section. A urethane-coated tail roller (see Figure 10) was developed toreduce the forces transmitted by these paths. Figure 11 shows the estimated radiated sound power level in the 500 –2500 Hz 1/3-octave bands for each test surface with the coated tail roller compared to the levels for the baseline testcase. The figure shows that the reductions in radiated sound power for individual surfaces ranged from 1 to 4 dB.The most significant reduction occurred for the left side board followed by the right side board, the top deck, and thereturn deck. The reductions in the sound power levels for the left and right flex plates were determined to be 1 dB.With the coated tail roller, the dominant noise-radiating surface is the return deck followed by the left side board, theleft flex plate, the right flex plate, the right side board, and the top deck. The data show that coating the tail rollerresults in higher reductions of overall radiated sound power compared to the coated return deck. However, thecoated return deck reduced the most dominant source better than the coated tail roller. The average overall A-weighted sound level was reduced from 99 dB for the baseline test case to 97 dB with the coated tail roller.
Since both the coated return deck and coated tail roller reduced the estimated radiated sound power levels and theaverage overall A-weighted sound level, tests were performed with both treatments in place (see Figure 12). Figure13 shows a comparison of the estimated sound power levels in the 500 – 2500 Hz 1/3-octave bands with the coatedreturn deck and coated tail roller compared to the levels for the baseline continuous miner. The sound power levelattributable to the return deck, the most significant source for the baseline machine, was reduced by 16 dB.Reductions in sound power level for the left side board, top deck, and right side board were 7, 8, and 14 dB,respectively. The sound power level from the left and right flex plates remained relatively unchanged withreductions of 2 dB. The average overall A-weighted sound level dropped from 99 dB for the baseline test case to 95dB with the coated return deck and coated tail roller. With these treatments, the data show that the left and right flexplates are the dominant noise-radiating surfaces followed by the left side board. The test data indicate thattreatments that reduce the flex plate vibrations, such as constrained layer damping, will be effective in reducing thenoise levels around the tail section when combined with the coated return deck and coated tail roller.
Since the slide plate is an element that transfers the tail roller-chain impact energy into the tail section, a coated slideplate (see Figure 14) was fabricated. The coated slide plate was installed and the coated return deck and coated tailroller were replaced with the non-coated components. Figure 15 shows the estimated sound power level for eachtest surface in the 500 – 2500 Hz 1/3-octave bands with the coated slide plate compared to the baseline test case.The figure shows that the return deck was the most significant noise-radiating surface followed by the left side boardand left flex plate. Reductions in sound power levels were less than 1 dB for the left side board and 1dB for thereturn deck. The sound power level from the left flex plate increased by 2 dB. This increase is thought to be a resultof the chain being moved towards the left side of the conveyor during installation of the coated slide plate. Thiswould cause the flights to transmit more energy into the left flex plate. The small change in sound power levelsfrom the other surfaces shows that the slide plate by itself is not effective at making a significant impact on thevibration levels. The average overall A-weighted sound level remained 99 dB.
Although the slide plate by itself is ineffective at reducing the surface vibrations, combining the coated slide platewith other treatments that reduce the force transmitted via the tail roller ends, slide plate, and springs would beeffective. The test data with the coated tail roller prove that reducing the force applied at the tail roller would reducethe surface vibrations and sound levels. The next step would be to isolate the tail roller and slide plate from the tailsection. To isolate these components effectively, all mechanical connections must be addressed. The existingdesign has steel-steel contact at the interface between the ends of the tail roller and the left and right side boards. Inaddition, steel compression springs are used on each side of the conveyor deck to apply tension to the chain. Thesepaths must be addressed in addition to the contact between the slide plate and the tail section to further reduceenergy transmission and radiated noise.

Figure 16 shows a comparison of the estimated radiated sound power for each surface in the 500 – 2500 Hz 1/3-octave bands in relation to each test case that showed significant reductions in the estimated radiated sound power.The average overall A-weighted 1/3-octave spectra for each test are plotted on Figure 17. Figure 17 shows that thecoated slide plate had little effect on any of the 1/3-octave band sound levels. Individually, however, both thecoated return deck and coated tail roller were effective at reducing the sound levels in the dominant frequency band.The data show that the coated tail roller is more effective than the coated return deck in reducing noise above 2500Hz. Although the higher frequencies are currently insignificant, these reductions may play a more important role ifother controls can reduce the noise levels in the 500 – 2500 Hz 1/3-octave band.
5. CONCLUSIONSThe return deck was the most significant noise-radiating surface for the baseline tests. Installation of a urethane-coated return deck decreased the estimated sound power level of radiation from the return deck by 11 dB in the 500– 2500 Hz 1/3-octave bands and reduced the average overall sound level by 2 dB. The estimated sound power levelsfor the other test surfaces were reduced by 1 to 2 dB. Replacing the existing tail roller with a urethane-coated tailroller resulted in reductions in the estimated sound power level of radiation from individual surfaces from 1 to 4 dBand reduced the average overall sound level by 2 dB. Combining the coated tail roller and coated return deckreduced the estimated sound power level of radiation from the return deck by 16 dB compared to the baseline levelsand reduced the average overall sound level by 4 dB. Using a coated slide plate was found to have minimal effectson the estimated radiated sound power levels and the average overall sound level.
REFERENCES1 John R. Franks, “Analysis of Audiograms for a Large Cohort of Noise-Exposed Miners,” Internal Report,National Institute for Occupational Safety and Health, Cincinnati, OH, pp. 1-7.
2 Geoffrey G. Huggins and Paul J. Remington, “Noise Reduction of Conveyors Used in Underground CoalMining Machinery,” Contract H0357085, Bolt, Beranek, and Newman, (Bureau of Mines OFR 109-77, 1976).
3 A. Galaitsis, R. Madden, and D. Andersen, “Noise Reduction of Chain Conveyors Volume II,” ContractH0155113, Bolt, Beranek, and Newman, (Bureau of Mines OFR 171-83, 1983).
4Acoustics – Estimation of Airborne Noise Emitted by Machinery Using Vibration Measurement, Technical ReportISO 7849: 1987 (International Organization for Standardization, Geneva, Switzerland, 1987).

Figure 1. The continuous miner tail section.
Figure 2. Microphone locations two meters from the reference box around the tail section of the continuous miner.
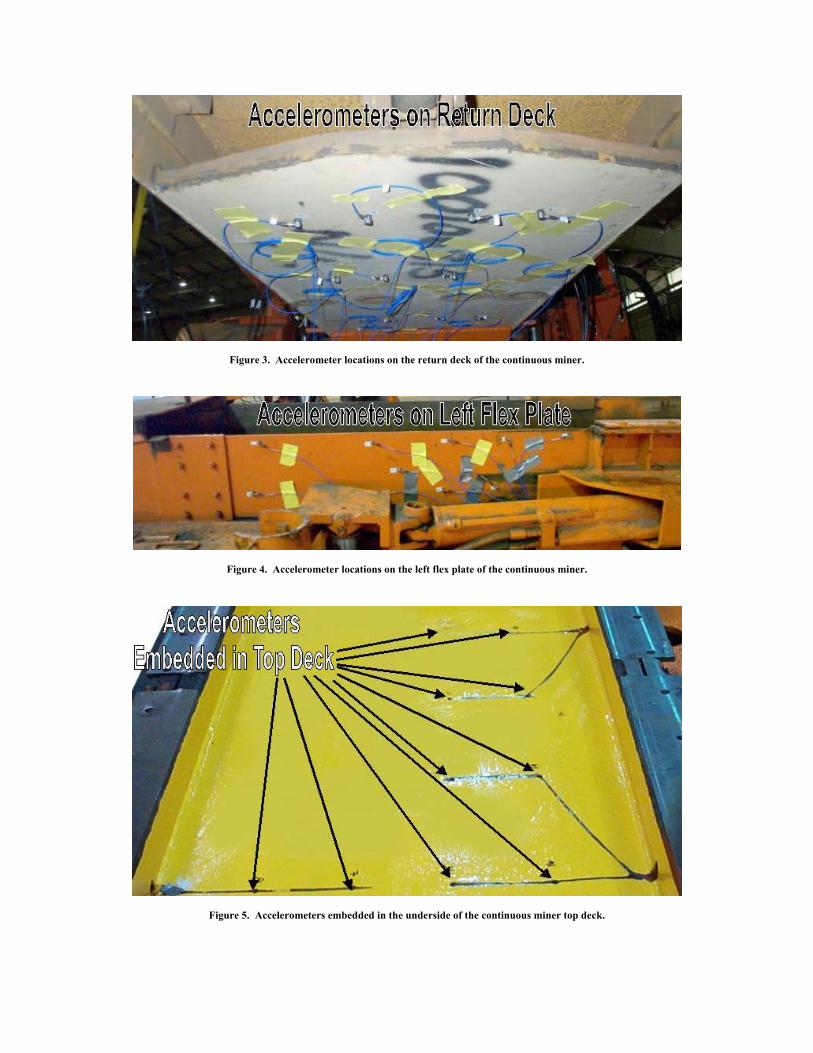
Figure 3. Accelerometer locations on the return deck of the continuous miner.
Figure 4. Accelerometer locations on the left flex plate of the continuous miner.
Figure 5. Accelerometers embedded in the underside of the continuous miner top deck.

Figure 6. Average A-wtd 1/3-octave sound levels for thebaseline continuous miner.
Figure 7. Estimated A-wtd sound power levels for eachtest surface in the 500 – 2500 Hz 1/3-octavebands for the baseline continuous miner.
Figure 8. Coated return deck for the CM. Figure 9. Estimated A-wtd sound power levels for eachtest surface in the 500 – 2500 Hz 1/3-octavebands for baseline versus coated return deck.
Figure 10. Coated tail roller for the CM.
Figure 11. Estimated A-wtd sound power levels for eachtest surface in the 500 – 2500 Hz 1/3-octavebands for baseline versus coated tail roller.
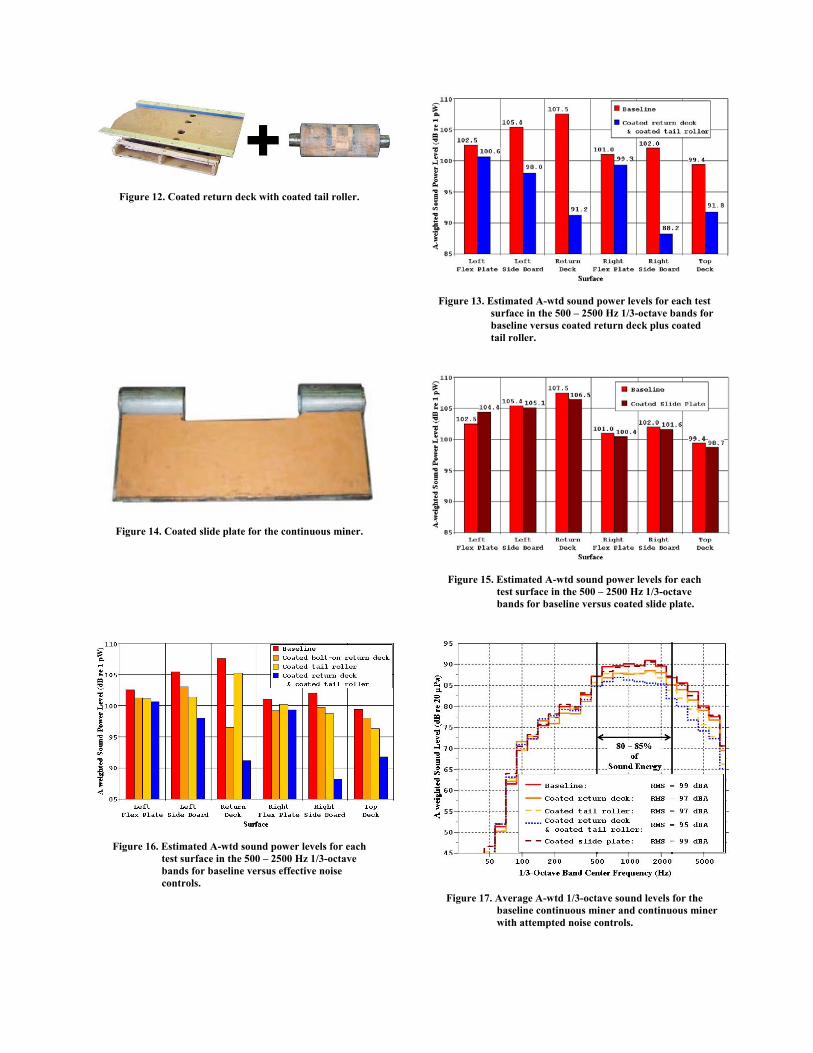
Figure 12. Coated return deck with coated tail roller.
Figure 13. Estimated A-wtd sound power levels for each testsurface in the 500 – 2500 Hz 1/3-octave bands forbaseline versus coated return deck plus coatedtail roller.
Figure 14. Coated slide plate for the continuous miner.
Figure 15. Estimated A-wtd sound power levels for eachtest surface in the 500 – 2500 Hz 1/3-octavebands for baseline versus coated slide plate.
Figure 16. Estimated A-wtd sound power levels for eachtest surface in the 500 – 2500 Hz 1/3-octavebands for baseline versus effective noisecontrols.
Figure 17. Average A-wtd 1/3-octave sound levels for thebaseline continuous miner and continuous minerwith attempted noise controls.