estimates of subsistence harvests of pacific halibut in ... · special publication no. 2009-06...
TRANSCRIPT

Special Publication No. 2009-06
Estimates of Subsistence Harvests of Pacific Halibut in Kodiak and Sitka, Alaska, 2006
by
James A. Fall,
David Koster
and
Michael Turek
May 2009
Alaska Department of Fish and Game Division of Subsistence

Symbols and Abbreviations The following symbols and abbreviations, and others approved for the Système International d'Unités (SI), are used without definition in the reports by the Division of Subsistence. All others, including deviations from definitions listed below, are noted in the text at first mention, as well as in the titles or footnotes of tables, and in figure or figure captions. Weights and measures (metric) centimeter cm deciliter dL gram g hectare ha kilogram kg kilometer km liter L meter m milliliter mL millimeter mm Weights and measures (English) cubic feet per second ft3/s foot ft gallon gal inch in mile mi nautical mile nmi ounce oz pound lb quart qt yard yd Time and temperature day d degrees Celsius °C degrees Fahrenheit °F degrees kelvin K hour h minute min second s Physics and chemistry all atomic symbols alternating current AC ampere A calorie cal direct current DC hertz Hz horsepower hp hydrogen ion activity (negative log of) pH parts per million ppm parts per thousand ppt, ‰ volts V watts W
General all commonly-accepted abbreviations
e.g., Mr., Mrs., AM, PM, etc. all commonly-accepted professional
titles e.g., Dr., Ph.D., R.N., etc. Alaska Administrative Code AAC at @ compass directions: east E north N south S west W copyright © corporate suffixes: Company Co. Corporation Corp. Incorporated Inc. Limited Ltd. District of Columbia D.C. et alii (and others) et al. et cetera (and so forth) etc. exempli gratia (for example) e.g. Federal Information Code FIC id est (that is) i.e. latitude or longitude lat. or long. monetary symbols (U.S.) $, ¢ months (tables and figures): first three
letters (Jan,...,Dec) registered trademark ® trademark ™ United States (adjective) U.S. United States of America (noun) USA U.S.C. United States Code U.S. state use two-letter abbreviations (e.g., AK, WA)
Measures (fisheries) fork length FL mideye-to-fork MEF mideye-to-tail-fork METF standard length SL total length TL Mathematics, statistics all standard mathematical signs, symbols
and abbreviations alternate hypothesis HA base of natural logarithm e catch per unit effort CPUE coefficient of variation CV common test statistics (F, t, χ2, etc.) confidence interval CI correlation coefficient (multiple) R correlation coefficient (simple) r covariance cov degree (angular ) ° degrees of freedom df expected value E greater than > greater than or equal to ≥ harvest per unit effort HPUE less than < less than or equal to ≤ logarithm (natural) ln logarithm (base 10) log logarithm (specify base) log2, etc. minute (angular) ' not significant NS null hypothesis HO percent % probability P probability of a type I error (rejection of the
null hypothesis when true) α probability of a type II error (acceptance of
the null hypothesis when false) β second (angular) " standard deviation SD standard error SE variance population Var sample var

SPECIAL PUBLICATION 2009-06
SUBSISTENCE HARVESTS OF PACIFIC HALIBUT IN KODIAK AND SITKA, ALASKA, 2006
by
James A. Fall, Alaska Department of Fish and Game, Division of Subsistence, Anchorage
David Koster,
Alaska Department of Fish and Game, Division of Subsistence, Anchorage
and
Michael Turek Alaska Department of Fish and Game, Division of Subsistence, Juneau
Development and publication of this manuscript were partially financed by the U.S. Department of Commerce, National Oceanic and Atmospheric Administration, National Marine Fisheries Service, under NOAA Award Number NANMF4370314.
Alaska Department of Fish and Game Division of Subsistence
333 Raspberry Road Anchorage, Alaska 99518
May 2009

The Division of Subsistence Technical Paper series was established in 1979 and represents the most complete collection of information about customary and traditional uses of fish and wildlife resources in Alaska. The papers cover all regions of the state. Some papers were written in response to specific fish and game management issues. Others provide detailed, basic information on the subsistence uses of particular communities which pertain to a large number of scientific and policy questions.
Technical Paper series reports are available through the Alaska State Library and on the Internet: http://www.subsistence.adfg.state.ak.us. This publication has undergone editorial and professional review.
James A. Fall and David Koster, Alaska Department of Fish and Game, Division of Subsistence,
333 Raspberry Road, Anchorage, AK, 99518, USA
and Michael Turek
Alaska Department of Fish and Game, Division of Subsistence, P.O. Box 115526, Juneau, AK, 99811, USA
This document should be cited as: Fall, J. A., D. Koster, and M. Turek. 2009. Subsistence harvests of Pacific halibut in Kodiak and Sitka, Alaska,
2006. Report to the U.S. Department of Commerce National Oceanic and Atmospheric Administration National Marine Fisheries Service. Alaska Department of Fish and Game Division of Subsistence, Special Publication No. 2009-06, Anchorage.
The Alaska Department of Fish and Game (ADF&G) administers all programs and activities free from discrimination based on race, color, national origin, age, sex, religion, marital status, pregnancy, parenthood, or disability. The department administers all programs and activities in compliance with Title VI of the Civil Rights Act of 1964, Section 504 of the Rehabilitation Act of 1973, Title II of the Americans with Disabilities Act (ADA) of 1990, the Age Discrimination Act of 1975, and Title IX of the Education Amendments of 1972. If you believe you have been discriminated against in any program, activity, or facility please write:
ADF&G ADA Coordinator, P.O. Box 115526, Juneau AK 99811-5526 U.S. Fish and Wildlife Service, 4040 N. Fairfax Drive, Suite 300 Webb, Arlington VA 22203 Office of Equal Opportunity, U.S. Department of the Interior, Washington DC 20240
The department’s ADA Coordinator can be reached via telephone at the following numbers: (VOICE) 907-465-6077, (Statewide Telecommunication Device for the Deaf) 1-800-478-3648, (Juneau TDD) 907-465-3646, or (FAX) 907-465-6078
For information on alternative formats and questions on this publication, please contact: ADF&G Division of Subsistence at www.subsistence.state.ak.us.

i
TABLE OF CONTENTS Page
LIST OF TABLES.........................................................................................................................................................ii LIST OF FIGURES......................................................................................................................................................iii LIST OF APPENDICES ..............................................................................................................................................iv ABSTRACT ..................................................................................................................................................................1 CHAPTER 1: BACKGROUND AND METHODS .....................................................................................................1 Background....................................................................................................................................................................1 Goals And Objectives....................................................................................................................................................2 Methods .........................................................................................................................................................................2
Project Planning........................................................................................................................................................2 Sample Selection and Achievement..........................................................................................................................3 Data Gathering Methods...........................................................................................................................................6 Summary Interviews.................................................................................................................................................8
Project Implementation: Kodiak...................................................................................................................................8 Project Implementation: Sitka ......................................................................................................................................9 Data Analysis...............................................................................................................................................................10 Products .......................................................................................................................................................................11 CHAPTER 2: FINDINGS ..........................................................................................................................................11 Estimates of Participation in 2006...............................................................................................................................11 Estimates of Harvests in 2006 .....................................................................................................................................12 Average Weights of Halibut ........................................................................................................................................14 Timing of Harvests ......................................................................................................................................................14 Number of Hooks Used ...............................................................................................................................................14 Incidental Harvests of Rockfish and Lingcod..............................................................................................................14 Findings From The Summary (Post-Fishing) Interviews ............................................................................................15 CHAPTER 3: DISCUSSION, CONCLUSIONS, AND RECOMMENDATIONS....................................................19 Discussion....................................................................................................................................................................19
Representation of Highly Productive Harvesters in the Sample .............................................................................19 Composition of the Samples by Age of SHARC Holders ......................................................................................19 Inseason Sample as a Panel ....................................................................................................................................20 Potential Recall Error .............................................................................................................................................21
Conclusions .................................................................................................................................................................22 Recommendations .......................................................................................................................................................23 ACKNOWLEDGEMENTS.........................................................................................................................................23 REFERENCES CITED ...............................................................................................................................................24 TABLES AND FIGURES...........................................................................................................................................25 APPENDIX A: INTRODUCTORY LETTER ...........................................................................................................67 APPENDIX B: FORM 1–SHARC HOLDER RECALL FORM JANUARY–JUNE 2006 .......................................69
ii
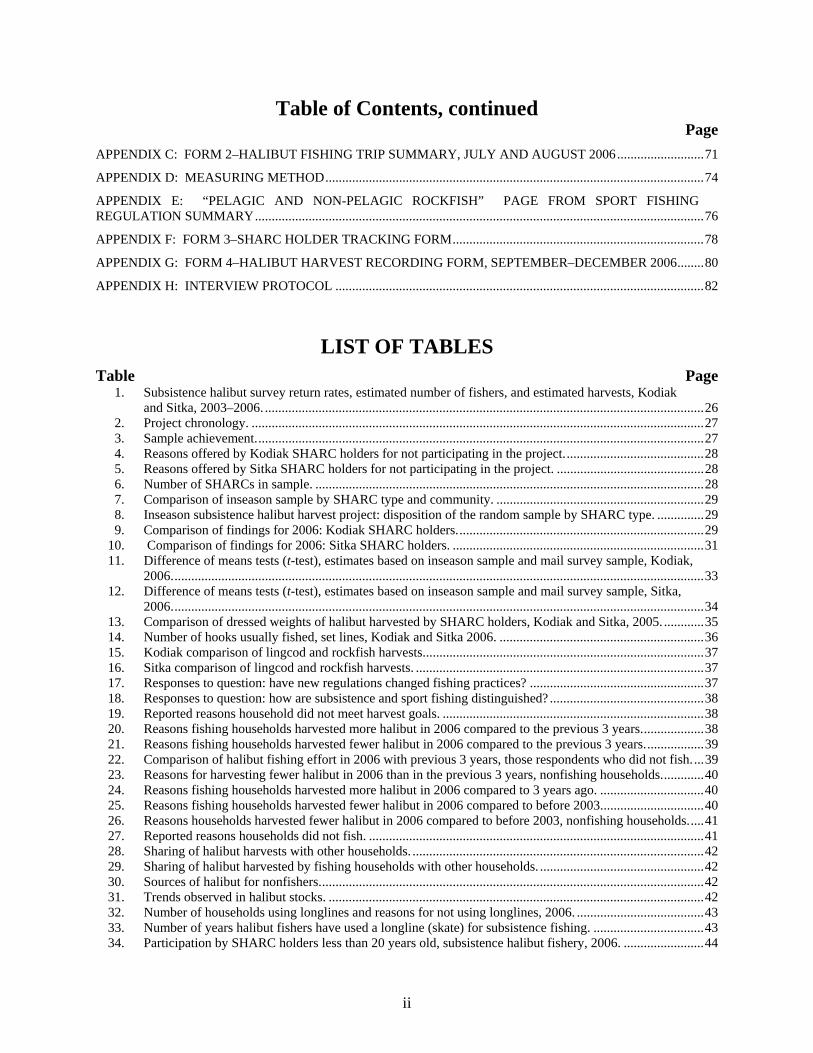
Table of Contents, continued Page APPENDIX C: FORM 2–HALIBUT FISHING TRIP SUMMARY, JULY AND AUGUST 2006..........................71 APPENDIX D: MEASURING METHOD.................................................................................................................74 APPENDIX E: “PELAGIC AND NON-PELAGIC ROCKFISH” PAGE FROM SPORT FISHING REGULATION SUMMARY......................................................................................................................................76 APPENDIX F: FORM 3–SHARC HOLDER TRACKING FORM...........................................................................78 APPENDIX G: FORM 4–HALIBUT HARVEST RECORDING FORM, SEPTEMBER–DECEMBER 2006........80 APPENDIX H: INTERVIEW PROTOCOL ..............................................................................................................82
LIST OF TABLES
Table Page 1. Subsistence halibut survey return rates, estimated number of fishers, and estimated harvests, Kodiak
and Sitka, 2003–2006. ...................................................................................................................................26 2. Project chronology. .......................................................................................................................................27 3. Sample achievement......................................................................................................................................27 4. Reasons offered by Kodiak SHARC holders for not participating in the project..........................................28 5. Reasons offered by Sitka SHARC holders for not participating in the project. ............................................28 6. Number of SHARCs in sample. ....................................................................................................................28 7. Comparison of inseason sample by SHARC type and community. ..............................................................29 8. Inseason subsistence halibut harvest project: disposition of the random sample by SHARC type. ..............29 9. Comparison of findings for 2006: Kodiak SHARC holders..........................................................................29 10. Comparison of findings for 2006: Sitka SHARC holders. ...........................................................................31 11. Difference of means tests (t-test), estimates based on inseason sample and mail survey sample, Kodiak,
2006...............................................................................................................................................................33 12. Difference of means tests (t-test), estimates based on inseason sample and mail survey sample, Sitka,
2006...............................................................................................................................................................34 13. Comparison of dressed weights of halibut harvested by SHARC holders, Kodiak and Sitka, 2005. ............35 14. Number of hooks usually fished, set lines, Kodiak and Sitka 2006. .............................................................36 15. Kodiak comparison of lingcod and rockfish harvests....................................................................................37 16. Sitka comparison of lingcod and rockfish harvests. ......................................................................................37 17. Responses to question: have new regulations changed fishing practices? ....................................................37 18. Responses to question: how are subsistence and sport fishing distinguished? ..............................................38 19. Reported reasons household did not meet harvest goals. ..............................................................................38 20. Reasons fishing households harvested more halibut in 2006 compared to the previous 3 years...................38 21. Reasons fishing households harvested fewer halibut in 2006 compared to the previous 3 years..................39 22. Comparison of halibut fishing effort in 2006 with previous 3 years, those respondents who did not fish....39 23. Reasons for harvesting fewer halibut in 2006 than in the previous 3 years, nonfishing households.............40 24. Reasons fishing households harvested more halibut in 2006 compared to 3 years ago. ...............................40 25. Reasons fishing households harvested fewer halibut in 2006 compared to before 2003...............................40 26. Reasons households harvested fewer halibut in 2006 compared to before 2003, nonfishing households.....41 27. Reported reasons households did not fish. ....................................................................................................41 28. Sharing of halibut harvests with other households. .......................................................................................42 29. Sharing of halibut harvested by fishing households with other households. .................................................42 30. Sources of halibut for nonfishers...................................................................................................................42 31. Trends observed in halibut stocks. ................................................................................................................42 32. Number of households using longlines and reasons for not using longlines, 2006. ......................................43 33. Number of years halibut fishers have used a longline (skate) for subsistence fishing. .................................43 34. Participation by SHARC holders less than 20 years old, subsistence halibut fishery, 2006. ........................44

iii
List of Tables, continued Table Page 35. Participation by SHARC holders 50 to 64 years old, subsistence halibut fishery, 2006. ..............................44 36. Comparison of findings: Kodiak SHARC holders with the 2006 inseason project participants as a
panel. .............................................................................................................................................................45 37. Comparison of findings: Sitka SHARC holders with the 2006 inseason project participants as a panel. .....47 38. Mean halibut harvests by gear, inseason sample and mailed returns, Kodiak and Sitka, 2006. ....................49 39. Participation in halibut fishing, inseason sample and mailed returns, Kodiak and Sitka, 2006. ...................49
LIST OF FIGURES Figure Page 1. Tape measure included with mailing to random sample, May 2006. ............................................................50 2. Disposition of random sample of SHARC holders for inseason subsistence halibut harvest project, by
SHARC type, Kodiak and Sitka. ...................................................................................................................50 3. Reasons offered for not participating in subsistence halibut inseason harvest project. .................................51 4. Response rates by year, Kodiak, subsistence halibut harvest monitoring project. ........................................51 5. Response rates by year, Sitka, subsistence halibut harvest monitoring project. ............................................52 6. Refusal rates by SHARC type, subsistence halibut harvest monitoring project. ...........................................52 7. Disposition of random sample of SHARC holders for inseason subsistence halibut harvest monitoring
project by SHARC type, Kodiak and Sitka. ..................................................................................................53 8. Comparison of 2006 estimated number of fishers, inseason, mail-out, and combined samples, Kodiak
and Sitka........................................................................................................................................................53 9. Participation rates, Kodiak, inseason sample, mail sample, and combined sample, 2006.............................54 10. Participation rates, Sitka, inseason sample, mail sample, and combined sample, 2006. ...............................54 11. Comparing 2006 estimated harvests in pounds, by gear, inseason and mail-out samples, Kodiak and
Sitka...............................................................................................................................................................55 12. Estimated subsistence halibut harvests and confidence range, set gear, inseason sample and mail-out
sample, Kodiak and Sitka, 2006. ...................................................................................................................55 13. Estimated subsistence halibut harvests and confidence range, hand gear, inseason sample and mail-out
sample, Kodiak and Sitka, 2006. ...................................................................................................................56 14. Estimated subsistence halibut harvests and confidence range, all gear types, inseason sample and mail-
out sample, Kodiak and Sitka, 2006..............................................................................................................56 15. Percentage of subsistence halibut fishers by month, Kodiak, 2004 and 2006. ..............................................57 16. Percentage of subsistence halibut harvest by month, Kodiak, 2004 and 2006. .............................................57 17. Percentage of subsistence halibut fishers by month, Sitka, 2004 and 2006. .................................................58 18. Percentage of subsistence halibut harvest by month, Sitka, 2004 and 2006..................................................58 19. Reasons for not meeting halibut harvest goals, Kodiak and Sitka, 2006.......................................................59 20. Comparing halibut harvests in 2006 with previous 3 years, Kodiak and Sitka. ............................................59 21. Source of halibut for those households that did not participate in the subsistence halibut or sport fishery
in 2006 but used halibut. ...............................................................................................................................60 22. Changes observed in halibut stocks...............................................................................................................60 23. Cumulative estimated harvests, pounds of halibut, of Kodiak respondents to mailed survey.......................61 24. Cumulative estimated harvests, pounds of halibut, of Kodiak respondents to inseason survey. ...................61 25. Cumulative estimated harvest, pounds of halibut, of Sitka respondents to mailed survey. ...........................62 26. Cumulative estimated harvest, pounds of halibut, of Sitka respondents to inseason surveys........................62 27. Ages of Kodiak SHARC holders participating in inseason project and responding to mailed survey,
2006...............................................................................................................................................................63 28. Percentage of SHARC holders fishing in Kodiak, by age group, 2006.........................................................63 29. Percentage of pounds harvested in Kodiak, by age group, 2006. ..................................................................64 30. Ages of Sitka SHARC holders participating in inseason project and responding to mailed survey, 2006....64 31. Percentage of SHARC holders fishing in Sitka, by age group, 2006. ...........................................................65 32. Percentage of pounds harvested in Sitka, by age group, 2006. .....................................................................65 33. Kodiak subsistence harvest of halibut, panel vs. mail-out.............................................................................66

iv
List of Figures, Continued Figure Page 34. Sitka subsistence harvest of halibut, panel vs. mail-out. ...............................................................................66
LIST OF APPENDICES Appendix Page A. Introductory letter..........................................................................................................................................68 B. Form 1: SHARC holder recall form, January–June 2006.............................................................................70 C. Form 2: Halibut fishing trip summary, July and August 2006. .....................................................................72 D. Measuring method.........................................................................................................................................75 E. “Pelagic and Non-Pelagic Rockfish” page from the sport fishing regulation summary booklet. ..................77 F. Form 3: SHARC holder tracking form. ........................................................................................................79 G. Form 4: Halibut harvest recording form, September–December 2006.........................................................81 H. Interview protocol. ........................................................................................................................................83

1
ABSTRACT The goal of this project was to monitor the weekly noncommercial halibut fishing activities of a random sample of holders of Subsistence Halibut Registration Certificates (SHARCs) in Kodiak and Sitka, Alaska, in July and August 2006, and to compare estimates of community harvests of halibut based on this inseason monitoring with estimates based on responses to a postal survey. In Kodiak, 303 SHARC holders participated, a sample of 18% of all SHARC holders living in the community. In Sitka, 149 SHARC holders participated, a sample of 8%. Participants recorded information about each halibut fishing trip, including the number of halibut harvested, length of the halibut, gear used, and incidental harvests of rockfish and lingcod, on forms provided by project staff. Project staff visited participants on a regular basis to collect the forms, and also conducted a summary interview at the completion of the field season. In both communities, estimated levels of participation in halibut fishing and estimated harvests were lower based on the inseason monitoring than estimates based on responses to the postal survey. The report discusses potential reasons for these differences, including how representative each sample is of all SHARC holders in the study communities as well as possible recall error. The report concludes that while project findings are not conclusive, it appears that active fishers may be overrepresented in the postal survey responses. However, the inseason project in Kodiak likely failed to include representatives of a small group of very active fishers who account for approximately 20% of the community’s total harvest according to postal survey results. The report recommends that any future inseason monitoring of subsistence fishing include a stratified sampling design based on prior years’ harvest patterns, and that a short follow-up survey of nonrespondents to the postal survey take place to determine the extent to which this group of SHARC holders participates in halibut fishing. It also recommends that, given the high response rates to the postal survey, it should continue as the primary method of developing estimates of subsistence harvest estimates in Alaska.
Key words: Pacific halibut, Hippoglossus stenolepis, subsistence harvests, SHARC, Subsistence Halibut Registration Certificate, subsistence fishing, Kodiak, Sitka, Alaska rockfish, Sebastes, lingcod, Ophiodon elongatus.
CHAPTER 1: BACKGROUND AND METHODS BACKGROUND New federal regulations providing for subsistence fishing for Pacific halibut Hippoglossus stenolepis in Alaska came into effect in May 2003 (68 FR 18145, April 15, 2003). Eligible individuals include residents of 117 rural communities and members of 123 Alaska Native tribes. Before fishing, eligible individuals must obtain a Subsistence Harvest Registration Certificate (SHARC) from the National Marine Fisheries Service (NMFS) of the National Oceanic and Atmospheric Administration (NOAA). Estimates of annual subsistence harvests are developed primarily through a postal (mail-out) survey conducted by the Alaska Department of Fish and Game (ADF&G) Division of Subsistence, funded through a grant from NOAA. Respondents estimate their subsistence halibut harvests for the previous year through retrospective recall. Statewide, response rates to the mail survey were 65% for 2003, 62% in 2004, 60% in 2005, and 59% in 2006. Annual reports provide descriptions of the project methods and present project findings for each project year (Fall et al. 2004; Fall et al. 2005; Fall et al. 2006; Fall et al. 2007).
At the outset of the subsistence halibut harvest monitoring project, staff of the International Pacific Halibut Commission (IPHC) and the Scientific and Statistical Committee of the North Pacific Fishery Management Council (NPFMC), as well as the representatives of several user organizations, recommended that a supplemental pilot project be implemented to collect subsistence harvest data inseason in order to evaluate the retrospective recall harvest estimates based on the postal survey. In response, NOAA amended an existing grant with ADF&G to fund a pilot project to collect inseason harvest data for 2006 in Sitka and Kodiak, the communities with the largest number of SHARC holders and the highest estimated subsistence harvests of halibut. Table 1 reports project findings for Sitka and Kodiak based upon the postal survey for 2003, 2004, 2005, and 2006.

2
As an early step in planning the inseason harvest monitoring project, in September 2005, ADF&G mailed a supplemental survey to SHARC holders in Sitka and Kodiak who had responded to the postal survey earlier that year. Among other things, the survey asked respondents to indicate the months in which they had harvested halibut in 2004. The supplemental survey found that about 56% of the halibut harvested by Kodiak SHARC holders and 59% of the harvest by Sitka SHARC holders were harvested in July or August. Most subsistence halibut fishers were active in at least 1 of these months. (See Fall et al. 2006:123–138 for a summary of the findings of the supplemental survey.) Therefore, project planners decided to schedule inseason data collection in Kodiak and Sitka for July and August 2006.
GOALS AND OBJECTIVES The goal of the project was to monitor the weekly noncommercial halibut fishing activities of a random sample of SHARC holders from Kodiak and Sitka during a 9 week period in July and August 2006 to develop an estimate of the subsistence harvests of halibut in each community in 2006 that could be compared with the harvest estimates derived from the postal harvest survey.
The following were the project objectives for a random sample of SHARC holders in Sitka and Kodiak:
1. Estimates of noncommercial (subsistence and sport) halibut harvests (number of fish, usable pounds of fish, gear used, location of harvest), plus incidental harvests of rockfish Sebastes spp. and lingcod Ophiodon elongatus, by day in July and August 2006, based on use of inseason data recording forms.
2. Estimates of noncommercial halibut harvests plus incidental harvests of rockfish and lingcod, from January through June 2006, based on retrospective recall interviews.
3. Estimates of noncommercial harvests of halibut, and incidental harvests of rockfish and lingcod, from September 1 through December 31, 2006, based on use of inseason harvest calendars.
4. Lengths of halibut harvested by the sample in July and August 2006, to use as the basis for calculating the round and dressed weight of the subsistence harvest.
5. Comments from participants about the subsistence halibut fishery.
6. A total estimate of the incidental harvests of rockfish and lingcod for the communities of Kodiak and Sitka based on the results pertaining to Objectives 1 through 3.
METHODS Project Planning Table 2 reports the project chronology. Discussion occurred in early 2006 with staff of NMFS, the IPHC, and the ADF&G Division of Sport Fish to review possible research designs and sampling strategies.
As another early step, ADF&G subcontracted with Bridget Easley, former Division of Subsistence Program Coordinator and coauthor of the final report for the 2004 project year (Fall et al. 2005), to prepare a recommended project plan for a pilot inseason harvest assessment project in Kodiak and Sitka for summer 2006. Provisions of the subcontract were as follows:
1. Review and comment upon the results of the surveys mailed to subsistence halibut fishers in Kodiak and Sitka in 2005; submit a written report that includes elements for a project design based upon these findings.
2. Review Division of Sport Fish research designs for inseason harvest assessments; meet with Division of Sport Fish personnel to discuss these designs.
3. Prepare a draft research design for conducting the inseason harvest assessment project in Sitka and Kodiak, based upon 1 and 2, above. The design should be developed based on a fieldwork budget of $50,000 to $60,000.

3
4. Review draft project findings.
5. Provide comments on the draft final report.
Early in project planning, researchers considered dockside surveys (creel surveys) as the primary data collection method. However, the project team rejected this approach due to the probability of a small sample size. Also, due to the multiple landing locations documented by the supplemental mailed survey and the limited budget for the project, it appeared that many subsistence fishery participants would be missed by a creel survey. Finally, there was concern that some subsistence fishers would attempt to avoid dockside interviews.
Easley completed a draft report and recommendations on April 30, 2006. Based upon these products and further discussion, division staff prepared a project operational plan, which was submitted to the staffs of NMFS, IPHC, and the Division of Sport Fish in June 2006 for their review and comment. The operational plan was finalized in the same month. The foundation of the plan was weekly collection of harvest data by a random sample of SHARC holders in each community through completion of harvest recording forms after each halibut fishing trip.
Sample Selection and Achievement In this report, “Kodiak” includes the city of Kodiak and other areas of the Kodiak Island Borough connected to the city of Kodiak by road. In 2006, the estimated population of this area was 12,703. In 2006, 1,716 Kodiak residents held SHARCs, representing 12% of all SHARC holders in the state that year. “Sitka” includes the city and borough of Sitka. This area’s estimated population in 2006 was 8,833. In 2006, 1,895 Sitka residents held SHARCs, for 13% of all SHARC holders.
The sample goal was to collect inseason harvest data from 130 SHARC holders in both Kodiak and Sitka for a total of 260 individual cases of potential halibut fishers. Because some attrition in participation in the project was expected during the 9 week interview period, the initial goal was to begin with a random sample of 150 SHARC holders in each community. These targets were based on Easley’s recommendations for achieving a confidence range for harvest estimates of ±10% at the 90% confidence level. The actual sample size was a total of 452 SHARC holders, 303 in Kodiak and 149 in Sitka, which met the sample requirements in the Easley recommendation for a confidence range of ±8% at the 95% confidence level. Confidence limits for harvest estimates in this report were produced for the 95% level.
NMFS issues 2 types of SHARCs. Members of eligible tribes may obtain a “tribal” SHARC and residents of eligible communities may obtain a “rural” SHARC. Rules governing subsistence halibut fishing are identical for holders of either type of SHARC, except that rural SHARCs must be renewed every 2 years while tribal SHARCs must be renewed every 4 years. For this project, the random sample was not stratified by SHARC type.
Sample selection proceeded as follows. All 3,611 SHARC holders in Kodiak and Sitka were assigned a random number. On June 19, 2006, ADF&G mailed an introductory letter (Appendix A) to the first 300 SHARC holders on each community’s list. A small tape measure (Figure 1), with measurements in feet and inches, was also mailed with the letter to serve as a tool for those individuals who agreed to be part of the project. No other compensation for participating was offered.
About 5 days after the mailing, starting at number 1 of each list, researchers began to systematically telephone SHARC holders to request their participation in the project. They were to continue telephoning until the target of 150 participants was reached for each community. At first, staff targeted the first 200 names on each list, but this was expanded to the entire list of 300 when, primarily because of a failure to contact individuals, it was clear that the goal of 150 would not be achieved from the first 200 names. Due a greater difficulty in contacting individuals in Sitka, telephoning continued to random number 345.
Using mailing addresses and telephone numbers, Division of Subsistence information management staff attempted to group all SHARC holders in both communities into households to avoid multiple calls to the

4
same household, if more than 1 household member had been randomly selected. This procedure was successful in most cases, except when members of the same household had different surnames or used work telephone numbers on their SHARC applications.
SHARC records yielded the birthdate of each SHARC holder, and this information was included on the lists to guide the initial telephone calls. If the randomly selected SHARC holder was under 18 years of age, researchers contacted an adult SHARC holder in the same household to obtain an informed consent to participate in the project. In no case did a household contain only SHARC holders under age 18.
Researchers attempted to call individuals on the lists at least 3 times on different days and different times of the day. At least 3 failed attempts resulted in the SHARC holder being classified as a “failure to contact,” although in some cases if a home address or work address was known, or if the person was an acquaintance of a researcher, an initial in-person contact was attempted. SHARC holders with invalid telephone numbers were also included in the “failed to contact” category if an alternate telephone number could not be obtained.
These initial telephone calls served to introduce the project to the SHARC holder and obtain informed consent to participate. In almost all cases, the SHARC holder recalled receiving the packet with the tape measure in the mail in the last few days, and most had read the letter in the packet. During the initial telephone contact, after reviewing the project details, individuals were given the option to not participate in the project. Refusal rates were 13% in Kodiak and 29% in Sitka of those contacted after the initial mailing. If the SHARC holder agreed to participate, a time and location for the first visit by a project researcher was arranged.
Table 3 reports the final sampling results. In Kodiak, attempts to contact 300 randomly selected SHARC holders resulted in members of 170 households with 303 SHARC holders agreeing to participate in the inseason harvest monitoring project. These 303 SHARC holders included 19 with random numbers below 300 who were members of households in which another member with a lower random number had agreed to participate in the project. Thus, of the original list of 300 SHARC holders, 189 (63%) participated (Figure 2). Also, 81 Kodiak households with 82 SHARC holders from the list of 300 could not be contacted (27%). Finally, 26 households with 29 of the original list of 300 declined to participate (10% of the 300 SHARC holders on the random sample list). Of the total number of individuals in Kodiak contacted by telephone or in person, the refusal rate was 13%. Researchers did not probe to learn why SHARC holders declined to participate in the project. However, when called, most individuals voluntarily offered a reason, and these were recorded. As shown in Table 4 and Figure 3, most frequently, Kodiak individuals declined to participate because they did not plan to fish (31% of all refusals [8 individuals]; 50% of those offering a reason); 12% (3 individuals) said they were ill; and 8% (2 individuals) said they were too busy to participate in the project.
In Sitka, 110 households with 149 SHARC holders participated in the project (Table 3). These 149 SHARC holders included 8 with random numbers below 345 who were members of households in which another member with a lower random number had agreed to participate in the project. Thus, of the original list of 345 SHARC holders, 118 (34%) participated (Figure 2). Also, 177 Sitka households with 181 SHARC holders from the list of 345 could not be contacted (52%). Finally, 44 households with 46 of the original list of 345 declined to participate (13% of the 345 SHARC holders on the random sample list). Of the total number of individuals contacted by telephone or in person, the refusal rate was 29%. As in Kodiak, most Sitka residents who declined to participate in the project said they did not plan to fish (36% [16 individuals] of all refusals, 57% of those offering a reason) (Table 5 and Figure 3). Illness ranked second (11% [5 individuals]) and “too busy’ ranked third (9% [4 individuals]).
The final sample of SHARC holders from which inseason harvest data were collected included all other SHARC holders in the households of the randomly selected individuals. This resulted in a larger sample size and assisted with understanding how households with multiple SHARC holders assigned harvests to individuals. Of the 1,716 SHARC holders in Kodiak in 2006, 303 (18%) were members of households

5
that participated in the inseason harvest monitoring project (Table 6). In Sitka, 149 of 1,895 SHARC holders (8%) were members of participating households.
As noted above, there are 2 types of SHARCs: rural and tribal. During data analysis of returned postal surveys, harvest estimates are developed for rural and tribal SHARC holders separately: each tribe and each set of rural SHARCs in particular communities is a stratum for data analysis (Fall et al. 2007:7–10). Estimated harvests for communities are the sum of the reported harvests and the estimated harvests of all rural and tribal SHARC holders living in each community.
In this project, the random sample selection was not stratified by type of SHARC. It was expected that the percentage of rural and tribal SHARC participants would approximate the relative distribution of types of SHARCs in Kodiak and Sitka, but this was not the case. Of the 1,716 SHARCs held by Kodiak residents in 2006, 84% were rural SHARCs and 16% were tribal SHARCs (Table 7). The composition of the random sample of 300 SHARC holders by SHARC type was similar: 83% were rural SHARCs and 17% were tribal SHARCs. However, of the 189 SHARC holders from the random sample participating in the inseason project, 89% were rural SHARC holders and 11% were tribal SHARC holders, and of the 303 SHARC holders living in participating households in Kodiak, 89% were rural SHARC holders and 11% were tribal SHARC holders. In summary, tribal SHARC holders were underrepresented in the Kodiak inseason sample. As shown in Table 8, there was a much higher no contact rate among tribal SHARC holders in the Kodiak random sample than among rural SHARC holders: 47% of the tribal SHARC holders were no-contacts, compared to 23% of the rural SHARC holders. The participation rate for Kodiak rural SHARCs in the inseason project of 68% (Figure 4) is similar to the response rates to the mailed survey for this group from 2003 through 2006 (range between 65% and 74%). In contrast, the 41% participation rate among Kodiak tribal SHARC holders was lower than the response rates in any year for the mailed survey (range between 46% and 56%). For all Kodiak SHARC holders, the participation rate for the inseason project was 63%, compared to between 64% and 70% for the 4 years of the mailed survey (Table 8 and Figure 4).1
There was greater underrepresentation of tribal SHARC holders in the final Sitka sample who participated in the project (Table 7). Of the 1,895 SHARCs held by Sitka residents in 2006, 76% were rural SHARCs and 24% were tribal SHARCs. Tribal SHARC holders were overrepresented in the random sample of 345: 72% of this group held rural SHARCs and 28% held tribal SHARCs. However, of the 118 SHARC holders from the random sample participating in the inseason project, 85% were rural SHARC holders and 15% were tribal SHARC holders. Similarly, of the 149 SHARC holders living in participating Sitka households, 84% held rural SHARCs and 16% held tribal SHARCs. As shown in Table 8, as in Kodiak, there was a much higher rate of noncontact among tribal SHARC holders in the Sitka random sample than among rural SHARC holders: 66% of the tribal SHARC holders were no-contacts, compared to 47% of the rural SHARC holders. In Sitka, participation rates for the inseason project were lower than response rates in mailed survey for both SHARC types (Figure 5). For rural SHARCs, response rates for the mailed survey have ranged between 67% and 75%, compared to a 41% participation rate for the inseason project. For tribal SHARC holders, between 59% and 90% have responded to the mailed survey; the participation rate for the inseason project was 18%. For all Sitka SHARC holders, the participation rate was 34% for the inseason project compared to between 68% and 72% for the mailed survey.2
Refusal rates also varied by community and SHARC type (Figure 6). In Kodiak 12% of contacted rural SHARC holders declined to participate in the project, compared to 22% of tribal SHARC holders, and 13% of all SHARC holders. In Sitka, 23% of contacted rural SHARC holders declined to participate as did 50% of tribal SHARC holders and 29% of all contacted SHARC holders. During a meeting of the Alaska Native Subsistence Halibut Working Group in December 2007, the working group member from 1 It should be noted that both local research assistants in Kodiak were lifelong residents of the community and both were members of an Alaska
Native tribe. 2 As noted below, the Sitka Tribe of Alaska was a partner with ADF&G in this research.
6
Sitka commented on the relatively high refusal rate in the inseason harvest monitoring project in his community. He offered 2 explanations. First, he noted that several other survey and harvest monitoring projects had taken place in the Sitka in recent years, and community members were experiencing “survey burn-out.” Second, he noted that earlier in 2006, the Alaska Board of Fisheries had failed to act on regulatory proposals submitted by the Sitka Tribe of Alaska concerning the Sitka Sound herring fishery. He said that some tribal members believed that information collected during herring harvest surveys was supportive of the proposals, and the board’s failure to adopt the proposals left these tribal members feeling frustrated about the effectiveness of collecting subsistence harvest information.
As just noted, for both SHARC types, participation rates were higher in Kodiak than in Sitka, while rates of no contact and refusals were notably higher in Sitka. A partial explanation for the higher no-contact rate in Sitka may be derived from the method of handling the initial contacts and follow-ups. In both Kodiak and Sitka, if a person did not answer the first telephone call, the staff member left a voice mail message. In Kodiak, consistent with project protocols, at least 2 follow up telephone calls took place after the voice mail message had been left. However, in Sitka, the voice mail message asked the SHARC holder to return the call if he or she agreed to participate in the project. Follow up calls did not take place. The principal investigators learned of this difference in procedure only after the fieldwork was completed.
The combination of higher rates of no contacts and refusals among tribal SHARC holders in both Kodiak and Sitka reduced the sampling fractions for this SHARC type in each project community. The 33 tribal SHARC holders participating in the project in Kodiak represent a 12% sample of all tribal SHARC holders in that community in 2006; the 270 rural SHARC holders are a 19% sample of that SHARC type in Kodiak (Table 6 and Figure 7). In Sitka, the 24 participating tribal SHARC holders are a 5% sample of all tribal SHARC holders living in Sitka in 2006, and the 125 participating rural SHARC holders are about 9% of that SHARC type in Sitka.
Data Gathering Methods At the outset of the project in late June and early July, staff interviewed participating SHARC holders about their halibut, rockfish, and lingcod harvests between January and June 2006 (See Form 1 in Appendix B). The procedure was as follows.
Form 1. SHARC Holder Recall Form, January through June 2006
This form was administered by the local researchers and ADF&G staff during the first face-to-face contact with each participant to document noncommercial (subsistence or sport) halibut fishing activity and any halibut harvests in 2006 up to the start of the inseason monitoring project; i.e., from January through June 2006. Researchers verified the identity of all SHARC holders in the households. The administration of Form 1 entailed the following steps.
1. Asked of each SHARC member in the household: “Have you done any halibut fishing so far this year?”
2. If “No,” researcher marked as such and filed Form 1 with the SHARC holder’s other forms. If the respondent offered a reason for no fishing effort, this was recorded on the back of the form. Any other comments were also recorded.
3. If “Yes,” the researcher completed the entries for each month in which halibut fishing activity took place. All halibut fishing trips for a particular month were combined.
4. If the SHARC holder successfully fished for halibut but could not recall the month, the harvest was recorded for an “unknown month” on the back of the form.
Participating halibut fishers were then given Form 2 (Appendix C) and instructed how to record their halibut, rockfish, and lingcod harvests for each halibut fishing trip they took in July and August.
Form 2. Halibut Fishing Trip Summary Form

7
Copies of these forms (printed on “Rite in the Rain”3 paper) were left with the participants in a waterproof plastic bag, along with a pencil. It was suggested that the tape measure also be kept in the plastic bag. Participants were asked to complete 1 form during each halibut fishing trip. The initial plan was for project staff to collect these forms on a weekly basis for 9 weeks, during which time researchers would also ask supplemental questions to help contextualize the data. Researchers planned to contact one-fifth (20%) of the participants each day (about 25 to 30 contacts per day); in practice, however, a more flexible routine developed (see below for detail on Kodiak and Sitka).
For each halibut, the following information was collected on Form 2:
1. Length (see Appendix D for method);
2. Estimated round (live) weight;
3. Gear used: setline (skate) or hand-operated gear (hand-held line or rod and reel);
4. Number of hooks fished;
5. Respondent’s classification of the harvest as either subsistence or sport; and
6. Location of harvest.
“Subsistence or Sport”. The participant noted whether she or he considered the harvest of the fish “subsistence” or “sport.” This was the participant’s decision. Researchers were encouraged to probe for reasons for the classification (especially if the respondent classified the harvest as “sport”) when they collected the form, and to write the responses on the back of Form 2.
Rockfish species. Each participant received a copy of an ADF&G “Rockfishes of Alaska” poster and the “Pelagic and Non-Pelagic Rockfish” page from the ADF&G sport fishing regulation summary booklet (Appendix E). Participants were advised to keep these in the plastic bag with Form 2. They were instructed that using local common names of fishes was acceptable. For each halibut fishing trip that rockfish were harvested, participants were instructed to collect the following information:
1. Species (or local common name if respondent uncertain of species);
2. Gear used: setline (skate) or hand-operated gear (hand-held line or rod and reel);
3. Number of hooks fished;
4. Respondent’s classification of the harvest as either subsistence or sport; and
5. Location of harvest.
Lingcod: Fishers were asked to record the number of lingcod harvested on each halibut fishing trip. This was recorded in a box under the project logo. No other information about lingcod was distributed or requested.
Form 3. SHARC Holder Tracking Form
Local research assistants maintained one Form 3 (Appendix F) for each participant during the 2 month monitoring season to document weekly contacts and fishing activity. Forms 3s were submitted to ADF&G in Juneau and Anchorage at the end of the inseason project in early September.
In order to complete the contact information at the top of Form 3, researchers brought a copy of this form with them when they made the first face-to-face contact with the participant. Researchers asked participants for e-mail addresses and obtained consent to contact them by e-mail.
3 Product names are given for scientific completeness or because they are established standards for the State of Alaska; they do not constitute
product endorsement.

8
At the end of inseason fieldwork in late August and early September, researchers collected all outstanding forms. They asked participants to keep a record of their noncommercial halibut fishing activities, including incidental rockfish and lingcod harvests, from September through December 2006, using a harvest calendar (Form 4; Appendix G). The procedure was as follows:
Form 4. Harvest Calendar for September through December 2006
Copies, also printed on “Rite in the Rain” paper, were left with each participant. Participants were to fill out 1 line for each halibut fishing trip taken from September–December 2006, and then mail the form to ADF&G.. Two reminder letters were sent: 1 on December 7, 2006 and 1 on January 24, 2007.
Summary Interviews When contacting participants for the last time during the inseason harvest monitoring phase of the project, researchers conducted a short “summary interview” following an interview protocol (Appendix H). Most of these interviews were conducted in person, but some were administered by telephone. Before the interview, researchers compiled all harvest information for members of the household collected over the previous 9 weeks, and verified this information at the outset of the interviews. Other topics in the summary interviews included:
1. If the fisher “sport fished” for halibut, researchers probed for reasons he or she used to classify the activity as “sport” rather than subsistence.
2. If the fisher did not fish for halibut at all, reasons were explored, and other sources of halibut recorded.
3. If there were multiple SHARC holders in the household, researchers asked how halibut, rockfish, and lingcod harvests were allocated among them on the harvest forms.
4. Researchers also asked if the fisher’s halibut fishing activities over the 2 month period were typical of other years during which he or she obtained a SHARC. If not, the fisher was asked for reasons for differences.
5. Fishers’ observations about trends in halibut abundance and condition were recorded.
Of the 170 participating households in Kodiak, 147 (86%) were interviewed at the conclusion of the project. In Sitka, 84 of the 110 participating households (76%) were interviewed.
PROJECT IMPLEMENTATION: KODIAK The Division of Subsistence hired 2 lifelong residents of Kodiak, Tanya Lee and Danya Brockman, as nonpermanent Fish and Wildlife Technicians to conduct the harvest monitoring component of the project in June through September 2006. On June 24, 5 days after the mailing of the introductory letter and tape measure, regional program manager James Fall began calling SHARC holders on the list to obtain their consent to be part of the project.
Fall traveled to Kodiak on June 28 and 29 to continue telephoning individuals on the list, to begin conducting initial interviews, and to train Lee and Brockman in project procedures. Lee and Brockman continued to work the 300-name random sample list for several more weeks, and the final sample of participants was not established until mid July.
Working out of the Kodiak ADF&G office, Lee and Brockman established a routine for systematic contacts with participants. They divided the 170 participating households equally between themselves. After the initial visit, the plan was to contact each participant weekly. However, this plan was adjusted to accommodate respondents’ schedules and to minimize respondent fatigue. Often, respondents informed researchers that they were unlikely to fish for 2 or more weeks; in these cases, an approximate future contact time was established. Usually, the first follow up contact was by telephone, either at a home or work number and either during the day or evening, based on the participant’s preference. If no halibut

9
fishing had taken place, an approximate time for the next contact was established. If halibut fishing had occurred, a time and place was arranged for the researchers to pick up the forms, although some participants preferred to drop off the completed forms at the ADF&G office. Researchers reviewed the forms for completeness and clarified any uncertainties as soon as possible. Most forms were filled out according to instructions. In some cases, a halibut fishing trip had occurred but no forms were completed. In these cases, researchers contacted the participant and completed a form based on recall, either over the telephone or through a personal interview.
All contacts and attempted contacts were logged on a Form 3 for each participating household. Files of all completed forms, organized by household identification (ID) number, were maintained in the Kodiak ADF&G office. Lee and Brockman maintained close contact with Fall in the Anchorage office. Twice over the summer Fall traveled to Kodiak to review completed forms and otherwise consult with the field staff.
Several randomly selected households with Kodiak addresses lived in remote locations, off the road system, or were engaged in commercial salmon fishing at remote locations for the entire summer. In most of these cases, project staff mailed packets of forms and instructions to these households, and these were collected in the late summer or early fall when the families returned to Kodiak. In a few cases, all contacts were by e-mail.
On August 30, Fall traveled to Kodiak to train Lee and Brockman in procedures for the summary interviews. At that time, most of the project records and completed forms were transferred to Anchorage so that data processing could begin. Lee and Brockman completed most of the wrap-up interviews and collected all Form 2s by September 30. Fall completed a few final surveys by telephone in October, and 1 participant e-mailed her responses and her final harvest data.
The 2 nonpermanent local researchers each prepared a short post-project assessment. They agreed that “Most of the people were friendly and cooperative and shared openly with [us] their fishing experiences.” Researchers needed to keep flexible hours to accommodate participants’ busy summer schedules.
PROJECT IMPLEMENTATION: SITKA ADF&G Subsistence Resource Specialists Mathew Brock, Nancy Ratner, and Mike Turek, and Graduate Intern II Morgen Smith conducted the harvest monitoring component in Sitka from June 29 through August 2, 2006. Statewide Program Manager Jesse Dizard also assisted during the first several weeks of the Sitka fieldwork. On July 3, Turek and Brock were interviewed on Sitka public radio about the project. Informational flyers were distributed in the community and staff held a public meeting to explain the project on July 6.
Under a cooperative agreement with the Sitka Tribe of Alaska (STA), ADF&G contracted the STA to provide 2 staff persons to assist ADF&G staff with telephone and face-to-face contacts and collection of harvest calendars. STA staff Robi Craig supervised Jeff Feldpausch and William Mork, who worked on the project from July 17 through September 30, 2006.
One week prior to the initial telephone contact, each potential enrollee received a packet in the mail, which was comprised of a letter about the monitoring project (Appendix A), an informational sheet about current and proposed federal subsistence halibut regulations, and a tape measure (Figure 1). Brock, Turek, Dizard, and Smith divided the list of potential participants between themselves and made initial contacts by telephone. They subsequently delivered the packets of forms and instructions to those households who agreed to participate. These initial contacts were completed by mid July.
Staff attempted to contact the 300 SHARC holders who had been sent informational packets. In the case of incorrect telephone numbers, staff attempted to find correct numbers; however, given the number of contacts, incorrect numbers were not pursued at length. In the case of telephone calls answered by voice mail, messages were left if the identity of the SHARC holder could be confirmed.

10
Meetings were arranged after an initial contact had been made. As in Kodiak, project participants received a packet with 5 copies of Form 2 (Appendix C), a rockfish identification guide (Appendix E), and a guide to measuring the fork length of a halibut (Appendix D). Researchers interviewed participants about any halibut fishing and harvests that had occurred up to that point in 2006, using Form 1 (Appendix B). Researchers created a daily scheduling calendar divided into half hour time slots, which made allowances for travel and a brief visit with participants. Meetings were generally scheduled to start between 8:00 AM and 7:00 PM. Staff attempted to meet with each participant in person to explain the forms and answer questions about subsistence halibut regulations or the project. In a limited number of cases, staff did not meet directly with respondents. In these cases, the project was explained over the telephone and a packet containing forms was left at the respondent’s home or other specified location.
On July 19, 45 additional names from the list of current SHARC holders were added to the initial list of 300. These names were added in an attempt to increase the number of respondents. None of these SHARC holders had received the informational packet. Therefore, when staff contacted them by telephone, it was necessary to provide all the project background. On July 20, five participants from the list of 45 were added to the project.
As in Kodiak, after the initial visit, researchers planned to contact each participant weekly, but this plan was adjusted to accommodate respondents’ schedules and to minimize respondent fatigue. When respondents informed researchers that they were unlikely to halibut fish for 2 or more weeks, a tentative future contact time was established. Usually, the first follow up contact was by telephone, either at a home or work number and either during the day or evening, based on the participant’s preference. If no halibut fishing had taken place, a tentative time for the next contact was established. If halibut fishing had occurred, a time and place was arranged for the researchers to pick up the forms, although some participants preferred to drop off the completed forms at the STA office. Researchers reviewed the forms for completeness and clarified any uncertainties as soon as possible. Most forms were filled out according to instructions. In some cases, a halibut fishing trip had occurred but no forms were completed. In these cases, researchers contacted the participant and completed a form based on recall, either over the telephone or through a personal interview.
All contacts and attempted contacts were logged on a Form 3 for each participating household. Files of all completed forms, organized by household ID number, were maintained in the STA office.
On July 17, Smith met with STA staff and conducted a training session about data collection procedures. On July 18, Turek and Smith met with other STA staff and conducted a second training session. Ratner returned to Sitka on July 19 and worked with STA staff until August 2, assisting with contacting participating SHARC holders and reviewing data collected up to that time. From August 3–31, STA staff contacted project participants and collected information along with ADF&G staff and checked in with ADF&G staff by telephone several times per week. Brock returned to Sitka August 26 through 31 to train and assist STA staff with final conducting the summary interviews. STA staff completed most of the these interviews and collected all Form 2s by September 30, 2006.
DATA ANALYSIS Field technicians and project managers collected, organized, and checked the trip summary forms (Form 2) for obvious errors and clarified them as necessary. The forms were sent to the Division of Subsistence information management staff in Anchorage for entry into a SQL Server database. In accordance with standard Division of Subsistence error checking procedures, the data were entered twice and any discrepancies between version 1 and version 2 were identified and corrected.
As noted previously, data analysis procedures for the postal survey include treating each eligible tribe as a stratum regardless of tribal members’ community of residence. All rural SHARC holders living in a particular community are also a stratum for estimating harvests. Initially, information management staff expected to use identical procedures to develop estimates for Kodiak and Sitka using the data collected in

11
season. However, as discussed above, tribal SHARC holders were underrepresented in the inseason sample in both communities. Also, members of 7 tribes were part of the Kodiak random sample and members of 7 other tribes were part of the Sitka random sample. The initial plan required that each tribe be treated as a separate stratum. Because of the small tribal samples, information management staff examined an alternative procedure that based community estimates on all participants’ data, regardless of SHARC type.
Information management staff examined the difference in halibut harvests between rural and tribal SHARC holders in Kodiak and Sitka by using a t-test to determine whether the difference was statistically significant. When reviewing the averages (means) of the SHARC holders participating in the inseason project as a panel, the differences between the 2 groups were not statistically significant, except for 2004. The 2004 difference, however, did not appear to have a significant effect on the harvest estimate. To be sure, further analysis was made of the 2004 dataset for all residents of Sitka and Kodiak. The result was some statistical difference, but the effect on the harvest estimate was minimal. The practical outcome of these tests indicated that minimal benefit is achieved by stratification of harvest by SHARC holder type in Kodiak and Sitka. The sample was drawn by randomly selecting SHARC holders from the communities at large, so no bias can be introduced by combining the 2 groups and comparing estimates for communities.
Therefore, from the data reported for each community, the average harvest by SHARC holder (regardless of SHARC type) was calculated for each day of the survey period, which was July 1 through August 31. This daily mean harvest was then applied to the community’s SHARC holders who were not surveyed, and a community harvest estimate was calculated based on this expansion.
To evaluate the validity of the methods used for the annual mail-out survey, the results of this inseason survey (the “inseason sample) were compared to the harvest estimates generated from the mail-out survey for 2006 (“the mail sample”), as well as for 2005, 2004, and 2003. Estimates for Kodiak and Sitka from the postal survey for 2003 through 2005, as well as the “combined sample” of inseason participants and mailed survey respondents, were calculated without stratifying by SHARC type. Therefore, the harvest estimates generated for this project differ slightly, but not significantly, from previously published harvest estimates. Another analysis was performed using the 2006 inseason participants as a panel to compare with other SHARC holders who responded to the mail survey in 2003–2005. To identify potential bias in the inseason or mail survey responses, the distribution ages of project participants were compared with those of all SHARC holders in the project communities. We also examined the range of harvests reported by households participating in the inseason project to determine if the relatively small sample failed to include households that harvest subsistence halibut in large quantities. Statistical tests were conducted to identify significant differences between the sets of results.
PRODUCTS 1. Interim oral reports for NPFMC (December 2006) and IPHC (January 2007), focusing on project
methods.
2. Oral reports with some preliminary findings presented at a meeting of the Alaska Native Subsistence Halibut Working Group (ANSHWG) in December 2007, the NPFMC (December 2007), and the IPHC (January 2008).
3. This final report with project findings, completed in May 2009.
CHAPTER 2: FINDINGS ESTIMATES OF PARTICIPATION IN 2006 Table 9 and Table 10 report estimated participation in the subsistence halibut fishery in Kodiak and Sitka, respectively, in 2006 based upon 3 samples: those SHARC holders who participated in the inseason

12
harvest monitoring project (the “inseason sample”); those SHARC holders who returned the mailed survey form (the “mail-out sample”); and a “combined sample” of participants in the inseason project and respondents to the mailed survey.
Based upon the inseason surveys, the estimated number of Kodiak residents who participated in the subsistence halibut fishery in 2006 was 747, including 581 who fished with set gear and 495 who fished with hand-held gear (Table 9 and Figure 8). Of all Kodiak resident SHARC holders, again based on the inseason survey findings, 44% participated in the subsistence halibut fishery in 2006, including 34% who used set gear and 29% who used hand-held gear (Figure 9).
Estimates of participation in the subsistence halibut fishery by Kodiak residents in 2006 based on responses to the mailed survey were higher. An estimated 1,048 Kodiak SHARC holders participated in the subsistence fishery (61% of all Kodiak resident SHARC holders), including 935 in who used set gear (54%) and 734 who used hand held gear (43%) (Table 9 and Figure 9).
Combining the 2 samples provided an estimate of 967 Kodiak residents who participated in the subsistence halibut fishery in 2006, 67% of all Kodiak SHARC holders. Of these, 840 fished with set gear (49%) and 662 fished with hand held gear (39%) (Table 9 and Figure 9).
In contrast to Kodiak, the inseason sample in Sitka had slightly higher rates of participation in halibut fishing in 2006 than did respondents to the mail survey (Table 10 and Figure 8). Based upon the inseason sample, an estimated 973 Sitka SHARC holders subsistence fished for halibut in 2006, 51% of all Sitka SHARC holders. This included 948 who used set gear (50%) and 286 who used hand held gear (15%) (Figure 10). Although responses to the mail survey resulted in a higher estimate of subsistence fishers who used hand held gear (419; 22% of all Sitka SHARC holders), estimates of subsistence fishers who used set gear (856; 45%) or any subsistence gear (910; 48%) were lower. The combined sample for Sitka provided an estimate of 917 subsistence halibut fishers in Sitka in 2006 (48% of all SHARCs), including 867 who used set gear (46%) and 406 who used hand held gear (21%).
In both Kodiak and Sitka, the inseason sample resulted in a lower estimate of SHARC holders’ participation in the sport halibut fishery in 2006 than did the responses to the mail survey. For Kodiak, the estimated number of participants in the sport fishery based on the inseason sample was 325 (19%), compared to 684 (40%) based upon the mailed returns (Table 9 and Figure 9). In Sitka, 8% of the participants in the inseason monitoring project sport fished for halibut, for a community estimate of 152 fishers, compared to 23% of the mailed returns, a community estimate of 442 sport fishers (Table 10 and Figure 10).
Finally, based upon the inseason sample, an estimated 901 Kodiak SHARC holders participated in any noncommercial halibut fishery in 2006 (either the subsistence fishery or the sport fishery or both), 53% of all Kodiak SHARC holders (Table 9 and Figure 9). The estimated participation was higher based on the mailed survey: 1,236 halibut fishers (72%). Combining the 2 samples provides an estimate of 1,146 SHARC holders who fished for halibut in 2006 (67%).
In Sitka, in contrast, estimates of participation of SHARC holders in either the subsistence or sport fishery (or both) were similar using either sample. Based on the inseason sample, an estimated 1,099 Sitka SHARC holders fished noncommercially for halibut in 2006 (58%), compared to an estimate of 1,048 fishers based on the mailed returns (55%) (Table 10 and Figure 10). Combining the 2 samples gives an estimate of 1,054 Sitka SHARC holders who fished for halibut in 2006 (56%).
ESTIMATES OF HARVESTS IN 2006 Table 9 and Table 10 report estimated harvests in the subsistence halibut fishery in Kodiak and Sitka in 2006 based upon the 3 samples: the “inseason sample” (those SHARC holders who participated in the inseason harvest monitoring project); the “mail-out sample” (those SHARC holders who returned the

13
mailed survey form); and a “combined sample” of participants in the inseason project and respondents to the mailed survey.
The estimated subsistence harvest of halibut by SHARC holders living in Kodiak in 2006 was lower based on the inseason harvest monitoring project compared to the estimate based on returns of the mailed survey (Table 9, Figure 11, and Figure 12). Based on the inseason sample, the subsistence harvest of halibut was 69,009 lb (±24%) with set line gear and 53,465 lb (±27%) with hand held gear, for a total estimated subsistence harvest of 122,474 lb (±19%). In comparison, the harvest estimate based on the mailed survey returns was 169,058 lb (±7%) with set line gear and 70,178 lb (±9%) with hand held gear, for a total estimated subsistence harvest of 239,336 lb (±6%). Combining the 2 samples results in an estimated subsistence harvest of halibut in Kodiak in 2006 of 142,194 lb (±5%) with set line gear, 65,763 lb (±5%) with hand operated gear, and a total subsistence harvest of 207,957 lb (±4%).
On average, participants in the inseason project in Kodiak reported an average harvest of 4.3 halibut with set line gear and 4.6 halibut with hand held gear, and an average of 6.4 halibut for all participants in the subsistence fishery (Table 9). Mail survey respondents who fished reported higher harvests: 7.5 halibut per fisher with set lines, 4.6 halibut per fisher with hand held gear, and 9.9 halibut for subsistence fishers with either gear type. The combined sample of fishers averaged a harvest of 6.9 halibut with set line gear, 4.7 with hand held gear, and 9.2 halibut in the fishery overall.
Based on the inseason project findings, the estimated harvest of halibut classified as “sport harvests” by Kodiak SHARC holders in 2006 was 29,796 lb (±29%) (Table 9). The estimated sport harvest based on the mailed survey returns was higher: 81,518 lb (± 8%).
Estimated halibut harvests for Sitka in 2006 based on the inseason project and the mailed survey returns were closer than for Kodiak. Based upon the inseason sample, the estimated harvest of halibut by Sitka SHARC holders with set line gear was 121,821 lb (±33%), compared to an estimate of 148,597 lb (± 8%) based on the mailed survey responses (Table 10, Figure 11, and Figure 12). For hand held gear, the harvest estimate was 4,625 lb (±63%) based on the inseason sample and 19,822 lb (±10%) based upon the mailed survey returns. The total subsistence harvest of halibut by Sitka SHARC holders in 2006 based on the inseason project was 126,446 lb (±32%) compared to 168,419 lb (±8%) based on the mail survey. Combining the 2 samples results in a subsistence harvest estimate for Sitka in 2006 of 163,576 lb (±6%), including 145,508 lb (±6%) with set line gear and 18,069 lb (±8%) with hand held gear.
On average, participants in the inseason harvest monitoring project in Sitka reported an average harvest of 4.7 halibut for those who fished with set line gear and 0.9 halibut for those who used hand held gear, and an average of 4.8 halibut for all participants in the subsistence fishery (Table 10). Mail survey respondents who fished reported higher harvests: 6.8 halibut per fisher with set lines, 2.9 halibut per fisher with hand held gear, and 7.7 halibut for subsistence fishers with either gear. The combined sample of fishers averaged a harvest of 6.5 halibut with set line gear, 2.7 with hand held gear, and 7.4 halibut in the fishery overall.
Based upon the inseason sample, Sitka SHARC holders harvested 22,762 lb (±96%) of halibut they classified as sport caught (Table 10). The harvest estimate based on the mailed returns was 23,935 lb (7%).
A t-test was performed to determine if the differences between the subsistence halibut harvest estimates based upon the inseason harvest monitoring project and the responses to the mail survey were statistically significant (Table 11 and Table 12). For Kodiak, there were statistically significant differences between the estimates for halibut harvests by fixed gear and total subsistence harvests of halibut. The difference between the estimates of pounds harvested by hand-line was not statistically significant (Figure 11, Figure 12, Figure 13, and Figure 14). In contrast, for Sitka, most of the differences between subsistence halibut harvest estimates were not statistically significant. The only exception was the estimated harvest of pounds of halibut by hand-line (Figure 11, Figure 12, Figure 13, and Figure 14).

14
AVERAGE WEIGHTS OF HALIBUT In both communities, the average dressed weight of harvested halibut as estimated based on measurements of length made by participants in the inseason project was higher than the average weight of halibut based on the mailed survey returns (Table 13). In Kodiak, the average weight was 25.2 lb per fish (±5%) in the subsistence fishery based upon the inseason sample compared to 22.8 lb per fish (±2%) based upon the mailed survey returns. In Sitka, subsistence-harvested halibut averaged 26.0 lb (±9%) dressed weight based on the inseason sample and 22.9 lb (±2%) based on the mailed survey returns.
TIMING OF HARVESTS In Kodiak, most SHARC holders who participated in the subsistence halibut fishery in 2006 fished in July (46%), August (38%), June (33%), or September (25%) (Figure 15). This was a very similar pattern to that documented by the supplemental mailed survey for 2004, which indicated that 45% of subsistence halibut fishers fished in July, 37% fished in August, 26% fished in June, and 18% fished in September.
The timing of subsistence halibut harvests in Kodiak in 2006 mirrored the pattern for fishing effort, and was similar to the earlier findings for 2004 (Figure 16). Of all halibut harvested in the subsistence fishery in 2006, 27% were caught in July, 24% in August, 20% in June, and 14% in September. In 2004, most halibut harvested in the subsistence fishery were also caught in July (33%), followed by August (23%), June 17%), and September (13%).
Findings were similar for Sitka (Figure 17). In 2006, 45% of Sitka subsistence halibut fishers fished in July, 39% in June, and 17% in August. May was an important month for subsistence halibut fishing in Sitka than in Kodiak; 23% of Sitka subsistence fishers fished in May, and 21% fished in September. Patterns were similar in 2004: 45% of subsistence halibut fishers fished in July, 37% in August, 30% in June, 14% in May, and 11% in September.
The percentage of the subsistence halibut harvest by month tracked the timing of fishing effort in Sitka in 2006 (Figure 18). Thirty percent of the harvest occurred in July, 25% in June, 15% in August, 9% in may, and 6% in September. In 2006 there was also some harvest in March (7%) and January (4%), in contrast to 2004 when very little subsistence halibut harvest was reported in those months. Another difference between 2006 and 2004 was the greater significance of subsistence halibut harvests at Sitka in August (28% of the total) in 2004 and a lesser percentage of the harvest in June (19%). As in 2006, July ranked first again in 2006, with 30% of the total harvest.
NUMBER OF HOOKS USED In both the inseason project and the postal survey, respondents who fished for halibut in the subsistence fishery with longlines were asked to report the number of hooks they usually fished. In Kodiak, data were missing for 21% of subsistence longline fishers (Table 14). However, “30 hooks” was the most frequent response for both inseason project participants (24%) and respondents to the mail survey (30%). “Twenty hooks” ranked second among mail survey respondents (22%) while “20 hooks” (8%) and “15 hooks” (8%) ranked second among inseason project participants.
INCIDENTAL HARVESTS OF ROCKFISH AND LINGCOD In both the inseason project and the postal survey, respondents were asked to report the number of rockfish and lingcod they harvested while subsistence fishing for halibut. In both communities, estimated incidental harvests of rockfish and lingcod were lower based on the inseason harvest monitoring than estimates based on the mail survey responses. In Kodiak, an estimated 416 rockfish and 46 lingcod were harvested incidentally in the subsistence halibut fishery based on the inseason project, compared to 2,739 rockfish and 423 lingcod based on mail survey returns (Table 15 and Table 16). In Sitka, the estimated incidental harvest of rockfish was 758 and 659 of lingcod based on the inseason project findings, compared to 4,701 rockfish and 1,084 lingcod based on the mail survey returns.

15
FINDINGS FROM THE SUMMARY (POST-FISHING) INTERVIEWS Have the new regulations changed your fishing practices?
Respondents to the summary interviews were asked if “the new subsistence halibut fishing regulations (in effect since 2003) changed your halibut fishing practices.” Of the 70 respondents to this question from Kodiak, 40 (57%) said yes. Of these respondents, most cited the opportunity to use a longline with up to 30 hooks as the reason for the change (68%), and 25% commented that their subsistence halibut fishing has been more efficient since the new rules came into effect (meaning that they are able to achieve their harvest goals in fewer fishing trips or in less time per trip). Only 1 Kodiak respondent said they were fishing more due to the regulatory changes (Table 17).
Of the 25 respondents from Sitka, 20 (80%) said that their subsistence halibut fishing has changed since the new rules came into effect. As in Kodiak, most Sitka respondents with changed subsistence halibut fishing practices cited the legalization of longlines with up to 30 hooks (80%) and increased efficiency (32%) as the primary changes (Table 17).
How do you distinguish between subsistence fishing and sport fishing for halibut?
In the summary interview, those households that had fished for halibut with hand held gear (rod and reel or jigging with a handline) were asked “how do you distinguish between subsistence fishing and sport fishing for halibut” (Table 18). Of the 81 valid responses in Kodiak, the most (26 respondents, 32%) said that the type of gear used is the distinguishing feature. For them, rod and reel is “sport gear” even if it may be used by SHARC holders for subsistence fishing without a sport fishing license. In Kodiak, 22 respondents (27%) cited “culture or lifestyle” to distinguish subsistence and sport activities. For these households, fishing as part of a family or cultural tradition or to harvest fish for a significant portion of the diet or for sharing, defined the activity as “subsistence” regardless of the type of gear that was used. For 16 Kodiak respondents (20%), who they were fishing with determined whether the activity was “subsistence” or “sport.” Fishing with a rod and reel with friends or relatives from an urban area or another state (persons not qualified to obtain a SHARC) was “sport fishing” for these respondents. However, fishing with their local family members with a rod and reel “to put food on the table” was classified as subsistence fishing. For 13 Kodiak respondents, sport fishing and subsistence fishing were distinguished by harvest goals. Fishing with a rod and reel to harvest 1 or 2 halibut is sport fishing but fishing for a larger harvest to contribute to a future supply of food or to fulfill social obligations to share is subsistence fishing.
In Sitka, there were 15 responses to this question. As in Kodiak, the most respondents in Sitka (9; 60%) said that the choice of gear distinguishes sport and subsistence fishing: rod and reel is “sport gear.” Two households (13%) cited cultural and lifestyle factors to contrast subsistence and sport fishing, and 1 respondent cited “social” factors (who you fish with) (Table 18).
As noted in Chapter 1, participants in the subsistence halibut fishery in 2004 in Kodiak and Sitka were sent a supplemental survey in October 2005 in an early phase of this inseason harvest monitoring project. One of the questions asked respondents to explain how they distinguish between subsistence and sport fishing for halibut (Fall et al. 2006:131). Of 113 respondents in Kodiak, 59% distinguished the 2 based on the type of gear used, as did 82% of 82 respondents in Sitka. Again, fishing with rod and reel was classified solely as sport fishing by these respondents. Also, 18% of the Kodiak respondents in this supplemental survey used “social” factors, primarily based on their relationship to their fishing partners, to distinguish the 2 activities, as did 5% of the Sitka respondents. In Kodiak, 12% contrasted subsistence and sport fishing based on the quantity of the harvest; this was a factor for 6% of Sitka respondents. Finally, 7% of respondents in Kodiak and 7% in Sitka said the cultural and lifestyle factors define halibut fishing as a subsistence activity regardless of the type of fishing gear that is used.
Did households meet halibut harvest goals in 2006, and if not, why not?

16
Respondents to the summary interview who had fished in 2006 were asked if they had met their harvest goals for halibut. If they answered no, they were asked why. In Kodiak, 34 of 88 respondents (39%) said their harvest goals had been met, and 54 respondents (61%) said their goals had not been met (Table 19). Of those Kodiak fishers who had not met their halibut harvest goals, most said they had been “too busy” in 2006 or had not had enough time (33%) (Figure19). An equal percentage (33%) said they had “not yet” met their goals but still planned to fish. Other frequently cited reasons for not meeting harvest goals included poor fishing or a lack of fish (17%), bad weather (15%), and boat or other equipment problems (6%).
In Sitka, 18 of 45 respondents (40%) met their halibut harvest goals and 27 respondents (60%) did not (Table 19). As in Kodiak, being “too busy” or not having enough time was the primary reason given by Sitka fishers for failing to harvest enough halibut (56% of those not meeting harvest goals) (Figure 19). Bad weather ranked second (26%), poor fishing/lack of fish and boat or other equipment problems tied for third (15% each), and personal health reasons was the fifth most common explanation (11%). Fifteen percent of Sitka respondents had not yet met their harvest goals but planned to fish sometime in the remainder of 2006.
Comparison of halibut harvests in 2006 with “the previous 3 years” and reasons for differences
All respondents to the summary interview who had harvested halibut in 2006 were asked to compare the size of their harvests with those of “the previous 3 years” (2003–2005, the other years since the new federal subsistence halibut regulations came into effect). Of the 60 Kodiak halibut fishers who responded to this question, 11 (18%) said their harvests in 2006 were higher than in the previous 3 years, 7 (12%) said harvests in 2006 were about the same as the other years, and 42 (70%) said harvests were lower in 2006 than in the other years (Table 20, Table 21, and Figure 20). Of those Kodiak fishers who harvested more halibut in 2006, most (46%) said this was the result of “better fishing” (more fish available); 18% said they increased their harvest effort in 2006 and 18% said improved equipment resulted in a higher harvest in 2006. Of those Kodiak fishers who harvested fewer halibut in 2006 than in the previous 3 years, most (62%) said the decline was a consequence of their having “no time to fish” or being “too busy.” Other reasons for lower harvests by Kodiak fishers included “poor fishing” (scarcity of fish to harvest) (29%) and poor weather (14%).
Of the 28 Sitka fishers who responded to this question, 9 (32%) said their harvests in 2006 were higher than in 2003–2005, 3 (11%) said harvests in 2006 were about the same as the other years, and 16 (57%) said harvests were lower in 2006 than in the previous 3 years (Table 20, Table 21, and Figure 20). Of those Sitka fishers who harvested more halibut in 2006, most (78%) said this was the result of an increase their harvest effort. For those Sitka fishers who harvested fewer halibut in 2006 than in the previous 3 years, 4 explanations were most frequently cited, each with 31%: having “no time to fish” or being “too busy;” “poor fishing” (scarcity of fish to harvest); poor weather; and boat or other equipment problems.
Those SHARC holders who did not fish for halibut in 2006 were also asked to compare 2006 with the prior 3 years (Table 22). In Kodiak, 56% of the respondents said they harvested fewer halibut in 2006 than in the other years since the new subsistence regulations came into effect; 19% said their harvest was the same (meaning that they had no harvests over this 4 year period). Being “too busy” was the primary reason Kodiak respondents gave for lower harvests in 2006 (70% of all respondents with lower harvests) (Table 23).
In Sitka, 34% of respondents who did not fish for halibut in 2006 said their harvest was less than in the previous 3 years (Table 22); 22% said their lack of harvest in 2006 was typical of their halibut fishing since 2003. Of those Sitka respondents who did not fish in 2006 and therefore harvested fewer fish than in the previous 3 years, 64% said they were “too busy” to fish in 2006 (Table 23).
Comparison of halibut harvests in 2006 compared to before 2003 and reasons for differences

17
All respondents to the supplemental survey were asked to compare their halibut harvests in 2006 to the years “before the new subsistence regulations came into effect (before 2003).” Of those respondents in Kodiak who fished in 2006, 40% said their harvests were higher in 2006 than before the new subsistence regulations were in place, 23% said their harvests were lower, and 37% said that their harvests were about the same (Table 24 and Table 25). Most Kodiak halibut fishers with higher harvests attributed the change to the new subsistence halibut regulations (58% of those with higher harvests); “more effort” accounted for increased harvests for 24%. For those Kodiak fishers whose halibut harvests had declined, the most (26%) said they were “too busy” to fish as much in 2006.
In Sitka, 47% of summary interview respondents who fished in 2006 said their harvests were higher in 2006 than prior to 2003 and, of these, 43% cited the new subsistence regulations as the reason for the increase and 21% said their effort had increased (Table 24). For 23% of the Sitka respondents who fished in 2006, there was a decline in halibut harvests since the years before 2003 (Table 19). Reasons for the change included being “too busy” and poor fishing conditions. For the remaining 30% of Sitka respondents who fished in 2006, harvests in 2006 were about the same as in the years before 2003.
In Kodiak, of the 59 respondents to the summary interviews who did not fish for halibut in 2006, 11 (19%) said their harvests were lower than before 2003 (Table 26). The most frequent reason for the decline was being “too busy.” In Sitka, of the 32 respondents to the summary interview who did not fish for halibut in 2006, 3 (9%) said their harvests were lower than before 2004 (Table 26). One these, one respondent was now “too busy” to fish and another cited a unspecified regulatory change.
Reasons the SHARC holders did not fish for halibut in 2006
When the summary interview was conducted in September 2006, households that had not yet fished in 2006 were asked why. In a few cases, households indicated they still planned to fish, and if they did so, and provided a response to the final mailed survey, they were not included in this analysis.
In Kodiak, 59 summary interview respondents did not fish in 2006 (Table 27). The most common reason they gave was that they were “too busy” or “had no time’ (51% of respondents). Equipment problems (17%), personal health or injuries (10%), and poor weather (7%) were the other most frequently offered explanations. In Sitka, of 32 respondents who did not fish in 2006, “too busy” or “had no time” was also the most frequent reason for not subsistence fishing for halibut, offered by 41% of the respondents who did not fish. Boat or other equipment problems ranked second in Sitka with 31% of respondents, and bad weather ranked third with 9%. In Kodiak, 20% of respondents who did not fish did not provide a reason, and explanations for not fishing were lacking for 56% of the Sitka respondents.
Did the household share halibut in 2006? If so, with how many other households?
In Kodiak, 40% of the summary interview respondents shared halibut with persons living in other households (Table 28). On average, Kodiak respondents who shared gave halibut to about 4 other households, with a range of 1 to 50 households. In Sitka, 35% of respondents shared halibut with other households, sharing with an average of about 3 households with a range of 1 to 8 households.
In both communities, there was a higher percentage of sharing by households that fished for halibut in 2006 (Table 29). In Kodiak, 56% of fishing households shared halibut with other households, as did 54% of the fishing households in Sitka.
Sources of halibut for those households that did not fish
Summary interview respondents who did not harvest halibut through their own subsistence fishing or sport fishing in 2006 were asked if their family had used halibut in the project year and if so, how they had obtained the halibut (Table 30). In Kodiak, 49% of the nonfishing households had used halibut in 2006. Most frequently, these households received halibut as gifts from other households: 41% of all nonfishing households and 83% of nonfishing households that used halibut received gifts of halibut (Table 30 and Figure 21). About 12% of these households, and 24% of those who used halibut, removed

18
fish from their commercial harvests for their household’s use. Finally, 7% of the nonfishing households in Kodiak, and 14% of those that used halibut, purchased fish directly from local commercial fishers. None of the survey respondents from Kodiak purchased halibut in a store.
In Sitka, 38% of summary interview respondents did not participate in the subsistence or sport halibut fishery (Table 30). Of these nonfishing households, 47% used halibut in 2006. All of these households received halibut from other households; none used halibut that they removed from their commercial catch or purchased halibut from a commercial fisher or in a store (Table 30 and Figure 21).
Trends in halibut stocks
Respondents to the summary interviews were asked if they have observed “any trends in the halibut stocks in the areas where you fish.” If they said “yes,” they were asked to characterize the change. About 37% of survey respondents in Kodiak and 42% in Sitka reported observing changes (Table 31). In Kodiak, the most frequently observed changes were changes in size and changes in abundance (30% of all respondents and 80% of respondents who had observed a change reported these changes). Of those respondents who indicated a change in size the halibut, 85% said the fish had gotten smaller, 9% said they were larger, and 6% did not indicate the direction of change. Of those that stated that a change in the number of halibut had occurred, 61% said there were fewer fish, 36% said there were more, and 3% did not indicate the direction of the change. Additionally, of those Kodiak respondents who had observed a change, 49% said changes in the location of halibut had occurred, 22% reported changes in the seasonally availability of halibut, and 44% reported other kinds of changes (Figure 22). “Other changes” included the condition of halibut (such as reporting fish as “mushy”) and changes in the presence of other species such as sharks or salmon.
In Sitka, change in the abundance of halibut was the most frequently mentioned trend (17% of all supplemental survey respondents, 66% of respondents who reported a change) (Table 31 and Figure 22). Of these respondents, 74% said that fewer halibut were available, 22% said that the number of halibut had increased, and 4% did not state the direction of change in abundance. Also, 51% of those who had observed changes said there had been shifts in where they could locate halibut, 46% said there have been changes in the size of halibut, 29% said the seasonal availability of halibut had changed, and 26% reported other types of changes. Of those Sitka SHARC holders who said the size of halibut has changed, 88% said the fish are smaller, 6% said they are larger, and 6% did not indicate a direction of change.
Use of longlines (skates)
Respondents to the summary interview were asked about their use of longlines (skates, set gear) in the 2006 project year and in the past. Of the 147 respondents in Kodiak, 46 (31%) used longlines for subsistence halibut fishing in 2006 and 67 (46%) had experience in using longlines, including participation in the commercial halibut fishery (Table 32). Most respondents who did not use longlines did not know this type of gear (18%) or found that using a rod and reel was adequate to meet their harvest goals (11%). Most Kodiak subsistence halibut fishers who used longlines had only done so since 2003, the year that this gear was legalized in the subsistence fishery (Table 33).
Of the 84 respondents to the summary interviews in Sitka, 38 (45%) used longlines in 2006 and 43 (51%) had experience with this gear type (Table 32). Reasons for not using longlines were missing for most Sitka interview respondents. About 10% of Sitka SHARC holders who were interviewed and had used longlines had 5 or more years of experience with this gear, but as in Kodiak, most had only used longlines since the new regulations came into effect in 2003 (Table 33).

19
CHAPTER 3: DISCUSSION, CONCLUSIONS, AND RECOMMENDATIONS
DISCUSSION The previous chapter noted that the inseason harvest monitoring project generally resulted in lower estimates of participation in the subsistence halibut fishery and lower estimates of subsistence harvests of halibut in 2006 in Kodiak and Sitka than did responses to the mailed survey. Differences were more marked in Kodiak than in Sitka. This chapter discusses some possible explanations for the different estimates. These include differences between the inseason sample and the respondents to the mailed survey, assumptions about the fishing patterns of nonrespondents to the mailed survey, and the potential of recall error in the mailed survey.
Representation of Highly Productive Harvesters in the Sample One explanation of the lower estimated harvests of subsistence halibut based on the inseason project concerns potential underrepresentation of highly productive harvesters in the inseason sample. Subsistence halibut fishing is a specialized activity; typically, as in most other subsistence fisheries and subsistence hunts (Wolfe 1987), a relatively small portion of all fishers produce most of the harvest. An underestimation of subsistence harvests in a community will result if these high harvesters are absent or underrepresented in the sample.
Based upon responses to the mail survey, 30% of Kodiak respondents accounted for 77% of the subsistence harvest of halibut in 2006 (Figure 23). Among the participants in the inseason project, 20% of the participants harvested 77% of the halibut (Figure 24). Therefore, specialization in subsistence halibut fishing in Kodiak was documented in both samples.
However, in Kodiak, 3% of mail survey respondents had harvests of 800 lb or more and accounted for 22% of the community’s harvest. No Kodiak participants in the inseason study had harvests above 800 lb. This comparison suggests that the inseason study failed to include representatives of the most productive segment of subsistence fishers in Kodiak. This would result in an underestimation of the total subsistence halibut harvest in the community.
In Sitka, 22% of mail survey respondents accounted for 80% of the total halibut harvest in 2006 (Figure 25). Of inseason participants, 24% harvested 80% of the harvest (Figure 26). In contrast to Kodiak, both Sitka projects included fishers who contributed a relatively large portion of the total community harvest. Of mail survey respondents from Sitka, 1% harvested more than 800 lb of halibut each, accounting for 23% of the community total. Of inseason study participants, 1% harvested more than 800 lb each and accounted for 19% of the total. This suggests that the Sitka inseason sample may have been more representative of the range of subsistence halibut harvesters than was the inseason sample for Kodiak.
Composition of the Samples by Age of SHARC Holders In both Kodiak and Sitka, SHARC holders less than 20 years of age were underrepresented in the mail survey responses but made up a larger portion of the participants in the inseason project (Table 34). In Kodiak in 2006, 10% of SHARC holders were less than 20 years old and they accounted for 8% of all mail survey returns but were 20% of the participants in the inseason study (Figure 27). For those Kodiak SHARC holders under age 20 who returned mailed surveys, 64% fished but accounted for just 4% of the total subsistence harvest of halibut (Table 34, Figure 28, and Figure 29). According to the results of the inseason project, 37% of this age group fished, for 8% of the total harvest by Kodiak residents.
These findings for Kodiak suggest that a low response rate in the mail survey by SHARC holders under age 20 may result in an overestimation of community harvests. The mail survey respondents under age 20 appear to be more likely to fish than nonrespondents from the same age group, based upon comparisons

20
with the group of SHARC holders under age 20 who were part of the inseason project, and therefore SHARC holders under 20 who fish are overrepresented in the mail survey responses. A possible explanation for this finding is that many households with multiple SHARC holders of 2 or more generations report the household’s harvests in the returned surveys of the parents but do not return the children’s forms unless the children are active fishers. Because the children’s forms are not returned, these SHARC holders are treated like other nonrespondents when estimated harvests for their community are calculated (assigned the mean value of those SHARC holders who responded to the survey), rather than nonfishers with no harvest. The inseason project appears to have resulted in a more thorough documentation of the fishing patterns and harvests of SHARC holders under age 20 by focusing on the collection of harvest data at the household level as well as the level of individual SHARC holder.
In Sitka, returns of the mail survey by SHARC holders less than 20 years of age represented 8% of all returns, compared to 9% of all SHARCs. Fifteen percent of the participants in the inseason project were in this age group (Table 34 and Figure 30). Unlike Kodiak, SHARC holders under 20 had a higher fishing rate in the inseason study (50%) compared to the mailed surveys (34%). They accounted for 10% of the total harvest as estimated in the inseason project, compared 3% as estimated from responses to the mail survey (Table 34, Figure 31, and Figure 32). In contrast to Kodiak, this finding for Sitka suggests that underrepresentation of younger SHARC holders in Sitka in the mail survey returns may result in an underestimation of the harvest.
In both communities, SHARC holders between 50 to 64 years of age were more likely to respond to the mail survey than other SHARC holders (Table 35). In Kodiak, 28% of SHARC holders in 2006 were in the age range, but they represented 36% of respondents to the mail survey (Figure 27). This age group was highly likely to fish (75%) and accounted for 39% of the total subsistence halibut harvest in Kodiak in 2006 according to the mail survey results (Figure 28 and Figure 29). This age group was underrepresented in the inseason study, at 24% of participants; of this group, 52% fished and they accounted for 31% of the harvest, according to the inseason findings. For Kodiak, these findings suggest that SHARC holders from 50 to 64 years of age harvest halibut at a higher rate than the community average and are more likely to respond to the mail survey, which may result in an overestimation of the community harvest. In the inseason project, this age group was underrepresented in Kodiak; consequently, the community estimate based solely on the inseason findings is perhaps too low.
Compared to Kodiak, there was more similarity between projects in Sitka in terms of the representation of SHARC holders from 50 to 64 years of age. Of all SHARC holders in Sitka in 2006, 29% were in this age group, compared to 33% of the respondents to the mail survey and 30% of participants in the inseason study (Table 35 and Figure 30). According to the mail survey results, 59% of the SHARC holders in this age group in Sitka fished for halibut in 2006, accounting for 28% of the total community harvest (Figure 31 and Figure 32). Based on the inseason harvest monitoring project, 67% of this age group fished, and they harvested 32% of the community total.
Inseason Sample as a Panel In Table 36 and Table 37, subsistence halibut harvests and levels of participation in the fishery are estimated for Kodiak and Sitka, respectively, for 2003, 2004, and 2005, based upon the responses to the mailed survey for those years by the SHARC holders who participated in the 2006 inseason project. These estimates, based on the panels of respondents from the 2006 inseason project, are compared with estimates based upon the remainder of responses to the mail survey in 2003, 2004, and 2005. The goal of this analysis is to assess how the inseason project participants’ responses for 2006 compare to their responses to the mailed survey in earlier study years. This analysis also explores how representative the 2006 inseason sample is of the larger group of subsistence halibut fishers in each community.
In Kodiak, estimated subsistence harvests of halibut based on the panel of inseason project participants were lower than harvests by the rest of mail survey respondents in each study year (Figure 33). For example, for 2003, the estimated community harvest based on the inseason panel was 138,635 lb (±24%),

21
compared to 160,325 lb (±4%) for the balance of the survey respondents. For 2004, the estimated community harvest was 180,027 lb (±27%) based on the panel and 206,807 lb (±6%) based on the other respondents. For 2005, based on the panel, the harvest estimate for Kodiak was 218,440 lb (±21%), compared to 240,753 lb (±5%) for the rest of the survey respondents. Overall, these findings suggest that the set of SHARC holders who participated in the 2006 inseason study may, on average, harvest fewer halibut than other participants in the fishery. Also of note is that the estimate for the inseason participants for 2006, based on inseason monitoring, is not notably different from estimates for 2003 and 2004 based on the mail survey, although this group’s estimated harvest for 2005 was substantial higher than that of 2006. As noted in Chapter 2, 70% of the Kodiak inseason sample who fished for halibut in 2006 and responded to the summary survey reported that their halibut harvests in 2006 were lower than in the previous 3 years (Table 21).
For Sitka, in contrast to Kodiak, the panel comparisons did not result in a consistent pattern (Table 37 and Figure 34). For 2003, the community estimate of subsistence halibut harvests, based on the panel of 2006 inseason project participants, was 148,148 lb (±38%), lower than the estimate, based on the other mail survey respondents for 2003, of 174,686 lb (±5%). However, the harvest estimate based on the panel for 2004 of 232,121 lb (±35%) was higher than the estimate of 185,069 lb (±5%) which was based on the mail survey returns of other Sitka SHARC holders. In 2005, the estimates based on the 2 groups were virtually identical: 176,780 lb (±23%) based on the panel and 178,240 lb (±4%) based on the other respondents to the mail survey.
Potential Recall Error The number of halibut reported harvested by inseason project participants and respondents to the mail survey, the weight of the harvested halibut, and the timing of harvests can be compared to examine potential recall error in the mailed survey returns.
Regarding the number of halibut harvested, in both communities, in the inseason project generally had lower mean harvests did mailed survey returns (Table 38). In Kodiak, the mean harvest for the inseason sample who fished with fixed gear was 4.3 halibut, compared to 7.5 halibut for the mailed survey respondents; for those who used hand-held gear, the mean harvests were the same for the 2 projects: 4.6 halibut. For those engaged in any subsistence fishing, inseason project participants averaged a harvest of 6.4 halibut, compared to 9.9 halibut for mail survey respondents. For those Kodiak SHARC holders who reported sport fishing for halibut in 2006, the inseason project participants averaged a harvest of 3.8 halibut and the mail survey respondents averaged 5.3 halibut. As discussed in the previous chapter and shown in Table 39, in Kodiak, there were higher reported effort and higher levels of use of fixed gear, hand-held gear, any subsistence gear, and sport gear among the mail survey respondents compared to those recorded by the inseason project. The combination of higher harvests and greater effort in the fishery by the mail survey respondents resulted in a higher estimate of halibut harvests by Kodiak residents in 2006 than the estimate generated from the inseason project.
In Sitka, the mean harvest for the inseason sample who fished with set gear was 4.7 halibut, compared to 6.8 for the mail survey respondents; for hand-held gear, the average was 0.9 halibut for the inseason group compared to 2.9 halibut for the mail survey respondents; and for any subsistence fishing, inseason respondents averaged an estimated harvest of 4.8 halibut compared to 7.7 halibut for the mailed returns (Table 38). Sport fishing for halibut in Sitka was the only activity for which the inseason participants recorded higher average harvests (6.9 halibut) than did respondents to the mail survey (3.1 halibut). In contrast to Kodiak, there was no consistent pattern in Sitka regarding estimated halibut fishing effort in 2006 (Table 39). A higher percentage of inseason participants fished with fixed gear, fished with any subsistence gear, and participated in any noncommercial halibut fishing compared to the mail survey respondents, but a higher percentage of mail survey respondents participated in the subsistence fishery with hand-held gear or went sport fishing for halibut.

22
Regarding the size of harvested halibut, as discussed in the previous chapter (see Table 13), in both communities, regardless of gear or fishery, the estimates based on recall from the mailed survey were slightly lower than the weights of the harvested halibut as estimated during the inseason project. In Kodiak, for all halibut harvested in the subsistence fishery, the mean of the mail survey respondents’ estimates was 23.0 lb per halibut (±2%), compared to 25.5 lb per halibut (±6%) for the inseason project. Findings were similar for Sitka. For halibut harvested in the subsistence fishery, the mean of the mail respondents’ estimates was 24.0 lb per halibut (±2%), compared to 27.0 lb (±9%) for the inseason project. If, as these findings suggest, respondents to the mailed survey tended to underestimate the size of the halibut they harvested, this tendency would mitigate a potential overestimation of the community harvest based upon the higher harvest rates (number of fish harvested) and participation rates among the mail survey respondents compared to the inseason project participants.
As discussed in the previous chapter, the timing of halibut harvests in 2006 recorded by participants in the inseason project can be compared with recall information pertaining to 2004 harvests reported by respondents to a mail survey conducted in 2005. As discussed earlier (see Figure 15, Figure 16, Figure 17, and Figure 18), results of the 2 studies showed similar patterns of the timing of halibut harvests in both communities. There was correspondence between the proportion of the total harvest and the fishing effort that took place in particular months in both years. These findings support the reliability of subsistence fishers’ recall of the months in which they fish and the relative quantities of halibut they harvest in each month.
CONCLUSIONS The goal of this pilot project was to estimate the subsistence halibut harvest in Sitka and Kodiak in 2006 by monitoring fishing activities of a randomly selected sample of SHARC holders in each community, and to compare these harvest estimates with those based on responses to a mailed survey. Results of the inseason project were inconclusive regarding the validity of harvest estimates based upon responses to the mailed survey. Estimated harvests based on the inseason study were for the most part lower than those based on the mail survey returns. This pattern was stronger in Kodiak than in Sitka. However, the relatively small sample size in the inseason project compared to the relatively large sample achieved in the mail survey results in questions about how representative the inseason project participants were of their community. In Kodiak, especially, the inseason sample appeared to include no representatives of the small portion of SHARC holders who harvest about 20% of the subsistence harvest of halibut. The inseason sample in Kodiak may have also underrepresented the group of SHARC holders from 50 to 64 years of age who, according to mail survey results, account for a large portion of the total community harvest. On the other hand, the inseason study appears to have provided better documentation of the halibut fishing activities of SHARC holders under the age of 20. This group of SHARC holders appears to be less involved in halibut fishing than older SHARC holders, and is underrepresented in the mail survey response.
As discussed, levels of participation in subsistence and sport fishing for halibut were higher in 2006 among respondents to the mail survey compared to the inseason project. This suggests that active fishers are perhaps more likely to respond to the mail survey than those who do not fish. The underrepresentation of SHARC holders under age 20 and the overrepresentation of SHARC holders in the 50 to 64 years of age group in mailed survey returns are supportive of this observation. Average harvests of halibut, as reported in numbers of fish, were higher for fishers who responded to the mailed survey in comparison to harvests recorded inseason. However, especially in Kodiak, the lower averages were in part the result of the absence of the highest harvesting segment of SHARC holders among the inseason participants. While the average weight of halibut recalled by respondents to the mail survey was lower than the weights of halibut measured during the inseason study, the difference was relatively small. Also, recall of the timing of fishing effort and harvests by month appears reliable, based on the comparison of the inseason harvest monitoring in 2006 with the results of a survey pertaining to 2004 that was conducted in late 2005. These

23
observations, while tentative, suggest that a response bias towards active fishers in the mail survey returns may be the best explanation for the higher harvest estimates generated by the mail survey. Recall error, with a tendency to overestimate the number of halibut harvested, may play a smaller role, but questions about the representativeness of the inseason sample leave this role uncertain. Subsistence fishers appear to accurately recall the timing of harvests and the weight of harvested fish.
Finally, it is necessary to comment on the relatively high refusal rates and relatively low participation rates in the inseason study compared to the mail survey, especially in Sitka. While those SHARC holders who agreed to participate were virtually all very supportive of the project and easy to work with over the 3 months of fieldwork, weekly phone calls and visits can be burdensome and intrusive. It is unlikely that an inseason monitoring project would be sustainable over several years, given the relatively high cost in comparison to the mailed survey, and especially given comments about “survey burn out” that were offered by SHARC holders who declined to participate.
Since the 2003 study year, the mail survey project has enjoyed strong support from subsistence halibut fishers as evidenced by the continuing high response rates. Given the consistent performance of the mail survey, it is probably the best method for continuing to develop subsistence harvest estimates for the state.
RECOMMENDATIONS The following recommendations pertain to any future research to assess the validity of estimates of subsistence harvests of halibut based on the mailed survey.
1. The selection of a sample of SHARCs for future inseason harvest monitoring would need to account for specialization in harvests. A stratified sample based on prior years’ harvest patterns might result in a sample more representative of the range of harvesters and include representatives of the most active subsistence fishers.
2. If stratification of the sample is not an option, larger sampling fractions will be needed; this will result in additional costs.
3. Consideration should be given to conducting a similar inseason harvest monitoring project in other communities. Conducting such a study in smaller communities would allow for a larger sampling fraction and perhaps a tighter focus on questions about recall.
4. Evaluation of SHARC holders who do not respond to the harvest survey should occur, perhaps through a follow-up short survey of a sample, by mail or telephone, that would determine if the SHARC holder fished.
5. Given the high response rates to the mail survey, the large number of communities and SHARC holders involved in the subsistence halibut fishery, and the relatively low cost of a mailed survey compared to inseason monitoring, the mail survey should continue as the primary method of developing subsistence halibut harvest estimates in Alaska.
ACKNOWLEDGEMENTS First, we thank the many halibut fishers in Kodiak and Sitka who participated in this project. In Kodiak, ADF&G nonpermanent employees Dana Brockman and Tanya Lee contacted fishers, collected the data, and conducted the summary interviews. In Sitka, we thank Sitka Tribe of Alaska employees Robi Craig, Jeff Feldpausch, and William Mork for their contributions to the project, including contacting fishers, collecting harvest data, and conducting household interviews at the conclusion of the project. ADF&G employees Mathew Brock and Nancy Ratner, and Graduate Intern Morgen Smith, also contacted fishers, provided background on the project to the community, and collected harvest data. The hard work of the field staff in both study communities made the research possible. Also, we are grateful to Bridget Easley for her contribution to the study design. Allen Bingham of the ADF&G Division of Sport Fish, Gregg

24
Williams of the staff of the International Pacific Halibut Commission, and Jay Ginter of the National Marine Fisheries Service also shared ideas about potential research methods. Finally, the authors thank Lisa Olson and Garrett Zimpelman of ADF&G for their assistance in editing and formatting this final report.
REFERENCES CITED Fall, J. A., M. George, and B. Easley. 2005. Subsistence harvests of Pacific halibut in Alaska, 2004. Alaska
Department of Fish and Game Division of Subsistence Technical Paper No. 304, Juneau. http://www.subsistence.adfg.state.ak.us/techpap/tp304.pdf
Fall, J. A., M. Kerlin, B. Easley, and R. J. Walker. 2004. Subsistence harvests of Pacific halibut in Alaska, 2003. Alaska Department of Fish and Game Division of Subsistence Technical Paper No. 288, Anchorage and Juneau. http://www.subsistence.adfg.state.ak.us/techpap/tp288.pdf
Fall, J. A., D. Koster, and B. Davis. 2006. Subsistence harvests of Pacific halibut in Alaska, 2005. Alaska Department of Fish and Game Division of Subsistence Technical Paper No. 320, Juneau. http://www.subsistence.adfg.state.ak.us/techpap/tp320.pdf
Fall, J. A., D. Koster, and M. Turek. 2007. Subsistence harvests of Pacific halibut in Alaska, 2006. Alaska Department of Fish and Game Division of Subsistence Technical Paper No. 333, Juneau. http://www.subsistence.adfg.state.ak.us/techpap/TP333.pdf
Wolfe, R. J. 1987. The super-household: Specialization in subsistence economies. Paper presented at the 14th annual meeting of the Alaska Anthropological Association, March 1987, Anchorage, Alaska. Alaska Department of Fish and Game Division of Subsistence, Juneau.

25
TABLES AND FIGURES

26
Table 1.–Subsistence halibut survey return rates, estimated number of fishers, and estimated harvests, Kodiak and Sitka, 2003–2006.
Kodiak Sitka 2003 2004 2005 2006 2003 2004 2005 2006
SHARCs issueda 1,320 1,561 1,741 1,716 1,639 1,871 1,974 1,895Surveys returned 962 1,025 1,110 1,113 1,210 1,341 1,339 1,302Return rate 72.9% 65.7% 63.8% 64.9% 73.8% 71.7% 67.8% 68.7% Estimated number of subsistence
halibut fishers 646 802 871 961 821 904 814 915
Estimated subsistence halibut harvest, number of fish
6,526 8,359 10,694 8,750 6,621 6,588 6,062 6,691
Estimated subsistence halibut harvest, pounds of fish
153,254 187,214 210,828 205,822 174,880 166,474 146,319 163,372
Estimated number of sport halibut
fishers 498 581 669 562 401 412 417 395
Estimated sport halibut harvest, number of fish
2,820 3,281 3,862 2,855 1,379 1,463 2,450 1,287
Estimated sport halibut harvest, pounds of fish
68,170 73,181 82,455 64,320 32,408 25,829 55,913 23,032
Estimated total number of halibut
fishers 858 971 1,116 1,092 956 1,026 987 1,036
Estimated total halibut harvest, number of fish
9,346 11,640 14,556 11,605 8,000 8,051 8,512 7,978
Estimated total halibut harvest, pounds of fish
221,424 260,395 293,283 270,142 207,288 192,303 202,232 186,404
Estimated number of fishers with
rockfish harvests 112 159 183 192 352 419 376 405
Estimated number of rockfish harvested
1,265 2,304 1,642 2,126 4,354 4,451 1,514 4,182
Estimated number of fishers with
lingcod harvests 70 86 98 109 259 303 269 318
Estimated number of lingcod harvested 216 362 253 337 984 1,187 639 1,011a. Includes all individuals who held SHARCs who lived in either Kodiak or Sitka; includes holders of rural
SHARCs and tribal SHARCs.

27
Table 2.–Project chronology.
Date Activity September 2005 Grant amendment approved. October 1, 2005 Supplemental mailing to 2004 halibut fishers in Kodiak and Sitka. January to April 2006 Discussions with NMFS, IPHC, and ADF&G Division of Sport Fish staff. February to May 2006 Subcontract with Bridget Easley. June 1, 2006 Project plan finalized. June 19, 2006 Mailing of postal survey to 600 SHARC holders in Kodiak and Sitka. June 24, 2006 Telephoning of random sample began, Kodiak. June 28, 2006 Training of temporary hires, Kodiak. June 28, 2006 Initial face-to-face contacts with Kodiak participants begins. July and August 2006 Regular contacts with participants. August and September 2006 Post-fishing surveys conducted. December 6, 2006 Progress report, NPFMC, Anchorage. December 7, 2006 First reminder letter mailed (September–December harvests). January 16, 2007 Progress report, IPHC, Victoria, B.C. January 24, 2007 Second reminder letter mailed (September–December harvests.) February to June 2007 Data entry and review. July and August 2007 Preliminary data analysis. September 15, 2007 Results of postal survey available. November 15, 2007 Selected draft project findings available for review. December 4, 2007 Report on selected draft project findings, ANSHWG, Anchorage. December 5, 2007 Report on selected draft project findings, NPFMC, Anchorage. January 16, 2008 Report on selected draft project findings, IPHC, Portland, OR. Feb 2008 to April 2009 Additional data analysis; final report writing. May 29, 2009 Final report completed and submitted.
Table 3.–Sample achievement.
Number of SHARC holder households Kodiak Sitka Participating households 170 110Participating (duplicate households)a 19 8Households failed to contact 81 177Failed to contact (duplicate households) a 1 4Households declined to participate 26 44Declined to participate (duplicate households) a 3 2 Total SHARC holders in random sample 300 345Total households in random sample 277 331 Refusal rateb 13.3% 28.6% SHARC holders in participating households 303 149Total SHARC holders in community 1,716 1,895Percentage of SHARC holders in sample 17.7% 7.9%a. “Duplicate” means randomly selected SHARC holders in
the same household. b. “Refusal rate” = number of refusals divided by number of
contacts (participating plus refusals).

28
Table 4.–Reasons offered by Kodiak SHARC holders for not participating in the project.
SHARC holders
Number Percentage of
all refusals
Percentage ofthose offering
a reason Doesn't plan to fish 8 30.8% 50.0% Too busy 2 7.7% 12.5% Illness 3 11.5% 18.8% Miscellaneous/other 3 11.5% 18.8% No reason given or not recorded 10 38.5% Total refusals 26
Table 5.–Reasons offered by Sitka SHARC holders for not participating in the project.
SHARC holders
Number Percentage of
all refusals
Percentage ofthose offering
a reason Doesn't plan to fish 16 36.4% 57.1% Too busy 4 9.1% 14.3% Illness 5 11.4% 17.9% Miscellaneous/other 3 6.8% 10.7% No reason given or not recorded 16 36.4% Total refusals 44
Table 6.–Number of SHARCs in sample.
Kodiak SitkaNumber of households in sample 170 110 Number of SHARC holders in sample 303 149Average number of SHARC holders per household 1.8 1.4Percentage of total SHARC holders in sample 17.7% 7.9% Number of rural SHARC holders in sample 270 125Percentage of all rural SHARC holders 18.7% 8.7% Number of tribal SHARC holders in sample 33 24Percentage of all tribal SHARC holders 12.0% 5.2%

29
Table 7.–Comparison of inseason sample by SHARC type and community.
Kodiak Sitka Rural Tribal Rural Tribal
Total SHARCs issued a 84.0% 16.0% 75.7% 24.3%SHARCs in random selection b 83.0% 17.0% 71.6% 28.4%SHARCs participating who were in random selection c 88.9% 11.1% 84.7% 15.3%All SHARCs participating d 89.1% 10.9% 83.9% 16.1%a. Number of SHARCs issued was 1,716 in Kodiak and 1,895 in Sitka. b. 300 SHARC holders were selected at random in Kodiak and 345 in Sitka. c. 189 of 300 randomly selected SHARCs from Kodiak participated, as did 118
of 345 in Sitka. d. Includes all SHARC holders in participating households, 303 SHARC holders in
in Kodiak and 149 in Sitka.
Table 8.–Inseason subsistence halibut harvest project: disposition of the random sample by SHARC type.
Kodiak Sitka Rural Tribal All Rural Tribal All
Participating in project 168 21 189 100 18 118 No contact 58 24 82 116 65 181 Refusals 23 6 29 31 15 46 All sample 249 51 300 247 98 345 Participating in project 67.5% 41.2% 63.0% 40.5% 18.4% 34.2% No contact 23.3% 47.1% 27.3% 47.0% 66.3% 52.5% Refusals 9.2% 11.8% 9.7% 12.6% 15.3% 13.3% Note Includes only those SHARC holders who were in the randomly-selected sample. Other SHARC holders living in the participating households were also included in the project.
Table 9.–Comparison of findings for 2006: Kodiak SHARC holders.
Inseason sample ± CI%
Mail-out sample
only ± CI% Combined
sample ± CI%Community SHARCs 1,716.00 1,716.00 1,716.00 Sample size 301 822 1,123 Sample fraction 17.5% 47.9% 65.4% Fixed gear: number of fishers 580.9 934.9 840.1 Fixed gear: percentage of SHARC holders
fishing 33.9% 54.5% 49.0%
Fixed gear: number of halibut harvested 2,521.9 23.6% 7,038.5 6.5% 5,825.7 4.1%Fixed gear: average halibut per fisher 4.3 7.5 6.9 Fixed gear: pounds of halibut harvesteda 69,009.4 24.4% 169,058.3 7.4% 142,194.1 4.5%Fixed gear: average pounds per fishera 118.8 180.8 169.3 Fixed gear: average weight per halibuta 27.4 4.7% 24.0 2.1% 24.4 1.2%
-continued-

30
Table 9. Page 2 of 2.
Inseason sample ± CI%
Mail-out sample
only ± CI% Combined
sample ± CI%Hand gear: number of fishers 495.4 733.7 662.3 Hand gear: percentage of SHARC holders
fishing 28.9% 42.8% 38.6%
Hand gear: number of halibut harvested 2,281.7 27.4% 3,379.7 8.9% 3,084.9 5.3%Hand gear: average halibut per fisher 4.6 4.6 4.7 Hand gear: pounds of halibut harvesteda 53,464.5 27.0% 70,277.7 9.3% 65,763.2 5.4%Hand gear: average pounds per fishera 107.9 95.8 99.3 Hand gear: average weight per halibuta 23.4 6.9% 20.8 2.1% 21.3 1.3%All subsistence gear: number of fishers 746.8 1048.0 967.3 All subsistence gear: percentage of SHARC
holders fishing 43.5% 61.1% 56.4%
All subsistence gear: number of halibut harvested
4,803.6 18.2% 10,418.2 5.3% 8,910.6 3.2%
All subsistence gear: average halibut per fisher
6.4 9.9 9.2
All subsistence gear: pounds of halibut harvesteda
122,473.9 18.5% 239,336.0 6.0% 207,957.3 3.6%
All subsistence gear: average pounds per fishera
164.0 228.4 215.0
All subsistence gear: average weight per halibuta
25.5 5.6% 23.0 2.0% 23.3 1.1%
Percentage of total subsistence halibut harvest, fixed gear
52.5% 67.6% 65.4%
Percentage of total subsistence halibut harvest, hand gear
47.5% 32.4% 34.6%
Percentage of total pounds subsistence halibut harvest, fixed gear
56.3% 70.6% 68.4%
Percentage of total pounds subsistence halibut harvest, hand gear
43.7% 29.4% 31.6%
Sport: number of fishers 325.0 684.3 587.8 Sport: percentage of SHARC holders fishing 18.9% 39.9% 34.3% Sport: number of halibut harvested 1,249.8 27.6% 3,653.7 9.2% 3,008.2 5.6%Sport: average halibut per fisher 3.8 5.3 5.1 Sport: pounds of halibut harvesteda 29,796.4 29.2% 81,518.4 8.4% 67,630.5 5.2%Sport: average pounds per fishera 91.7 119.1 115.1 Sport: average weight per halibuta 23.8 3.3% 22.3 1.9% 22.5 1.0% All: number of fishers 900.8 1,235.9 1,146.0 All: percentage of SHARC holders fishing 52.5% 72.0% 66.8% All: number of halibut harvested 6,053.4 15.5% 14,071.9 4.9% 11,918.8 3.0%All: average halibut per fisher 6.7 11.4 10.4 All: pounds of halibut harvesteda 152,270.3 15.8% 320,854.4 5.3% 275,587.9 3.2%All: average pounds per fishera 169.0 259.6 240.5 All: average weight per halibuta 25.2 5.2% 22.8 1.9% 23.1 1.1%a. Dressed weight.

31
Table 10.– Comparison of findings for 2006: Sitka SHARC holders.
Inseason sample ± CI%
Mail-out sample
only ± CI% Combined
sample ± CI%Community SHARCs 1,895.00 1,895.00 1,895.00 Sample size 150 1,152 1,302 Sample fraction 7.9% 60.8% 68.7% Fixed gear: number of fishers 947.5 856.5 867.2 Fixed gear: percentage of SHARC holders
fishing 50.0% 45.2% 45.8%
Fixed gear: number of halibut harvested 4,430.6 34.7% 5,802.2 7.4% 5,643.9 5.5%Fixed gear: average halibut per fisher 4.7 6.8 6.5 Fixed gear: pounds of halibut harvesteda 121,820.9 32.8% 148,597.1 8.4% 145,507.5 6.1%Fixed gear: average pounds per fishera 128.6 173.5 167.8 Fixed gear: average weight per halibuta 27.5 8.5% 25.6 1.9% 25.8 1.4%Hand gear: number of fishers 286.5 418.9 405.6 Hand gear: percentage of SHARC holders
fishing 15.1% 22.1% 21.4%
Hand gear: number of halibut harvested 246.0 71.8% 1,222.7 15.7% 1,110.0 12.2%Hand gear: average halibut per fisher 0.9 2.9 2.7 Hand gear: pounds of halibut harvesteda 4,625.3 63.3% 19,822.1 10.2% 18,068.6 7.9%Hand gear: average pounds per fishera 16.1 47.3 44.5 Hand gear: average weight per halibuta 18.8 4.2% 16.2 2.7% 16.3 2.0%All subsistence gear: number of fishers 972.8 909.7 916.9 All subsistence gear: percentage of
SHARC holders fishing 51.3% 48.0% 48.4%
All subsistence gear: number of halibut harvested
4,676.6 32.9% 7,024.9 6.9% 6,753.9 5.1%
All subsistence gear: average halibut per fisher
4.8 7.7 7.4
All subsistence gear: pounds of halibut harvesteda
126,446.2 31.6% 168,419.2 7.7% 163,576.2 5.7%
All subsistence gear: average pounds per fishera
130.0 185.1 178.4
All subsistence gear: average weight per halibuta
27.0 8.5% 24.0 2.0% 24.2 1.4%
Percentage of total subsistence halibut harvest, fixed gear
94.7% 82.6% 83.6%
Percentage of total subistence halibut harvest, hand gear
5.3% 17.4% 16.4%
Percentage of total pounds subsistence halibut harvest, fixed gear
96.3% 88.2% 89.0%
Percentage of total pounds subsistence halibut harvest, hand gear
3.7% 11.8% 11.0%
Sport: number of fishers 151.6 441.6 408.2 Sport: percentage of SHARC holders
fishing 8.0% 23.3% 21.5%
-continued-

32
Table 10. Page 2 of 2.
Inseason sample ± CI%
Mail-out sample
only ± CI% Combined
sample ± CI%Sport: number of halibut harvested 1,052.2 87.5% 1,362.8 7.3% 1,326.9 5.9%Sport: average halibut per fisher 6.9 3.1 3.3 Sport: pounds of halibut harvesteda 22,761.6 95.6% 23,935.3 7.1% 23,799.9 6.2%Sport: average pounds per fishera 150.1 54.2 58.3 Sport: average weight per halibuta 21.6 9.8% 17.6 2.2% 17.9 1.6% All: number of fishers 1,099.1 1,047.8 1,053.7 All: percentage of SHARC holders fishing 58.0% 55.3% 55.6% All: number of halibut harvested 5,728.8 30.9% 8,387.6 6.0% 8,080.8 4.5%All: average halibut per fisher 5.2 8.0 7.7 All: pounds of halibut harvesteda 149,207.9 30.0% 192,354.5 6.9% 187,376.1 5.1%All: average pounds per fishera 135.8 183.6 177.8 All: average weight per halibuta 26.0 8.9% 22.9 2.0% 23.2 1.5%a. Dressed weight.

33
Table 11.–Difference of means tests (t-test), estimates based on inseason sample and mail survey sample, Kodiak, 2006.
Independent samples test t-test for equality of means Levene’s test for
equality of variances
95% confidence interval of the difference
F Sig. t df Sig.
(2-tailed)Mean
differenceStd. error difference Lower Upper
Statistically significant difference?
Effect r
Effect size?
Number of halibut harvested, fixed gear
64.645 .000 7.774 1028.559 .000 2.632 .339 1.968 3.296 Significantly different
0.235574 Small/ medium
Pounds of halibut harvested, fixed gear
35.446 .000 6.221 1008.667 .000 58.30354 9.37241 39.91188 76.69519 Significantly different
0.192218 Small
Number of hooks fished
107.334 .000 7.883 710.115 .000 5.807 .737 4.360 7.253 Significantly different
0.283677 Small/ medium
Number of halibut harvested, hand gear
10.065 .002 2.262 673.246 .024 .640 .283 .084 1.195 Significantly different
0.08684 None
Pounds of halibut harvested, hand gear
4.111 .043 1.537 627.660 .125 9.79788 6.37308 –2.71727 22.31302 No significant difference
0.06125 None
Number of lingcod harvested
36.097 .000 4.863 963.414 .000 .220 .045 .131 .309 Significantly different
0.154801 Small
Number of rockfish harvested
53.764 .000 5.717 1110.833 .000 1.354 .237 .889 1.818 Significantly different
0.169058 Small
Total number of halibut harvested
38.868 .000 6.121 1115.501 .000 1.401 .229 .952 1.850 Significantly different
0.180262 Small
Total pounds of halibut harvested
44.497 .000 6.027 1038.864 .000 30.14105 5.00127 20.32730 39.95479 Significantly different
0.183796 Small
Note Equal variances not assumed.

34
Table 12.– Difference of means tests (t-test), estimates based on inseason sample and mail survey sample, Sitka, 2006.
Independent samples test t-test for equality of means
Levene’s test for equality of
variances
95% confidence interval of the
difference
Equal variances assumed? F Sig. t df
Sig. (2-tailed)
Mean difference
Std. error difference Lower Upper
Statistically significant difference? Effect r Effect size?
Y 2.380 .123 .869 1298 .385 .724 .833 –.911 2.359 No significant difference
0.024102 Number of halibut harvested, fixed gear
N 2.380 .123 1.354 301.081 .177 .724 .534 –.328 1.775
Pounds of halibut harvested, fixed gear
N 1.291 .256 .981 341.931 .327 14.12992 14.40842 –14.21038 42.47022 No significant difference
0.05296
Number of hooks fished
Y 13.807 .000 -2.464 1298 .014 -2.493 1.012 –4.478 –.509 Significantly different
0.068245 No significant
effect Number of
halibut harvested, hand gear
Y 6.612 .010 1.409 1298 .159 .515 .366 –.202 1.233 No significant difference
0.039071
Pounds of halibut harvested, hand gear
Y 15.942 .000 2.082 1298 .038 8.01942 3.85235 .46191 15.57692 significantly different
0.057684 No significant
effect
Number of lingcod harvested
Y 4.652 .031 1.284 1298 .199 .224 .175 –.118 .567 No significant difference
0.035608
Number of rockfish harvested
Y 27.261 .000 3.021 1298 .003 2.081 .689 .729 3.432 Significantly different
0.083548 No significant
effect Total number
of halibut harvested
Y .952 .329 .771 1298 .441 .164 .213 –.253 .581 No significant difference
0.021394
-continued-

35
Table 12. Page 2 of 2. Independent samples test t-test for equality of means
Levene’s test for equality of
variances
95% confidence interval of the
difference
Equal variances assumed? F Sig. t df
Sig. (2-tailed)
Mean difference
Std. error difference Lower Upper
Statistically significant difference? Effect r Effect size?
Total pounds of halibut harvested
N .072 .788 .097 159.383 .923 .61936 6.41610 –12.05218 13.29089 No significant difference
0.007646
Table 13.–Comparison of dressed weights of halibut harvested by SHARC holders, Kodiak and Sitka, 2005.
Inseason, pounds of
fish CI% (±)
Mailed returns,
pounds offish CI% (±)
Combined sample,
pounds offish CI% (±)
Kodiak Set gear 27.4 4.7% 24.0 2.1% 24.4 1.2% Hand held 23.4 6.9% 20.8 2.1% 21.3 1.3% All subsistence 25.5 5.6% 23.0 2.0% 23.3 1.1% Sport 23.8 3.3% 22.3 1.9% 22.5 1.0% All halibut 25.2 5.2% 22.8 1.9% 23.1 1.1% Sitka Set gear 27.5 8.5% 25.6 1.9% 25.8 1.4% Hand held 18.8 4.2% 16.2 2.7% 16.3 2.0% All subsistence 27.0 8.5% 24.0 2.0% 24.2 1.4% Sport 21.6 9.8% 17.6 2.2% 17.9 1.6% All halibut 26.0 8.9% 22.9 2.0% 23.2 1.5%

36
Table 14.–Number of hooks usually fished, set lines, Kodiak and Sitka 2006.
Kodiak Sitka Number of hooks Inseason Mail-out Inseason Mail-out
Missing 21% 2% 1% 1% 1 1% 1% 0% 0% 2 0% 1% 0% 1% 3 2% 0% 0% 0% 4 0% 1% 0% 0% 5 1% 1% 0% 2% 6 0% 1% 1% 1% 7 3% 1% 1% 0% 8 1% 0% 1% 1% 9 5% 2% 1% 1%
10 6% 9% 7% 12% 11 1% 0% 0% 0% 12 5% 2% 1% 3% 13 3% 0% 0% 0% 14 0% 0% 0% 0% 15 8% 7% 5% 17% 16 1% 0% 1% 0% 17 0% 0% 4% 0% 18 1% 1% 1% 1% 19 0% 0% 0% 0% 20 8% 22% 12% 21% 21 0% 0% 3% 0% 22 0% 0% 0% 1% 23 1% 0% 3% 0% 24 0% 0% 0% 1% 25 6% 9% 5% 6% 26 1% 0% 1% 0% 27 0% 0% 4% 1% 28 0% 1% 3% 1% 29 0% 1% 0% 0%
30+ 24% 39% 41% 28%

37
Table 15.–Kodiak comparison of lingcod and rockfish harvests.
Lingcod Rockfish Harvest CIP ± Harvest CIP ±
Inseason 45.53 83% 416.17 76% Mail-out 422.72 18% 2,739.32 13% Combined 321.44 12% 2,115.53 9%
Table 16.–Sitka comparison of lingcod and rockfish harvests.
Lingcod Rockfish Harvest CIP ± Harvest CIP ±
Inseason 659.33 85% 758.00 53%Mail-out 1,084.27 8% 4,701.25 8%Combined 1,035.24 6% 4,246.26 6%
Table 17.–Responses to question: have new regulations changed fishing practices?
Changed gear / no. of hooks fished
Fishing is
easier / more
efficient
Opened up new areas
to fish
Shifted fishing
time Other
Keep more fish
due to bag limit change
Fishing more
No reason given
Valid
responses
Households responding
yes
No. Pctg. No. Pctg. No. Pctg. No. Pctg. No. Pctg. No. Pctg. No. Pctg. No. Pctg.
Kodiak 70 40 27 67.5% 10 25.0% 2 5.0% 1 2.5% 0 0.0% 2 5.0% 1 2.5% 1 2.5%Sitka 38 25 20 80.0% 8 32.0% 2 8.0% 0 0.0% 1 4.0% 0 0.0% 0 0.0% 0 0.0%Source ADF&G Division of Subsistence household surveys, 2006.

38
Table 18.–Responses to question: how are subsistence and sport fishing distinguished?
By gear used
Social (e.g. who fishing with)
Amount harvested
Cultural / lifestyle Other
Valid
responses
No. Pctg. No. Pctg. No. Pctg. No. Pctg. No. Pctg.
Kodiak 81 26 32.1% 16 19.8% 13 16.0% 22 27.2% 13 16.0%Sitka 15 9 60.0% 1 6.7% 0 0.0% 2 13.3% 2 13.3%Source ADF&G Division of subsistence household surveys, 2006.
Table 19.–Reported reasons household did not meet harvest goals.
Bad weather
Too busy /no time /
not enough effort
Poor fishing /
fish not
available
Boat/ equipment problems
Fuel costs
Health/ injury/
personal issues/age
Not yet - will
still fish
No reason given
Valid
responses
Did not meet harvest
goals Met harvest
goals No. Pctg. No. Pctg. No. Pctg. No. Pctg. No. Pctg. No. Pctg. No. Pctg. No. Pctg.
Kodiak 88 54 34 8 14.8% 18 33.3% 9 16.7% 3 5.6% 1 1.9% 1 1.9% 18 33.3% 5 9.3%Sitka 45 27 18 7 25.9% 15 55.6% 4 14.8% 4 14.8% 0 0.0% 3 11.1% 4 14.8% 2 7.4%Source ADF&G Division of Subsistence household surveys, 2006.
Table 20.–Reasons fishing households harvested more halibut in 2006 compared to the previous 3 years.
Got more
Changes in
equipmentIncreased
effort Good
fishing
No reason given
Valid
responses
No. Pctg. No. Pctg. No. Pctg. No. Pctg. No. Pctg.
Kodiak 60 11 18.3% 2 18.2% 2 18.2% 5 45.5% 2 18.2%Sitka 28 9 32.1% 1 11.1% 7 77.8% 0 0.0% 1 11.1%Source ADF&G Division of Subsistence household surveys, 2006.

39
Table 21.–Reasons fishing households harvested fewer halibut in 2006 compared to the previous 3 years.
Got fewer
Bad weather
Too busy/no time/
not enough effort
Poor fishing/fish not
available
Boat/ equipment problems
Health/ injury/
personal issues/age
No reason given
Valid
responses No. Pctg.
No. Pctg. No. Pctg. No. Pctg. No. Pctg. No. Pctg. No. Pctg.
Kodiak 60 42 70.0% 6 14.3% 26 61.9% 12 28.6% 1 2.4% 0 0.0% 3 7.1%Sitka 28 16 57.1% 5 31.3% 5 31.3% 5 31.3% 5 31.3% 1 6.3% 1 6.3%Source ADF&G Division of Subsistence household surveys, 2006.
Table 22.–Comparison of halibut fishing effort in 2006 with previous 3 years, those respondents who did not fish.
Did not fish for halibuta
Less effort
Same effort
More effortb
No response
Participating households
Complete summary interviews No. Pctg. No. Pctg. No. Pctg. No. Pctg. No. Pctg.
Kodiak 170 147 59 40.1% 33 55.9% 11 18.6% 1 1.7% 14 23.7% Sitka 110 84 32 38.1% 11 34.4% 7 21.9% 2 6.3% 12 37.5% a. Percentages and responses for households not fishing for halibut are based solely on completed summary interviews. b. Logically, households that did not fish could not have fished “more” in 2006 than in previous years. In these 3 cases, respondents may have misunderstood the
question and meant that their fishing effort in the prior 3 years was “more” (greater) than in 2006.

40
Table 23.–Reasons for harvesting fewer halibut in 2006 than in the previous 3 years, nonfishing households.
Too busy/ no time
Poor fishing
Equipment problems
Personal health
No reason given
Number that
reported harvesting
fewer No. Pctg. No. Pctg No. Pctg No. Pctg No. Pctg
Kodiak 33 23 69.7% 1 3.0% 3 9.1% 3 9.1% 2 6.1% Sitka 11 7 63.6% 1 9.1% 1 9.1% 0 0.0% 2 8.2%
Table 24.–Reasons fishing households harvested more halibut in 2006 compared to 3 years ago.
Got more
Changes in equipment
Personal reasons
More effort
Good fishing
Regulation change
No reason given
Valid
responses No. Pctg. No. Pctg. No. Pctg. No. Pctg. No. Pctg. No. Pctg. No. Pctg.
Kodiak 83 33 39.8% 1 3.0% 1 3.0% 8 24.2% 3 9.1% 19 57.6% 3 9.1%Sitka 30 14 46.7% 0 0.0% 0 0.0% 3 21.4% 4 28.6% 6 42.9% 1 7.1%Source ADF&G Division of Subsistence household surveys, 2006.
Table 25.–Reasons fishing households harvested fewer halibut in 2006 compared to before 2003.
Got fewer
Bad weather
Too busy/
no time/
not enough effort
Poor fishing/fish not
available Fuel costs
Health/ injury/
personal issues/
age
Too many people
Regulation change
No reason given
Valid
responses
No. Pctg. No. Pctg. No. Pctg. No. Pctg. No. Pctg. No. Pctg. No. Pctg. No. Pctg. No. Pctg. Kodiak 83 19 22.9% 1 5.3% 5 26.3% 1 5.3% 1 5.3% 1 5.3% 0 0.0% 1 5.3% 10 52.6%Sitka 30 7 23.3% 1 14.3% 2 28.6% 2 28.6% 0 0.0% 1 14.3% 1 14.3% 1 14.3% 1 14.3%
Source ADF&G Division of Subsistence household surveys, 2006.

41
Table 26.–Reasons households harvested fewer halibut in 2006 compared to before 2003, nonfishing households.
Got fewer
Too busy
Poor fishing/ fish not
available
Boat/ equipment problems/changes
Regulation change Other
No reason given
Valid responses No. Pctg. No. Pctg. No. Pctg. No. Pctg. No. Pctg. No. Pctg. No. Pctg.
Kodiak 59 11 18.6% 3 27.3% 2 18.2% 1 9.1% 0 0.0% 2 18.2% 3 27.3%Sitka 32 3 9.4% 1 33.3% 0 0.0% 0 0.0% 1 33.3% 0 0.0% 1 33.3%
Table 27.–Reported reasons households did not fish.
Bad weather
Too busy/ no
time
Poor fishing/
fish not
available
Boat/ equipment problems
Health/ injury/
personal No
help
No need –
had fish
Lack of
interest
No reason given
Households not
fishinga
No. Pctg. No. Pctg. No. Pctg. No. Pctg. No. Pctg. No. Pctg. No. Pctg. No. Pctg. No. Pctg.
Kodiak 59 4 6.8% 30 50.8% 0 0.0% 10 16.9% 6 10.2% 2 3.4% 2 3.4% 2 3.4% 12 20.3%Sitka 32 3 9.4% 13 40.6% 1 3.1% 10 31.3% 2 6.3% 1 3.1% 1 3.1% 0 0.0% 18 56.3%a. Does not include households that reported fishing after the summary survey was conducted. Source ADF&G Division of Subsistence household surveys, 2006.
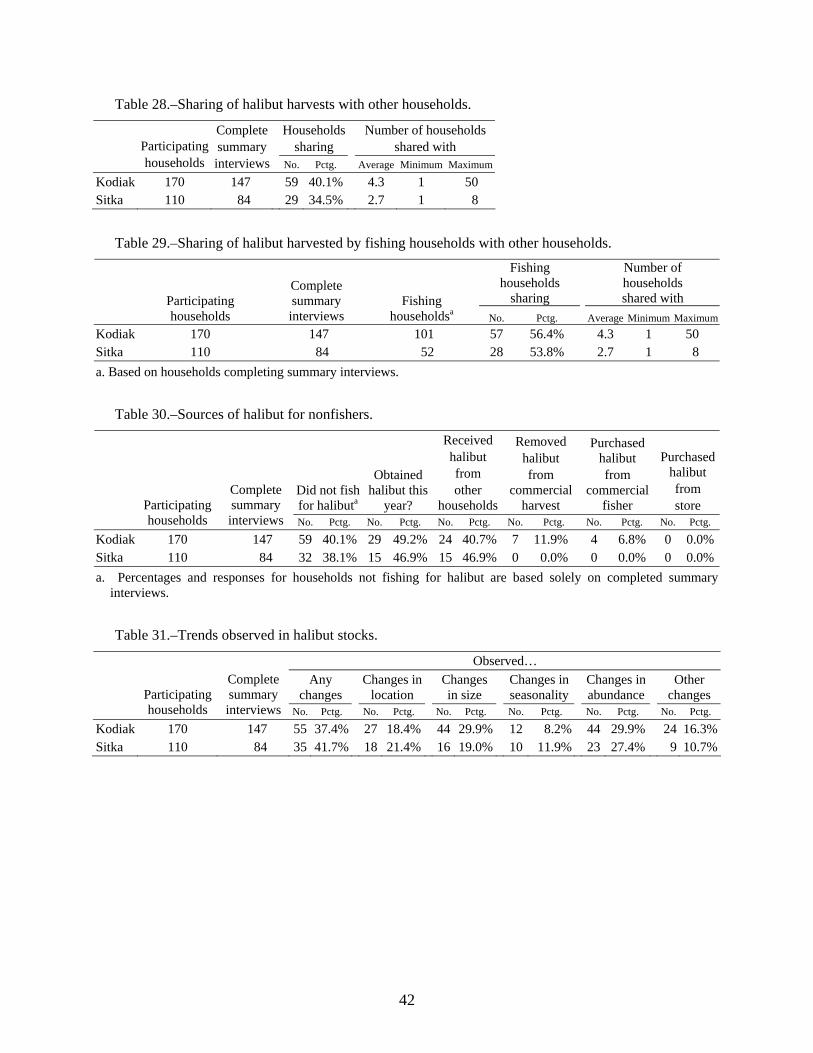
42
Table 28.–Sharing of halibut harvests with other households.
Households sharing
Number of households shared with
Participating households
Complete summary interviews No. Pctg. Average Minimum Maximum
Kodiak 170 147 59 40.1% 4.3 1 50 Sitka 110 84 29 34.5% 2.7 1 8
Table 29.–Sharing of halibut harvested by fishing households with other households.
Fishing households
sharing
Number of households shared with
Participating households
Complete summary interviews
Fishing householdsa No. Pctg. Average Minimum Maximum
Kodiak 170 147 101 57 56.4% 4.3 1 50 Sitka 110 84 52 28 53.8% 2.7 1 8 a. Based on households completing summary interviews.
Table 30.–Sources of halibut for nonfishers.
Did not fish for halibuta
Obtained halibut this
year?
Received halibut from other
households
Removed halibut from
commercial harvest
Purchased halibut from
commercial fisher
Purchased halibut from store
Participating households
Complete summary interviews No. Pctg. No. Pctg. No. Pctg. No. Pctg. No. Pctg. No. Pctg.
Kodiak 170 147 59 40.1% 29 49.2% 24 40.7% 7 11.9% 4 6.8% 0 0.0%Sitka 110 84 32 38.1% 15 46.9% 15 46.9% 0 0.0% 0 0.0% 0 0.0%a. Percentages and responses for households not fishing for halibut are based solely on completed summary
interviews.
Table 31.–Trends observed in halibut stocks.
Observed… Any
changes Changes in
location Changes in size
Changes in seasonality
Changes in abundance
Other changes
Participating households
Complete summary interviews No. Pctg. No. Pctg. No. Pctg. No. Pctg. No. Pctg. No. Pctg.
Kodiak 170 147 55 37.4% 27 18.4% 44 29.9% 12 8.2% 44 29.9% 24 16.3%Sitka 110 84 35 41.7% 18 21.4% 16 19.0% 10 11.9% 23 27.4% 9 10.7%

43
Table 32.–Number of households using longlines and reasons for not using longlines, 2006.
Kodiak Sitka No. Pctg. No. Pctg.
Households participating in project 170 110Completed summary interviews 147 84Using longline (skate) in 2006 46 31.3% 38 45.2%Not using longline in 2006 101 68.7% 46 54.8%Ever used a longline 67 45.6% 43 51.2% Reasons for not using longlinea Don't know how to use it 0 0.0% 1 2.2%Too expensive to purchase/maintain 2 2.0% 0 0.0%Harvest enough with rod and reel 11 10.9% 1 2.2%Don't own a longline 18 17.8% 2 4.3%No time to use a longline 5 5.0% 0 0.0%Plan to use in the future 3 3.0% 0 0.0%Prefer to use a rod and reel 2 2.0% 1 2.2%Only go sport fishing 3 3.0% 0 0.0%Too much work to use a longline 3 3.0% 0 0.0%Missing (no reason given) 54 53.5% 41 89.1%a. Includes all respondents to summary interviews, including
those that did not fish. Percentage is based on number of households that did not use longlines.
Table 33.–Number of years halibut fishers have used a longline (skate) for subsistence fishing.
Number of households reporting
Participating households
Complete summary interviews Never
1 year
2 years
3 years
4 years
5 years
6–10 years
10 years+ Missing
Kodiak 170 147 101 12 8 4 11 0 4 2 5 Sitka 110 84 45 7 5 4 13 3 2 3 2 Percentage of households
Participating households
Complete summary interviews Never
1 year
2 years
3 years
4 years
5 years
6–10 years
10 years+ Missing
Kodiak 170 147 68.7% 8.2% 5.4% 2.7% 7.5% 0.0% 2.7% 1.4% 3.4% Sitka 110 84 53.6% 8.3% 6.0% 4.8% 15.5% 3.6% 2.4% 3.6% 2.4% Note Does not include years the fisher used a longline in a commercial halibut fishery. Regulations allowing the use
of a longline in the subsistence halibut fishery came into effect in 2003.

44
Table 34.–Participation by SHARC holders less than 20 years old, subsistence halibut fishery, 2006.
Kodiak SitkaPercentage of total SHARCs issued 10.4% 9.1%Percentage of mailed survey returns 7.5% 8.0%Percentage of inseason project participants 19.5% 15.4%Percentage who fished, mailed survey 63.5% 33.7%Percentage who fished, inseason participants
37.3% 50.0%
Percentage of total community harvest, mailed survey
4.1% 3.1%
Percentage of total community harvest, inseason participants 8.2% 9.9%
Table 35.–Participation by SHARC holders 50 to 64 years old, subsistence halibut fishery, 2006.
Kodiak SitkaPercentage of total SHARCs issued 27.9% 28.5%Percentage of mailed survey returns 36.0% 33.1%Percentage of inseason project participants 24.3% 30.0%Percentage who fished, mailed survey 75.3% 59.1%Percentage who fished, inseason participants
52.1% 66.7%
Percentage of total community harvest, mailed survey
39.1% 28.1%
Percentage of total community harvest, inseason participants
30.8% 31.8%

45
Table 36.–Comparison of findings: Kodiak SHARC holders with the 2006 inseason project participants as a panel.
2005 panel ± CI%
2005 mail-out (comm est) ± CI%
2004 panel ± CI%
2004 mail-out (comm est) ± CI%
2003 panel ± CI%
2003 mail-out (comm est) ± CI%
Community SHARCs 1,741.00 1,741.00 1,561.00 1,561.00 1,345.00 1,345.00Sample size 198 996 163 870 148 944Sample fraction 11.4% 57.2% 10.4% 55.7% 11.0% 70.2%Fixed gear: number of fishers 1,160.7 1,245.0 1,016.1 1,072.0 581.6 559.9Fixed gear: percentage of SHARC
holders fishing 66.7% 71.5% 65.1% 68.7% 43.2% 41.6%
Fixed gear: number of halibut harvested
8,590.1 30.6% 8,402.3 5.7% 4,991.3 29.8% 7,098.4 10.1% 3,753.3 31.5% 4,403.5 4.9%
Fixed gear: average halibut per fisher
7.4 6.7 4.9 6.6 6.5 7.9
Fixed gear: pounds of halibut harvesteda
152,182.8 23.9% 169,721.2 5.5% 117,929.7 29.9% 143,193.4 7.9% 81,190.7 30.4% 107,578.1 5.1%
Fixed gear: average pounds per fishera
131.1 136.3 116.1 133.6 139.6 192.1
Fixed gear: average weight per halibuta
17.7 8.8% 20.2 1.8% 23.6 9.4% 20.2 1.8% 21.6 8.3% 24.4 1.0%
Hand gear: number of fishers 1,112.3 1,180.5 942.5 1,048.5 572.5 517.2Hand gear: percentage of SHARC
holders fishing 63.9% 67.8% 60.4% 67.2% 42.6% 38.5%
Hand gear: number of halibut harvested
5,080.1 40.2% 4,114.6 7.5% 2,736.6 42.3% 2,752.1 7.9% 2,508.2 38.2% 2,511.3 5.9%
Hand gear: average halibut per fisher
4.6 3.5 2.9 2.6 4.4 4.9
Hand gear: pounds of halibut harvesteda
74,547.7 28.6% 73,883.8 6.5% 62,815.8 48.8% 65,301.8 8.2% 57,444.2 40.9% 54,550.8 5.3%
Hand gear: average pounds per fishera
67.0 62.6 66.6 62.3 100.3 105.5
Hand gear: average weight per halibuta
14.7 10.0% 18.0 1.6% 23.0 12.5% 23.7 2.3% 22.9 6.3% 21.7 1.4%
All subsistence gear: number of fishers
1002.4 1012.8 785.3 873.8 681.6 681.8
All subsistence gear: percentage of SHARC holders fishing
57.6% 58.2% 50.3% 56.0% 50.7% 50.7%
All subsistence gear: number of halibut harvested
13,431.4 32.1% 12,418.9 5.2% 7,727.9 25.7% 9,798.2 7.8% 6,261.5 23.8% 6,873.3 3.9%
-continued-

46
Table 36. Page 2 of 2. 2005
panel ± CI%2005 mail-out
(comm est) ± CI%2004 panel ± CI%
2004 mail-out (comm est) ± CI%
2003 panel ± CI%
2003 mail-out (comm est) ± CI%
All subsistence gear: average halibut per fisher
13.4 12.3 9.8 11.2 9.2 10.1
All subsistence gear: pounds of halibut harvesteda
218,440.2 20.8% 240,753.2 4.5% 180,027.3 26.8% 206,807.3 6.2% 138,635.0 24.0% 160,325.1 4.0%
All subsistence gear: average pounds per fishera
217.9 237.7 229.2 236.7 203.4 235.2
All subsistence gear:: average weight per halibuta
16.3 9.1% 19.4 1.7% 23.3 10.6% 21.1 2.0% 22.1 7.4% 23.3 1.1%
64.0% 67.7% 64.6% 72.4% 59.9% 64.1% 37.8% 33.1% 35.4% 28.1% 40.1% 36.5%
Percentage of total subsistence halibut harvest, fixed gear
Percentage of total subsistence halibut harvest, hand gear
Percentage of total pounds subistence halibut harvest, fixed gear
69.7% 70.5% 65.5% 69.2% 58.6% 67.1%
Percentage of total pounds subsistence halibut harvest, hand gear
34.1% 30.7% 34.9% 31.6% 41.4% 34.0%
Sport: number of fishers 800.2 731.7 584.2 633.4 599.8 527.4 Sport: percentage of SHARC
holders fishing 46.0% 42.0% 37.4% 40.6% 44.6% 39.2%
Sport: number of halibut harvested 4,493.2 25.8% 4,319.2 5.7% 3,160.8 29.0% 3,636.3 8.8% 3,110.9 29.5% 2,993.0 6.8% Sport: average halibut per fisher 5.6 5.9 5.4 5.7 5.2 5.7 Sport: pounds of halibut harvesteda 88,547.0 25.0% 89,428.1 5.5% 65,460.2 30.4% 81,766.9 6.9% 88,042.6 32.6% 72,781.2 5.9% Sport: average pounds per fishera 110.7 122.2 112.1 129.1 146.8 138.0 Sport: average weight per halibuta 19.7 8.2% 20.7 1.7% 20.7 7.9% 22.5 1.9% 28.3 7.9% 24.3 1.1% All: number of fishers 1,266.2 1,227.1 1,015.1 1,071.2 908.8 903.3 All: percentage of SHARC holders
fishing 72.7% 70.5% 65.0% 68.6% 67.6% 67.2%
All: number of halibut harvested 17,836.6 28.2% 16,676.7 4.5% 10,811.6 21.4% 13,295.6 6.3% 9,281.5 21.0% 9,804.8 3.6% All: average halibut per fisher 14.1 13.6 10.7 12.4 10.2 10.9 All: pounds of halibut harvesteda 305,932.1 18.1% 328,929.2 3.9% 243,332.7 23.2% 284,614.3 5.2% 225,314.4 22.2% 231,445.3 3.5% All: average pounds per fishera 241.6 268.1 239.7 265.7 247.9 256.2 All: average weight per halibuta 17.2 8.8% 19.7 1.7% 22.5 10.4% 21.4 1.9% 24.3 7.9% 23.6 1.1% a. Dressed weight.
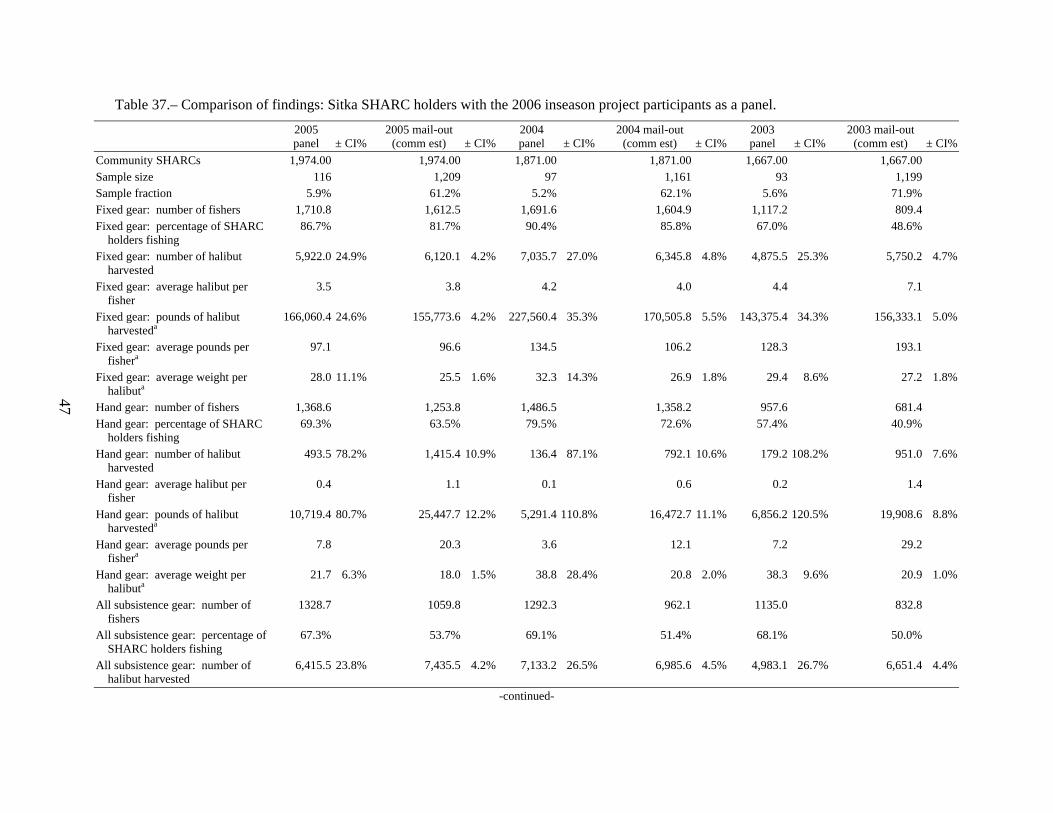
47
Table 37.– Comparison of findings: Sitka SHARC holders with the 2006 inseason project participants as a panel.
2005 panel ± CI%
2005 mail-out (comm est) ± CI%
2004 panel ± CI%
2004 mail-out (comm est) ± CI%
2003 panel ± CI%
2003 mail-out (comm est) ± CI%
Community SHARCs 1,974.00 1,974.00 1,871.00 1,871.00 1,667.00 1,667.00Sample size 116 1,209 97 1,161 93 1,199Sample fraction 5.9% 61.2% 5.2% 62.1% 5.6% 71.9%Fixed gear: number of fishers 1,710.8 1,612.5 1,691.6 1,604.9 1,117.2 809.4Fixed gear: percentage of SHARC
holders fishing 86.7% 81.7% 90.4% 85.8% 67.0% 48.6%
Fixed gear: number of halibut harvested
5,922.0 24.9% 6,120.1 4.2% 7,035.7 27.0% 6,345.8 4.8% 4,875.5 25.3% 5,750.2 4.7%
Fixed gear: average halibut per fisher
3.5 3.8 4.2 4.0 4.4 7.1
Fixed gear: pounds of halibut harvesteda
166,060.4 24.6% 155,773.6 4.2% 227,560.4 35.3% 170,505.8 5.5% 143,375.4 34.3% 156,333.1 5.0%
Fixed gear: average pounds per fishera
97.1 96.6 134.5 106.2 128.3 193.1
Fixed gear: average weight per halibuta
28.0 11.1% 25.5 1.6% 32.3 14.3% 26.9 1.8% 29.4 8.6% 27.2 1.8%
Hand gear: number of fishers 1,368.6 1,253.8 1,486.5 1,358.2 957.6 681.4Hand gear: percentage of SHARC
holders fishing 69.3% 63.5% 79.5% 72.6% 57.4% 40.9%
Hand gear: number of halibut harvested
493.5 78.2% 1,415.4 10.9% 136.4 87.1% 792.1 10.6% 179.2 108.2% 951.0 7.6%
Hand gear: average halibut per fisher
0.4 1.1 0.1 0.6 0.2 1.4
Hand gear: pounds of halibut harvesteda
10,719.4 80.7% 25,447.7 12.2% 5,291.4 110.8% 16,472.7 11.1% 6,856.2 120.5% 19,908.6 8.8%
Hand gear: average pounds per fishera
7.8 20.3 3.6 12.1 7.2 29.2
Hand gear: average weight per halibuta
21.7 6.3% 18.0 1.5% 38.8 28.4% 20.8 2.0% 38.3 9.6% 20.9 1.0%
All subsistence gear: number of fishers
1328.7 1059.8 1292.3 962.1 1135.0 832.8
All subsistence gear: percentage of SHARC holders fishing
67.3% 53.7% 69.1% 51.4% 68.1% 50.0%
All subsistence gear: number of halibut harvested
6,415.5 23.8% 7,435.5 4.2% 7,133.2 26.5% 6,985.6 4.5% 4,983.1 26.7% 6,651.4 4.4%
-continued-

48
Table 37. Page 2 of 2. 2005
panel ± CI%2005 mail-out
(comm est) ± CI%2004 panel ± CI%
2004 mail-out (comm est) ± CI%
2003 panel ± CI%
2003 mail-out (comm est) ± CI%
All subsistence gear: average halibut per fisher
4.8 7.0 5.5 7.3 4.4 8.0
All subsistence gear: pounds of halibut harvesteda
176,779.7 23.2% 178,240.3 4.1% 232,120.9 34.5% 185,068.9 5.3% 148,147.9 37.6% 174,685.6 4.7%
All subsistence gear: average pounds per fishera
133.1 168.2 179.6 192.4 130.5 209.8
All subsistence gear: average weight per halibuta
27.6 11.0% 24.0 1.5% 32.5 14.2% 26.5 1.8% 29.7 8.4% 26.3 1.8%
Percentage of total subsistence halibut harvest, fixed gear
92.3% 82.3% 98.6% 90.8% 97.8% 86.5%
Percentage of total subsistence halibut harvest, hand gear
7.7% 19.0% 1.9% 11.3% 3.6% 14.3%
Percentage of total pounds subsistence halibut harvest, fixed gear
93.9% 87.4% 98.0% 92.1% 96.8% 89.5%
Percentage of total pounds subsistence halibut harvest, hand gear
6.1% 14.3% 2.3% 8.9% 4.6% 11.4%
Sport: number of fishers 322.7 489.9 462.9 427.1 354.7 406.1Sport: percentage of SHARC
holders fishing 16.3% 24.8% 24.7% 22.8% 21.3% 24.4%
Sport: number of halibut harvested 1,100.9 77.0% 3,024.4 25.4% 694.4 43.5% 1,443.0 10.0% 453.0 66.3% 1,423.7 5.7%Sport: average halibut per fisher 3.4 6.2 1.5 3.4 1.3 3.5Sport: pounds of halibut harvesteda 27,617.0 94.2% 69,945.9 32.6% 13,801.0 45.2% 25,228.1 9.5% 13,657.6 85.7% 33,207.2 6.1%Sport: average pounds per fishera 85.6 142.8 29.8 59.1 38.5 81.8Sport: average weight per halibuta 25.1 12.5% 23.1 1.7% 19.9 16.0% 17.5 1.7% 30.2 7.4% 23.3 1.3% All: number of fishers 1,276.3 1,120.1 1,408.1 1,087.8 1,308.5 978.8All: percentage of SHARC holders
fishing 64.7% 56.7% 75.3% 58.1% 78.5% 58.7%
All: number of halibut harvested 7,516.4 24.0% 10,367.1 8.1% 7,827.6 24.5% 8,397.7 4.4% 5,327.3 25.2% 7,885.5 4.0%All: average halibut per fisher 5.9 9.3 5.6 7.7 4.1 8.1All: pounds of halibut harvesteda 204,396.8 23.9% 245,786.3 9.7% 245,922.0 32.7% 209,298.1 4.9% 156,369.7 35.2% 205,767.6 4.2%All: average pounds per fishera 160.1 219.4 174.7 192.4 119.5 210.2All: average weight per halibuta 27.2 10.7% 23.7 1.5% 31.4 12.0% 24.9 1.8% 29.4 8.3% 26.1 1.7%a. Dressed weight.

49
Table 38.–Mean halibut harvests by gear, inseason sample and mailed returns, Kodiak and Sitka, 2006.
Kodiak Sitka Inseason sample
Mailed returns
Inseason sample
Mailed returns
Fixed gear Mean number of halibut per fishera 4.3 7.5 4.7 6.8 Mean pounds of halibut per fisher 118.8 180.8 128.6 173.5 Hand gear Mean number of halibut per fisher 4.6 4.6 0.9 2.9 Mean pounds of halibut per fisher 107.9 95.8 16.1 47.3 All subsistence gear Mean number of halibut per fisher 6.4 9.9 4.8 7.7 Mean pounds of halibut per fisher 164.0 228.4 130.0 185.1 Sport fishing Mean number of halibut per fisher 3.8 5.3 6.9 3.1 Mean pounds of halibut per fisher 91.7 119.1 150.1 54.2 a. Means are based on the number of fishers using each type of gear.
Table 39.–Participation in halibut fishing, inseason sample and mailed returns, Kodiak and Sitka, 2006.
Kodiak Sitka Inseason sample
Mailed returns
Inseason sample
Mailed returns
Percentage fishing, fixed gear 33.9% 54.5% 50.0% 45.2%Percentage fishing, hand gear 28.9% 42.8% 15.1% 22.1%Percentage fishing, any subsistence gear 43.5% 61.1% 51.3% 48.0%Percentage sport fishing 18.9% 39.9% 8.0% 23.3%Percentage any halibut fishing 52.5% 72.0% 58.0% 55.3%

50
Figure 1.–Tape measure included with mailing to random sample, May 2006.
68%
41%
63%
23%
47%
27%
9%
12%
10%
41%
18%
34%
47%
66%
53%
13% 15
%
13%
0%
10%
20%
30%
40%
50%
60%
70%
80%
Partici
pating: r
ural
Partici
pating: t
ribal
Partici
pating: a
ll
No contac
t: ru
ral
No contac
t: tri
bal
No contac
t: all
Refuse
d: rural
Refuse
d: trib
al
Refuse
d: all
Perc
enta
ge o
f SH
AR
Cs
in R
ando
m S
ampl
e
Kodiak (300 SHARCs; 249 rural, 51 tribal)
Sitka (345 SHARCs; 247 rural, 98 tribal)
Figure 2.–Disposition of random sample of SHARC holders for inseason subsistence halibut harvest
project, by SHARC type, Kodiak and Sitka.

51
30.8%
7.7%
11.5% 11.5%
38.5%36.4%
9.1%11.4%
6.8%
36.4%
0%
5%
10%
15%
20%
25%
30%
35%
40%
45%
50%
Doesn't plan to fish Too busy Illness Miscellaneous/other No reason given ornot recorded
Perc
enta
ges
of re
fusa
ls
Kodiak Sitka
Figure 3.–Reasons offered for not participating in subsistence halibut inseason harvest project.
74%
51%
70%69%
46%
66%65%
56%
64%68%
48%
65%68%
41%
63%
0%
10%
20%
30%
40%
50%
60%
70%
80%
Rural SHARCs Tribal SHARCs All resident SHARCs
2003: mailout 2004: mailout 2005: mailout 2006: mailout 2006: inseason
Figure 4.–Response rates by year, Kodiak, subsistence halibut harvest monitoring project.

52
75%
63%
72%67%
90%
72%69%
64%68%
72%
59%
69%
41%
18%
34%
0%
10%
20%
30%
40%
50%
60%
70%
80%
90%
100%
Rural SHARCs Tribal SHARCs All resident SHARCs
2003: mailout 2004: mailout 2005: mailout 2006: mailout 2006: inseason
Figure 5.– Response rates by year, Sitka, subsistence halibut harvest monitoring project.
11.8%
22.2%
13.3%
23.4%
50.0%
28.6%
0%
10%
20%
30%
40%
50%
60%
Kodiak: rural Kodiak: tribal Kodiak: all Sitka: rural Sitka: tribal Sitka: all
Perc
enta
ge o
f con
tact
ed S
HA
RC
hol
ders
Figure 6.–Refusal rates by SHARC type, subsistence halibut harvest monitoring project.

53
12%
22%
13%
23%
50%
29%
0%
10%
20%
30%
40%
50%
60%
Kodiak: rural Kodiak: tribal Kodiak: all Sitka: rural Sitka: tribal Sitka: all
Perc
enta
ge o
f con
tact
ed S
HA
RC
hol
ders
Figure 7.–Disposition of random sample of SHARC holders for inseason subsistence halibut harvest
monitoring project by SHARC type, Kodiak and Sitka.
581
495
747
948
286
973
935
734
1,04
8
856
419
910
840
662
967
867
406
917
0
200
400
600
800
1,000
1,200
Kodiak: set gear Kodiak: hand gear Kodiak: total Sitka: set gear Sitka: hand gear Sitka: total
Inseason Mail-out Combined
Figure 8.–Comparison of 2006 estimated number of fishers, inseason, mail-out, and combined
samples, Kodiak and Sitka.

54
34%
29%
44%
19%
53%54%
43%
61%
40%
72%
49%
39%
56%
34%
67%
0%
10%
20%
30%
40%
50%
60%
70%
80%
Fishing with setgear
Fishing with handgear
Subsistence fishing,any gear
Sport fishing Any halibut fishing
Perc
enta
ge o
f SH
AR
Cs
Inseason sample Mail sample Combined sample
Figure 9.–Participation rates, Kodiak, inseason sample, mail sample, and combined sample, 2006.
50%
15%
51%
8%
58%
45%
22%
48%
23%
55%
46%
21%
48%
22%
56%
0%
10%
20%
30%
40%
50%
60%
70%
Fishing with setgear
Fishing with handgear
Subsistence fishing,any gear
Sport fishing Any halibut fishing
Perc
enta
ge o
f SH
AR
Cs
Inseason sample Mail sample Combined sample
Figure 10.–Participation rates, Sitka, inseason sample, mail sample, and combined sample, 2006.

55
69,0
09
53,4
65
122,
474
121,
821
4,62
5
126,
446
169,
058
70,2
78
239,
336
148,
597
19,8
22
168,
419
142,
194
65,7
63
207,
957
145,
508
18,0
69
163,
577
0
50,000
100,000
150,000
200,000
250,000
300,000
Kodiak: set gear Kodiak: hand gear Kodiak: total Sitka: set gear Sitka: hand gear Sitka: total
Inseason Mail-out Combined
Figure 11.–Comparing 2006 estimated harvests in pounds, by gear, inseason and mail-out samples,
Kodiak and Sitka.
0
20,000
40,000
60,000
80,000
100,000
120,000
140,000
160,000
180,000
200,000
Kodiak Sitka
Poun
ds u
sabl
e w
eigh
t of h
alib
ut
Inseason Mail-out
Figure 12.–Estimated subsistence halibut harvests and confidence range, set gear, inseason sample and
mail-out sample, Kodiak and Sitka, 2006.

56
0
10,000
20,000
30,000
40,000
50,000
60,000
70,000
80,000
90,000
Kodiak Sitka
Poun
ds u
sabl
e w
eigh
t of h
alib
ut
Inseason Mail-out
Figure 13.–Estimated subsistence halibut harvests and confidence range, hand gear, inseason sample
and mail-out sample, Kodiak and Sitka, 2006.
0
50,000
100,000
150,000
200,000
250,000
300,000
Kodiak Sitka
Poun
ds u
sabl
e w
eigh
t of h
alib
ut
Inseason Mail-out
Figure 14.–Estimated subsistence halibut harvests and confidence range, all gear types, inseason
sample and mail-out sample, Kodiak and Sitka, 2006.

57
0% 0% 0%
2%
8%
26%
45%
37%
18%
2%
0% 0%
7%
4% 3%
5% 4%
13%
33%
46%
38%
25%
4%
0%
2%
0%0%
5%
10%
15%
20%
25%
30%
35%
40%
45%
50%
Janu
ary
Februa
ryMarc
hApri
lMay
June Ju
ly
Augus
t
Septem
ber
Octobe
r
Novem
ber
Decem
ber
Unkno
wn
2004 2006
Figure 15.–Percentage of subsistence halibut fishers by month, Kodiak, 2004 and 2006.
0% 0% 0%
1%
4%
17%
33%
23%
13%
1%
0% 0%
7%
0% 0%
4%
1%
5%
20%
27%
24%
14%
2%
0%
1%
0%0%
5%
10%
15%
20%
25%
30%
35%
Janu
ary
Februa
ryMarc
hApri
lMay
June Ju
ly
Augus
t
Septem
ber
Octobe
r
Novem
ber
Decem
ber
Unkno
wn
2004 2006
Figure 16.–Percentage of subsistence halibut harvest by month, Kodiak, 2004 and 2006.

58
0% 1% 1%
4%
14%
30%
45%
37%
11%
2% 2%
0%
7%
1% 1%
4%
8%
23%
39%
45%
27%
21%
8%
1%
0%
1%
0%
5%
10%
15%
20%
25%
30%
35%
40%
45%
50%
Janu
ary
Februa
ryMarc
hApri
lMay
June Ju
ly
Augus
t
Septem
ber
Octobe
r
Novem
ber
Decem
ber
Unkno
wn
2004 2006
Figure 17.–Percentage of subsistence halibut fishers by month, Sitka, 2004 and 2006.
0% 0% 0%
1%
8%
19%
30%
28%
7%
1% 1% 0%
5%
4%
1%
7%
2%
9%
25%
30%
15%
6%
0% 0% 0% 1%
0%
5%
10%
15%
20%
25%
30%
35%
Janu
ary
Februa
ryMarc
hApri
lMay
June Ju
ly
Augus
t
Septem
ber
Octobe
r
Novem
ber
Decem
ber
Unkno
wn
2004 2006
Figure 18.–Percentage of subsistence halibut harvest by month, Sitka, 2004 and 2006.

59
15%
26%
33%
56%
17%15%
6%
15%
2%0%
2%
11%
33%
15%
9%7%
0%
10%
20%
30%
40%
50%
60%
Kodiak Sitka
Per
cent
age
of re
spon
dent
s w
ho d
id n
ot m
eet h
arve
st g
oals
Bad weather
Too busy
Poor fishing/fish scarce
Equipment problems
Cost of fuel
Health or injury
Not yet: still plan to fish
No reason given
Figure 19.–Reasons for not meeting halibut harvest goals, Kodiak and Sitka, 2006.
18%
32%
12% 11%
70%
57%
0%
10%
20%
30%
40%
50%
60%
70%
80%
Kodiak Sitka
Perc
enta
ge o
f res
pond
ents
who
fish
ed in
200
6
Higher in 2006 About the same Lower in 2006
Figure 20.–Comparing halibut harvests in 2006 with previous 3 years, Kodiak and Sitka.

60
83%
100%
24%
0%
14%
0%0% 0%0%
10%
20%
30%
40%
50%
60%
70%
80%
90%
100%
Kodiak Sitka
Perc
enta
ge o
f sur
vey
resp
ondn
ets
Received halibut from other households Removed halibut from commercial catchPurchased halibut directly from a commercial fisher Purchased halibut in a store
Figure 21.–Source of halibut for those households that did not participate in the subsistence halibut or
sport fishery in 2006 but used halibut.
49%51%
80%
46%
22%
29%
80%
66%
44%
26%
0%
10%
20%
30%
40%
50%
60%
70%
80%
90%
Kodiak Sitka
Perc
enta
ge o
f res
pond
ents
repo
ring
any
chan
ges
Changes in location Changes in size Changes in seasonality Changes in abundance Other changes
Figure 22.–Changes observed in halibut stocks.

61
0.00
20,000.00
40,000.00
60,000.00
80,000.00
100,000.00
120,000.00
140,000.00
160,000.00
180,000.00
1 21 41 61 81 101
121
141
161
181
201
221
241
261
281
301
321
341
361
381
401
421
441
461
481
501
521
541
561
581
601
621
641
661
681
701
721
741
761
781
801
Number SHARCs
Roun
d Weigh
t (Lbs)
CumulativeHarvest
Figure 23.–Cumulative estimated harvests, pounds of halibut, of Kodiak respondents to mailed survey.
0.00
5,000.00
10,000.00
15,000.00
20,000.00
25,000.00
30,000.00
1 9 17 25 33 41 49 57 65 73 81 89 97 105
113
121
129
137
145
153
161
169
177
185
193
201
209
217
225
233
241
249
257
265
273
281
289
297
Number SHARCs
Roun
d Weigh
t (Lbs)
CumulativeHarvest
Figure 24.–Cumulative estimated harvests, pounds of halibut, of Kodiak respondents to inseason
survey.

62
0.00
20,000.00
40,000.00
60,000.00
80,000.00
100,000.00
120,000.00
140,000.00
1 28 55 82 109
136
163
190
217
244
271
298
325
352
379
406
433
460
487
514
541
568
595
622
649
676
703
730
757
784
811
838
865
892
919
946
973
1000
1027
1054
1081
1108
1135
Number SHARCs
Roun
d Weight (Lbs)
CumulativeHarvest
Figure 25.–Cumulative estimated harvest, pounds of halibut, of Sitka respondents to mailed survey.
0.00
2,000.00
4,000.00
6,000.00
8,000.00
10,000.00
12,000.00
14,000.00
1 5 9 13 17 21 25 29 33 37 41 45 49 53 57 61 65 69 73 77 81 85 89 93 97 101
105
109
113
117
121
125
129
133
137
141
145
149
Number SHARCs
Roun
d Weight (Lbs)
CumulativeHarvest
Figure 26.–Cumulative estimated harvest, pounds of halibut, of Sitka respondents to inseason surveys.

63
0.0%
2.0%
4.0%
6.0%
8.0%
10.0%
12.0%
14.0%
16.0%
18.0%
0‐5 5‐10 10‐15 15‐20 20‐25 25‐30 30‐35 35‐40 40‐45 45‐50 50‐55 55‐60 60‐65 65‐70 70‐75 75‐80 80‐85 85‐90 90+
SHARC holder age in years
Percen
t of SHARC
holde
rs
In Season Sample
Mailout Returns
All SHARCs
Figure 27.–Ages of Kodiak SHARC holders participating in inseason project and responding to mailed
survey, 2006.
0.0%
2.0%
4.0%
6.0%
8.0%
10.0%
12.0%
14.0%
16.0%
18.0%
20.0%
0‐5 5‐10 10‐15 15‐20 20‐25 25‐30 30‐35 35‐40 40‐45 45‐50 50‐55 55‐60 60‐65 65‐70 70‐75 75‐80 80‐85 85‐90 90+
inseason
mail only
All SHARCs
Figure 28.–Percentage of SHARC holders fishing in Kodiak, by age group, 2006.

64
0.0%
5.0%
10.0%
15.0%
20.0%
25.0%
0‐5 5‐10 10‐15 15‐20 20‐25 25‐30 30‐35 35‐40 40‐45 45‐50 50‐55 55‐60 60‐65 65‐70 70‐75 75‐80 80‐85 85‐90 90+
inseason
mail only
All SHARCs
Figure 29.–Percentage of pounds harvested in Kodiak, by age group, 2006.
0.0%
2.0%
4.0%
6.0%
8.0%
10.0%
12.0%
14.0%
16.0%
0‐5 5‐10 10‐15 15‐20 20‐25 25‐30 30‐35 35‐40 40‐45 45‐50 50‐55 55‐60 60‐65 65‐70 70‐75 75‐80 80‐85 85‐90 90+
In Season Sample
Mailout Returns
All SHARCs
Figure 30.– Ages of Sitka SHARC holders participating in inseason project and responding to mailed
survey, 2006.

65
0.0%
2.0%
4.0%
6.0%
8.0%
10.0%
12.0%
14.0%
16.0%
18.0%
20.0%
0‐5 5‐10 10‐15 15‐20 20‐25 25‐30 30‐35 35‐40 40‐45 45‐50 50‐55 55‐60 60‐65 65‐70 70‐75 75‐80 80‐85 85‐90 90+
In Season Sample
Mailout Returns
All SHARCs
Figure 31.– Percentage of SHARC holders fishing in Sitka, by age group, 2006.
0.0%
5.0%
10.0%
15.0%
20.0%
25.0%
0‐5 5‐10 10‐15 15‐20 20‐25 25‐30 30‐35 35‐40 40‐45 45‐50 50‐55 55‐60 60‐65 65‐70 70‐75 75‐80 80‐85 85‐90 90+
In Season Sample
Mailout Returns
All SHARCs
Figure 32.– Percentage of pounds harvested in Sitka, by age group, 2006.

66
0
50,000
100,000
150,000
200,000
250,000
300,000
2003 2004 2005 2006
Kodiak Panel
Kodiak Mail‐out
Figure 33.–Kodiak subsistence harvest of halibut, panel vs. mail-out.
0
50,000
100,000
150,000
200,000
250,000
300,000
350,000
2003 2004 2005 2006
Sitka Panel
Sitka Mail‐out
Figure 34.–Sitka subsistence harvest of halibut, panel vs. mail-out.

67
APPENDIX A: INTRODUCTORY LETTER

68
Appendix A.–Introductory letter.

69
APPENDIX B: FORM 1–SHARC HOLDER RECALL FORM JANUARY–JUNE 2006

70
SHARC HOLDER RECALL FORM: JANUARY - JUNE 2006
SHARC NUMBER
NAME
ADDRESS
PHONE NUMBER
E-MAIL ADDRESS
For the period January 1 through June 30, 2006, did you subsistence or sport fish for halibut?
Yes No
If yes, complete the following formPounds = round (live) weightPlease include only fish that you harvested. Do not include fish you received from others.
Rockfish LingcodNumber Pounds Hooks Number Pounds Hooks Number Pounds (number) (number) Location Fished
January
February
March
April
May
June
Please add notes on reverse
ADF&G staff who completed this form:
For more information, contact: Division of Subsistence, ADF&G (907-267-2353)FORM 1
SportHalibut Harvests
Set Line Gear Subsistence Hand Operated Gear
Appendix B.–Form 1: SHARC holder recall form, January–June 2006.

71
APPENDIX C: FORM 2–HALIBUT FISHING TRIP SUMMARY, JULY AND AUGUST 2006

72
DATE FISHED
SHARC NUMBER
NAME
ADDRESS
PHONE NUMBER E-MAIL
Number of Halibut
Harvested
Number of Rockfish
Harvested
Number of Lingcod
Harvested
Complete a line for each HALIBUT. Use a second form if you harvested more than 12.Only record information for fish you harvested yourself; do not include fish given to you.If you do not have time to measure your halibut, please still provide an estimate of round weight
Length
Weight (estimated round/live)
Gear: Setline or handheld
Number of Hooks Fished
Subsistence or Sport?
1
2
3
4
5
6
7
8
9
10
11
12
Complete a line for each ROCKFISH. Use a second form if you harvested more than 5.If you do not know the species of rockfish, write "unknown".
Gear: Setline or handheld
Number of Hooks Fished
Subsistence or Sport?
1
2
3
4
5
Please add your comments on reverse of this form.For more information, contact: Subsistence Halibut Project, Division of Subsistence, ADF&G (907-267-2353)
ADF&G Staff collecting this form: FORM 2
HALIBUT FISHING TRIP SUMMARY: JULY and AUGUST 2006
Species
Location
Location
Appendix C.–Form 2: Halibut fishing trip summary, July and August 2006.

73
FISHER'S COMMENTS AND NOTES.
For Use by ADF&G Staff:

74
APPENDIX D: MEASURING METHOD

75
Appendix D.–Measuring method.
Appendix(Source Gregg Williams, International Pacific Halibut Commission) The fork length of halibut is from the snout to the fork of the tail and will be measured in inches and converted to centimeters by ADF&G. The fish should be placed on a flat surface. A common mistake is not ensuring that the fish is level. Place the fish black side up, with snout against an upright so that the mouth is closed. The measurement can be taken in one of two ways. The first is laying the measuring tape over the fish. If this is done, be very careful that the tape is held horizontal above the fish and not laying on the fish, which will create measurement error. A second method is with the fish laying flat on a board with the snout up against a vertical upright, make a mark on the surface under the fish at the middle of the tail fork. Remove fish and measure from upright to mark (see sketch).

76
APPENDIX E: “PELAGIC AND NON-PELAGIC ROCKFISH” PAGE FROM SPORT FISHING REGULATION SUMMARY

77
Appendix E.–“Pelagic and Non-Pelagic Rockfish” page from the sport fishing regulation summary booklet.

78
APPENDIX F: FORM 3–SHARC HOLDER TRACKING FORM

79
Appendix F.–Form 3: SHARC holder tracking form.
SHARC HOLDER TRACKING FORM
SHARC NUMBER
NAME
ADDRESS
PHONE NUMBER
E-MAIL ADDRESS
Yes (date) No Yes No Notes (continue on reverse if necessary)
Recall Information, Jan - June 2006
Week One: July 1 to July 8
Week Two: July 9 to July 15
Week Three: July 16 to July 22
Week Four: July 23 to July 29
Week Five: July 30 to August 5
Week Six: August 6 to August 12
Week Seven: August 13 to August 19
Week Eight: August 20 to August 26
Week Nine: August 27 to August 31
Remainder of Year: Sept to Dec. 2006
Please add notes on reverse
ADF&G Staff who completed this form:
For more information, contact: Subsistence Halibut Project, Division of Subsistence, ADF&G (907-267-2353)
FORM 3
Contacted/Collected Forms? Fished?

80
APPENDIX G: FORM 4–HALIBUT HARVEST RECORDING FORM, SEPTEMBER–DECEMBER 2006

81
Appendix G.–Form 4: Halibut harvest recording form, September–December 2006. HALIBUT HARVEST RECORDING FORM: SEPT - DEC 2006
SHARC NUMBER
NAME
ADDRESS
PHONE NUMBER E-MAIL
For the period September 1 through December 31, 2006, did you subsistence or sport fish for halibut?
Yes No
If yes, complete the following form. Complete one line for each day fished. Please record pounds in ROUND (LIVE) weight.Only record fish you harvested. Do not include fish you received from others. Use additional forms if necessary.
Rockfish LingcodDate Number Pounds Hooks Number Pounds Hooks Number Pounds (number) (number) Location Fished
Please add your comments and notes on the reverse.
Please return to: Subsistence Halibut Project, Division of Subsistence, ADF&G, 333 Raspberry Road, Anchorage, AK, 99518
For more information, contact: Subsistence Halibut Project, Division of Subsistence, ADF&G (907-267-2353)
Halibut Harvests
FORM 4
Set Line Gear Subsistence Hand Operated Gear Sport

82
APPENDIX H: INTERVIEW PROTOCOL

83
Appendix H.–Interview protocol.

84

85

86

87
88