estimates of variances due to parent of origin for...
TRANSCRIPT
K.M. August 5, 2011 Imprinting effects on weights
Estimates of variances due to parent of origin for weights ofAustralian beef cattle
Karin Meyer and Bruce Tier
Animal Genetics and Breeding Unit1, University of New England, Armidale NSW 2351,
Australia
Abstract1
Estimates of variances due to differential expression of paternally and maternally2
derived genes can be obtained from animal model type analyses by fitting appropriate3
gametic effects. This is feasible for large scale analyses, as the inverse of the gametic4
relationship matrix can be set up directly from a list of pedigrees.5
We present a series of analyses applying such model for large sets of records for birth,6
weaning, yearling and final weights of Australian Angus and Hereford cattle. Results7
show that maternal genetic effects on these traits are largely confounded with maternal8
parent of origin effects, so that it is difficult to reliably separate the respective variance9
components. On the other hand, paternal parent of origin effects tend to act similarly10
to sire × herd effects so that estimates of their variance are inflated by any effects not11
modelled and contributing to such apparent interaction.12
Fitting an animal model with both parent of offspring effects, maternal genetic and13
permanent environmental effects as well as sire × herd and maternal grand-sire × herd of14
origin of dam interactions as additional random effects yielded estimates of the variance15
due to paternal parent of origin effects of 5 to 7% of the phenotypic variation for birth and16
weaning weights and of 0 to 1% for yearling and final weights. Corresponding estimates17
for maternal parent of origin effects were 0 to 11% for birth and weaning weights and 7 to18
8% for yearling and final weights, while sire and maternal grand-sire interaction effects19
explained from 0 to 4% of the phenotypic variance.20
1 Introduction21
So-called ‘parent of origin’ effects refer to the phenomenon that the expression of genes22
may depend on the sex of the parent from which they were inherited. Paternal imprinting23
1a joint venture with NSW Department of Primary Industries
1
K.M. August 5, 2011 Imprinting effects on weights
describes the scenario where alleles from the father are not or only partially expressed in his24
progeny, and, conversely, maternally imprinted genes are those inherited from the mother25
which are silenced in her offspring. This is predominantly attributed to differential DNA26
methylation during transcription (Ferguson-Smith, 2001); see Reik and Walter (2001) for a27
more detailed review. There are many reports for such mode of gene action in various28
species (e.g. Morison et al., 2005). Prominent examples for imprinted genes in livestock are29
the Callipyge gene in sheep (e.g. Georges et al., 2003) and DGAT-1 in dairy cows (Kuehn30
et al., 2007).31
As illustrated by Hill and Keightley (1988), imprinting changes the expectation of covariances32
among relatives. In a mixed model setting, this can be accommodated by fitting a model with33
animals’ gametic effects. This is feasible for large scale problems as the inverse of the gametic34
relationship matrix can be set up analogously to the inverse of the numerator relationship35
matrix from a list of pedigree information (Schaeffer et al., 1989). Alternatively, as proposed36
by Tier and Sölkner (1993), imprinting effects can be estimated by augmenting the standard37
animal model by gametic effects due to one parent, treating gametes as homozygous diploid38
individuals. Estimates of variances due to imprinting obtained fitting such model have been39
reported for growth of pigs (Vries et al., 1994), carcass characteristics of beef cattle (Engellandt40
and Tier, 2002) and dairy- and fitness-related traits recorded on dairy cows (Kaiser et al.,41
1998; Essl and Voith, 2002b). However, these analyses were limited to considering imprinting42
from one parent only. Essl and Voith (2002a) suggested to employ separate sire and dam43
model analyses to assess the difference between paternal and maternal imprinting. More44
recently Neugebauer et al. (2010a,b) fitted a model with correlated sire and dam gametes to45
estimate imprinting variances for both sexes simultaneously, considering growth and carcass46
traits in pigs and beef cattle. However these analyses lacked constraints appropriate to the47
parameterisation chosen, resulting in negative estimates of variances in several instances.48
As discussed by Tier and Meyer (2011), in principle there are seven parameters to fully49
describe gene action with imprinting under the infinitessimal model: The additive genetic50
variance due to non-imprinted genes, the variances due genes fully imprinted maternally51
or paternally, and the corresponding variances due to partially imprinted alleles together52
with the respective degrees of imprinting. However, in practice, effects to the different53
groups of genes can not be separated – we can only distinguish between variances due54
animals’ maternal and paternal gametes and the covariance between them, i.e. estimate55
three parameters. Thus, a common assumption is that there is no partial imprinting.56
2
K.M. August 5, 2011 Imprinting effects on weights
Conceptually, modelling in the presence of imprinting is most transparent by considering57
variances due to gametes originating from different parents. We can then fit a gametic58
model with random effects due to animals’ maternal and paternal gametes, and interpret59
the covariance between them as representing half of the additive genetic variance due to60
non-imprinted genes, whilst the differences in estimates of the gametic variances and the61
covariances yield estimates of the corresponding variances due to the parents of origin.62
For such model to yield estimates of the causal components within the parameter space,63
estimation needs to constrain estimates of the covariance to be no greater than either variance64
and be non-negative. Alternatively, an equivalent model is given by an animal model65
fitting both maternal and paternal gametic effects as additional, uncorrelated random effects.66
Tier and Meyer (2011) recently applied such models to carcass characteristics of beef cattle67
measured by live ultrasound scanning, and reported estimates of variances due to the parent68
of origin (POO) effects of up to 25% of the total genetic variance.69
So far, estimates of variances due to POO effects have only been reported for traits not subject70
to maternal effects. For several types of the most common covariances between relatives71
occurring in the analysis of data routinely collected in livestock improvement programmes,72
maternal additive genetic effects are confounded with maternal POO effects. Thus maternal73
effects may produce the same pattern of variation as the latter, and data spanning several74
generation or genomic information may be required to successfully differentiate between75
them (Hager et al., 2008). This paper investigates the scope for estimation of variances due76
to POO effects for early weights of Australian beef cattle, traits which are subject to both77
additive genetic and permanent environmental maternal effects.78
2 Material and Methods79
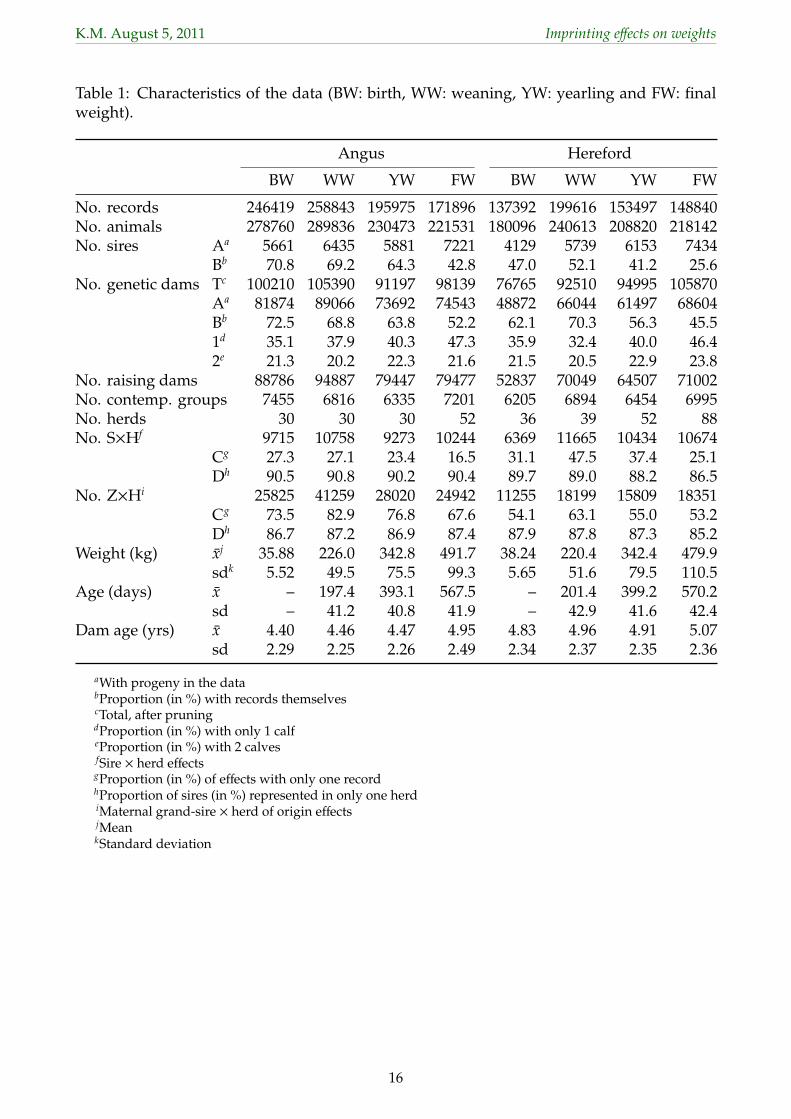
Records for birth (BW), weaning (WW), yearling (YW) and final (FW) weights of Australian80
Angus and Hereford cattle were extracted from the National Beef Recording Scheme (NBRS)81
data base, selecting the largest herds. Ages at recording considered were 80 to 300 days, 30182
to 500 days and 501 to 700 days for WW, YW and FW, respectively. For animals with more83
than one measurement in a given age range, only the first record was selected. Any weights84
recorded prior to 1985 and records for twins were disregarded. Additional edits eliminated85
records more than 2.5 standard deviations from the mean, records for animals with unknown86
sex, and any offspring of dams less than 19 months or more than 184 months old. Further,87
3
K.M. August 5, 2011 Imprinting effects on weights
any records in small contemporary group subclasses (defined below) comprising less than88
5 measurements were discarded. All pedigree information available for animals in the89
data and their parents was extracted recursively. Characteristics of the data structure are90
summarized in Table 1.91
Univariate analyses for all traits were carried out by restricted maximum likelihood fitting a92
series of models with increasing number of variance components. Model A was an animal93
model, fitting animals’ additive genetic as well as maternal genetic and permanent environ-94
mental effects as random effects. Models P and M fitted the same effects as model A and95
a single parental POO effect in addition, paternal and maternal respectively. Model F was96
model A augmented by both parental POO effects, treated as uncorrelated. Finally, model E97
extended model F by fitting the two corresponding POO effects for maternal genetic effects.98
These models were further expanded by fitting sire × herd (S×H) effects, denoted as models99
XS (for X=A, P, M, F, E), or S×H as well as maternal grand-sire× herd of origin of dam (Z×H)100
effects in addition (denoted as models XZ). Furthermore, models were fitted either assuming101
direct-maternal genetic correlations were zero or allowing for such covariance, denoted by102
subscript 0 and r, respectively, in the following. POO effects on direct and maternal genetic103
effects fitted in model E, however, were assumed to be uncorrelated. This yielded up to 30104
different analyses per trait and breed.105
For all models, contemporary groups were fitted as fixed effects. These were defined as106
subclasses given by herd, date of weighing, sex of calf and management groups. Date used107
was the calendar date, except for BW where date was defined as year-month. If the range108
of ages at weighing represented in a subclass exceeded 45 days for WW or 60 days for YW109
and FW, classes were subdivided further, a practice refereed to as ‘age slicing’. In addition,110
age at weighing was fitted as a linear covariable, nested within sex of calf (except for BW).111
Systematic differences due to age at dam where taken into account by fitting it as a linear112
and quadratic covariable as well as fitting a so-called heifer factor, i.e. a cross-classified fixed113
effect distinguishing between heifers (calving at less than 29 months old) and cows.114
Analyses were carried out using our software package Wombat (Meyer, 2007). For models115
other than model A, this required the inverse of the gametic relationship matrix to be set116
up and its determinant to be calculated externally, and to be supplied as a ‘user-defined’117
covariance matrix. This task was performed using the procedure described by Tier and118
Meyer (2011) (Fortran code given in the appendix of their paper). To reduce computational119
requirements, models F and E were fitted as the equivalent gametic models (c.f. Tier and120
4
K.M. August 5, 2011 Imprinting effects on weights
Meyer (2011)), unless constraints to ensure non-negative estimates of variances due to POO121
effects were required. Significance of random effects was assessed by comparing nested122
models with a likelihood ratio test, and standard errors of estimates were obtained from the123
inverse of the average information matrix.124
To investigate the effect of data and pedigree structure on estimates under the different125
models, additional analyses were carried out for simulated data. This was done replacing126
the data for the largest subset (WW for Angus) by records obtained sampling random effects127
in the full model (F0) from Normal distributions with population variances for direct, additive128
genetic effects, maternal additive genetic and permanent environmental effects, paternal and129
maternal POO effects, and residuals of 50, 20, 30, 10, 10 and 80, respectively, and a direct-130
maternal genetic correlation of zero. While no fixed effects were simulated, these were fitted131
in the analyses. A total of 10 replicates were sampled and analysed.132
3 Results133
3.1 Variances from different models134
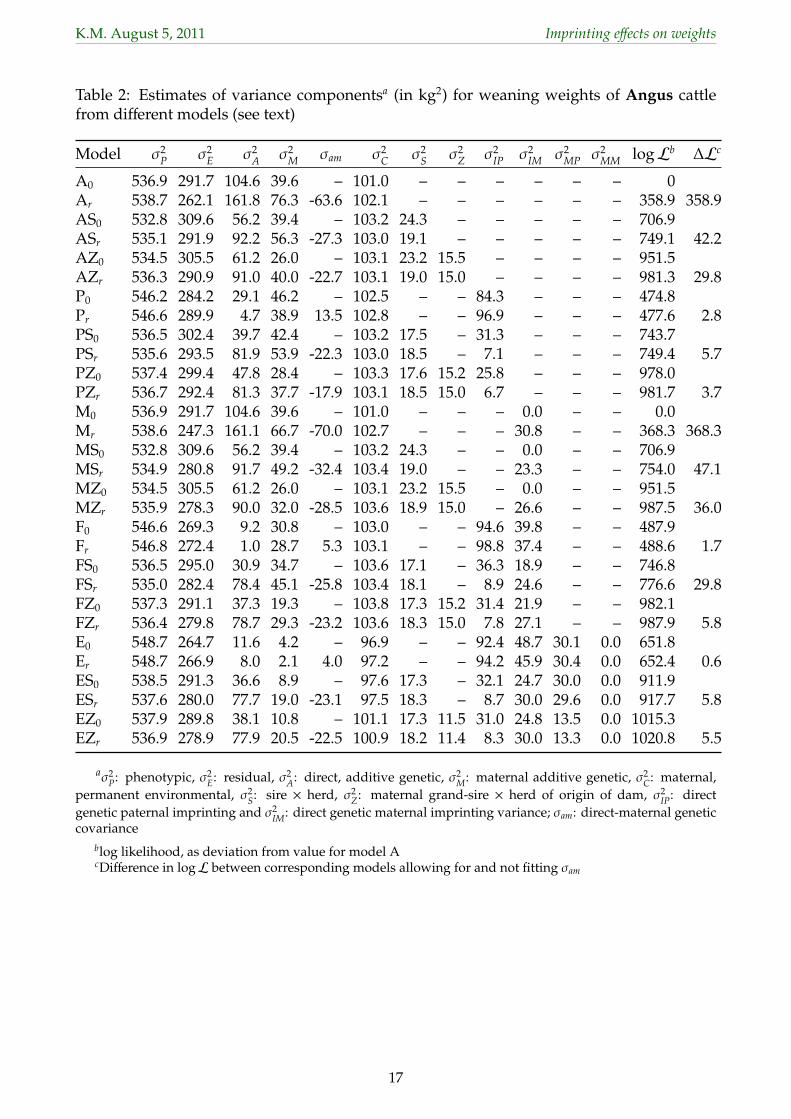
Estimates of variance components the 30 different analyses for weaning weights of Angus135
cattle are summarized in Table 2. Corresponding values for selected analyses for the other136
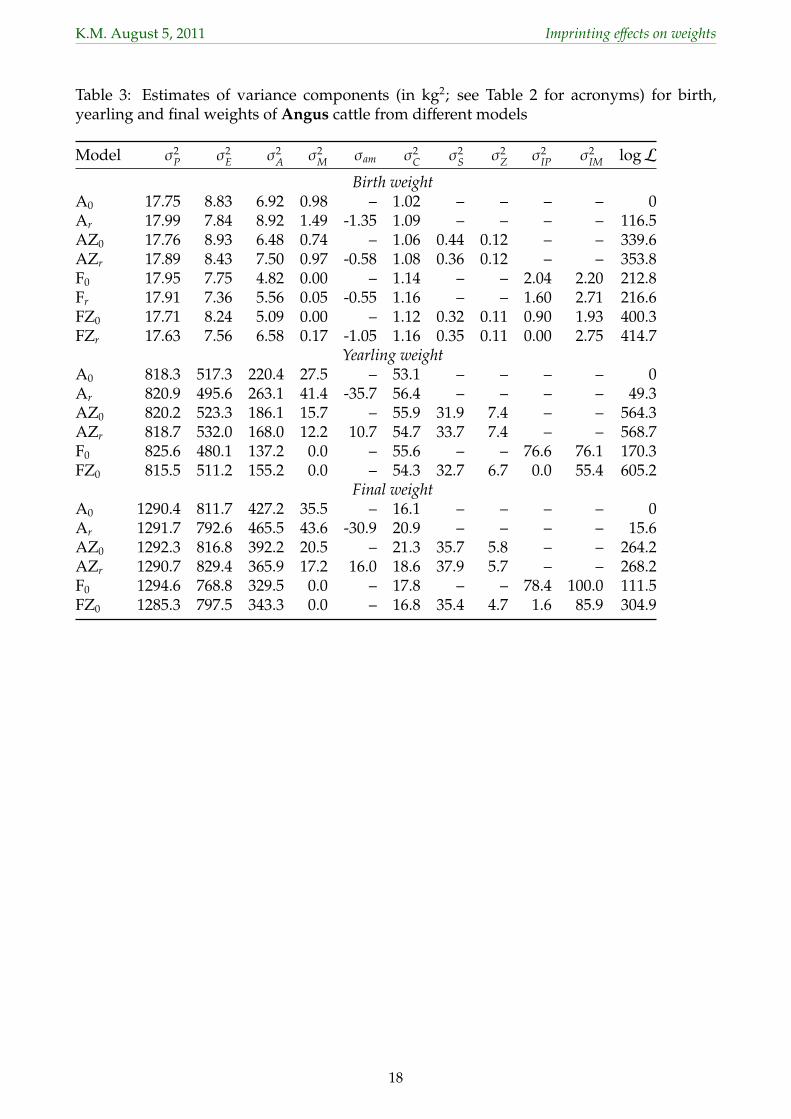
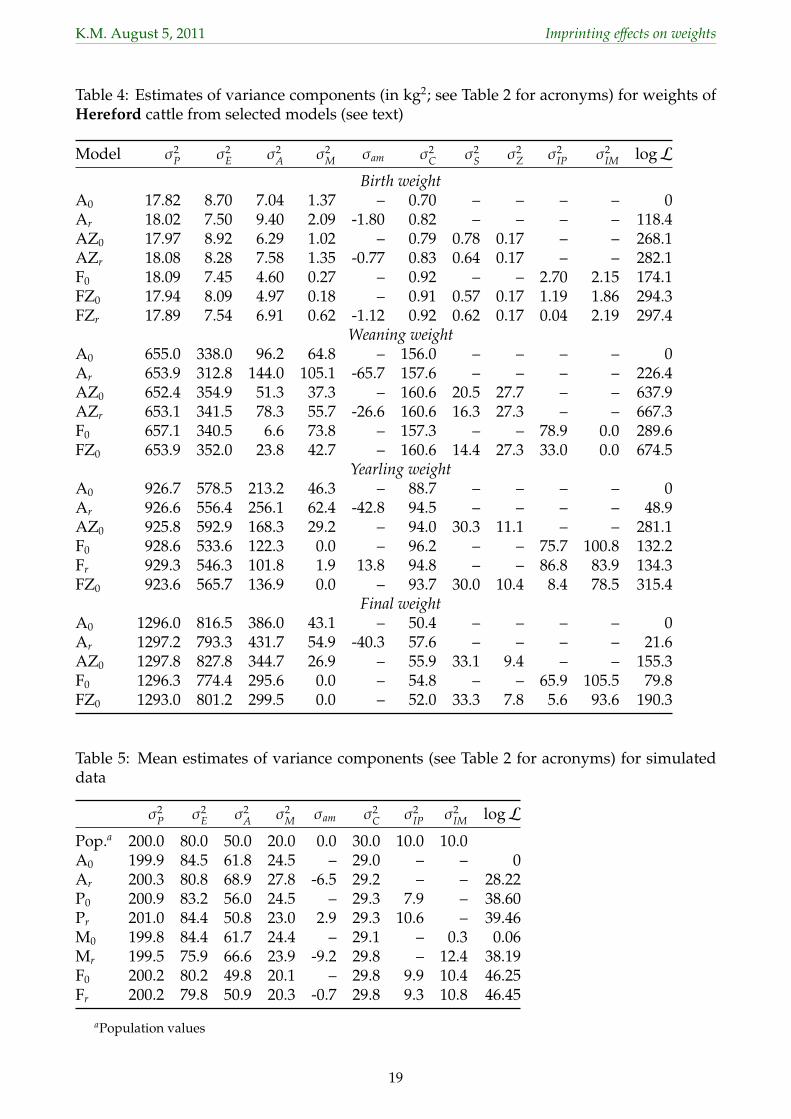
traits are shown in Table 3 for Angus and Table 4 for Herefords.137
3.1.1 Modelling weights of beef cattle138
Results for the ‘standard’ models ignoring POO effects were, by and large, comparable139
to those reported previously for these traits and breeds (e.g. Meyer, 1992b; Meyer et al.,140
2004). As observed in various other studies, allowing for a non-zero direct-maternal genetic141
covariance (σam) yielded a substantial, negative estimate (model Ar), accompanied by higher142
estimates for both the direct (σ2A) and maternal (σ2
M) genetic variance, compared to results143
obtained assuming σam was zero (model A0), and dramatically increased value of the log144
likelihood (logL).145
While a weak, antagonistic genetic relationship between direct and maternal genetic effects146
for WW in the range of −0.1 to −0.2 is generally accepted as plausible, larger estimates147
(absolute value) are usually treated with justified scepticism. There has thus been much148
5
K.M. August 5, 2011 Imprinting effects on weights
debate of whether a non-zero σam should be fitted or not. For field data on beef cattle, it149
is not uncommon that cows remain in their mating groups until their calves are weaned.150
If such management groups are not judiciously recorded, this can lead to classification of151
contemporary groups which does not fully account for systematic environmental effects. In152
turn, this may result in records for progeny of a sire being more similar than due to their153
degree of relationship alone, causing the estimate of σam to be biased downwards and those154
of σ2A and σ2
M to be inflated. Other factors which can contribute to implausible estimates of σam155
are negative, direct-maternal environmental covariances which are not taken into account156
or inappropriate definition of genetic groups (Meyer, 1992a, 1997; Robinson, 1996).157
Fitting a sire × herd interaction has been shown to alleviate these symptoms and has thus158
been adopted as a pragmatic solution to counteract potential deficiencies in modelling in159
genetic evaluation schemes for beef cattle such as BreedPlan (Graser et al., 2005). However,160
in estimating genetic parameters it is not unproblematic as analyses fitting such models161
often yield estimates where a substantial proportion of the direct additive genetic variance162
is partitioned into the sire × herd component. As expected, fitting S×H effects did reduce163
(absolute value) the estimate of σam substantially, with the magnitude of the direct-genetic164
correlation estimate for WW reduced from −0.57 (Ar) to −0.38 (ASr) in Angus and −0.53 to165
−0.37 in Herefords. This was accompanied by a reduction in the estimate of σ2A by more than166
40% compared to analyses not fitting S×H effects and a dramatic increase in log likelihood167
(logL). With about 90% of S×H effects pertaining to sires used in a single herd only (c.f.168
Table 1) this was not surprising, as there were less contrasts between sire and S×H effects than169
might be desirable. S×H effects were most influential for WW – any unidentified groups are170
generally broken up at weaning, so that an influence on later weights is expected to reflect a171
carry-over effect only.172
Meyer (2003) demonstrated that repartitioning of genetic variance into the variance due173
to S×H effects (σ2S) is reduced with increasing proportion of records on progeny of sires174
used in multiple herds. Data extraction in this study, however, aimed at obtaining records175
on several generations of animals in large herds and herds with a substantial number of176
calves resulting from embryo transfer, so as to maximize the types of covariances between177
relatives available and thus the scope for disentangling variances due to different types of178
genetic effects. Selecting records to allow S×H effects to be better estimated would have179
counteracted this aim and was thus disregarded. Moreover, our interest in S×H effects per180
se was limited – the main reason for considering these was the potential for paternal POO181
6
K.M. August 5, 2011 Imprinting effects on weights
effects to act in a similar fashion and thus to be inflated by the variation otherwise accounted182
for by σ2S.183
Similarly, maternal grand-sire × herd of origin of dam effects were considered here primar-184
ily for their potential to interact with estimates of paternal imprinting on maternal genetic185
effects in model E – with Z×H effects expected to be analogous to S×H effects for paternal186
imprinting of direct genetic effects. Maternal grand-sire effects in animal model analyses are187
rarely considered in the literature, though Dodenhoff et al. (1999) reported genetic effects for188
maternal grand-dams to account for 2−7% of σ2P for WW of Angus cattle and to reduce (abso-189
lute value) negative estimates of σam. Fitting Z×H effects again increased logL dramatically190
over the models fitting S×H only, with the corresponding variance (σ2Z) explaining almost191
3% of the phenotypic (σ2P) variance, and reduced the magnitude of estimates of σ2
M, σam and192
σ2S. As for S×H effects, most Z×H effects represented sires occurring in one herd only. In193
addition, a large proportion (83% for WW in Angus; see Table 1) was represented by only194
record, i.e. the scope for successfully disentangling Z×H and genetic effects was limited.195
3.1.2 Fitting a single parent of offspring effect196
Fitting paternal POO effects only (models P) increased logL substantially over the models197
(A) ignoring such effects. Somewhat disconcertingly, the estimate of σam for model Pr was198
positive, corresponding to a direct-maternal genetic correlation of unity in 7 of the 8 trait199
× breed combinations, whilst not or only just significantly (at an error probability of 95%)200
increasing logL, compared to model P0. Occurrence of such estimates usually represents201
a stern warning that the data and pedigree structure does not allow all parameters fitted202
to be estimated, or that the model of analysis comprises other random effects which have203
not been modelled adequately. At the same time estimates of σ2A were reduced drastically,204
while estimates of the variance due to paternal POO effects (σ2IP) for models P0 and Pr ranged205
from 5% to 19% of σ2P. This emphasized serious problems in the partitioning of variation.206
Fitting S×H effects then reduced estimates of σ2IP dramatically, suggesting that, when S×H207
effects were not fitted paternal POO effects acted in a similar fashion to sire × herd effects.208
Conversely, this implied that estimates of σ2IP from models P0 and Pr were substantially209
biased upwards. Fitting Z×H effects in addition (models PZ) yielded some further reduction210
in estimates of σ2IP. In addition, fitting S×H effects restored estimates of σam to negative values211
similar to those obtained from models AS and AZ.212
7
K.M. August 5, 2011 Imprinting effects on weights
In constrast, fitting maternal POO effects improved logL much less. For σam equal to zero213
(model M0), analyses for WW for both breeds yielded estimates of the variance due to214
maternal POO effects (σ2IM) close to zero, whilst estimates of σ2
M and logL remained virtually215
unchanged compared to model A0. In an opposing pattern, estimates of σ2M for YW and216
FW were essentially zero and estimates of σ2IM amounted from 5% to 10% of σ2
P. This was217
accompanied by a substantial increase in logL and some decrease in estimates of σ2A while218
the sum of estimates, σ2P, remained more or less constant. Similarly, estimates of the maternal,219
permanent environmental variance (σ2C) were virtually unaffected by POO effects fitted. This220
suggested that all maternal genetic variation for YW and FW was interpreted as variance due221
to maternal POO effects, while the opposite held for WW (both breeds) and BW in Angus.222
Allowing of a non-zero σam yielded by and large the same pattern in estimates for YW and223
FW than models assuming σam=0. For BW and WW, estimates of σam from model Mr were224
similar to those obtained fitting Ar, but some estimates of σ2M were markedly lower with the225
difference again being partitioned into σ2IM. As for models A, fitting S×H and Z×H effects226
reduced estimates of σ2M. Similarly, fitting Z×H effects tended to decrease non-zero estimates227
of σ2IM.228
3.1.3 Fitting both paternal effects229
Accounting for both POO effects (models F), estimates of σ2IP were generally of similar230
magnitude or slightly lower than for model P. This indicates that ignoring maternal POO231
effects had little effect on estimates of σ2IP, i.e. that variation due to maternal POO effects232
was not ‘picked up’ as σ̂2IP, and was consistent with the pattern observed by Tier and Meyer233
(2011) in corresponding analyses of carcass traits recorded by ultra-sound scanning for the234
same breeds. When fitting S×H effects though, the reduction in estimates of σ2IP tended to be235
somewhat less than encountered under models P.236
For σ2IM, however, values were in several instances higher than obtained for model M. In237
particular, estimates which were previously zero increased to 7% (WW in Angus) and 12%238
(BW in Hereford) of σ2P, along with a significant increase in logL for model F over that for239
model M. This was accompanied by some reduction in estimates of the residual variance240
(σ2E) or of σ2
A and σ2M. When determining random effects to be included in the model of241
analysis in a ‘step-up’ fashion, it is common practice to omit sources of variation which have242
been found insignificant from further steps. Results suggest that for models comprising243
8

K.M. August 5, 2011 Imprinting effects on weights
effects that are at least partially confounded and thus subject to substantial repartitioning244
of variation when the model is altered, this might be premature and lead to elimination of245
important effects. When fitting both POO effects, allowing for a non-zero direct-maternal246
genetic covariance (model Fr) yielded little changes in estimates and logL compared to model247
F0, and as observed earlier, estimates of σam were limited by a corresponding correlation of248
unity (absolute value).249
Fitting S×H and Z×H effects again resulted in marked reductions in estimates of variances250
due to POO effects, following similar patterns as described above for the models fitting a251
single parental effect. Shown in Table 3 and Table 4 are estimates for models A, AZ, F and252
FZ omitting any results for analyses allowing for a non-zero σam if this did not increase logL253
significantly. For all 8 trait × breed combinations, fitting POO effects (models F) raised logL254
substantially and significantly compared to the corresponding base model (Models A), with255
increases being lowest when Z×H effects were included in the model of analysis.256
3.1.4 Parent of offspring effects on maternal genetic effect257
Extending the model to allow for imprinting of maternal genetic effects (model E) yielded258
analyses with up to 11 covariance components to be estimated. On the whole, a similar259
repartitioning of variation to that observed for direct genetic effects was observed. Estimates260
of variances due to maternal imprinting on maternal genetic effects (σ2MM), however, were261
close to zero throughout. The corresponding paternal component (σ2MP) appeared important262
only for WW. Whilst estimates of σ2MP were significant for BW in both breeds and YW in263
Herefords when no interaction effects were fitted (models E), this eroded when maternal264
grand-sire × herd effects were included in the model (models EZ). As shown in Table 2 for265
WW of Angus, estimates of σ2MP from models E were less than half of those obtained from266
models E. Corresponding values for WW in Herefords were 30.1 and 13.5, i.e. fitting Z×H267
effects reduced σ̂2MP by almost 60%.268
3.2 Simulation results269
To gain further insight into the partitioning of variation when both maternal effects and POO270
effects are fitted, data for WW in Angus was replaced by simulated records. Population271
values for variance components and mean estimates across replicates are given in Table 5.272
For all models, the estimate of σ2P agreed with the population values which emphasizes273
9
K.M. August 5, 2011 Imprinting effects on weights
that drastically different estimates were indeed a ‘partitioning of variation’ problem. As274
observed for the real data, estimates of σ2C were virtually unaffected by the model of analysis.275
When ignoring POO effects (models A), estimates of σ2A were inflated most, but some of the276
imprinting variances appeared to be picked up in estimates ofσ2M andσ2
E as well. Interestingly,277
allowing for a non-zero σam (model Ar) resulted in negative estimate of this component. This278
suggests that differential expression of maternal and paternal gametes should be added to279
our list of potential causes resulting in implausible, negative estimates of the direct-maternal280
genetic covariance.281
Fitting paternal POO effects only, the estimate of the corresponding variance component, σ2IP,282
recovered most of the variation simulated. Mean estimates of σ2E and σ2
M for models P0 and A0283
were very similar, indicating that maternal imprinting effects not modelled predominantly284
inflated these components. However, allowing for maternal and ignoring paternal POO285
effects (model M0) resulted in estimates for σ2IM of zero – as observed for the real data – for 9286
of the 10 replicates. This suggests that paternal POO effects not modelled may suppress the287
expression of their maternal counterparts. Allowing for a direct-maternal genetic covariance288
(Mr) removed this restriction, but resulted in an even larger (absolute value) estimate of σam289
and an underestimate of σ2E.290
Finally, analyses fitting the model under which the data were simulated (F0) resulted in mean291
estimates close to the population values, demonstrating that the data and pedigree structure292
were suitable to disentangle all seven sources of variation. Conversely, this implies that293
some of the more puzzling differences in estimates form different models in the real data294
have to be attributed to other reasons.295
Corresponding analyses fitting S×H and Z×H effects in addition yielded mean estimates296
of σ2Z of less than 0.1 and of σ2
S between 0.1 and 0.4 while estimates of the other variances297
were essentially the same as those from the corresponding models omitting these effects.298
This indicates that such interaction effects were not prone to ‘automatically’ remove genetic299
variation in our data, i.e. that the data structure could support estimation of all the genetic300
components fitted. Conversely, it implies that the substantial reductions in estimates of301
variances due to POO effects observed when fitting S×H and Z×H effects largely reflected302
overestimation in their absence.303
10
K.M. August 5, 2011 Imprinting effects on weights
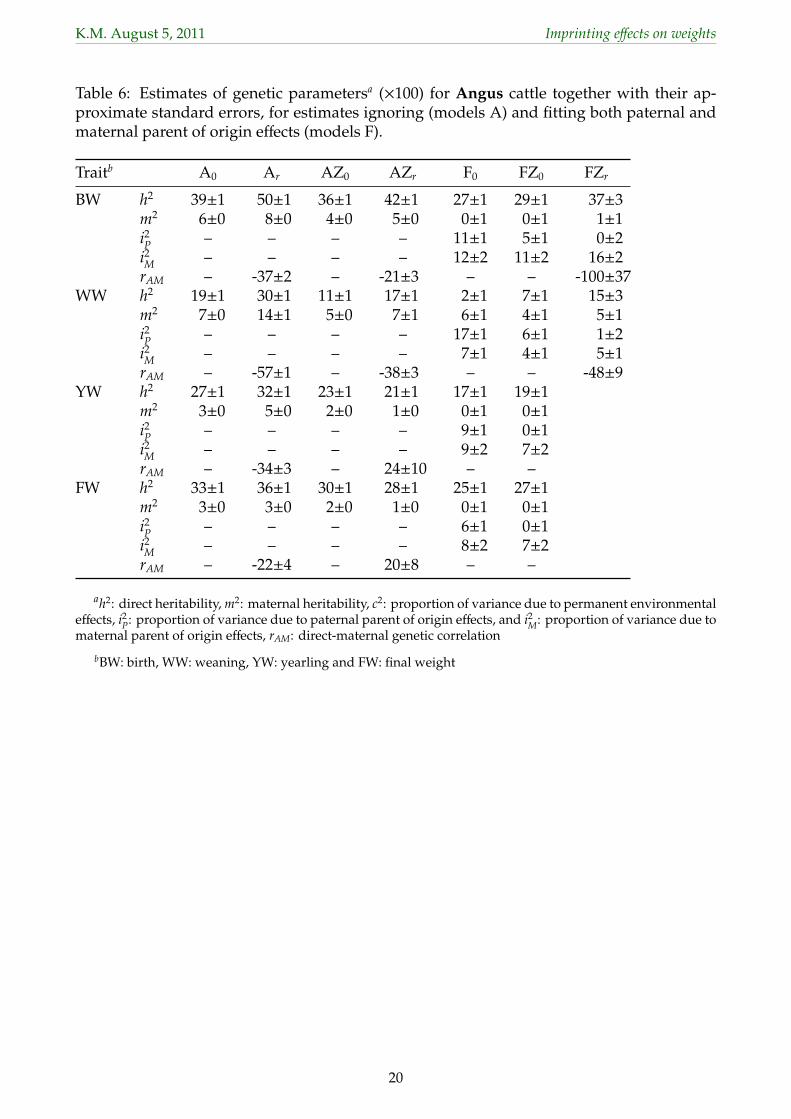
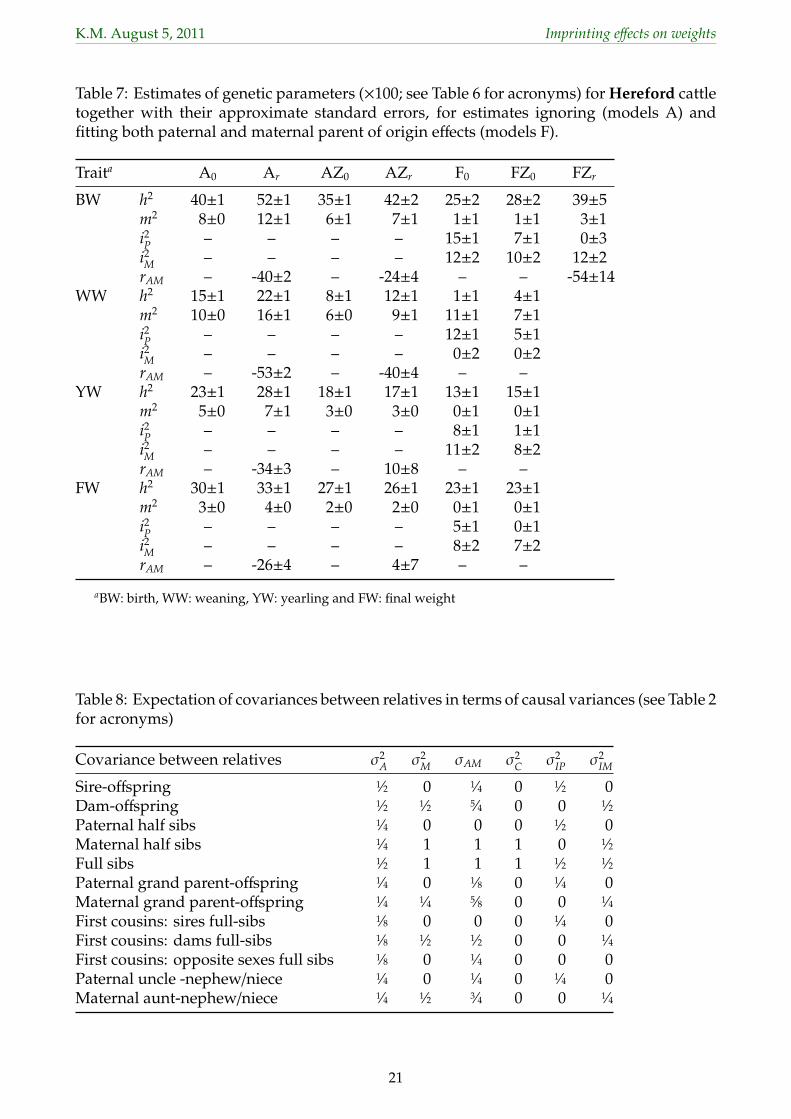
3.3 Estimates of genetic parameters304
Estimates of variance ratios for genetic effects and of the direct-maternal genetic correlation305
(rAM) together with their approximate, lower bound sampling errors (s.e.) for analyses fitting306
models A and F are summarized in Table 6 for Angus and Table 7 for Herefords, omitting307
results for model Fr and for FZr for those cases where allowing for σam did not increase logL308
significantly.309
With estimates based on large data sets, s.e. were small throughout, with values of 0 denoting310
s.e. of less than 0.005. Fitting POO effects increased s.e.for estimates of direct (h2) and maternal311
(m2) heritabilities substantially, to approximately double those observed for model A0. In312
contrast, estimates of the proportion of variance due maternal, permanent environmental313
effects (c2) and their standard errors (not shown) differed little between the two models314
of analyses, indicating that this component was virtually unaffected by repartitioning of315
variation when POO effects were fitted.316
Estimates of h2, m2 and c2 from analyses not fitting POO effects were again well in the range of317
corresponding values reported in the literature. Allowing for POO effects reduced estimates318
of both direct and maternal heritabilities substantially compared to values obtained from319
the base mode, A0. While we would expect estimates of h2 to be somewhat inflated if320
POO existed and were ignored and, conversely, anticipate some decrease in estimates from321
models F compared to models A, a number of these reductions appeared implausibly large.322
This held especially for WW where virtually all direct genetic variance was ‘picked up’ as323
variance due to imprinting. For the other traits, the reduction in h2 was less but estimates of324
m2 from models F were essentially zero. This suggested that estimates of the proportion of325
variance due to paternal (i2P) and maternal (i2
M) imprinting were inflated by maternal genetic326
variation.327
Estimates of variances due to POO effects from model F0 ranged from 5 − 17% of σ2P for328
paternal and 0−12% of σ2P for maternal effects, with respective means of 10.4% and 8.4% and329
substantially higher than corresponding estimates for other traits available in the literature.330
Fitting S×H and Z×H effects (model Fr, not shown) reduced estimates, especially for paternal331
effects, with means (ranges) of 3.0% (0−7) of σ2P and 6.8% (0−11) of σ2
P for estimates of i2P and332
i2M, respectively. For most analyses under models Fr and FZr estimates of rAM were close to333
unity (absolute value), accompanied by failure to approximate the corresponding s.e.. This334
was due to estimates of σ2M or σ2
A close to zero. These estimates of rAM were thus regarded as335
11
K.M. August 5, 2011 Imprinting effects on weights
spurious.336
4 Discussion337
There has been much research effort concerned with modelling of traits subject to maternal338
effects, especially weaning weight. Reliable estimation of maternal effects and their variances339
has always been problematic as direct and maternal effects are inherently confounded (Will-340
ham, 1980). For beef cattle, models explicitly accounting for direct-maternal environmental341
covariances have been proposed (Meyer, 1997; Quintanilla et al., 1999), but have found little342
uptake. Instead, sire × herd effects are commonly fitted, as this tends to counteract implausi-343
ble estimates of the direct-maternal genetic correlation. Results from this study suggest that344
fitting maternal grand-sire × herd (of origin of dam) effects in addition may be beneficial.345
Results emphasize the difficulties in partitioning variance components due different modes346
of gene action even for large and relatively well structured data sets. Table 8 summarizes347
the expectation of selected types of covariances between relatives when maternal and POO348
effects are present. As shown, for several of the covariances most common in our type of349
data, coefficients for σ2M and σ2
IM are the same, i.e. estimates of these components are likely350
to be hard to separate. To estimate the 6 components in model Fr (omitting σ2E), at least 6351
types of covariances between relatives are required. However, considering the first 6, 7 or 8352
covariances in Table 8 only would not allow for a unique solution for all causal components.353
Using all 12 covariances listed would yield sufficient contrasts, but result in strong sampling354
correlations between estimates, especially between σ2A and σ2
IP and between σ2M and σ2
IM.355
Recently, Imumorin et al. (2011) reported maternal and paternal POO effects for 18 quan-356
titative trait loci affecting growth of beef cattle, explaining between 1 and 4% of σ2P each.357
While our results present evidence for differential expression of genes for weights of beef358
cattle depending on the parent they came from, estimates of the corresponding variances359
are likely to be, to some extent at least, inflated by other sources of variation. When fitted,360
paternal POO effects tended to act similarly to sire × herd effects and thus to ‘pick up’ some361
the variation accounted for by these effects. As shown, there was considerable repartitioning362
between estimates of σ2M and σ2
IM. For model FZr, estimated sampling correlations between363
these components (obtained from the inverse of the average information matrix) for the 8364
cases (trait × breed) ranged from −0.82 to −0.92.365
12
K.M. August 5, 2011 Imprinting effects on weights
5 Conclusions366
Genetic imprinting is known to affect a wide range traits, including growth. While estimation367
of variances due to parent of offspring effects is feasible utilizing the gametic relationship368
matrix, it is hampered by inherent confounding with maternal genetic effects. Results369
indicate that a small proportion of the phenotypic variance in weights of beef cattle may be370
attributed to differential expression of genes from the two parents.371
Acknowledgments372
This work was supported by Meat and Livestock Australia under grant B.BFG.0050.373
References374
Dodenhoff J., Van Vleck L., Wilson D.E. Comparison of models to estimate genetic effects of375
weaning weight of Angus cattle. J. Anim. Sci. 77 (1999) 3176–3184.376
Engellandt T.H., Tier B. Genetic variances due to imprinted genes in cattle. J. Anim. Breed.377
Genet. 119 (2002) 154–165. doi: 10.1046/j.1439-0388.2002.00323.x.378
Essl A., Voith K. Estimation of variance components due to imprinting effects with DFREML379
and VCE: results of a simulation study. J. Anim. Breed. Genet. 119 (2002a) 1–14. doi:380
10.1046/j.1439-0388.2002.00314.x.381
Essl A., Voith K. Genomic imprinting effects on dairy- and fitness-related traits in cattle. J.382
Anim. Breed. Genet. 119 (2002b) 182–189. doi: 10.1046/j.1439-0388.2002.00334.x.383
Ferguson-Smith A.C. Imprinting, genomic. In: Brenner S., Miller J.H., eds., Encylopedia of384
Genetics. Academic Press (2001), pp. 999–1001.385
Georges M., Charlier C., Cockett N. The callipyge locus: evidence for the trans interaction386
of reciprocally imprinted genes. Trends in Genetics 19 (2003) 248–252. doi: 10.1016/S0168-387
9525(03)00082-9.388
Graser H.U., Tier B., Johnston D.J., Barwick S.A. Genetic evaluation for the beef industry in389
Australia. Austr. J. Exp. Agric. 45 (2005) 913–921. doi: 10.1071/EA05075.390
Hager R., Cheverud J.M., Wolf J.B. Maternal effects as the cause of parent-of-origin ef-391
fects that mimic genomic imprinting. Genetics 178 (2008) 1755–1762. doi: 10.1534/genet-392
ics.107.080697.393
Hill W.G., Keightley P.K. Interaction between molecular and quantitative genetics. In: Korver394
S., van der Steen H.A.M., van Arendonk J.A.M., Bakker H., Brascamp E.W., Dommerholt395
J., eds., Advances in Animal Breeding, Proceedings of the World Symposium in Honour396
of Prof. R. D. Politiek. Agricultural University Wageningen, PUDOC (1988), pp. 41–55.397
Imumorin I.G., Kim E.H., Lee Y.M., de Koning D.J., van Arendonk J.A.M., Donato M.D.,398
Taylor J.F., Kim J.J. Genome scan for parent-of-origin QTL effects on bovine growth and399
carcass traits. Frontiers in Genetics (2011).400
13
K.M. August 5, 2011 Imprinting effects on weights
Kaiser C.J., Goddard M.E., Reverter A. Analysis of gametic imprinting effects for test day401
milk yield in Australian Holstein cattle. Proceedings Sixth World Congr. Genet. Appl.402
Livest. Prod. 23 (1998) 355–358.403
Kuehn C., Edel C., Weikard R., Thaller G. Dominance and parent-of-origin effects of coding404
and non-coding alleles at the acylCoa-diacylglycerol-acyltransferase (DGAT 1) gene on405
milk production traits in German Holstein cows. BMC Genetics 8 (2007) 62.406
Meyer K. Bias and sampling covariances of estimates of variance components due to maternal407
effects. Genet. Select. Evol. 24 (1992a) 487–509. doi: 10.1051/gse:19920602.408
Meyer K. Variance components due to direct and maternal effects for growth traits of Aus-409
tralian beef cattle. Livest. Prod. Sci. 31 (1992b) 179–204. doi: 10.1016/0301-6226(92)90017-x.410
Meyer K. Estimates of genetic parameters for weaning weight of beef cattle accounting411
for direct–maternal covariances. Livest. Prod. Sci. 52 (1997) 187–199. doi: 10.1016/s0301-412
6226(97)00144-9.413
Meyer K. Estimates of variances due to sire × herd effects for weights of Hereford cattle.414
Proc. Ass. Advan. Anim. Breed. Genet. 15 (2003) 131–134.415
Meyer K. WOMBAT – a tool for mixed model analyses in quantitative genetics by REML. J.416
Zhejiang Uni. SCIENCE B 8 (2007) 815–821. doi: 10.1631/jzus.2007.b0815.417
Meyer K., Johnston D.J., Graser H.U. Estimates of the complete genetic covariance matrix418
for traits in multi–trait genetic evaluation of Australian Hereford cattle. Austr. J. Agric.419
Res. 55 (2004) 195–210. doi: 10.1071/ar03164.420
Morison I.M., Ramsay J.P., Spencer H.G. A census of mammalian imprinting. Trends in421
Genetics 21 (2005) 457 – 465. doi: 10.1016/j.tig.2005.06.008.422
Neugebauer N., Luther H., Reinsch N. Parent-of-origin effects cause genetic variation in pig423
performance traits. Animal 4 (2010a) 672–681. doi: 10.1017/S1751731109991625.424
Neugebauer N., Räder I., Schild H., Zimmer D., Reinsch N. Evidence for parent-of-425
origin effects on genetic variability of beef traits. J. Anim. Sci. 88 (2010b) 523–532. doi:426
10.2527/jas.2009-2026.427
Quintanilla R., Varona L., Pujol M.R., Piedrafita J. Maternal animal model with correlation428
between maternal environmental effects of related dams. J. Anim. Sci. 77 (1999) 2904–2917.429
Reik W., Walter J. Genomic imprinting: parental influence on the genome. Nature Reviews430
Genetics 2 (2001) 21–32.431
Robinson D.L. Models which might explain negative correlations between direct and mater-432
nal genetic effects. Livest. Prod. Sci. 45 (1996) 111–122. doi: 10.1016/0301-6226(96)00002-4.433
Schaeffer L.R., Kennedy B.W., Gibson J.P. The inverse of the gametic relationship matrix. J.434
Dairy Sci. 72 (1989) 1266.435
Tier B., Meyer K. On the analysis of parent-of-origin effects with examples from ultrasonic436
measures of carcass traits in Australian beef cattle. J. Anim. Breed. Genet. 00 (2011) 000437
(submitted 29/7/2011).438
Tier B., Sölkner J. Analysing gametic variation with an animal model. Theor. Appl. Genet.439
85 (1993) 868 – 872. doi: 10.1007/BF00225031.440
14
K.M. August 5, 2011 Imprinting effects on weights
Vries A.G., Kerr R., Tier B., Long T., Meuwissen T.H.E. Gametic imprinting effects on441
rate and composition of pig growth. Theor. Appl. Genet. 88 (1994) 1037–1042. doi:442
10.1007/bf00220813.443
Willham R.L. Problems in estimating maternal effects. Livest. Prod. Sci. 7 (1980) 405–418.444
15
K.M. August 5, 2011 Imprinting effects on weights
Table 1: Characteristics of the data (BW: birth, WW: weaning, YW: yearling and FW: finalweight).
Angus Hereford
BW WW YW FW BW WW YW FW
No. records 246419 258843 195975 171896 137392 199616 153497 148840No. animals 278760 289836 230473 221531 180096 240613 208820 218142No. sires Aa 5661 6435 5881 7221 4129 5739 6153 7434
Bb 70.8 69.2 64.3 42.8 47.0 52.1 41.2 25.6No. genetic dams Tc 100210 105390 91197 98139 76765 92510 94995 105870
Aa 81874 89066 73692 74543 48872 66044 61497 68604Bb 72.5 68.8 63.8 52.2 62.1 70.3 56.3 45.51d 35.1 37.9 40.3 47.3 35.9 32.4 40.0 46.42e 21.3 20.2 22.3 21.6 21.5 20.5 22.9 23.8
No. raising dams 88786 94887 79447 79477 52837 70049 64507 71002No. contemp. groups 7455 6816 6335 7201 6205 6894 6454 6995No. herds 30 30 30 52 36 39 52 88No. S×Hf 9715 10758 9273 10244 6369 11665 10434 10674
Cg 27.3 27.1 23.4 16.5 31.1 47.5 37.4 25.1Dh 90.5 90.8 90.2 90.4 89.7 89.0 88.2 86.5
No. Z×Hi 25825 41259 28020 24942 11255 18199 15809 18351Cg 73.5 82.9 76.8 67.6 54.1 63.1 55.0 53.2Dh 86.7 87.2 86.9 87.4 87.9 87.8 87.3 85.2
Weight (kg) x̄j 35.88 226.0 342.8 491.7 38.24 220.4 342.4 479.9sdk 5.52 49.5 75.5 99.3 5.65 51.6 79.5 110.5
Age (days) x̄ – 197.4 393.1 567.5 – 201.4 399.2 570.2sd – 41.2 40.8 41.9 – 42.9 41.6 42.4
Dam age (yrs) x̄ 4.40 4.46 4.47 4.95 4.83 4.96 4.91 5.07sd 2.29 2.25 2.26 2.49 2.34 2.37 2.35 2.36
aWith progeny in the databProportion (in %) with records themselvescTotal, after pruningdProportion (in %) with only 1 calfeProportion (in %) with 2 calvesfSire × herd effectsgProportion (in %) of effects with only one recordhProportion of sires (in %) represented in only one herdiMaternal grand-sire × herd of origin effectsjMeankStandard deviation
16
K.M. August 5, 2011 Imprinting effects on weights
Table 2: Estimates of variance componentsa (in kg2) for weaning weights of Angus cattlefrom different models (see text)
Model σ2P σ2
E σ2A σ2
M σam σ2C σ2
S σ2Z σ2
IP σ2IM σ2
MP σ2MM logLb ∆Lc
A0 536.9 291.7 104.6 39.6 – 101.0 – – – – – – 0Ar 538.7 262.1 161.8 76.3 -63.6 102.1 – – – – – – 358.9 358.9AS0 532.8 309.6 56.2 39.4 – 103.2 24.3 – – – – – 706.9ASr 535.1 291.9 92.2 56.3 -27.3 103.0 19.1 – – – – – 749.1 42.2AZ0 534.5 305.5 61.2 26.0 – 103.1 23.2 15.5 – – – – 951.5AZr 536.3 290.9 91.0 40.0 -22.7 103.1 19.0 15.0 – – – – 981.3 29.8P0 546.2 284.2 29.1 46.2 – 102.5 – – 84.3 – – – 474.8Pr 546.6 289.9 4.7 38.9 13.5 102.8 – – 96.9 – – – 477.6 2.8PS0 536.5 302.4 39.7 42.4 – 103.2 17.5 – 31.3 – – – 743.7PSr 535.6 293.5 81.9 53.9 -22.3 103.0 18.5 – 7.1 – – – 749.4 5.7PZ0 537.4 299.4 47.8 28.4 – 103.3 17.6 15.2 25.8 – – – 978.0PZr 536.7 292.4 81.3 37.7 -17.9 103.1 18.5 15.0 6.7 – – – 981.7 3.7M0 536.9 291.7 104.6 39.6 – 101.0 – – – 0.0 – – 0.0Mr 538.6 247.3 161.1 66.7 -70.0 102.7 – – – 30.8 – – 368.3 368.3MS0 532.8 309.6 56.2 39.4 – 103.2 24.3 – – 0.0 – – 706.9MSr 534.9 280.8 91.7 49.2 -32.4 103.4 19.0 – – 23.3 – – 754.0 47.1MZ0 534.5 305.5 61.2 26.0 – 103.1 23.2 15.5 – 0.0 – – 951.5MZr 535.9 278.3 90.0 32.0 -28.5 103.6 18.9 15.0 – 26.6 – – 987.5 36.0F0 546.6 269.3 9.2 30.8 – 103.0 – – 94.6 39.8 – – 487.9Fr 546.8 272.4 1.0 28.7 5.3 103.1 – – 98.8 37.4 – – 488.6 1.7FS0 536.5 295.0 30.9 34.7 – 103.6 17.1 – 36.3 18.9 – – 746.8FSr 535.0 282.4 78.4 45.1 -25.8 103.4 18.1 – 8.9 24.6 – – 776.6 29.8FZ0 537.3 291.1 37.3 19.3 – 103.8 17.3 15.2 31.4 21.9 – – 982.1FZr 536.4 279.8 78.7 29.3 -23.2 103.6 18.3 15.0 7.8 27.1 – – 987.9 5.8E0 548.7 264.7 11.6 4.2 – 96.9 – – 92.4 48.7 30.1 0.0 651.8Er 548.7 266.9 8.0 2.1 4.0 97.2 – – 94.2 45.9 30.4 0.0 652.4 0.6ES0 538.5 291.3 36.6 8.9 – 97.6 17.3 – 32.1 24.7 30.0 0.0 911.9ESr 537.6 280.0 77.7 19.0 -23.1 97.5 18.3 – 8.7 30.0 29.6 0.0 917.7 5.8EZ0 537.9 289.8 38.1 10.8 – 101.1 17.3 11.5 31.0 24.8 13.5 0.0 1015.3EZr 536.9 278.9 77.9 20.5 -22.5 100.9 18.2 11.4 8.3 30.0 13.3 0.0 1020.8 5.5
aσ2P: phenotypic, σ2
E: residual, σ2A: direct, additive genetic, σ2
M: maternal additive genetic, σ2C: maternal,
permanent environmental, σ2S: sire × herd, σ2
Z: maternal grand-sire × herd of origin of dam, σ2IP: direct
genetic paternal imprinting and σ2IM: direct genetic maternal imprinting variance; σam: direct-maternal genetic
covarianceblog likelihood, as deviation from value for model AcDifference in logL between corresponding models allowing for and not fitting σam
17
K.M. August 5, 2011 Imprinting effects on weights
Table 3: Estimates of variance components (in kg2; see Table 2 for acronyms) for birth,yearling and final weights of Angus cattle from different models
Model σ2P σ2
E σ2A σ2
M σam σ2C σ2
S σ2Z σ2
IP σ2IM logL
Birth weightA0 17.75 8.83 6.92 0.98 – 1.02 – – – – 0Ar 17.99 7.84 8.92 1.49 -1.35 1.09 – – – – 116.5AZ0 17.76 8.93 6.48 0.74 – 1.06 0.44 0.12 – – 339.6AZr 17.89 8.43 7.50 0.97 -0.58 1.08 0.36 0.12 – – 353.8F0 17.95 7.75 4.82 0.00 – 1.14 – – 2.04 2.20 212.8Fr 17.91 7.36 5.56 0.05 -0.55 1.16 – – 1.60 2.71 216.6FZ0 17.71 8.24 5.09 0.00 – 1.12 0.32 0.11 0.90 1.93 400.3FZr 17.63 7.56 6.58 0.17 -1.05 1.16 0.35 0.11 0.00 2.75 414.7
Yearling weightA0 818.3 517.3 220.4 27.5 – 53.1 – – – – 0Ar 820.9 495.6 263.1 41.4 -35.7 56.4 – – – – 49.3AZ0 820.2 523.3 186.1 15.7 – 55.9 31.9 7.4 – – 564.3AZr 818.7 532.0 168.0 12.2 10.7 54.7 33.7 7.4 – – 568.7F0 825.6 480.1 137.2 0.0 – 55.6 – – 76.6 76.1 170.3FZ0 815.5 511.2 155.2 0.0 – 54.3 32.7 6.7 0.0 55.4 605.2
Final weightA0 1290.4 811.7 427.2 35.5 – 16.1 – – – – 0Ar 1291.7 792.6 465.5 43.6 -30.9 20.9 – – – – 15.6AZ0 1292.3 816.8 392.2 20.5 – 21.3 35.7 5.8 – – 264.2AZr 1290.7 829.4 365.9 17.2 16.0 18.6 37.9 5.7 – – 268.2F0 1294.6 768.8 329.5 0.0 – 17.8 – – 78.4 100.0 111.5FZ0 1285.3 797.5 343.3 0.0 – 16.8 35.4 4.7 1.6 85.9 304.9
18
K.M. August 5, 2011 Imprinting effects on weights
Table 4: Estimates of variance components (in kg2; see Table 2 for acronyms) for weights ofHereford cattle from selected models (see text)
Model σ2P σ2
E σ2A σ2
M σam σ2C σ2
S σ2Z σ2
IP σ2IM logL
Birth weightA0 17.82 8.70 7.04 1.37 – 0.70 – – – – 0Ar 18.02 7.50 9.40 2.09 -1.80 0.82 – – – – 118.4AZ0 17.97 8.92 6.29 1.02 – 0.79 0.78 0.17 – – 268.1AZr 18.08 8.28 7.58 1.35 -0.77 0.83 0.64 0.17 – – 282.1F0 18.09 7.45 4.60 0.27 – 0.92 – – 2.70 2.15 174.1FZ0 17.94 8.09 4.97 0.18 – 0.91 0.57 0.17 1.19 1.86 294.3FZr 17.89 7.54 6.91 0.62 -1.12 0.92 0.62 0.17 0.04 2.19 297.4
Weaning weightA0 655.0 338.0 96.2 64.8 – 156.0 – – – – 0Ar 653.9 312.8 144.0 105.1 -65.7 157.6 – – – – 226.4AZ0 652.4 354.9 51.3 37.3 – 160.6 20.5 27.7 – – 637.9AZr 653.1 341.5 78.3 55.7 -26.6 160.6 16.3 27.3 – – 667.3F0 657.1 340.5 6.6 73.8 – 157.3 – – 78.9 0.0 289.6FZ0 653.9 352.0 23.8 42.7 – 160.6 14.4 27.3 33.0 0.0 674.5
Yearling weightA0 926.7 578.5 213.2 46.3 – 88.7 – – – – 0Ar 926.6 556.4 256.1 62.4 -42.8 94.5 – – – – 48.9AZ0 925.8 592.9 168.3 29.2 – 94.0 30.3 11.1 – – 281.1F0 928.6 533.6 122.3 0.0 – 96.2 – – 75.7 100.8 132.2Fr 929.3 546.3 101.8 1.9 13.8 94.8 – – 86.8 83.9 134.3FZ0 923.6 565.7 136.9 0.0 – 93.7 30.0 10.4 8.4 78.5 315.4
Final weightA0 1296.0 816.5 386.0 43.1 – 50.4 – – – – 0Ar 1297.2 793.3 431.7 54.9 -40.3 57.6 – – – – 21.6AZ0 1297.8 827.8 344.7 26.9 – 55.9 33.1 9.4 – – 155.3F0 1296.3 774.4 295.6 0.0 – 54.8 – – 65.9 105.5 79.8FZ0 1293.0 801.2 299.5 0.0 – 52.0 33.3 7.8 5.6 93.6 190.3
Table 5: Mean estimates of variance components (see Table 2 for acronyms) for simulateddata
σ2P σ2
E σ2A σ2
M σam σ2C σ2
IP σ2IM logL
Pop.a 200.0 80.0 50.0 20.0 0.0 30.0 10.0 10.0A0 199.9 84.5 61.8 24.5 – 29.0 – – 0Ar 200.3 80.8 68.9 27.8 -6.5 29.2 – – 28.22P0 200.9 83.2 56.0 24.5 – 29.3 7.9 – 38.60Pr 201.0 84.4 50.8 23.0 2.9 29.3 10.6 – 39.46M0 199.8 84.4 61.7 24.4 – 29.1 – 0.3 0.06Mr 199.5 75.9 66.6 23.9 -9.2 29.8 – 12.4 38.19F0 200.2 80.2 49.8 20.1 – 29.8 9.9 10.4 46.25Fr 200.2 79.8 50.9 20.3 -0.7 29.8 9.3 10.8 46.45
aPopulation values
19
K.M. August 5, 2011 Imprinting effects on weights
Table 6: Estimates of genetic parametersa (×100) for Angus cattle together with their ap-proximate standard errors, for estimates ignoring (models A) and fitting both paternal andmaternal parent of origin effects (models F).
Traitb A0 Ar AZ0 AZr F0 FZ0 FZr
BW h2 39±1 50±1 36±1 42±1 27±1 29±1 37±3m2 6±0 8±0 4±0 5±0 0±1 0±1 1±1i2P – – – – 11±1 5±1 0±2
i2M – – – – 12±2 11±2 16±2
rAM – -37±2 – -21±3 – – -100±37WW h2 19±1 30±1 11±1 17±1 2±1 7±1 15±3
m2 7±0 14±1 5±0 7±1 6±1 4±1 5±1i2P – – – – 17±1 6±1 1±2
i2M – – – – 7±1 4±1 5±1
rAM – -57±1 – -38±3 – – -48±9YW h2 27±1 32±1 23±1 21±1 17±1 19±1
m2 3±0 5±0 2±0 1±0 0±1 0±1i2P – – – – 9±1 0±1
i2M – – – – 9±2 7±2
rAM – -34±3 – 24±10 – –FW h2 33±1 36±1 30±1 28±1 25±1 27±1
m2 3±0 3±0 2±0 1±0 0±1 0±1i2P – – – – 6±1 0±1
i2M – – – – 8±2 7±2
rAM – -22±4 – 20±8 – –
ah2: direct heritability, m2: maternal heritability, c2: proportion of variance due to permanent environmentaleffects, i2P: proportion of variance due to paternal parent of origin effects, and i2M: proportion of variance due tomaternal parent of origin effects, rAM: direct-maternal genetic correlation
bBW: birth, WW: weaning, YW: yearling and FW: final weight
20
K.M. August 5, 2011 Imprinting effects on weights
Table 7: Estimates of genetic parameters (×100; see Table 6 for acronyms) for Hereford cattletogether with their approximate standard errors, for estimates ignoring (models A) andfitting both paternal and maternal parent of origin effects (models F).
Traita A0 Ar AZ0 AZr F0 FZ0 FZr
BW h2 40±1 52±1 35±1 42±2 25±2 28±2 39±5m2 8±0 12±1 6±1 7±1 1±1 1±1 3±1i2P – – – – 15±1 7±1 0±3
i2M – – – – 12±2 10±2 12±2
rAM – -40±2 – -24±4 – – -54±14WW h2 15±1 22±1 8±1 12±1 1±1 4±1
m2 10±0 16±1 6±0 9±1 11±1 7±1i2P – – – – 12±1 5±1
i2M – – – – 0±2 0±2
rAM – -53±2 – -40±4 – –YW h2 23±1 28±1 18±1 17±1 13±1 15±1
m2 5±0 7±1 3±0 3±0 0±1 0±1i2P – – – – 8±1 1±1
i2M – – – – 11±2 8±2
rAM – -34±3 – 10±8 – –FW h2 30±1 33±1 27±1 26±1 23±1 23±1
m2 3±0 4±0 2±0 2±0 0±1 0±1i2P – – – – 5±1 0±1
i2M – – – – 8±2 7±2
rAM – -26±4 – 4±7 – –
aBW: birth, WW: weaning, YW: yearling and FW: final weight
Table 8: Expectation of covariances between relatives in terms of causal variances (see Table 2for acronyms)
Covariance between relatives σ2A σ2
M σAM σ2C σ2
IP σ2IM
Sire-offspring 1⁄2 0 1⁄4 0 1⁄2 0Dam-offspring 1⁄2 1⁄2 5⁄4 0 0 1⁄2Paternal half sibs 1⁄4 0 0 0 1⁄2 0Maternal half sibs 1⁄4 1 1 1 0 1⁄2Full sibs 1⁄2 1 1 1 1⁄2 1⁄2Paternal grand parent-offspring 1⁄4 0 1⁄8 0 1⁄4 0Maternal grand parent-offspring 1⁄4 1⁄4 5⁄8 0 0 1⁄4First cousins: sires full-sibs 1⁄8 0 0 0 1⁄4 0First cousins: dams full-sibs 1⁄8 1⁄2 1⁄2 0 0 1⁄4First cousins: opposite sexes full sibs 1⁄8 0 1⁄4 0 0 0Paternal uncle -nephew/niece 1⁄4 0 1⁄4 0 1⁄4 0Maternal aunt-nephew/niece 1⁄4 1⁄2 3⁄4 0 0 1⁄4
21