estimating areas contributing recharge to wells · estimating areas contributing recharge to wells...
TRANSCRIPT

Estimating Areas Contributing Recharge to WellsLessons from Previous Studies
By O.L. Franke, T.E. Reilly, D.W. Pollock, and J.W. LaBaugh
U.S. GEOLOGICAL SURVEY CIRCULAR 1174

The use of firm, trade, and brand names in this report is for identification purposes only anddoes not constitute endorsement by the U.S. Government
U.S. GOVERNMENT PRINTING OFFICE : 1998
Free on application to theU.S. Geological Survey
Branch of Information ServicesBox 25286
Denver, CO 80225-0286
U.S. DEPARTMENT OF THE INTERIOR
BRUCE BABBITT, Secretary
U.S. GEOLOGICAL SURVEY
Thomas J. Casadevall, Acting Director

CONTENTS
Introduction............................................................................................................................................................................ 2
Pathways of Contaminated Ground Water to Discharging Wells ......................................................................................... 3
Significance of the Ground-Water Flow System................................................................................................................... 4
Ground-Water Travel Times.................................................................................................................................................. 6
Effects of Changing Hydrologic Conditions on Contributing Areas..................................................................................... 7
Effects of Well-Screen Locations and Pumping Rates on Contributing Areas ..................................................................... 7
Uncertainty in Estimating Contributing Areas ...................................................................................................................... 9
In Conclusion—A Point of View .......................................................................................................................................... 12
Selected References ............................................................................................................................................................... 12
FIGURES
1. Cross section and map showing area contributing recharge to a single discharging well in a simplified hypothetical ground-water system............................................................................................................. 2
2. Cross section showing pathways for movement of contaminated ground water into a well, when the source of contaminants is at or near the water table.................................................................................... 3
3. Maps and diagram showing long-term (steady-state) model-calculated contributing recharge areas for wells 11 and 26 near Rochester, Minnesota, which are screened in the St. Peter-Prairie du Chien-Jordan aquifer .................................................................................................................................. 4
4. Map showing long-term (steady-state) model-calculated contributing recharge areas for and ground-water travel times to the Independence, Missouri, well field.................................................................. 6
5. Cross section showing degrees of separation between the water table and the well screen of a cased well or the open hole of an uncased well ................................................................................................... 8
6. Cross section showing hypothetical model-calculated ground-water flowpaths at equilibrium from the water table to a nearby stream and to a discharging well screened at the bottom of the aquifer ............................................................................................................................................................... 9
7. Maps showing simulated effects of increasing horizontal hydraulic conductivity of moraine sediments on the water-table configuration and ground-water flowpaths near the Landfill-1 contaminant plume, western Cape Cod, Massachusetts ............................................................................................. 10
8. Maps showing comparison of areas contributing recharge to seven public-supply wells as determined by two numerical models, Cape Cod, Massachusetts .............................................................................. 11

2
Introduction
About one-third of the population of the United States obtains drinking water from public-supply systems that rely on ground water. Because of the large number of people involved, public health officials, regulators, water-resource planners, and the public are concerned about the quality of ground water pumped by public-supply wells. Most human-derived contaminants in ground water are related to activities at the land surface and enter the ground-water flow system at the water table after passing through the unsaturated zone. A second important location of con-taminant entry, which is of much smaller areal extent than the water table, is the beds and banks of streams, reservoirs, lakes, and wetlands. Given that most human-derived con-taminants enter the ground-water flow system directly or indirectly from the land surface, one approach for pro-tecting public ground-water supplies is to estimate areas contributing recharge to public-supply wells and then to implement ground-water protection practices on the over-lying land surface.
The U.S. Geological Survey (USGS) has taken an active role in studies involving the estimation of areas contributing recharge to wells (fig. 1), particularly public-supply wells, both in providing analysis tools for such stud-ies (McDonald and Harbaugh, 1988; Pollock, 1994) and in applying these tools within the context of cooperative studies with States and other public entities in different hydrogeologic settings throughout the Nation (see Selected References). General outcomes of these studies include (1) identification of the source of water to public-supply wells, including recharge at the water table and induced infiltration from surface-water bodies; (2) comparisons of estimated contributing areas determined by different
Figure 1. Area contributing recharge to a single discharging well in a simplified hypothetical ground-water system.
A, Cross-sectional view. B, Map view. For three-dimensional systems, the area contributing recharge to a discharging well is defined in this report as the surface area at the water table where water entering the ground-water system eventually flows to the well. This area must provide an amount of recharge that balances the amount of water being discharged from the well. Thus, lower areal recharge rates result in larger contributing areas of wells. If a nearby surface-water body also contributes water to the discharging well, the area contributing recharge is reduced and is a function not only of the areal recharge rate but also of the amount of water obtained from the surface-water body. Depending on factors that describe the three-dimensional flow system and the placement of the well, the area contributing recharge to a well does not necessarily have to include the location of the well. (Modified from Reilly and Pollock, 1993, fig. 1.)
The ultimate source of ground water discharging from a well is recharge
at the water table and, possibly, inflow from a surface-water body.
Areal recharge
Discharging well
Discharging well
Areacontributing
recharge
Areacontributing
recharge
Screenedinterval
Water table
Land surface
Not to scale
Bounding flowpaths
A
B

3
������������������
@@@@@@@@@@@@@@@@@@
������������������
ÀÀÀÀÀÀÀÀÀÀÀÀÀÀÀÀÀÀ
������������������
@@@@@@@@@@@@@@@@@@
������������������
ÀÀÀÀÀÀÀÀÀÀÀÀÀÀÀÀÀÀ
������������������
@@@@@@@@@@@@@@@@@@
������������������
ÀÀÀÀÀÀÀÀÀÀÀÀÀÀÀÀÀÀ
������������������
@@@@@@@@@@@@@@@@@@
������������������
ÀÀÀÀÀÀÀÀÀÀÀÀÀÀÀÀÀÀ
������������������
@@@@@@@@@@@@@@@@@@
������������������
ÀÀÀÀÀÀÀÀÀÀÀÀÀÀÀÀÀÀ
������������������
@@@@@@@@@@@@@@@@@@
������������������
ÀÀÀÀÀÀÀÀÀÀÀÀÀÀÀÀÀÀ
������������������
@@@@@@@@@@@@@@@@@@
������������������
ÀÀÀÀÀÀÀÀÀÀÀÀÀÀÀÀÀÀ
������������������
@@@@@@@@@@@@@@@@@@
������������������
ÀÀÀÀÀÀÀÀÀÀÀÀÀÀÀÀÀÀ
������������������
@@@@@@@@@@@@@@@@@@
������������������
ÀÀÀÀÀÀÀÀÀÀÀÀÀÀÀÀÀÀ
������������������
@@@@@@@@@@@@@@@@@@
������������������
ÀÀÀÀÀÀÀÀÀÀÀÀÀÀÀÀÀÀ
������������������
@@@@@@@@@@@@@@@@@@
������������������
ÀÀÀÀÀÀÀÀÀÀÀÀÀÀÀÀÀÀ
������������������
@@@@@@@@@@@@@@@@@@
������������������
ÀÀÀÀÀÀÀÀÀÀÀÀÀÀÀÀÀÀ
������������������
@@@@@@@@@@@@@@@@@@
������������������
ÀÀÀÀÀÀÀÀÀÀÀÀÀÀÀÀÀÀ
������������������
@@@@@@@@@@@@@@@@@@
������������������
ÀÀÀÀÀÀÀÀÀÀÀÀÀÀÀÀÀÀ
������������������
@@@@@@@@@@@@@@@@@@
������������������
ÀÀÀÀÀÀÀÀÀÀÀÀÀÀÀÀÀÀ
������������������
@@@@@@@@@@@@@@@@@@
������������������
ÀÀÀÀÀÀÀÀÀÀÀÀÀÀÀÀÀÀ
������������������
@@@@@@@@@@@@@@@@@@
������������������
ÀÀÀÀÀÀÀÀÀÀÀÀÀÀÀÀÀÀ
������������������
@@@@@@@@@@@@@@@@@@
������������������
ÀÀÀÀÀÀÀÀÀÀÀÀÀÀÀÀÀÀ
������������������
@@@@@@@@@@@@@@@@@@
������������������
ÀÀÀÀÀÀÀÀÀÀÀÀÀÀÀÀÀÀ
������������������
@@@@@@@@@@@@@@@@@@
������������������
ÀÀÀÀÀÀÀÀÀÀÀÀÀÀÀÀÀÀ
������������������
@@@@@@@@@@@@@@@@@@
������������������
ÀÀÀÀÀÀÀÀÀÀÀÀÀÀÀÀÀÀ
������������������
@@@@@@@@@@@@@@@@@@
������������������
ÀÀÀÀÀÀÀÀÀÀÀÀÀÀÀÀÀÀ
������������������
@@@@@@@@@@@@@@@@@@
������������������
ÀÀÀÀÀÀÀÀÀÀÀÀÀÀÀÀÀÀ
������������������
@@@@@@@@@@@@@@@@@@
������������������
ÀÀÀÀÀÀÀÀÀÀÀÀÀÀÀÀÀÀ
������������������
@@@@@@@@@@@@@@@@@@
������������������
ÀÀÀÀÀÀÀÀÀÀÀÀÀÀÀÀÀÀ
������������������
@@@@@@@@@@@@@@@@@@
������������������
ÀÀÀÀÀÀÀÀÀÀÀÀÀÀÀÀÀÀ
������������������
@@@@@@@@@@@@@@@@@@
������������������
ÀÀÀÀÀÀÀÀÀÀÀÀÀÀÀÀÀÀ
������������������
@@@@@@@@@@@@@@@@@@
������������������
ÀÀÀÀÀÀÀÀÀÀÀÀÀÀÀÀÀÀ
������������������
@@@@@@@@@@@@@@@@@@
������������������
ÀÀÀÀÀÀÀÀÀÀÀÀÀÀÀÀÀÀ
������������������
@@@@@@@@@@@@@@@@@@
������������������
ÀÀÀÀÀÀÀÀÀÀÀÀÀÀÀÀÀÀ
������������������
@@@@@@@@@@@@@@@@@@
������������������
ÀÀÀÀÀÀÀÀÀÀÀÀÀÀÀÀÀÀ
������������������
@@@@@@@@@@@@@@@@@@
������������������
ÀÀÀÀÀÀÀÀÀÀÀÀÀÀÀÀÀÀ
������������������
@@@@@@@@@@@@@@@@@@
������������������
ÀÀÀÀÀÀÀÀÀÀÀÀÀÀÀÀÀÀ
������������������
@@@@@@@@@@@@@@@@@@
������������������
ÀÀÀÀÀÀÀÀÀÀÀÀÀÀÀÀÀÀ
������������������
@@@@@@@@@@@@@@@@@@
������������������
ÀÀÀÀÀÀÀÀÀÀÀÀÀÀÀÀÀÀ
������������������
@@@@@@@@@@@@@@@@@@
������������������
ÀÀÀÀÀÀÀÀÀÀÀÀÀÀÀÀÀÀ
������������������
@@@@@@@@@@@@@@@@@@
������������������
ÀÀÀÀÀÀÀÀÀÀÀÀÀÀÀÀÀÀ
������������������
@@@@@@@@@@@@@@@@@@
������������������
ÀÀÀÀÀÀÀÀÀÀÀÀÀÀÀÀÀÀ
Discharging well
Water table
Flow throughhole, crack,
or casing joint
Well casing
Flow downannularspace
Annular spacefilled with grout,
bentonite, orother material
Gravel pack inannular space
opposite well screen
Normal flowfrom aquifer
to dischargingwell
(3) (2)
(1)
techniques; (3) depiction of model-calculated two- and three-dimensional ground-water flowpaths and times of travel along these flowpaths; (4) estimation of times of travel from potential sources of contamination to pumping wells; and (5) proposed design of ground-water-quality monitoring networks based on numerical model results.
The purpose of this report is to provide a brief review of selected concepts, assumptions, and uncertainties related to estimating areas contributing recharge to wells. Emphasis is on estimating contributing areas by numerical simulation and on what has been learned from previous studies by the USGS using this approach.
Pathways of Contaminated Ground Water to Discharging Wells
Several common pathways by which shallow ground water contaminated by human activities can reach a dis-charging well are illustrated in figure 2. However, only the pathway “normal flow of ground water from the aquifer to a discharging well” (1) (fig. 2) is amenable to analysis by standard analytical approaches. Because the ultimate source of the normal flow of ground water to a discharging well is recharge at the water table and possibly inflow from a surface-water body, the usual analytical approaches for estimating the contributing recharge area of a discharging well generally assume that contamination related to human activities is derived from one or both of these sources. Naturally occurring contaminants such as trace elements, radionuclides, and ground water with high dissolved-solids concentrations cannot be taken into consideration unless the location of specific source areas and subsurface volumes for these contaminants can be identified.
A strong suspicion that water is entering a well along pathways (2) or (3) arises when human-derived contami-nants are detected in water samples from fully cased wells that are screened only in deep, confined aquifers. However, such detections do not necessarily reflect pathways (2) or (3). When water samples are analyzed for parts per billion of some constituents (primarily synthetic organic com-pounds), minor sources of contaminants within the well may be detected; for example, a grease layer on installed casing, glue from glued joints of plastic casing, oil and grease on equipment installed within the well, and so on.
Possible additional contaminant pathways other than those illustrated in figure 2 are related to the normal ground-water flow system and also to the properties of the fluid. For example, consider a leak or spill of a contaminant with a density greater than water near a pumping well. The fluid would sink vertically by gravity across deeper and deeper flowpaths and also possibly be carried laterally by the exist-ing ground-water flow system toward the well.
Figure 2. Pathways for movement of contamin-ated ground water into a well, when the source of contaminants is at or near the water table.
Analytical techniques for estimating areas contributing recharge to discharging wells, including numerical simulation, consider only pathway (1), normal flow of ground water from the aquifer to the discharging well. Pathways (2) (flow through a hole, crack, or casing joint) and (3) (flow down the annular space) can permit entry of adjacent ground water into the well from any depth above the well screen. The prevention of contamination along these pathways depends on the design and construction of the well and on maintenance of the well through time. Unfortunately, no analytical tools or simple predictors are available to identify if or when these pathways are or will become active.

4
Significance of the Ground-Water Flow System
Ground-water flow systems contain water that moves continuously along three-dimensional flowpaths from points of recharge to points of discharge. As hydrologic stresses on a flow system change, the three-dimensional flowpaths also can change. Thus, in order to determine which flowpaths lead to a specific well, the ground-water system must be evaluated on a systemwide basis for a particular set of conditions. In other words, a contributing area for a particular well is unique only for one specific discharge rate of that well and for specific
discharge rates for all other wells and stresses that influence the ground-water system near the particular well. As pump-ing rates are varied at other wells in the vicinity, the area contributing recharge to any particular well, even if its discharge is constant, can change (fig. 3).
11
11
26
RochesterSilver Lake
0 1 2 3 4 KILOMETERS
0 1 2 3 4 MILES
EXPLANATION
Area contributing recharge to well 26
Area contributing recharge to well 11
Well location and number
Other high-capacity well (discharge exceeds 200 gallons per minute)
92˚35' 92˚30'
44˚
43˚55'
Cascade
Creek
River
Zumbro
SouthFork
Willow
Creek
14
53
52
AFigure 3. Long-term (steady-state) model-calculated contributing recharge areas for wells 11 and 26 near Rochester, Minnesota, which are screened in the St. Peter-Prairie du Chien-Jordan aquifer.
(A) Wells 11, 26, and all other nearby high-capacity wells are pumping. (B) Only wells 11 and 26 are pumping. (C) Conceptualized patterns of three-dimensional ground-water flow from the top of the St. Peter-Prairie du Chien-Jordan aquifer to well 11. These figures depict the complicated and discontinuous spatial patterns of long-term contributing recharge areas in systems that are pumped by numerous nearby wells with open intervals at various depths below the water table and how these patterns change as pumping wells are added to (or subtracted from) the ground-water system.
In particular, (C) also depicts the irregularly shaped volumes in the subsurface that contain the many flowpaths that originate at the water table and discharge at well 11. Any additional discharging wells (one shown) would capture their own subsurface flowpaths and related contributing recharge areas at the water table, thereby changing local flow patterns in the surrounding ground-water flow system. (Modified from Delin and Almendinger, 1993, figs. 10, 11, and 12.)
The location and shape of areas contributing recharge to individual
wells reflect the composite effects of many interacting hydrologic phenomena
associated with the surroundingground-water flow system.

5
11
2626
RochesterSilver Lake
0 1 2 3 4 KILOMETERS
0 1 2 3 4 MILES
EXPLANATION
Area contributing recharge to well 26
Area contributing recharge to well 11
Well location and number
92˚35' 92˚30'
44˚
43˚55'
Cascade
Creek
River
Zumbro
SouthFork
Willow
Creek
14
53
52
B
Upper carbonate aquifer
Decorah-Platteville-Glenwood confining unitSaint Peter Sandstone
Prairie du Chien Group
Top of aquifer
Jordan Sandstone
Land surface
Other well
Well 11EXPLANATION
Model computed areas contributing recharge and subsurface volumes containing flowpaths that discharge to well 11
Ground-water flowpaths that discharge to well 11, dashed where flow is not along face of block diagram
Other ground-water flowpaths
Land
surface
river
C

6
Ground-Water Travel Times
A useful product of numerical-simulation studies, in addition to the estimation of steady-state contributing areas in figure 3, is model-calculated travel times from different parts of the steady-state contributing area to discharging
wells (fig. 4). Although these travel times are calculated at steady state and are valid only for one particular stress pattern on the ground-water system, they do provide valuable insight for planning and design purposes, for example, in the design of wellhead-protection programs (U.S. Environmental Protection Agency, 1987).
DISCHARGING WELL
Independence well field
TRAVEL TIMES FROM AREAS CONTRIBUTING RECHARGE
EXPLANATION
Figure 4. Long-term (steady-state) model-calculated contributing recharge areas for and ground-water travel times to the Independence, Missouri, well field.
In this setting, large amounts of water are being pumped from the alluvial aquifer along the Missouri River. The ultimate source of water to the discharging wells is a combination of areal recharge at the water table and induced inflow from the Missouri River and its local tributaries. The area contributing recharge has an irregular shape, is almost continuous, is extensive across the river from most of the pumping, and extends to part of the boundary of the alluvial aquifer on both sides of the river. An additional feature of this figure, compared to figure 3, is model-calculated travel times from the various parts of the contributing recharge area to the discharging wells. An important caveat in using these travel times is that they are calculated for steady-state conditions and for a single assumed pattern of pumping. Despite this caveat, these travel times provide valuable information for planning near- and long-term pumping from the well field and possible ground-water-quality monitoring programs in critical parts of the aquifer. (Modified from Kelly, 1996b, fig. 5B.)

7
Effects of Changing Hydrologic Conditions on Contributing Areas
In nature, ground-water systems are always changing to some degree. Ground-water flow patterns are continually adjusting to natural and human-induced changes in the sur-rounding hydrologic environment. Although areas contrib-uting recharge also change to reflect changes in ground-water flow patterns, the nature of how they change and the time scale over which that change occurs can be complex and difficult to analyze.
An important characteristic of areas contributing recharge to discharging wells is that usually these areas respond very slowly to changes in stresses on the ground-water flow system. The introduction of a new well in a shallow aquifer may cause temporal changes in the rate and direction of ground-water flow in the vicinity of the well that require only several months or a few years to approach a new steady state. However, the areas contribut-ing recharge to discharging wells that are located at some distance from these wells may require several decades to adjust their shape and distribution to reflect the new hydrau-lic conditions. Contributing areas represent the source loca-tion of water discharging to wells at any instant in time. Thus, the contributing areas reflect the integrated effects of the movement of water through the system from the time and point at which the water entered the system to the time that it discharges to wells. Because ground-water velocities are usually small, the journey from recharge location to a well can take many decades. At any instant in time, contrib-uting recharge areas are complex composites that integrate the changes and variations in ground-water flow patterns that have occurred in the system over the many years or decades that the water has been in the ground-water system on its journey to discharging wells.
An interesting consequence of the slow response time of contributing areas is that they are relatively insensi-tive to short-term cyclic changes in ground-water flow pat-terns, such as seasonal cycles. The extremes of these short-term cycles do not last long enough to influence the size and shape of contributing areas. Instead, the contributing areas tend to reflect longer term, average flow patterns that smooth out short-term cyclic variations.
Effects of Well-Screen Locations and Pumping Rates on Contributing Areas
The primary perspective of the discussion thus far has been that of the ground-water flow system. Here, the perspective shifts briefly to the discharging well. Deeper placement of the open interval of the well (greater separa-tion between the water table and the open interval of the well) (fig. 5) generally results in longer and more complex three-dimensional flowpaths from areas contributing recharge to the well and in longer travel times along these flowpaths.
Initiating pumping at a new well or increasing the pumping rate at an existing well causes the convergence and capture of many new flowpaths to the well—flowpaths that formerly would have ended at other discharge points (figs. 3 and 6). The conclusion from figures 3–6 and the associated discussion is that the water discharging from a well is usu-ally a mixture of waters of different ages and from different source areas. Furthermore, increasing the discharge rate at a well will increase the size of the contributing area from which flowpaths to the discharging well originate and, therefore, will increase the possibility for encountering sources of contaminated water.
An important characteristic of areas contributing recharge to discharging wells
is that usually these areas respond very slowly to changes in stresses on the
ground-water flow system.
The water discharging from a well is usually a mixture of waters
of different ages and from different source areas.

8
Land surface Land surface
Unsaturated zone
Saturated zone
Medium to coarsesand
Silt with fine sand
Fine to medium sand
Fine to coarsesand withsome silt
Clay and silt
Water tableWater table
Soil and weatheredbedrock
Well screen
Well casing
Well casing
Open hole in bedrock
Bedrock
(1) (2) (3) (4) (5) (6)
A B
Figure 5. Degrees of separation between the water table and the well screen of a cased well or the open hole of an uncased well.
The placement of the well screen or open interval of a discharging well can greatly influence areas contributing recharge to the well and vulnerability of the well to contamination. The “degree of separation” refers to a combination of two factors. The first is the distance between the water table and the top of the well screen or open interval of the well (greater distance implies greater separation). The second is the thickness and vertical and horizontal conductivities of confining units and aquifers between the water table and open interval of the well (in particular, greater thickness and lower hydraulic conductivity of low-conductivity confining units imply greater separation). The wells in part A illustrate various degrees of separation in a layered aquifer. In general, greater degrees of separation lead to a more complex three-dimensional configuration of ground-water flowpaths, longer travel times from the water table or surface-water body to a discharging well, extension of the contributing area farther from the discharging well, and possibly a more discontinuous and complex shape of the contributing area (see fig. 3). A separate sketch for bedrock wells is provided in part B (well 6) to illustrate a practice in some areas to install well casing only to the top (surface) of consolidated rock. As a result, the bottom of the well casing can be above or only a few feet below the water table. In these situations, the well can be particularly vulnerable to possible contamination from ground water near the water table; that is, no separation exists between the water table and the top of the open interval of the bedrock well. Homeowner wells and virtually all public-supply wells tapping unconsolidated deposits (wells 1–5) usually are screened some distance below the water table.
9
Uncertainty in Estimating Contributing Areas
Many uncertainties exist in estimating areas contributing recharge to discharging wells. These uncertainties have been alluded to in the previous discussion about stresses on the system—locations and pumping rates of wells and areal recharge rates. Other critical properties that are needed to quantify the ground-water flow system include hydraulic conductivities of aquifers and confining units. Hydraulic conductivities of the various hydrogeologic units in a ground-water system are always a major control on the distribution of ground-water heads in the system. The three-dimensional distribution of ground-water heads, in turn, is a major control on the three-dimensional configuration of flowpaths in the system (fig. 7). Particularly in systems with low hydraulic gradi-ents, small changes in the distribution of ground-water heads can have a significant influence on the configuration of ground-water flowpaths. Thus, uncertainty in quantifying the physical properties that describe the ground-water flow system results in uncertainty in delineating ground-water flow-paths and in estimating the resulting contributing areas of wells.
In general, complexity of ground-water flow systems and uncertainty in quantifying properties that describe the flow system are related—greater complexity implies greater uncertainty. Factors that increase the complexity of ground-water systems include complex geometry of hydrogeologic units, aquifers with well-developed fractures or solution cavities, placement of open intervals of numerous wells at various depths and in different aquifers, areal recharge that varies significantly in space, and surface-water bodies that contribute water to wells. Relative complexity is an important factor in decid-ing which analytical approach is appropriate for estimating areas contributing recharge to wells (fig. 8). In many of the studies conducted by the USGS (see Selected References) that estimate contributing areas of wells, multilayer models were needed to adequately represent the three-dimensional features of the ground-water flow system.
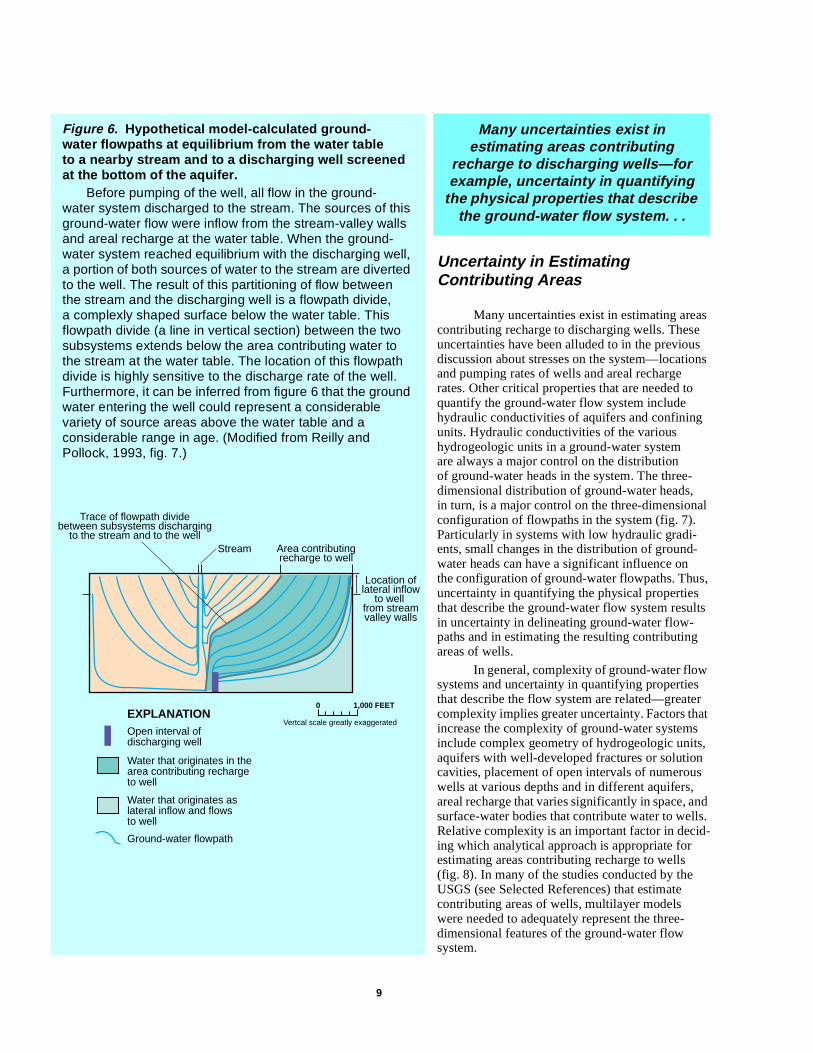
Stream
Trace of flowpath dividebetween subsystems discharging
to the stream and to the wellArea contributingrecharge to well
Location oflateral inflow
to well from stream valley walls
Vertcal scale greatly exaggeratedOpen interval ofdischarging well
Ground-water flowpath
Water that originates in thearea contributing rechargeto well
Water that originates aslateral inflow and flowsto well
0 1,000 FEETEXPLANATION
Figure 6. Hypothetical model-calculated ground-water flowpaths at equilibrium from the water table to a nearby stream and to a discharging well screened at the bottom of the aquifer.
Before pumping of the well, all flow in the ground-water system discharged to the stream. The sources of this ground-water flow were inflow from the stream-valley walls and areal recharge at the water table. When the ground-water system reached equilibrium with the discharging well, a portion of both sources of water to the stream are diverted to the well. The result of this partitioning of flow between the stream and the discharging well is a flowpath divide, a complexly shaped surface below the water table. This flowpath divide (a line in vertical section) between the two subsystems extends below the area contributing water to the stream at the water table. The location of this flowpath divide is highly sensitive to the discharge rate of the well. Furthermore, it can be inferred from figure 6 that the ground water entering the well could represent a considerable variety of source areas above the water table and a considerable range in age. (Modified from Reilly and Pollock, 1993, fig. 7.)
Many uncertainties exist in estimating areas contributing
recharge to discharging wells—for example, uncertainty in quantifying
the physical properties that describe the ground-water flow system. . .

10
0 1
2 MILES0 1
2 KILOMETERS
BA
EXPLANATIONAreal extent of contaminant plume--Shows known extent of
Landfill-1 plume as of January 12, 1994 (National Guard Bureau Installation Restoration Program, written commun., 1994)
Model-calculated flowpaths
Model-calculated water-table contour--Shows altitudeof water table. Contour interval is 5 feet. Datum is sea level
60
50
40
30
20
10
70
60
50
40
30
20
10
10
70̊ 37'70̊ 37' 70̊ 35'70̊ 35'
41̊41'
41̊39'
SnakePond
AshumetPond
LongPond
CoonamessettPond
Coo
nam
esse
ttR
iver Chi
lds
Riv
er
JohnsPond
RedBrookHarbor
SqueteaqueHarbor
SnakePond
AshumetPond
LongPond
CoonamessettPond
Coo
nam
esse
ttR
iver Chi
lds
Riv
er
JohnsPond
RedBrookHarbor
SqueteaqueHarbor
Figure 7. Simulated effects of increasing horizontal hydraulic conductivity of moraine sediments on the water-table configuration and ground-water flowpaths near the Landfill-1 contaminant plume, western Cape Cod, Massachusetts.
Hydraulic conductivity of the moraine sediments is (A) 50 feet per day and (B) 150 feet per day. In the first simulation (A), flowpaths split in two directions, west and south, but predominantly to the south. In the second simulation (B), although the configuration of the water table (ground-water head surface) changed very little at this scale, virtually all of the flowpaths moved to the west and followed the known configuration of the contaminant plume. The significant conclusion from these simulations is that small changes in ground-water heads can substantially change the local configuration of flowpaths in the ground-water flow system. (Modified from Masterson and others, 1997, fig. 8.)
11
Wastewater-treatment-facility infitration beds
Areas contributing recharge to public-supply wells
Water-table contour–Shows calculated altitude of water table. Contour interval, in feet, is variable. Datum is sea level
Public-supply well and local well number
EXPLANATION
24
BFD-1
BARNSTABLE
CentervilleHarbor
HathawayPond
Wequaquet Lake
6
132
28
Long Pond
39'
41°38'
Base from U.S. Geological SurveyDigital Line Graphs, 1:24,000State Plane Projection,Zone 5176
0
0 1 KILOMETER
1 MILE
70°18'70°21' 19'20'
41°41'
40'
B
BARNSTABLE
CentervilleHarbor
HathawayPond
Wequaquet Lake
6
132
28
Long Pond
39'
41°38'
70°18'70°21' 19'20'
41°41'
40'
CentervilleHarbor
0
0 1 KILOMETER
1 MILE
A
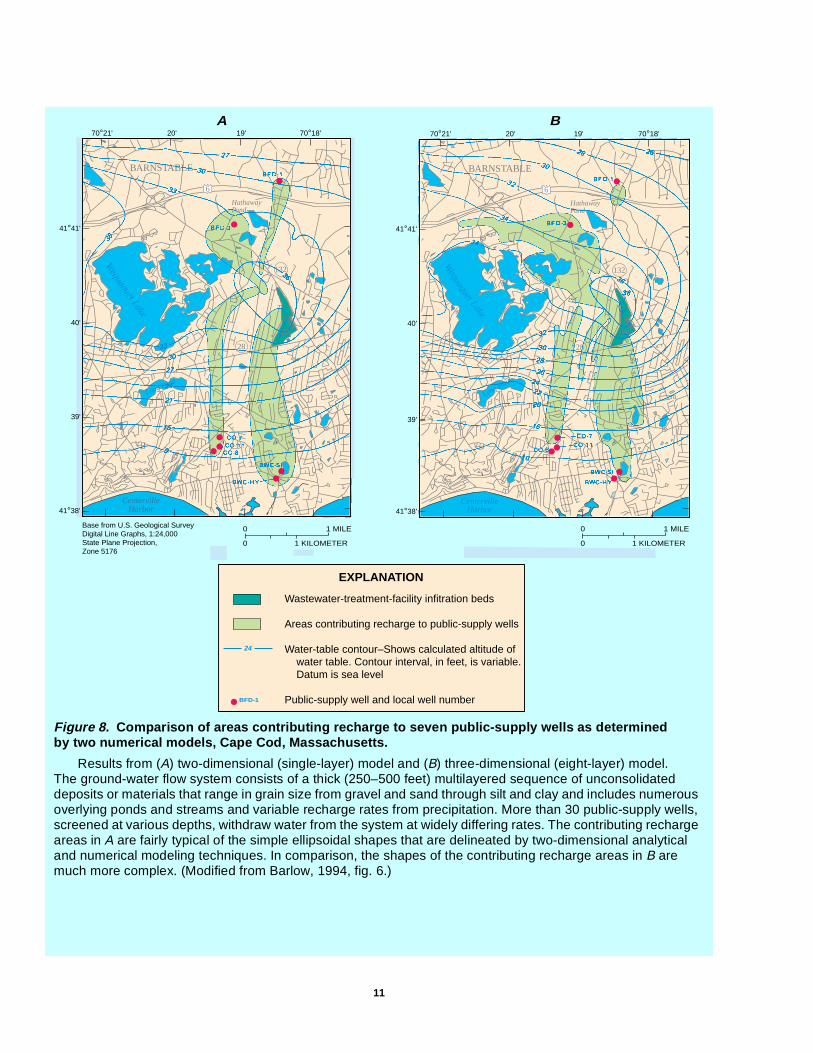
Figure 8. Comparison of areas contributing recharge to seven public-supply wells as determined by two numerical models, Cape Cod, Massachusetts.
Results from (A) two-dimensional (single-layer) model and (B) three-dimensional (eight-layer) model. The ground-water flow system consists of a thick (250–500 feet) multilayered sequence of unconsolidated deposits or materials that range in grain size from gravel and sand through silt and clay and includes numerous overlying ponds and streams and variable recharge rates from precipitation. More than 30 public-supply wells, screened at various depths, withdraw water from the system at widely differing rates. The contributing recharge areas in A are fairly typical of the simple ellipsoidal shapes that are delineated by two-dimensional analytical and numerical modeling techniques. In comparison, the shapes of the contributing recharge areas in B are much more complex. (Modified from Barlow, 1994, fig. 6.)

12
In Conclusion—A Point of View
Ground water moves in complex, three-dimensional patterns that change with time. Nearly all of what we know about estimating contributing recharge areas comes from simulation studies of both real and hypothetical ground-water flow systems because it is impractical to perform field experiments on real ground-water systems that respond over a period of years to decades. The strong reliance on simula-tion poses a dilemma when analyzing real systems because there is no proof or test to verify the results, especially since we have relatively incomplete knowledge of the transient hydraulic history of most systems. However, it is because of the complexity of real systems and our inability to field-verify analytical results that simulation analysis is, in fact, the best means to obtain physically based estimates of contributing recharge areas. Systems with complex spatial or time-dependent characteristics usually require the appli-cation of numerical models (for example, finite-difference or finite-element models) to approximately represent key features. Other, less complex systems sometimes can be simulated adequately using analytical methods. Regardless of the specific simulation method, the process of simulation provides the means to systematically integrate the impor-tant, interacting hydrologic phenomena that control ground-water flow and, thereby, makes possible physically based estimates of contributing recharge areas for discharging wells.
Selected References
Almendinger, J.E., 1994, The travel-time ellipse—An approxi-mate zone of transport: Journal of Hydrology, v. 161, p. 365–373.
Arihood, L.D., and Cohen, D.A., in press, Geohydrology and simulated ground-water flow in northwestern Elkhart County, Indiana: U.S. Geological Survey Water-Resources Investigations Report 97–4238.
Bailey, Z.C., 1993, Hydrology of the Jackson, Tennessee, area and delineation of areas contributing ground water to the Jackson well fields: U.S. Geological Survey Water-Resources Investigations Report 92–4146, 54 p.
Bair, E.S., Sheets, R.A., and Eberts, S.M., 1990, Particle-tracking analysis of flow paths and traveltimes from hypothetical spill sites within the capture area of a wellfield: Ground Water, v. 28, no. 6.
Barlow, P.M., 1994, Two- and three-dimensional pathline analysis of contributing areas to public-supply wells of Cape Cod, Massachusetts: Ground Water, v. 32, no. 3, p. 399–410.
——1997, Particle-tracking analysis of contributing areas of public-supply wells in simple and complex flow systems, Cape Cod, Massachusetts: U.S. Geological Survey Water-Supply Paper 2434, 66 p.
Barlow, P.M., and Hess, K.M., 1993, Simulated hydrologic responses of the Quashnet River stream-aquifer system to proposed ground-water withdrawals, Cape Cod, Massachu-setts: U.S. Geological Survey Water-Resources Investiga-tions Report 93–4064, 52 p.
Bayless, E.R., and Arihood, L.D., 1996, Hydrogeology and simulated ground-water flow through the unconsolidated aquifers of northeastern St. Joseph County, Indiana: U.S. Geological Survey Water-Resources Investigations Report 95–4225, 47 p.
Broshears, R.E., Connell, J.F., and Short, N.C., 1991, A pilot study for delineation of areas contributing water to well-fields at Jackson, Tennessee: U.S. Geological Survey Water-Resources Investigations Report 89–4201, 32 p.
Buxton, H.T., Reilly, T.E., Pollock, D.W., and Smolensky, D.A., 1991, Particle tracking analysis of recharge areas on Long Island, New York: Ground Water, v. 29, no. 1, p. 63–71.
Cunningham, W.L., Bair, E.S., and Yost, W.P., 1996, Hydro-geology and transient ground-water flow in the South Well Field, Columbus, Ohio: U.S. Geological Survey Water-Resources Investigations Report 95–4279, 56 p.
Cunningham, W.L., Sheets, R.A., and Schalk, C.W., 1994, Evaluation of ground-water flow by particle tracking, Wright-Patterson Air Force Base, Ohio: U.S. Geological Survey Water-Resources Investigations Report 94–4243, 11 p.
Davis, Hal, 1996, Hydrogeologic investigation and simulation of ground-water flow in the Upper Floridan aquifer of north-central Florida and southwestern Georgia and delinea-tion of contributing areas for selected city of Tallahassee, Florida, water-supply wells: U.S. Geological Survey Water-Resources Investigations Report 95–4296, 56 p.
However, it is because of the complexity of real ground-water flow
systems and our inability to field-verify analytical results that simulation is,
in fact, the best means to obtain physically based estimates of contributing recharge areas.
All simulation studies require the construction of a simplified representation of the real system. The key to successful simulation is to recognize controlling geologic and hydrologic features and processes and represent them as accurately as possible by using an appropriate simulation technique. To achieve such success requires broad-based experience and expertise in geology, ground-water hydro-dynamics, and simulation methods. The case studies presented here and additional studies listed in the Selected References provide examples of the kind of integrated, simulation-based studies conducted by the USGS in recent years.

13
Delin, G.N., and Almendinger, J.E., 1993, Delineation of recharge areas for selected wells in the St. Peter-Prairie du Chien-Jordan Aquifer, Rochester, Minnesota: U.S. Geological Survey Water-Supply Paper 2397, 39 p.
Dickerman, D.C, and Bell, R.W., 1993, Hydrogeology, water quality, and ground-water-development alternatives in the upper Wood River ground-water reservoir, Rhode Island: U.S. Geological Survey Water-Resources Investigations Report 92–4119, 87 p.
Dickerman, D.C., Kliever, J.D., and Stone, J.R., 1997, Hydro-geology, water quality, and simulation of ground-water-development alternatives in the Usquepaug-Queen ground-water reservoir, southern Rhode Island: U.S. Geological Survey Water-Resources Investigations Report 97–4126, 48 p.
Greene, E.A., 1997, Tracing recharge from sinking streams over spatial dimensions of kilometers in a karst aquifer: Ground Water, v. 35, no. 5, p. 898–904.
Hansen, C.V., 1991, Description and evaluation of selected methods used to delineate wellhead-protection areas around public-supply wells near Mt. Hope, Kansas: U.S. Geological Survey Water-Resources Investigations Report 90–4102, 39 p.
Harbaugh, A.W., and McDonald, M.G., 1996a, User’s documentation for MODFLOW–96, an update to the U.S. Geological Survey modular finite-difference ground-water flow model: U.S. Geological Survey Open-File Report 96–485, 56 p.
——1996b, Programmer’s documentation for MODFLOW–96, an update to the U.S. Geological Survey modular finite-difference ground-water flow model: U.S. Geological Survey Open-File Report 96–486, 220 p.
Harte, P.T., and Mack, T.J., 1992, Geohydrology of, and simulation of ground-water flow in the Milford-Souhegan glacial-drift aquifer, Milford, New Hampshire: U.S. Geological Survey Water-Resources Investigations Report 91–4177, 75 p.
Harte, P.T., and Willey, R.E., 1997, Effects of historical with-drawals on advective transport of contaminated ground waters in a glacial-drift aquifer, Milford, New Hampshire: U.S. Geological Survey Fact Sheet FS–162–97, 6 p.
Hinkle, S.R., and Snyder, D.T., 1997, Comparison of chlorofluorocarbon-age dating with particle-tracking results of a regional ground-water flow model of the Portland Basin, Oregon and Washington: U.S. Geological Survey Water-Supply Paper 2483, 47 p.
Holtschlag, D.J., Luukkonen, C.L., and Nicholas, J.R., 1996, Simulation of ground-water flow in the Saginaw aquifer, Clinton, Eaton, and Ingham Counties, Michigan: U.S. Geological Survey Water-Supply Paper 2480, 49 p.
Hutchinson, C.B., 1990, Analysis of ground-water flow in the A-Sand aquifer at Paramaribo, Suriname, South America: U.S. Geological Survey Water-Resources Investigations Report 90–4036, 65 p.
Kelly, B.P., 1996a, Simulation of ground-water flow and con-tributing recharge areas in the Missouri River alluvial aqui-fer at Kansas City, Missouri and Kansas: U.S. Geological Survey Water-Resources Investigations Report 96–4250, 93 p.
——1996b, Design of a monitoring well network for the City of Independence, Missouri, well field using simulated ground-water flow paths and travel times: U.S. Geological Survey Water-Resources Investigations Report 96–4264, 27 p.
Knochenmus, L.A., and Robinson, J.L., 1996, Descriptions of anisotropy and heterogeneity and their effect on ground-water flow and areas of contribution to public supply wells in a karst carbonate aquifer system: U.S. Geological Survey Water-Supply Paper 2475, 47 p.
Lambert, P.M., 1995, Particle-tracking analysis of time related capture zones for selected public-supply wells in Salt Lake Valley, Utah: State of Utah Department of Natural Resources Technical Publication 110–C, 36 p.
Landmeyer, J.E., 1994, Description and application of capture zone delineation for a wellfield at Hilton Head Island, South Carolina: U.S. Geological Survey Water-Resources Investigations Report 94–4012, 33 p.
Mallory, M.J., 1990, Computer methods for evaluating well-head protection areas, in Daniel, B.J., ed., Proceedings of the Mississippi Water Resources Conference, 1990: Missis-sippi Water Resources Institute, Mississippi State, Miss., p. 127–135.
Masterson, J.P., Walter, D.A., and Savoie, J., 1997, Use of particle tracking to improve numerical model calibration and to analyze ground-water flow and contaminant migra-tion, Massachusetts Military Reservation, Western Cape Cod, Massachusetts: U.S. Geological Survey Water-Supply Paper 2482, 50 p.
Mazzaferro, D.L., 1989, Estimation of the recharge area of a pumped, stratified-drift aquifer in Connecticut by simu-lation modeling: U.S. Geological Survey Water-Resources Investigations Report 87–4124, 100 p.
McDonald, M.G., and Harbaugh, A.W., l988, A modular three-dimensional finite-difference ground-water flow model: U.S. Geological Survey Techniques of Water-Resources Investigations, book 6, chap. A1, 586 p.
Misut, P.E., and Feldman, S.M., 1996, Delineation of areas contributing recharge to wells in central Long Island, New York, by particle tracking: U.S. Geological Survey Open-File Report 95–703, 47 p.
Modica, Edward, 1996, Simulated effects of alternative withdrawal strategies on ground-water-flow patterns, New Jersey Pinelands: U.S. Geological Survey Water-Resources Investigations Report 95–4133, 46 p.
Modica, E., Reilly, T.E., and Pollock, D.W., 1997, Patterns and age distribution of ground-water flow to streams: Ground Water, v. 35, no. 3, p. 523–537.
Morrissey, D.J., 1989, Estimation of the recharge area contrib-uting water to a pumped well in a glacial-drift, river-valley aquifer: U.S Geological Survey Water-Supply Paper 2338, 41 p.
Murray, L.C., and Halford, K.J., 1996, Hydrogeologic conditions and simulation of ground-water flow in the greater Orlando metropolitan area, east-central Florida: U.S. Geological Survey Water-Resources Investigations Report 96–4181, 100 p.
Nicholson, R.S., and Watt, M.K., in press, Simulation of ground-water flow patterns and areas contributing recharge to streams and water-supply wells in a valley-fill and carbonate-rock aquifer system, southeastern Morris County, New Jersey: U.S. Geological Survey Water-Resources Investigations Report 97–4216.

14
Pollock, D.W., 1994, User’s guide for MODPATH/MODPATH-PLOT, version 3—A particle-tracking post-processing package for MODFLOW, the U.S. Geological Survey finite-difference ground-water flow model: U.S. Geological Survey Open-File Report 94–464, 249 p.
Reilly, T.E., and Pollock, D.W., 1993, Factors affecting areas contributing recharge to wells in shallow aquifers: U.S. Geological Survey Water-Supply Paper 2412, 21 p.
——1995, Effect of seasonal and long-term changes in stress on sources of water to wells: U.S. Geological Survey Water-Supply Paper 2445, 25 p.
——1996, Sources of water to wells for transient cyclic systems: Ground Water, v. 34, no. 6, p. 979–988.
Rice, D.E., and Voronin, L.M., 1997, Analysis of ground-water flowpaths near water-supply wells, Picatinny Arsenal, New Jersey: U.S. Geological Survey Water-Resources Investigations Report 96–4228, 26 p.
Risser, D.W., and Madden, T.M., Jr., 1994, Evaluation of methods for delineating areas that contribute water to wells completed in valley-fill aquifers in Pennsylvania: U.S. Geological Survey Open-File Report 92–635, 82 p.
Robinson, J.L., 1993, Hydrogeology and results of tracer tests at the Old Tampa well field in Hillsborough County, with implications for wellhead-protection strategies in west-central Florida: U.S. Geological Survey Water-Resources Investigations Report 93–4171, 63 p.
Schalk, C.W., 1996, Estimation of the recharge areas contributing water to the South Well Field, Columbus, Ohio: U.S. Geological Survey Water-Resources Investiga-tions Report 96–4039, 26 p.
Sheets, R.A., 1994, Contributing recharge areas of water-supply wells at Wright-Patterson Air Force Base, Ohio: U.S. Geological Survey Water-Resources Investigations Report 94–4231, 35 p.
Sonenshein, R.S., 1995, A hydrogeologic approach to identify land uses that overlie ground-water flow paths, Broward County, Florida: U.S. Geological Survey Water-Resources Investigations Report 94–4167, 59 p.
——1997, Evaluation of the design of a regional ground-water quality monitoring network, Broward County, Florida: U.S. Geological Survey Water-Resources Investigations Report 97–4175, 57 p.
Starn, J.J., Arihood, L.D., and Rose, M.F., 1995, Geohydrology and simulation of ground-water flow in the aquifer system near Calvert City, Kentucky: U.S. Geological Survey Water-Resources Investigations Report 94–4239, 52 p.
Taylor, C.J., 1997, Delineation of ground-water basins and recharge areas for municipal water-supply springs in a karst aquifer system in the Elizabethtown area, northern Kentucky: U.S. Geological Survey Water-Resources Investigations Report 96–4254, 22 p.
Tucci, Patrick, 1994, Simulated effects of horizontal anisotropy on ground-water flow paths and discharge to streams, in Marston, R.A., and Hasfurther, V.R., eds., Effects of human-induced changes on hydrologic systems: American Water Resources Association, Proceedings, Annual Sum-mer Symposium of the American Water Resources Associa-tion, June 26–29, Jackson Hole, Wyo., p. 851–860.
U.S. Environmental Protection Agency, 1987, Guidelines for delineation of wellhead protection areas: U.S. Environmen-tal Protection Agency, Office of Ground-Water Protection, Washington, D.C., June 1987, variously paged.
Vecchioli, John, Hunn, J.D., and Aucott, W.R., 1989, Evaluation of methodology for delineation of protection zones around public-supply wells in west-central Florida: U.S. Geological Survey Water-Resources Investigations Report 88–4051, 36 p.
Walter, D.A., Masterson, J.P., and Barlow, P.M., 1996, Hydrogeology and analysis of ground-water-flow system, Sagamore Marsh area, southeastern Massachusetts: U.S. Geological Survey Water-Resources Investigations Report 96–4200, 41 p.
Yager, R.M., Miller, T.S., and Thayer, J., 1997, Delineation of areas contributing recharge to municipal wells in three selected confined-glacial aquifers in Erie County, New York: U.S. Geological Survey Water-Resources Investigations Report 96–4229, 40 p.
Zarriello, P.J., 1993, Determination of the contributing area to six municipal ground-water supplies in the Tug Hill glacial aquifer of northern New York, with emphasis on the Lacona-Sandy Creek well field: U.S. Geological Survey Water-Resources Investigations Report 90–4145, 51 p.
Edited by: Carol L. Anderson and Mary A. KiddGraphics by: John M. EvansManuscript preparation by: Joy K. Monson
For more information, please contact:
U.S. Geological SurveyOffice of Ground Water
12201 Sunrise Valley Drive, Mail Stop 411
Reston, VA 20192(703) 648–5001