estimating consumer willingness to pay ... - us forest … · estimating consumer willingness to...
TRANSCRIPT
Estimating Consumer Willingness to Pay a Price Premium for Alaska Secondary Wood ProductsGeoffrey H. Donovan and David L. Nicholls
United StatesDepartment ofAgriculture
Forest Service
Pacific NorthwestResearch Station
Research PaperPNW-RP-553October 2003

Authors Geoffrey H. Donovan is a research forester, Forestry Sciences Laboratory, 620 SW Main St., Suite 400, Portland, OR 97205; and David L. Nicholls is a forest products technologist, Alaska Wood Utilization Research and Development Center, 204 Siginaka Way, Sitka, AK 99835.
Abstract Donovan, Geoffrey H.; Nicholls, David L. 2003. Estimating consumer willingness to pay a price premium for Alaska secondary wood products. Res. Pap. PNW-RP-553. Portland, OR: U.S. Department of Agriculture, Forest Service, Pacific Northwest Research Station. 7 p.
Dichotomous choice contingent valuation survey techniques were used to estimate mean willingness to pay (WTP) a price premium for made-in-Alaska secondary wood products. Respondents were asked to compare two superficially identical end tables, one made in China and one made in Alaska. The surveys were administered at home shows in Anchorage, Fairbanks, and Sitka in March and April 2002. Results indicated that, on average, respondents were willing to pay an additional $82 for the Alaska-made table, above a base price of $50. The 95 percent confidence bounds on this estimate of mean WTP are $68.10 and $96.10. Survey design and sample demo-graphics are discussed as possible upward biases on the mean WTP for the Alaska-made table. Despite these possible biases, we concluded that place of manufacture is a significant competitive advantage for Alaska secondary wood product manufacturers marketing their products in Alaska.
Keywords: Secondary manufacturing, furniture, willingness to pay, contingent valua-tion, marketing, Alaska.
1
Summary Dichotomous choice contingent valuation survey techniques were used to estimate mean willingness to pay (WTP) a price premium for made-in-Alaska secondary wood products. Respondents were asked to compare two superficially identical end tables, one made in China and one made in Alaska. The surveys were administered at home shows in Anchorage, Fairbanks, and Sitka during March and April 2002. Results indicated that, on average, respondents were willing to pay an additional $82 for the made-in-Alaska table, above a base price of $50. The 95 percent confidence bounds on this estimate of mean WTP are $68.10 and $96.10. Survey design and sample de-mographics are discussed as possible upward biases on the mean WTP for the made-in-Alaska table. Despite these possible biases, place of manufacture is a significant competitive advantage for Alaska secondary wood product manufacturers marketing their products in Alaska.
1
Introduction Historically, the Alaska forest products industry has been driven by pulp produc-tion and the export of round logs and cants, principally to Japan. Recently, Alaska’s two pulp mills in Sitka and Ketchikan closed, in 1993 and 1997, respectively. Further, Japan’s economy entered a recession in the early 1990s from which it has yet to recover. During this recession, housing starts declined from 1.7 million in 1990 to 1.2 million in 2000 (Eastin and Braden 2000). Alaska also has been losing market share in Japan to European, Canadian, and Pacific Northwest producers (Eastin and Braden 2000). This reduction in exports has contributed to a significant decline in timber har-vest volumes from national forests in Alaska, from 472 million board feet (MMBF) in 1990 to 44 MMBF in 2001 (USDA Forest Service 2001).
The decline in the Alaska forest products industry is due, at least in part, to the unique competitive disadvantages the industry faces. The limited infrastructure and rugged terrain in Alaska result in transportation costs significantly higher than those borne by competitors. In addition, labor costs in Alaska have traditionally been higher than in the rest of the United States (partly as a consequence of the oil boom of the 1970s and 1980s), although in recent years, wages have been moving toward parity with wages in the rest of the United States (McDowell Group 1998).
Timberland ownership patterns also present problems for the Alaska forest products industry. Sixty-five percent of all land in Alaska is federally owned, 24.5 percent state owned, and regional and village native corporations account for a further 10 percent, leaving less than 1 percent in private ownership (McDowell Group 1998). The Alaska timber supply is therefore particularly sensitive to changes in government manage-ment practices. An increasing number of legal challenges to timber harvests on fed-eral land have further increased supply uncertainty. This reduction in harvest volume has increased interest in secondary manufacturing as a way of maintaining employ-ment in the forest products sector.
The purpose of this paper is to determine whether Alaska consumers are willing to pay a price premium for made-in-Alaska secondary wood products. Should such a premi-um exist, it would give Alaska secondary wood products manufacturers a competitive advantage over non-Alaska producers.
Although numerous studies have been done on the influence of a product’s country of origin on consumer behavior, we were unable to find in the literature any study quan-tifying willingness to pay (WTP) for wood products based on place of manufacture. The effect of country of origin on consumer behavior is one of the most researched areas in marketing (Tan and Farley 1987). In their 1982 review of the country-of-origin literature, Bilkley and Nes concluded that country of origin does influence consumer perceptions. Several studies have analyzed the factors that determine why consum-ers are influenced by country of origin. Han (1988) suggested that country of origin may act as a surrogate for other product attributes for consumers who are unfamiliar with a particular type of product. Verlegh and Steenkamp (1999) found that the relative importance of country of origin declines when consumers are faced with multiple cues. However, despite the numerous studies on the subject, there seem to be no broad generalizations that can be drawn about the impact of country of origin on consumer behavior (Obermiller and Spangenberg 1989).
Background
2 3
Although there have been no studies in the wood products literature quantifying the effect of country of origin, there have been several studies of WTP for particular characteristics of wood or wood products. Eastin et al. (1996) found that second-ary forest products manufacturers were willing to pay a price premium for second-growth clearwood lumber. Waggener and Fight (1999) also identified a clearwood price premium and demonstrated that it was temporally robust. Jahn (1999) surveyed home show attendees to determine what demographic factors influence a consumer’s choice of clear or character-marked cabinet doors. Haynes et al. (1988) developed a model to explain intragrade price differentials for Douglas-fir (Pseudotsuga men-ziesii (Mirb.) Franco) lumber. Puttock et al. (1990) used a hedonic function approach to explain stumpage prices in southwestern Ontario. Several factors were shown to significantly affect stumpage price, including a timber quality index. New homebuyers in Minneapolis/St. Paul and Chicago were surveyed (Gronroos and Bowyer 1999) to determine their WTP for environmentally certified wood products. Results showed that although some new homebuyers were willing to pay a price premium for environmen-tally certified wood, for most in the sample, it was not a top priority. Murray and Abt (2001) approached the question of environmental certification from the supply side, estimating the price premium suppliers would need to produce environmentally certi-fied wood.
Other wood products researchers (Gronroos and Bowyer 1999) have used contingent valuation techniques but not to quantify a place-of-manufacture price premium. In this paper, we use contingent valuation techniques, which have been used extensively in natural resource economics, to estimate mean WTP a price premium for made-in-Alaska secondary wood products.
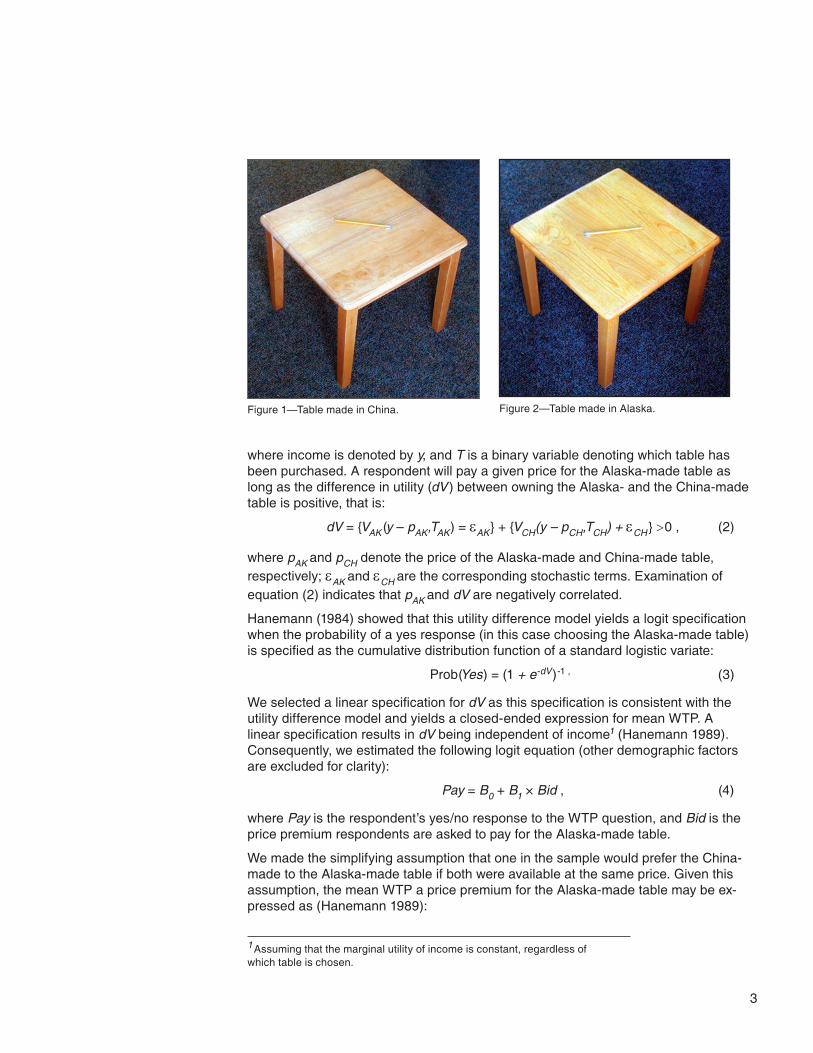
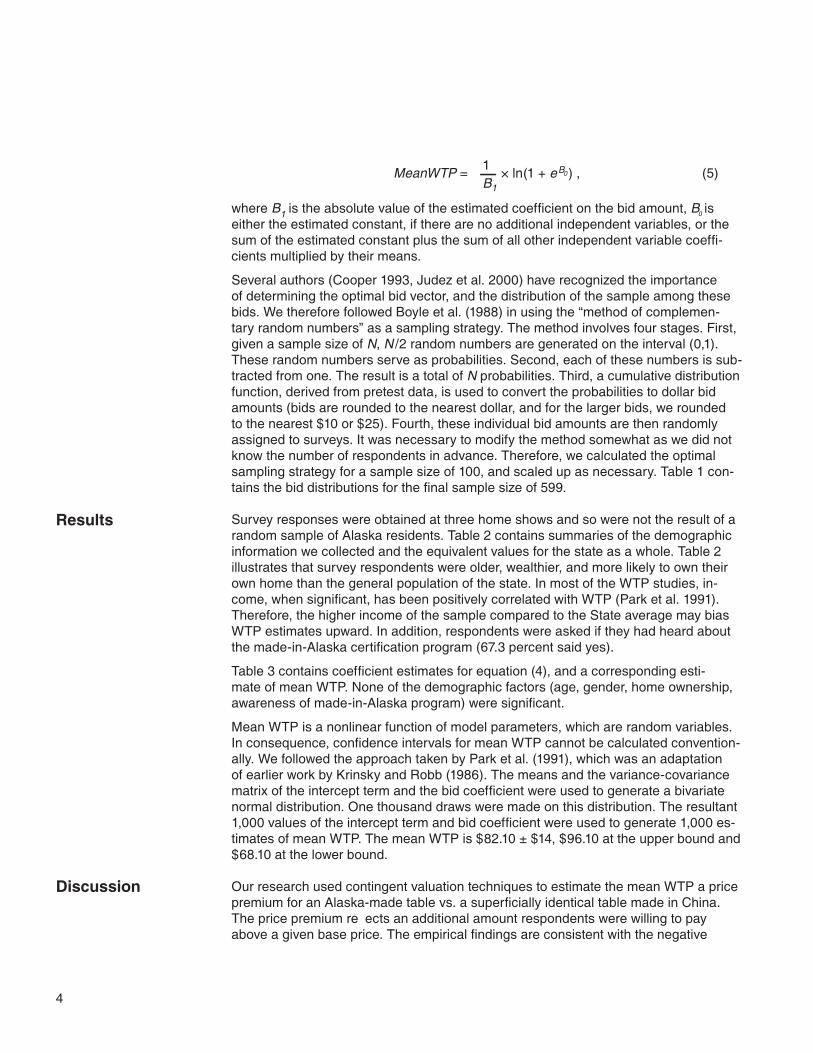
To quantify a made-in-Alaska price premium, we compared consumer response to two products whose only distinguishing feature was their place of manufacture. To facilitate such a comparison, we bought an end table made in China, and had it rep-licated in Alaska (figs. 1 and 2) from red alder (Alnus rubra Bong.), an Alaska hard-wood. Although there were slight differences in grain pattern between the two tables, which respondents were instructed to ignore, they were otherwise identical. China was selected as it is the largest exporter of furniture to the United States (U.S. Department of Commerce 2002).
Given that these two tables are superficially identical, a preference for one or the other can be interpreted as a preference for a particular place of manufacture. To quantify the willingness of consumers to pay a price premium for the Alaska-made table, we used dichotomous choice contingent valuation survey techniques. The surveys were administered at three home shows in Anchorage, Fairbanks, and Sitka in March and April 2002. Respondents were asked whether they would buy the Alaska- or China-made table given a particular price differential. The price of the China-made table was always $50, whereas the price of the Alaska-made table varied between $53 and $200. Prices for the Alaska-made table were determined based on pretest data.
We followed Hanemann (1984) in using a utility difference model as the basis for esti-mating maximum WTP from dichotomous choice data. We assumed that respondents derive utility from income and from purchasing either an Alaska- or China-made table. In addition, we assumed that a respondent’s indirect utility function contained an un-observable stochastic element. We may then represent a respondent’s indirect utility function by:
V(y,T) , (1)
Methods
2 3
where income is denoted by y, and T is a binary variable denoting which table has been purchased. A respondent will pay a given price for the Alaska-made table as long as the difference in utility (dV ) between owning the Alaska- and the China-made table is positive, that is:
dV = {VAK (y – pAK,TAK) = εAK} + {VCH(y – pCH,TCH) + εCH} >0 , (2)
where pAK and pCH denote the price of the Alaska-made and China-made table, respectively; εAK and εCH are the corresponding stochastic terms. Examination of equation (2) indicates that pAK and dV are negatively correlated.
Hanemann (1984) showed that this utility difference model yields a logit specification when the probability of a yes response (in this case choosing the Alaska-made table) is specified as the cumulative distribution function of a standard logistic variate:
Prob(Yes) = (1 + e-dV)-1 , (3)
We selected a linear specification for dV as this specification is consistent with the utility difference model and yields a closed-ended expression for mean WTP. A linear specification results in dV being independent of income1 (Hanemann 1989). Consequently, we estimated the following logit equation (other demographic factors are excluded for clarity):
Pay = B0 + B1 × Bid , (4)
where Pay is the respondent’s yes/no response to the WTP question, and Bid is the price premium respondents are asked to pay for the Alaska-made table.
We made the simplifying assumption that one in the sample would prefer the China-made to the Alaska-made table if both were available at the same price. Given this assumption, the mean WTP a price premium for the Alaska-made table may be ex-pressed as (Hanemann 1989):
Figure 1—Table made in China. Figure 2—Table made in Alaska.
1 Assuming that the marginal utility of income is constant, regardless of which table is chosen.
4 5
MeanWTP = 1 × ln(1 + eB0) , (5)
where B1 is the absolute value of the estimated coefficient on the bid amount, B0 is
either the estimated constant, if there are no additional independent variables, or the sum of the estimated constant plus the sum of all other independent variable coeffi-cients multiplied by their means.
Several authors (Cooper 1993, Judez et al. 2000) have recognized the importance of determining the optimal bid vector, and the distribution of the sample among these bids. We therefore followed Boyle et al. (1988) in using the “method of complemen-tary random numbers” as a sampling strategy. The method involves four stages. First, given a sample size of N, N /2 random numbers are generated on the interval (0,1). These random numbers serve as probabilities. Second, each of these numbers is sub-tracted from one. The result is a total of N probabilities. Third, a cumulative distribution function, derived from pretest data, is used to convert the probabilities to dollar bid amounts (bids are rounded to the nearest dollar, and for the larger bids, we rounded to the nearest $10 or $25). Fourth, these individual bid amounts are then randomly assigned to surveys. It was necessary to modify the method somewhat as we did not know the number of respondents in advance. Therefore, we calculated the optimal sampling strategy for a sample size of 100, and scaled up as necessary. Table 1 con-tains the bid distributions for the final sample size of 599.
Survey responses were obtained at three home shows and so were not the result of a random sample of Alaska residents. Table 2 contains summaries of the demographic information we collected and the equivalent values for the state as a whole. Table 2 illustrates that survey respondents were older, wealthier, and more likely to own their own home than the general population of the state. In most of the WTP studies, in-come, when significant, has been positively correlated with WTP (Park et al. 1991). Therefore, the higher income of the sample compared to the State average may bias WTP estimates upward. In addition, respondents were asked if they had heard about the made-in-Alaska certification program (67.3 percent said yes).
Table 3 contains coefficient estimates for equation (4), and a corresponding esti-mate of mean WTP. None of the demographic factors (age, gender, home ownership, awareness of made-in-Alaska program) were significant.
Mean WTP is a nonlinear function of model parameters, which are random variables. In consequence, confidence intervals for mean WTP cannot be calculated convention-ally. We followed the approach taken by Park et al. (1991), which was an adaptation of earlier work by Krinsky and Robb (1986). The means and the variance-covariance matrix of the intercept term and the bid coefficient were used to generate a bivariate normal distribution. One thousand draws were made on this distribution. The resultant 1,000 values of the intercept term and bid coefficient were used to generate 1,000 es-timates of mean WTP. The mean WTP is $82.10 ± $14, $96.10 at the upper bound and $68.10 at the lower bound.
Our research used contingent valuation techniques to estimate the mean WTP a price premium for an Alaska-made table vs. a superficially identical table made in China. The price premium reflects an additional amount respondents were willing to pay above a given base price. The empirical findings are consistent with the negative
Results
Discussion
B1
4 5
relationship between the price of the Alaska-made table and indirect utility in equation (2). To our knowledge, this is the first wood-products-related study to estimate con-sumer WTP a price premium for place of manufacture.
The estimate of $82 should be treated as an upper bound of WTP for several reasons. Many respondents were visibly embarrassed when they selected the China-made table. It seems safe to infer that some respondents selected the Alaska-made table to avoid such embarrassment. The study sample was on average older and more af-fluent than the state’s as a whole, which may have contributed to an upward bias on
Table 1—Bid distributions
Bid dollars Number of surveys
3 30 5 15 8 7 9 11 10 63 15 17 20 35 25 40 30 53 35 56 40 52 50 51 75 58 100 39 125 38 150 34
Total 599
Table 2—Sample and state of Alaska demographics
Demographic factors Sample State of Alaska
Median age (years) 45 to 55 32.4Median household income ($) $60,000 to $80,000 $47,177Gender distribution (%) Male 52.2 percent Male 51.7 percentHome ownership (%) 90.3 percent 62.5 percent
Table 3—Regression results and mean willingness to pay
Variable Coefficient Std. error Z-Statistic Prob.
Intercept 1.28 0.141 9.08 0.000Bid -.0185 .00227 -8.16 .000McFadden R-squared .0942
6 7
the estimate of mean WTP. Further, asking respondents to select between two tables, which differ in only one characteristic, is a somewhat artificial exercise. In practice, consumers choose between many different products with multiple attributes. Verlegh and Steenkamp (1999) showed that the significance of country of origin declines when consumers are faced with goods with multiple attributes. In addition, the WTP esti-mate is specific to a comparison with a China-made table and may be significantly dif-ferent for secondary wood products made in other countries. Finally, although contin-gent valuation is a well-established valuation tool (which has proven to be particularly accurate when applied to market goods), it does rely on stated as opposed to revealed preferences. Therefore, these estimates of WTP should be treated with more caution than those generated from actual consumer choices.
Despite these possible biases, we believe this study does indicate that Alaskans are willing to pay a significant price premium for secondary wood products manufactured in the state. Capturing this premium would allow secondary manufacturers in Alaska to realize a competitive advantage over out-of-state producers. Although this study was conducted in Alaska, it is reasonable to assume that consumers in other states may be willing to pay a price premium for locally produced secondary wood products.
Further work could focus on whether residents of other states are willing to pay a price premium for secondary wood products made in Alaska. Additionally, research on a va-riety of Alaska-made secondary products could be conducted. Alaska has unique and powerful associations for many people. A successful marketing strategy would allow secondary forest products manufacturers to profit from these positive associations.
Bilkley, W.J.; Nes, E. 1982. Country-of-origin effects on product evaluation. Journal of International Business Studies. 13(1): 89–99.
Boyle, K.J.; Welsh, M.P.; Bishop, R.C. 1988. Validation of empirical measures of welfare change: comment. Land Economics. 64(1). 94–98.
Cooper, J.C. 1993. Optimal bid selection for dichotomous choice contingent valuation surveys. Journal of Environmental Economics and Management. 24: 25–40.
Eastin, I.L.; Braden, R. 2000. Survey of international opportunities for Alaska softwood producers. Prepared for the Alaska Department of Community and Economic Development. Seattle, WA: Center for International Trade in Forest Products. 105 p.
Eastin, I.L.; Lane, C.; Waggener, T. [et al.]. 1996. An assessment of the market for softwood clearwood lumber products. CINTRAFOR Working Pap. No. 59. Seattle, WA: Center for International Trade in Forest Products. 91 p.
Gronroos, J.C.M.; Bowyer, J.L. 1999. Assessment of the market potential for environmentally certified wood products in new homes in Minneapolis/St. Paul and Chicago. Forest Products Journal. 49(6): 38–34.
Han, C.M. 1988. The role of consumer patriotism in the choice of domestic versus foreign products. The Journal of Advertising Research. 28(June/July): 25–32.
Hanemann, M. 1984. Welfare evaluations in contingent valuation experiments with discrete responses. American Journal of Agricultural Economics. 67(3): 332–341.
Hanemann, M. 1989. Welfare evaluations in contingent valuation experiments with discrete response data: reply. American Journal of Agricultural Economics. 71(4): 1057–1061.
Literature Cited
6 7
Haynes, R.W.; Fahey, T.D.; Fight, R.D. 1988. Price projections for selected grades of Douglas-fir lumber. Res. Note PNW-RN-473. Portland, OR: U.S. Department of Agriculture, Forest Service, Pacific Northwest Research Station. 10 p.
Jahn, L.G. 1999. Consumer perceptions of character marks on cabinet doors. AG-617. Raleigh, NC: North Carolina State University Cooperative Extension. 4 p.
Judez, L.; de Andres, R.; Perez, H.C. [et al.]. 2000. Influence of bid and subsample vectors on the welfare measure estimate in dichotomous choice contingent valuation: evidence from a case study. Journal of Environmental Management. 60: 253–265.
Krinsky, I.; Robb, A.L. 1986. On approximating the statistical properties of elasticities. Review of economics and statistics. 68(November): 715–719.
McDowell Group. 1998. The market for value-added lumber products. Prepared for the forest products manufacturing project. Juneau, AK. 70 p.
Murray, B.C.; Abt, R.C. 2001. Estimating the price compensation requirements for eco-certified forestry. Ecological Economics. 36: 149–163.
Obermiller, C.; Spangenberg, E.R. 1989. Exploring the effects of country-of-origin labels: an information processing framework. Advances in Consumer Research. 16: 454–459.
Park, T.; Loomis, J.B.; Creel, M. 1991. Confidence intervals for evaluating benefits estimates from dichotomous choice contingent valuation studies. Land Economics. 67(1): 64–73.
Puttock, G.D.; Prescott, D.M.; Meilke, K.D. 1990. Stumpage prices in southwestern Ontario: a hedonic function approach. Forest Science. 36(4): 1119–1132.
Tan, C.T.; Farley, J.U. 1987. The impact of cultural patterns on cognition and intention in Singapore. Journal of Consumer Research. 13(March): 540–544.
U.S. Department of Agriculture, Forest Service. 2001. Timber cut and sold report. Juneau, AK: Alaska Region. [Pages unknown].
U.S. Department of Commerce. 2002. Total furniture: customs value by customs value for all countries—U.S. imports for consumption annual data. http://www.ita.doc.gov/td/ocg/imp25.htm. (23 December).
Verlegh, P.W.J.; Steenkamp, J. 1999. A review and meta-analysis of country-of-origin research. Journal of Economic Psychology. 20: 521–546.
Waggener, T.R.; Fight, R.D. 1999. Clearwood quality and softwood lumber prices: What’s the real premium? Western Journal of Applied Forestry. 14(2): 73–79.

The Forest Service of the U.S. Department of Agriculture is dedicated to the principle of multiple use management of the Nation’s forest resources for sustained yields of wood, water, forage, wildlife, and recreation. Through forestry research, cooperation with the States and private forest owners, and management of the National Forests and National Grasslands, it strives—as directed by Congress—to provide increasingly greater service to a growing Nation.
The U.S. Department of Agriculture (USDA) prohibits discrimination in all its programs and activities on the basis of race, color, national origin, gender, religion, age, disability, political beliefs, sexual orientation, or marital or family status. (Not all prohibited bases apply to all programs.) Persons with disabilities who require alternative means for communication of program information (Braille, large print, audiotape, etc.) should contact USDA’s TARGET Center at (202) 720-2600 (voice and TDD).
To file a complaint of discrimination, write USDA, Director, Office of Civil Rights, Room 326-W, Whitten Building, 14th and Independence Avenue, SW, Washington, DC 20250-9410 or call (202) 720-5964 (voice and TDD). USDA is an equal opportunity provider and employer.
Pacific Northwest Research Station
Web site http://www.fs.fed.us/pnwTelephone (503) 808-2592Publication requests (503) 808-2138FAX (503) 808-2130E-mail [email protected] address Publications Distribution Pacific Northwest Research Station P.O. Box 3890 Portland, OR 97208-3890

U.S. Department of AgriculturePacific Northwest Research Station333 SW First AvenueP.O. Box 3890Portland, OR 97208-3890
Official BusinessPenalty for Private Use, $300