estimating density and relative abundance … · estimating density and relative abundance of sloth...
TRANSCRIPT

ESTIMATING DENSITY AND RELATIVE ABUNDANCE OF SLOTH BEARS
DAVID L. GARSHELIS, Minnesota Department of Natural Resources, 1201 East Highway 2, Grand Rapids, MN 55744, USA, email: [email protected]
ANUP R. JOSHI, Conservation Biology Program, University of Minnesota, St. Paul, MN 55108 USA, email: joshi002 @ maroon.tc.umn.edu
JAMES L.D. SMITH, Department of Fisheries and Wildlife, University of Minnesota, St. Paul, MN 55108, USA, email: dsmith @ mercury.forestry.umn.edu
Abstract: Estimates of abundance based on capturing, marking, and recapturing a small sample of bears are likely to be biased and imprecise, and indices of abundance are of little value if not verified with reliable population estimates. We captured and radiocollared 17 sloth bears (Melursus ursinus) in Royal Chitwan National Park, Nepal, but recapture rates were too low to derive a meaningful mark-recapture population estimate. However, we frequently observed these bears while radiotracking them, and in 47 instances saw another bear (not offspring) near the one that we were tracking; we used these sightings of associated bears as our "recapture" sample, thereby providing a means of estimating abundance. We divided estimates of abundance by the area of composite seasonal home ranges to obtain estimates of density. Densities varied by season and habitat (25-72 bears/100 km2). We extrapo- lated density estimates to obtain a population estimate for the entire park (=250 bears, excluding dependent young). We also evaluated incidence of bear- excavated termite colonies (holes in mounds or in the ground) as a potential index of bear density. This proposed index did not reflect differences in estimated bear density between habitats within the park, probably because of habitat-related differences in bear diets and in the persistence of their diggings. However, incidence of digging reflected apparent differences in bear density for areas with similar habitats. Incidence of bear diggings outside the park, where local people reported low bear densities, was only 10-20% of that in similar habitat within the park, despite equal densities of termite mounds. No bear diggings were found where local people indicated that bears had been extirpated. Thus, diggings appear to be a means of detecting the presence or absence and relative abundance of sloth bears.
Ursus 11:87-98
Key words: density, habitat-related effects, index of abundance, mark-resight, Melursus ursinus, Nepal, population estimate, Royal Chitwan National Park, sloth bear, termite mounds
Bear abundance is notoriously difficult to estimate. Many expensive and labor-intensive mark-recapture studies, most aided by telemetry, have been conducted on populations of American black bears (Ursus americanus), brown bears (U. arctos) and polar bears (U. maritimus)(Taylor 1994). Such studies have been lacking for the other 5 species of bears due to constraints on funding, access, equipment, and to some extent, in- adequate motivation. Furthermore, density of these spe- cies is perceived to be low in many portions of their ranges, making mark-recapture infeasible. However, telemetry studies have been conducted or are in progress for all of these lesser-known bear species, yielding data on movements and home ranges. Home range size and overlap are interrelated with spacing and hence density (e.g., Damuth 1981), prompting the common expecta- tion that telemetry data will yield estimates of popula- tion size.
Conservation priorities and strategies are based upon assessments of population size and trend. All of the 5 lesser-known bear species may be in jeopardy of local extirpation and eventual extinction from habitat loss and high rates of poaching (Servheen 1990, Servheen et al. 1999), yet reliable data on population size and trend do not exist. Thus, there is a pressing need to obtain these data and a seeming means to do so in ongoing or future telemetry studies. However, researchers may be lured or pressured into deriving estimates that are imprecise and inaccurate.
Extrapolating home range size and spacing to popula- tion density is generally misguided, as the relationships among these variables may be complex and even con- trary to supposition (Tufto et al. 1996). Moreover, this process presumes knowledge of every home range, which means that all individuals in the area must be radiocollared. Mark-recapture population estimates are specifically designed to estimate the number of unmarked animals, but they require large sample sizes and have assumptions that are often minimally satisfied even in large, expensive studies of common bear species (Noyce et al. In Press). The dilemma, then, is whether to even strive for a population estimate in studies with small numbers of marked animals.
An alternative is to assess population density or trend based on incidence of sign (scats, tracks, marked trees). In very small bear populations (e.g., <20), it may be pos- sible to account for all individuals through a compre- hensive record of track measurements, direct observation (Roth 1976, Camarra and Dubarry 1997), or DNA de- rived from hair or scats (Taberlet et al. 1997). Dufresne and Williams (1932, cited in Klein 1959) attempted to census brown bears at salmon (Oncorhynchus spp.) streams in Alaska using track measurements to differen- tiate individuals. Klein (1959) repeated the procedure at the same sites and concluded that although the method was a potentially useful index of relative abundance and seasonal use, it was unreliable as an indicator of popula- tion trend. Edwards and Green (1959) reached the same

88 Ursus 11:1999
conclusion for brown bears at a salmon stream in British Columbia; however, in Finland (Pulliainen 1983, 1986) and throughout the former USSR (Chestin 1994), track counts are still used to make population estimates for brown bears.
For large populations, researchers generally agree that sign and sightings provide a potential, but virtually un- tested index of bear abundance (Spencer 1955, Pelton 1972, Payne 1978, Burst and Pelton 1983, Carlock et al. 1983, Garshelis 1991). Sign and sightings may be used to define bear distribution (essentially presence-absence), and changes in distribution may signify changes in abun- dance (Kolstad et al. 1986, Osti 1987, Wang 1990, Rossell and Litvaitis 1991). However, using sightings or sign to directly detect changes in bear abundance (e.g., Knight et al. 1995) or differences in bear abundance between areas (K.G. Johnson, 1990, Bait-station surveys to moni- tor relative density, distribution, and activities of black bears in the southern Appalachian region, University of Tennessee, Knoxville, USA) may be fraught with errors
(Craighead et al. 1995), biases (Harris 1986, Mattson 1997), and problems associated with low power (Kendall et al. 1992, Beier and Cunningham 1996, Clevenger and
Purroy 1996). Estimates of population size and trend based on inci-
dence of sign (tracks) and sightings have been made for sloth bears in many parks and wildlife sanctuaries in India (Garshelis et al. 1999), but no rigorous estimates of abun- dance have been made for this species. As part of a te-
lemetry study of sloth bears in Royal Chitwan National Park, Nepal, we sought to (1) obtain a reasonably accu- rate estimate of abundance, and (2) develop a method of
assessing relative density from sign.
STUDY AREA Sloth bears in Nepal occupy a narrow (5-20 km-wide),
fragmented strip of forest in the Terai (lowlands, <500
m) and Siwalik Range (500-1,000 m; some parts called the Churia Hills), extending 835 km along the southern border with India (Fig. 1). Forested lands in the Terai and Siwaliks are nationally owned (officially State For- est), although they are generally degraded (reduced canopy, sparse understory, compacted and eroded soils) from overexploitation by local people. There are 5 pro- tected areas (former hunting reserves, now National Parks [NP] or Wildlife Reserves [WR]) in the Terai, which have more stringent restrictions on human use. Royal Chitwan National Park (932 km2; henceforth Chitwan) and the
adjacent Parsa WR (499 km2) are near the center of the Terai, Royal Bardia NP (968 km2) and Royal Suklaphanta WR (155 km2) are in the western Terai, and Koshi Tappu
WR (175 km2; primarily a wetland bird sanctuary) is in the eastern Terai. Chitwan was our study site for esti- mating sloth bear density. We visited the other parks, reserves, and unprotected forested areas along the Terai to assess relative density of bears from sign.
Chitwan has 2 principal physiographic regions: the alluvial floodplain of the Rapti and Narayani Rivers, which mark the northern border of the park, and the Churia Hills, which run east-west through the park. The alluvium is vegetated by a mosaic of tall grass and river- ine forest, whereas the uplands, from the base to the ridgetop of the Churia, are predominantly sal (Shorea robusta)-dominated forest. The park is about 30% allu- vium and 70% upland sal. Elevations range from about 150 m on the alluvial floodplain to >700 m along the ridgetop of the Churia. Our study area was in the north- central part of the park, between the village of Sauraha on the Rapti River and the ridgeline of the Churia.
Climate was subtropical with a summer monsoon. Annual rainfall averaged 245 cm, with monthly means >10 cm during May-September. The Rapti and Narayani Rivers often flooded during the peak of the rainy season, so the alluvium was saturated during and for 2 months following the monsoon (i.e., May-Nov).
Visitors could enter the park (typically on elephants [Elephas maximus]) during daylight hours. Local people were permitted to extract resources only during a short
period in January-February, when they burned, cut, and collected grasses to repair and construct their houses. Bears were most readily observed shortly after this grass burning and before the monsoon rains spurred renewed
growth. Other prominent mammals in the park included the tiger (Panthera tigris), leopard (Panthera pardus), greater one-hored rhinoceros (Rhinoceros unicornis), elephant, gaur (Bos gaurus), 4 species of deer (Cervus unicolor, Axis axis, A. porcinus, and Muntiacus muntjak), and wild boar (Sus scrofa).
METHODS
Density Estimate within Chitwan We captured bears in barrel traps and foot snares
(Margo Supplies, High River, Alberta, Canada) (baited with honey) or darted them from elephant-back. We could not trap during the wet season. During January-May, 1990-92, we captured 24 individuals and radiocollared all that were >2 years old (n = 17: 7 adult males, 2 juve- nile males [assumed to be 2-3 years old], 6 adult females, 2 juvenile females); including recaptures, but excluding yearlings with their mother, we caught 8-16 bears/year.

SLOTH BEAR ABUNDANCE * Garshelis et al. 89
0 50 100 Kilometers _._... -ll
-N b NP <-
^~\ ^Bl_^^,,-^ L^ o
0_s,retX o < : *4s ,, bSAX ' ,ieK ' ' W ;t' 0 " " '
,t Th
No. of transects ? 1 ? 2
? 21
Land use
[I: Lowland forest _ Protected area
1l
A ;BargO a U: ' u Kathman
ChitwanNP B :' -~
JSl HIA iA
du
Tappu WR
Fig. 1. Sloth bears inhabit a narrow strip of lowland forest in the Terai (<500 m) and Siwalik Hills (500-1,000 m) of southern Nepal. Within this area are 5 protected areas (NP = national park, WR = wildlife reserve). Royal Chitwan National Park (Chitwan) was our primary study site. We interviewed park wardens and local people in forested areas across the range to document presence or absence of sloth bears, and at selected sites searched strip transects to quantify sloth bear sign (diggings).
We radiotracked bears from elephant-back throughout the year (n = 3,117 locations). We attempted to locate bears twice/week. We followed the radio signal and then approached close enough to see the bear (94% of loca- tions were visual) or hear it moving in dense vegetation. In several instances another bear or other bears (that were not offspring) were observed with or near the bear that we were tracking. After trapping was completed, we used these observations of accompanying or nearby bears (i.e., bears that we were not tracking) as a recapture (resight) sample to estimate the proportion that were radiomarked. We determined if any accompanying bear that we saw was radiomarked, and if so, its identification, by scan- ning frequencies on our telemetry receiver. However, so as not to bias our resight data toward marked individu- als, we did not use the receiver to determine if another marked bear accompanied the bear that we were track- ing.
During the June-July breeding season, we intensively monitored adult females and recorded the identity of males seen in their vicinity or eventually breeding. Even though some of the same males were seen with different females, they were recorded as independent resightings. Other than these, we did not count repeated observations of the same group of bears in the resight sample.
We estimated bear abundance (and associated 95% CIs) using the Petersen equation as modified by Bailey (1952),
because our sampling (resighting) was with replacement (multiple resightings of the same individual were counted because unmarked animals could not be individually iden- tified; Seber 1982:61). Other, more sophisticated esti- mators have been developed specifically to deal with this sort of data (Minta and Mangel 1989, Bowden and Kufeld 1995); however, we tested these (using program NOREMARK; White 1996) with our data and found that point estimates and confidence intervals were virtually identical to those obtained with the simpler, modified Petersen equation.
To convert abundance to density we divided by the area that radiocollared bears used. We defined this area as the composite of all of their individual home ranges. Individual seasonal and annual home ranges were delin- eated as convex polygons, excluding areas of non-bear habitat (villages inside the park; Joshi et al. 1995).
Bears spent most of the dry season (Dec-Apr) in the alluvium, but many moved to upland areas during the wet season (Joshi et al. 1995). Thus, we made separate dry and wet season density estimates, as well as an esti- mate based on annual home ranges. During the dry sea- son, locations of radiocollared bears were clustered in a small part of the alluvium that we referred to as the dry season core area. We made a separate density estimate for this area. To do so, we had to estimate the number of marked bears simultaneously within this area, because
tR-WR
A, IC - . . s
NEPAL NEPAL
% /
IIUIA
11V
90 Ursus 11:1999
._ .
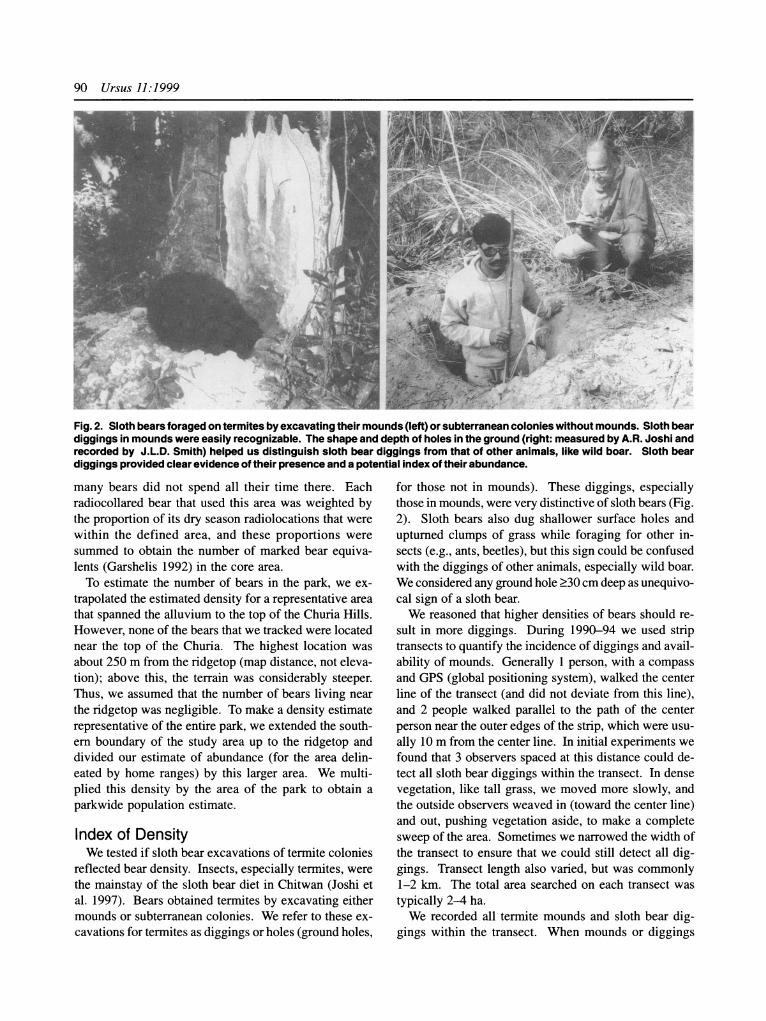
Fig. 2. Sloth bears foraged on termites by excavating their mounds (left) or subterranean colonies without mounds. Sloth bear diggings in mounds were easily recognizable. The shape and depth of holes in the ground (right: measured by A.R. Joshi and recorded by J.L.D. Smith) helped us distinguish sloth bear diggings from that of other animals, like wild boar. Sloth bear diggings provided clear evidence of their presence and a potential index of their abundance.
many bears did not spend all their time there. Each radiocollared bear that used this area was weighted by the proportion of its dry season radiolocations that were within the defined area, and these proportions were summed to obtain the number of marked bear equiva- lents (Garshelis 1992) in the core area.
To estimate the number of bears in the park, we ex- trapolated the estimated density for a representative area that spanned the alluvium to the top of the Churia Hills. However, none of the bears that we tracked were located near the top of the Churia. The highest location was about 250 m from the ridgetop (map distance, not eleva- tion); above this, the terrain was considerably steeper. Thus, we assumed that the number of bears living near the ridgetop was negligible. To make a density estimate representative of the entire park, we extended the south- ern boundary of the study area up to the ridgetop and divided our estimate of abundance (for the area delin- eated by home ranges) by this larger area. We multi- plied this density by the area of the park to obtain a parkwide population estimate.
Index of Density We tested if sloth bear excavations of termite colonies
reflected bear density. Insects, especially termites, were the mainstay of the sloth bear diet in Chitwan (Joshi et al. 1997). Bears obtained termites by excavating either mounds or subterranean colonies. We refer to these ex- cavations for termites as diggings or holes (ground holes,
for those not in mounds). These diggings, especially those in mounds, were very distinctive of sloth bears (Fig. 2). Sloth bears also dug shallower surface holes and upturned clumps of grass while foraging for other in- sects (e.g., ants, beetles), but this sign could be confused with the diggings of other animals, especially wild boar. We considered any ground hole >30 cm deep as unequivo- cal sign of a sloth bear.
We reasoned that higher densities of bears should re- sult in more diggings. During 1990-94 we used strip transects to quantify the incidence of diggings and avail- ability of mounds. Generally 1 person, with a compass and GPS (global positioning system), walked the center line of the transect (and did not deviate from this line), and 2 people walked parallel to the path of the center person near the outer edges of the strip, which were usu- ally 10 m from the center line. In initial experiments we found that 3 observers spaced at this distance could de- tect all sloth bear diggings within the transect. In dense vegetation, like tall grass, we moved more slowly, and the outside observers weaved in (toward the center line) and out, pushing vegetation aside, to make a complete sweep of the area. Sometimes we narrowed the width of the transect to ensure that we could still detect all dig- gings. Transect length also varied, but was commonly 1-2 km. The total area searched on each transect was typically 2-4 ha.
We recorded all termite mounds and sloth bear dig- gings within the transect. When mounds or diggings

SLOTH BEAR ABUNDANCE * Garshelis et al. 91
were near the outer edge of the transect, we measured the distance to the center line to determine whether they were within the strip. We also measured (to the nearest 10 cm) the height of each termite mound (whether or not it was excavated by a bear) and depth of each sloth bear hole. We categorized diggings as old or recent based on subjective criteria developed from our observations of the weathering of holes made by radiocollared bears.
In Chitwan, we laid out transects on an aerial photo- graph to ensure that they traversed the area occupied by our radiocollared bears (i.e., the areas for which we de- rived our density estimates) and adequately sampled all vegetation types (grasslands, riverine forest, stream beds, sal forest, sal forest with grass understory). Outside Chitwan, we sampled areas where there appeared to be sufficient forest cover to support bears. We drove the road that runs east-west across the full length of the Terai. We used a satellite photograph to select patches of forest off the main road (in the Terai or in the Siwaliks) that looked like potential bear habitat, and we interviewed people living in or near these forest patches about bears. We surveyed transects through forested patches where local people indicated that bears were present as well as patches of seemingly good habitat where bears were re- portedly absent. We also interviewed park wardens and conducted transects in Parsa WR, Royal Bardia NP, and Royal Suklaphanta WR, and made a less formal survey of Koshi Tappu WR, where we were told that bears did not exist.
We calculated the density of mounds, holes in mounds, and ground holes (>30 cm deep) for each transect. We grouped transects into 4 categories: alluvial grasslands and riverine forest in Chitwan; upland sal forest in Chitwan and Parsa (if a transect in Chitwan traversed both alluvial and upland habitats, we partitioned the data accordingly); other forests outside Chitwan and Parsa where local people or park wardens indicated that bears were present; and forested areas where people said bears were absent. We used nonparametric statistics (2-tailed Mann-Whitney U-tests) to compare densities of mounds and diggings between areas because these data were not normally distributed (skewed toward zeros and low val- ues).
RESULTS
Density within Chitwan Our total resight sample consisted of 47 bears, 42 of
which were marked. All but 1 of our radiomarked bears were seen with or near another bear at least once ( x = 4.2 times, median = 4.0, range 1-8). Nonbreeding-re-
lated associations where the sex of all observed bears was identified included 6 male-female pairs, 4 female- female pairs, 1 male-male pair (both subadults), 2 cases of 2 females with 1 male, 2 cases of 2 males with 1 fe- male, 2 cases of 2 males with 2 females, and 1 case of 3 males with 1 female. These observations involved bears resting, traveling or feeding together, or just feeding in proximity or passing by.
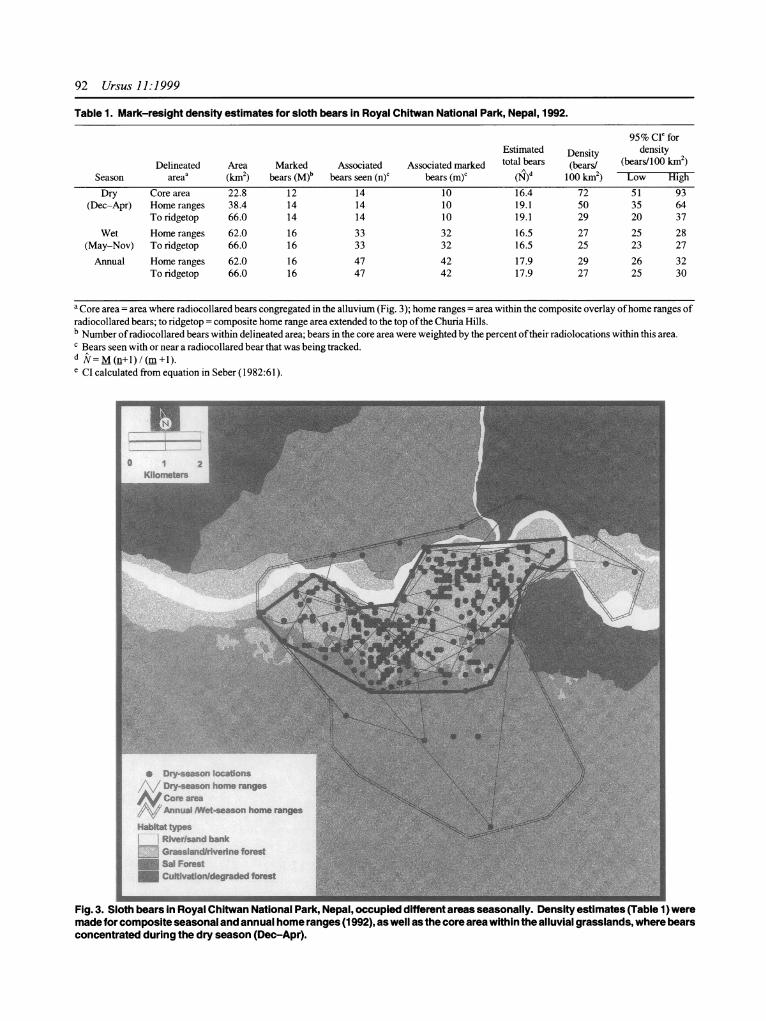
During the dry season 14 radiomarked bears occupied the study area. We saw 10 marked and 4 unmarked bears accompanying or near the bears that we tracked, yield- ing a density estimate of 50 bears/100 km2 (Table 1). All observations of accompanying or nearby bears were within the core area, in or at the edge of the grasslands (Fig. 3). Weighting each of the 14 marked bears by the proportion of time that they spent within the core area yielded an estimate of 12 marked bear-equivalents within this area. From these data we estimated that 16 bears (72 bears/100 km2) simultaneously occupied the core area (Table 1).
During the wet season 16 radiomarked bears were in the study area. We saw 12 non-mating associations in- volving 17 marked bears and 1 unmarked bear that were with the bear that we were tracking. We also monitored 5 breeding females; each was consorted by 3 males, all of which were radiomarked. Combined, these sightings yielded an estimated density of 27 bears/100 km2 within the area of the wet season home ranges (Table 1, Fig. 3).
We calculated a density of 29 bears/100 km2 within the area of the composite annual home ranges (Fig. 3). Extending this area to the ridgetop of the Churia Hills reduced this estimate slightly (because we assumed that no bears lived in the added area near the ridgetop). The estimated density within the area extended to the ridgetop was about the same using just the dry-season data, just the wet-season data, or all the data (Table 1). Extrapo- lating this density (=27 bears/100 km2), which we con- sidered representative of the park, to the whole park produced a population estimate of about 250 bears (ex- cluding the adjacent Parsa WR, which has no grassland area and thus possibly a lower overall density). This estimate does not include young bears (0-2 years old) that were still with their mother.
Index of Density Within Chitwan-Parsa, we observed a higher density
of termite mounds in the upland sal forest than in the alluvial floodplain (U = 89, P = 0.008; Table 2). The percent of mounds that had been dug by sloth bears was higher in the alluvium than in the sal (U = 80, P = 0.05), but because mound density was higher in the sal, the density of holes in mounds did not differ between the 2
92 Ursus 11:1999
Table 1. Mark-resight density estimates for sloth bears in Royal Chitwan National Park, Nepal, 1992.
95 % CI for Estimated Density density
Delineated Area Marked Associated Associated marked total bears (bears/ (bears/100 km2) Season areaa (km2) bears (M)b bears seen (n)c bears (m)c (N)d 100 km2) Low High
Dry Core area 22.8 12 14 10 16.4 72 51 93 (Dec-Apr) Home ranges 38.4 14 14 10 19.1 50 35 64
To ridgetop 66.0 14 14 10 19.1 29 20 37
Wet Home ranges 62.0 16 33 32 16.5 27 25 28 (May-Nov) To ridgetop 66.0 16 33 32 16.5 25 23 27
Annual Home ranges 62.0 16 47 42 17.9 29 26 32 To ridgetop 66.0 16 47 42 17.9 27 25 30
a Core area = area where radiocollared bears congregated in the alluvium (Fig. 3); home ranges = area within the composite overlay of home ranges of radiocollared bears; to ridgetop = composite home range area extended to the top of the Churia Hills. b Number of radiocollared bears within delineated area; bears in the core area were weighted by the percent of their radiolocations within this area. c Bears seen with or near a radiocollared bear that was being tracked. d =M (n+l) / (m+1). e CI calculated from equation in Seber (1982:61).
* Dry-seaon locations /\/ Dry-seaon home ranges
Core area Annual NVet-season home ranges
Habtat types - River/ad bank E Grasslndtlverlne forest
Sal Forest Cultivaton/degraded forest
Fig. 3. Sloth bears in Royal Chitwan National Park, Nepal, occupied different areas seasonally. Density estimates (Table 1) were made for composite seasonal and annual home ranges (1992), as well as the core area within the alluvial grasslands, where bears concentrated during the dry season (Dec-Apr).
I

SLOTH BEAR ABUNDANCE * Garshelis et al. 93
Table 2. Incidence of sloth bear diggings (holes) into termite colonies (both in mounds and in the ground) found along strip transects in Nepal, 1990-94. Tabulated values are medians among transects'.
Termite Mounds n mounds/ with Mound Ground New ground
Area (transects) ha holes (%) holes/ ha holes/ ha holes/ ha Royal Chitwan NP
Alluvial floodplain 9 8.0 A 50.0 A 4.3 A 2.7 A 1.3 A
Upland sal forest 13 16.9 B 29.0 B 4.3 A 4.0 A 0.4 A Outside Chitwan
Upland forest with bears 8 11.7 B 3.5 C 0.8 B 0.4 B 0.0 B Upland forests without bears 5 19.8 B 0.0 D 0.0 C 0.0 C 0.0 B
a Within columns, adjacent values with different letters differed at P < 0.1 (Mann-Whitney U-test; exact P values for most comparisons are in text).
habitats (U = 45.5, P = 0.9; Table 2). The density of unequivocal bear diggings that were not associated with mounds also was similar in these 2 habitats, considering all ground holes (U = 72, P = 0.4) or only freshly-dug ones (U = 64, P = 0.7; Table 2).
Because density of termite mounds differed by habitat, we compared incidence of sloth bear digging outside Chitwan, all of which was in sal forest or remnants thereof (no grasslands exist outside Chitwan) to data only from the sal forest of Chitwan-Parsa. No differences existed in the density of mounds inside versus outside Chitwan (U = 54.5, P = 0.9; Table 2). However, in areas outside Chitwan where bears were known to occur (from inter- views and from sign observed, not necessarily on transects), a lower percent of mounds had holes (U = 83, P = 0.03), and the density of holes, both in mounds and not in mounds, was 10-20% of that observed in Chitwan (mound holes: U = 83.5, P = 0.02; ground holes: U = 90.5, P = 0.006). These data include 2 transects in Royal Bardia NP where, from the low number of sightings made by park personnel, it was evident that bears occurred at a much lower density than in Chitwan. We observed a high density of termite mounds, but no sloth bear dig- ging in areas where park wardens or local people said there were no bears (Table 2), including Royal Suklaphanta WR, at the western edge of the Terai (Fig. 1).
DISCUSSION
Density within Chitwan Laurie and Seidensticker (1977) made the first em-
pirically-based estimate of sloth bear numbers in Royal Chitwan National Park. During their study of rhinocer- oses, tigers, and leopards on the alluvial floodplain near Sauraha, they tallied observations of bears. In March
1974, following grass burning and cutting, they made 26 observations of bears, which they considered to be 12 individuals. Presuming they saw and correctly identi- fied all bears that lived in the 24 km2 survey area, the estimated density was 50 bears/ 00 km2. This is the same as our density estimate for the dry season home range area but less than our estimate for the core area (Table 1), which roughly matched Laurie and Seidensticker's (1977) survey area.
Laurie and Seidensticker (1977) recognized, as we did, that this high density was not typical of the entire park. They saw few bears in the uplands. Thus, they multi- plied their density estimate by just the area of alluvium within the park (110 km2) to derive a minimum estimate of 55 bears parkwide; this represents a total park popu- lation density of only 10 bears/100 km2. They knew that bears moved into the hills during the wet season, but for their minimum estimate, they assumed that no bears were in the uplands during the dry season. We found that some radiocollared bears used the edge of the uplands even during the dry season (Fig. 3). Our inclusion of these upland bears plus an expansion of the park bound- aries, making it 70% larger by the time of our study, account for our much higher parkwide estimate of about 250 bears.
Tallied sightings of unmarked bears should yield a minimum estimate of abundance unless (1) the survey area is especially attractive to the bears (like the Chitwan grasslands), or (2) the data include repeat observations of the same individuals. For example, sighting data (Eisenberg and Lockhart 1972) that were used to esti- mate sloth bear density in Wilpattu NP, Sri Lanka, clearly contained multiple observations of some individuals. Nevertheless, the density estimate derived from these data (5 bears/100 km2; Eisenberg personal communication cited in Cowan 1972) was used to produce a nationwide population estimate (Santiapillai and Santiapillai 1990).

94 Ursus 11:1999
Obvious problems with density estimates based on sightings highlight the value of a radiomarked sample. However, sample size may be a constraint in using radiomarked animals for mark-recapture estimates. Af- ter 3 years of trapping, we had a respectable sample of 17 radiomarked bears. In 1993 we trapped for a short time and caught and radiocollared 1 more unmarked bear, but many of the previously marked bears avoided our
traps or approached traps and attempted to get the bait but avoided being captured. We could not have obtained a density estimate from the trapping data that we had, and even if we had made a more concerted effort to trap in 1993, we probably would have obtained a highly-bi- ased estimate. Trapping biases probably affect most mark-recapture studies of bears (Noyce et al. In Press), and if the sample size and population size are small, popu- lation estimates are likely to be grossly inaccurate.
Because of these biases associated with mark-recap- ture data, biologists may be tempted to use telemetry data
analogous to sighting data and produce density estimates from the observed density of radiomarked bears (or, equivalently, from observed home range size and over-
lap). This procedure, which simply disregards unmarked bears, yields a minimum estimate, which we believe is
typically of little value to science or to conservation. In our study, we saw few unmarked bears, especially
during the wet season (Table 1), indicating that a large proportion of the bears in our study area were radiomarked. Thus, if we had assumed that our radiomarked sample represented all animals in the study area, we would have estimated the parkwide population to be only about 15% lower than our present estimate. However, without our resight sample, the accuracy of our
population estimate would have been very uncertain. Our resight procedure had several advantages over the
conventional mark-recapture approach of sampling bears
by trapping: (1) data were obtained during normal
radiotracking (i.e., required no extra effort), (2) data were collectible year-round (unlike trapping, which was not feasible in flooded lowlands), and (3) data were not bi- ased by the behavior of bears toward traps. We recog- nize that not all species of bears form associations as
readily as sloth bears and that in other studies visual
sightings of bears are typically less common than in ours, where we closely approached radiomarked animals on
elephant-back (which was tolerated by bears possibly because they coexisted with wild elephants). However, this technique of obtaining resight data has been used in at least one other study (for brown bears during the breed-
ing season in Sweden; Swenson et al. 1994), and is likely applicable to others. In cases where bears are not ob- servable, cameras can provide a photographic resight
sample (Garshelis et al. 1993, Mace et al. 1994, Kontio et al. 1998).
The merits of our resight procedure may have been weakened if assumptions were violated. These assump- tions were: (1) Marked bears were as likely to associate with an
unmarked bear as with another marked bear. We could have captured bears that knew each other or were related to each other, and hence apt to associ- ate with each other. However, the numerous combinations of bears that we saw together suggests that this was not the case.
(2) Male bears seen with marked females during the breeding season arrived there independently, so if some of the same male bears were seen accompany- ing another female, they could be considered independent observations.
(3) The sex-age composition of our radiomarked sample was representative of the population. We
captured only 4 juveniles (1-2 years old) and saw no unmarked juveniles with our marked bears, so we are leery of this assumption. Either our study area happened to contain few juveniles during our study (e.g., due to reproductive synchrony among the resident females, high juvenile mortality, or
juvenile dispersal), or young bears were wary of our
traps and tended not to associate with older bears. There was some evidence for both. Each radiocollared subadult bear that we monitored after it left its mother spent several weeks-months
accompanied by another (related or unrelated) radiocollared subadult. This may have been a defensive strategy against adult aggression or
predation (Joshi et al. 1999), suggesting that
juveniles may have had high mortality and probably tried to avoid adults.
(4) An insignificant number of unmarked bears lived near the ridgeline.
(5) The section of the park where we conducted our
study was representative of the park as a whole. Laurie and Seidensticker (1977) found that bear
sightings/day of field work were fairly consistent in alluvial habitats across the park, suggesting that bear density was not unusually high in our particu- lar study site.
(6) Telemetry locations were representative of the area used by both marked and unmarked bears. To estimate density, the area that the bears used (denominator) is as important as bear abundance (numerator). Finding bears on elephant-back was often tedious, especially in the uplands, and we could not always hear their radio signals; thus,

SLOTH BEAR ABUNDANCE * Garshelis et al. 95
some bears occasionally may have been outside the area that we perceived to be their home ranges. It is well known that home ranges drawn as convex
polygons increase in size with increased sampling (Gautestad and Mysterud 1995), so the area actually occupied by these bears was probably larger than what we had delineated. Specifically, during the wet season some bears may have traveled farther up into the hills than we thought, which would have biased our density estimate upwards. However, such undetected movements would not have altered our parkwide estimate, because we included the area to the ridgeline, beyond where bears were located.
Violation of any of the first 4 assumptions would have caused our density and population estimates to be biased low. Thus, it seems probable that our estimate is conser- vative.
Index of Density We had hoped that density of bear diggings would re-
flect bear density. However, we found that density of holes, both in mounds and in the ground, did not differ between 2 habitats in Chitwan with markedly different bear densities (Tables 1 and 2). We conclude that bear
diggings were not a good index of relative bear density across different habitats.
Availability of alternate foods may affect the amount of bear diggings. Bears ate more fruits and other insects in the alluvium than in the uplands (Joshi et al. 1997). Thus, bears in the sal, which ate predominantly termites, may have produced as much digging as a higher density of bears in the grasslands. Accordingly, incidence of digging would be disproportionately low in places where (unlike Chitwan) sloth bears eat more ants or plants than termites (e.g., parts of India; Baskaran et al. 1997; T.R.K.
Yoganand, Wildlife Institute of India, Dehra Dun, India, personal communication, 1998).
Persistence of holes also may differ between habitats. Sloth bear diggings in the upland sal may have lasted longer than in the alluvium, as the soft alluvial soils were flooded during the wet season. Radiocollared bears that we observed foraging in the uplands excavated an al- most equal proportion of mounds (46%) and underground colonies (54%; Joshi et al. 1997), and this was reflected by an approximately equal proportion of mound (52%) and ground holes (48%) on our upland transects (Table 2). In contrast, bears that we observed foraging during the dry season in the alluvium dug up underground ter- mite colonies more frequently (82%) than they dug into mounds (18%), yet on our transects in the alluvium we found a lower proportion of ground holes (39%, Table 1)
than mound holes. These data indicate that a large pro- portion of alluvial ground holes had filled in.
Termite mounds were far less common in the alluvium than in the uplands, which probably explains why bears in the alluvium dug more subterranean termite colonies. However, due to the higher seasonal density of bears in the alluvium, the proportion of mounds attacked by bears was higher there than in the uplands, and the density of holes in mounds was equal in the 2 habitats. The den-
sity of freshly-dug ground holes was slightly (insignifi- cantly) higher in the alluvium than in the uplands, but overall density of ground holes was slightly (insignifi- cantly) higher in the uplands (Table 2), again suggesting that these holes persisted longer in the uplands.
Because of these habitat-related differences, neither mound holes nor ground holes can be used to compare bear densities between habitats. However, we felt justi- fied in comparing density of holes between areas of simi- lar habitat inside and outside the park.
Density of mounds was similar for upland forested habitats inside and outside the park, but in places where we found bear sign outside the park, density of both mound holes and ground holes was low (Table 2). We had no real measure of bear density outside Chitwan, but based on the judgments of people that we interviewed, bears were uncommon outside the park. We always found some digging in places where people said there were bears and found no digging in places where people said that bears were absent. Thus, density of diggings on our transects reflected the local people's views of bear den- sity.
Taken collectively, our results indicated that bear dig- gings within a certain type of habitat provided at least a crude index of bear abundance. Moreover, they implied that despite an apparently good supply of termites (high density of mounds, Table 2) in forests outside Chitwan, bears either existed at lower density or were absent, sug- gesting that human-induced mortality was higher or other habitat features were less favorable (e.g., no nearby allu- vial grasslands).
We encountered 3 problems in assessing relative den- sity from sloth bear diggings that warrant further com- ment.
Ambiguous Sign.-Whereas holes in the base of ter- mite mounds were always clearly attributable to sloth bears (the only other, but very different-looking holes in mounds were from porcupines [Hystrix indica]), ground holes from bears were sometimes difficult to differenti- ate from the rootings of wild boar. To reduce misidentifications of this sign, we tallied and measured all holes but included only those >30 cm deep in our analyses.

96 Ursus 11:1999
Clumped Sign.-Our statistical comparisons assumed that our samples (transects) were independent, which they likely were. However, within each transect we often en- countered clumps of holes that obviously resulted from the feeding activity of a single bear. Mounds were typi- cally spaced >10 m apart, and we did not tend to find
clumps of mounds with holes. Conversely, we did find dense clusters of ground holes (up to 56 holes >30 cm
deep [143 total holes] in a 0.25-ha area). In a large sample of transects, such clusters would not be problematic, but in a relatively small sample like ours, they could severely bias the results. Eliminating shallow holes, as mentioned above, helped rectify this problem (a large proportion of holes in clusters were shallow). As a further precaution, we calculated medians instead of means (because medi- ans are much less skewed by samples with an extraordi-
nary large number of holes) and we compared density of holes between areas using nonparametric statistics, which are based on rankings instead of actual values.
Defunct Mounds.- Late in this study, while collect-
ing termites from mounds for taxonomic identification, we discovered that some mounds did not have living colo- nies of termites. After sampling several mounds, we learned that all such defunct mounds could be readily identified by areas of unrepaired damage (punctures and cracks), typically well above the base. Unrepaired holes in the base of mounds that were caused by bear digging had a very different appearance. Because we had not learned to distinguish these defunct mounds before com-
pleting our surveys, our data necessarily included them.
During 1994 we conducted transects in Chitwan specifi- cally to assess the proportion of mounds with living ter- mite colonies. These data indicated that among mounds not dug by bears, the proportion with termites did not differ between the uplands and alluvium (52% and 62%, respectively, P = 0.5). Thus, the lower percent of mounds that were dug by bears in the uplands (Table 2) was not a function of disproportionately fewer mounds in this habi- tat having living colonies; bears dug into 70% of avail- able live mounds in the alluvium and 40% in the uplands, which still represents a significant difference between habitats (X2 = 7.5, 1 df, P = 0.006). In both habitats, a
higher proportion of mounds that had been dug by bears
(versus those not dug by bears) were defunct, indicating that bear digging increased the mortality of termite colo- nies in mounds (both habitats combined: 67% of mounds with bear digging vs. 47% of undisturbed mounds were defunct, X2= 5.7, 1 df, P = 0.02). Although it was unfor- tunate that we did not identify defunct mounds on our
surveys across the Terai, it seems improbable that it would have altered our principal findings. Nevertheless, we
recommend that this information be collected in future sign surveys.
CONSERVATION IMPLICATIONS Our sign surveys indicated that sloth bear density was
considerably higher inside Chitwan than in similar habi- tats outside. This may have been due in part to the pro- tection from poaching afforded by the park. However, our surveys and discussions with wardens in Royal Bardia NP indicated that bear density there was low, possibly due to the absence of alluvial grasslands and higher lev- els of poaching. We also learned that sometime during the 1980s bears disappeared from Royal Suklaphanta WR, probably from poaching (Garshelis et al. 1999). Clearly, differences in habitat and human-imposed mortality can greatly affect bear density. Thus, it would be ill-advised to extrapolate our density estimates for Chitwan to other
protected areas (e.g., in India). Moreover, comparisons of relative density also require caution, given apparent effects of habitat on the incidence (persistence) of sign. With these caveats, we believe that our methodology could serve as a useful model for future population assessments of this species.
Our methods to estimate abundance and index sign may be particularly suitable for sloth bears because (1) they can be visually observed in some areas, (2) indi- viduals occasionally associate with each other, during both the breeding and non-breeding seasons, and (3) they leave conspicuous sign. The sun bear (Helarctos malayanus), the least known of the world's bears, also
reportedly forms temporary associations and leaves evi- dent sign in the form of claw-marked trees, tree nests, and excavated bee and termite colonies (Medway 1969, Lekagul and McNeely 1977, Domico and Newman 1988, D.L. Garshelis and J.L.D. Smith unpublished data), so it is possible that a similar approach to ours could be used to assess density and relative abundance of this species. Mark-recapture using DNA from hair or scats (Schwartz et al. 1998, Woods et al. 1999) provides another new and
promising means of obtaining population estimates of bears.
Good information on the distribution of the world's 8
species of bears is becoming more available (Servheen et al. 1999), but substantiated population estimates are still
sorely lacking for many areas (especially in South America and Asia). We encourage researchers that un- dertake studies in these places to provide population es- timates based on scientifically sound methodology, to test
potential indices of relative abundance before actual ap- plication, and to thoroughly examine possible biases that
SLOTH BEAR ABUNDANCE * Garshelis et al. 97
may exist. From the standpoint of conservation, data that are unknowingly biased are often worse than no data at all.
ACKNOWLEDGMENTS We are grateful for support from the King Mahendra
Trust for Nature Conservation, Earthwatch, World Wild- life Fund, Wildlife Conservation Society, Chicago Zoo- logical Park, Minnesota Agricultural Experiment Station, and the Minnesota Department of Natural Resources. We especially thank H.R. Mishra, former Member Secretary of the King Mahendra Trust for Nature Conservation, and the staff of the Nepal Conservation Research and Training Center, particularly B. Lama, H.M. Lama, B.B. Lama, and B.L. Gauru, who assisted greatly with data collection. We also thank the many Earthwatch volun- teers who participated in various aspects of this study. We appreciate cooperation from the Department of Na- tional Parks and Wildlife Conservation, Nepal, specifi- cally T.M. Maskey and S.S. Bajimaya. Comments and edits by B.D. Leopold improved the manuscript.
LITERATURE CITED BAILEY, N.T.J. 1952. Improvements in the interpretation of
recapture data. Journal of Animal Ecology 21:120-127. BASKARAN, N., N. SIVAGANESAN, AND J. KRISHNAMOORTHY. 1997.
Food habits of sloth bear in Mudumalai Wildlife Sanctuary, Tamil Nadu, Southern India. Journal of the Bombay Natural History Society 94:1-9.
BEIER, P., AND S.C. CUNNINGHAM. 1996. Power of track surveys to detect changes in cougar populations. Wildlife Society Bulletin 24:540-546.
BOWDEN, D.C., AND R.C. KUFELD. 1995. Generalized mark- resight population size estimation applied to Colorado moose. Journal of Wildlife Management 59:840-851.
BURST, T.L., AND M.R. PELTON. 1983. Black bear mark trees in the Smoky Mountains. International Conference on Bear Research and Management 5:45-53.
CAMARRA, J.J., AND E. DUBARRY. 1997. The brown bear in the French Pyrenees: distribution, size, and dynamics of the population from 1988 to 1992. International Conference on Bear Research and Management 9(2):31-35.
CARLOCK, D.M., R.H. CONLEY. J.M. COLLINS, P.E. HALE, K.G. JOHNSON, A.S. JOHNSON, AND M.R. PELTON. 1983. The tri- state black bear study. Tennessee Wildlife Resources Agency Technical Report 83-9.
CHESTIN, I.E. 1994. Some comments on different methods of counting brown bear, Ursus arctos L., 1758, populations used in the former USSR. International Conference on Bear Research and Management 9(1):295-299.
CLEVENGER, A.P., AND F.J. PURROY. 1996. Sign surveys for estimating trend of a remnant brown bear Ursus arctos population in northern Spain. Wildlife Biology 2:275-281.
COWAN, I. McT. 1972. The status and conservation of bears (Ursidae) of the world-1970. International Conference on Bear Research and Management 2:343-367.
CRAIGHEAD, J.J., J.S. SUMNER, AND J.A. MITCHELL. 1995. The grizzly bears of Yellowstone. Their ecology in the Yellowstone ecosystem, 1959-1992. Island Press, Washington, DC, USA.
DAMUTH, J. 1981. Home range, home range overlap, and species energy use among herbivorous mammals. Biological Journal of the Linnean Society 15:185-193.
DOMICO, T., AND M. NEWMAN. 1988. Bears of the world. Facts on File, New York, New York, USA.
EDWARDS, R.Y., AND D.E. GREEN. 1959. The measurement of tracks to census grizzly bears. Murrelet 40:14-16.
EISENBERG, J.F., AND M. LOCKHART. 1972. An ecological reconnaissance of Wilpattu National Park, Ceylon. Smithsonian Contributions to Zoology 101:1-118.
GARSHELIS, D.L. 1991. Monitoring effects of harvest on black bear populations in North America: a review and evaluation of techniques. Eastern Workshop on Bear Research and Management 10:120-144.
1992. Mark-recapture density estimation for animals with large home ranges. Pages 1098-1111 in D.R. McCullough and R.H. Barrett, editors. Wildlife 2001: populations. Elsevier Applied Science, London, United Kingdom.
, P.L. COY, AND B. D. KONTIO. 1993. Applications of remote animal-activated cameras in bear research. Proceedings of the International Union of Game Biologists 21:315-322.
, A.R. JOSHI, J.L.D. SMITH, AND C.G. RICE. 1999. Sloth bear conservation action plan (Melursus ursinus). Pages 225-240 in C. Servheen, S. Herrero, and B. Peyton, compilers. Bears. Status survey and conservation action plan. IUCN/SSC Bear and Polar Bear Specialist Groups, IUCN-The World Conservation Union, Gland, Switzerland.
GAUTESTAD, A.O., AND I. MYSTERUD. 1995. The home range ghost. Oikos 74:195-204.
HARRIS, R.B. 1986. Grizzly bear population monitoring: current options and considerations. Montana Forest and Conservation Experiment Station, Miscellaneous Publication Number 45, University of Montana, Missoula, USA.
JOSHI, A.R., D.L. GARSHELIS, AND J.L.D. SMITH. 1995. Home ranges of sloth bears in Nepal: implications for conservation. Journal of Wildlife Management 59:204-214.
, AND . 1997. Seasonal and habitat- related diets of sloth bears in Nepal. Journal of Mammalogy 78:584-597.
, J.L.D. SMITH, AND D.L. GARSHELIS. 1999. Sociobiology of the myrmecophagous sloth bear in Nepal. Canadian Journal of Zoology: 77:1690-1704.
KENDALL, K.C., L.H. METZGAR, D.A. PATTERSON, AND B.M. STEELE. 1992. Power of sign surveys to monitor population trends. Ecological Applications 2:422-430.
KLEIN, D.R. 1959. Track differentiation for censusing bear populations. Journal of Wildlife Management 23:361-363.
KNIGHT, R.R., B.M. BLANCHARD, AND L.L. EBERHARDT. 1995.

98 Ursus 11:1999
Appraising status of the Yellowstone grizzly bear population by counting females with cubs-of-the-year. Wildlife Society Bulletin 23:245-248.
KOLSTAD, M. I., MYSTERUD, T. KVAM, O.J. S0RENSEN, AND S. WIKAN. 1986. Status of brown bear in Norway: distribution and population 1978-82. Biological Conservation 38:79- 99.
KONTIO, B.D., D.L. GARSHELIS, E.C. BIRNEY, AND D.E. ANDERSEN.
1998. Resilience of a Minnesota black bear population to
heavy hunting: self-sustaining population or population sink? Ursus 10:139-146.
LAURIE, A., AND J. SEIDENSTICKER. 1977. Behavioural ecology of the sloth bear (Melursus ursinus). Journal of Zoology, London 182:187-204.
LEKAGUL, B., AND J.A. MCNEELY. 1977. Mammals of Thailand.
Sahakarbhat Company, Bangkok, Thailand.
MACE, R.D., S.C. MINTA, T.L. MANLEY, AND K.E. AUNE. 1994.
Estimating grizzly bear population size using camera
sightings. Wildlife Society Bulletin 22:74-83.
MATTSON, D.J. 1997. Sustainable grizzly bear mortality calculated from counts of females with cubs-of-the-year: an evaluation. Biological Conservation 81:103-111.
MEDWAY, L.G.G-H. 1969. The wild mammals of Malaya and offshore islands including Singapore. Oxford University Press, London, United Kingdom.
MINTA, S., AND M. MANGEL. 1989. A simple population estimate
based on simulation for capture-recapture and capture- resight data. Ecology 70:1738-1751.
NOYCE, K.V., D.L. GARSHELIS, AND P.L. COY. 2000. Differential
vulnerability of black bears to trap and camera sampling, and resulting biases in mark-recapture studies. Ursus 12.
OSTI, F. 1987. Status of a remnant brown bear population in
Trentino, Italy: 1981-85. International Conference on Bear Research and Management 7:17-18.
PAYNE, N.F. 1978. Hunting and management of the Newfoundland black bear. Wildlife Society Bulletin 6:206- 211.
PELTON, M.R. 1972. Use of foot trail travellers in the Great
Smoky Mountains National Park to estimate black bear
(Ursus americanus) activity. International Conference on Bear Research and Management 2:36-42.
PULLIAINEN, E. 1983. Behaviour of an expanding population of
the brown bear (Ursus arctos) in northern Europe. Zeitschrift fur Saugetierkunde 48:290-297.
1986. Brown bear immigration into Finland from the
east. International Conference on Bear Research and
Management 6:15-20. ROSSELL, C.R., JR., AND J.A. LITVAITIS. 1991. A comparison of
methods to estimate the distribution of low-density black
bear populations. Transactions of the Northeast Section of the Wildlife Society 48:15-20.
ROTH, H.U. 1976. Status of the last brown bears of the Alps in the Trentino, Italy. International Conference on Bear Research and Management 3:307-308.
SANTIAPILLAI, A., AND C. SANTIAPILLAI. 1990. Status, distribution and conservation of the sloth bear (Melursus ursinus) in Sri Lanka. Tiger Paper 17:13-15.
SCHWARTZ, M.K., D.A. TALLMON, AND G. LUIKART. 1998. Review
of DNA-based census and effective population size estimators. Animal Conservation 1:293-299.
SEBER, G.A.F. 1982. The estimation of animal abundance and related parameters. Macmillan, New York, New York, USA.
SERVHEEN, C. 1990. The status and conservation of the bears of the world. International Conference on Bear Research and Management Monograph Series 2.
, S. HERRERO, AND B. PEYTON, COMPILERS. 1999. Bears.
Status survey and conservation action plan. IUCN/SSC Bear and Polar Bear Specialist Groups, IUCN-The World Conservation Union, Gland, Switzerland.
SPENCER, H.E. Jr. 1955. The black bear and its status in Maine. Maine Department of Inland Fisheries and Game, Game Division Bulletin Number 4.
SWENSON, J.E., F. SANDEGREN, A. BJARVAL, A. SODERBERG, P.
WABAKKEN, AND R. FRANZEN. 1994. Size, trend, distribution
and conservation of the brown bear Ursus arctos population in Sweden. Biological Conservation 70:9-17.
TABERLET, P., J.J. CAMARRA, S. GRIFFIN, E. UHRES, O. HANOTTE,
L.P. WAITS, C. DUBOIS-PAGANON, T. BURKE, AND J. BOUVET.
1997. Noninvasive genetic tracking of the endangered Pyrenean brown bear population. Molecular Ecology 6:869- 876.
TAYLOR, M., EDITOR. 1994. Density-dependent population
regulation in black, brown, and polar bears. International Conference on Bear Research and Management Monograph Series 3.
TUFTO, J., R. ANDERSEN, AND J. LINNELL. 1996. Habitat use and
ecological correlates of home range size in a small cervid: the roe deer. Journal of Animal Ecology 65:715-724.
WANG, Y. 1990. The current status of Formosan black bear in Taiwan. International Conference on Bear Research and
Management 8:1-4. WHITE, G.C. 1996. NOREMARK: Population estimation from
mark-resighting surveys. Wildlife Society Bulletin 24:50-
52. WOODS, J.G., D. PAETKAU, D. LEWIS, B.N. MCLELLAN, M.
PROCTOR, AND C. STROBECK. 1999. Genetic tagging of free-
ranging black and brown bears. Wildlife Society Bulletin 27:616-627.