estimating fishing and natural mortality rates for pacific … · fish of age 1 and older were...
TRANSCRIPT
E(
Ra
b
a
ARR2A
KPMNFSE
1
sTtOCooewhr
aPe2
IT
0d
Fisheries Research 119– 120 (2012) 115– 127
Contents lists available at SciVerse ScienceDirect
Fisheries Research
jou rn al hom epage: www.elsev ier .com/ locate / f i shres
stimating fishing and natural mortality rates for Pacific bluefin tunaThunnus orientalis) using electronic tagging data
.E. Whitlocka,∗, M.K. McAllisterb, B.A. Blocka
Hopkins Marine Station, 120 Oceanview Boulevard, Pacific Grove, CA 93950, USAFisheries Centre, Aquatic Ecosystems Research Laboratory, 2202 Main Mall, The University of British Columbia, Vancouver, BC V6T 1Z4, Canada
r t i c l e i n f o
rticle history:eceived 16 May 2011eceived in revised form8 December 2011ccepted 29 December 2011
eywords:acific bluefin tunaark-recapture
a b s t r a c t
This paper presents estimates of fishing and natural mortality rates derived from a spatially- and sea-sonally structured Bayesian mark-recapture model for electronically tagged Pacific bluefin tuna (PBFT)(Thunnus orientalis). Fishing mortality rates (F) were estimated by age group, year, quarter and areaand ranged between 0.02 and 1.92 quarter−1 for the northeastern Pacific Ocean (EPO) and 0.18 and0.54 quarter−1 for the northwestern Pacific Ocean. Annual Fs in the EPO were on average 2–3 timeshigher than the estimated rate of natural mortality for Pacific bluefin tuna aged 2 and 3 and 4–6 timeshigher than the estimated rate of natural mortality for Pacific bluefin tuna aged 4 and older. The estimateof M for PBFT aged 5 and above (median 0.15 yr−1, standard deviation = 0.10) was lower than the value
−1
atural mortalityishing mortalitypatial structurelectronic tagging datacurrently used in the PBFT stock assessment (i.e. 0.25 yr ). In addition to estimating age-group specificnatural mortality rates (M), the plausibility of alternative values for M was evaluated by fixing it at theage-specific schedules tested in the PBFT stock assessment and computing a Bayesian model selectioncriterion (the Deviance Information Criterion, DIC) for alternative M configurations. For models in whichM was fixed, the lowest DIC was obtained for the M scenario that assumed the lowest value of M for PBFTaged 4 and above (i.e. 0.12 yr−1).
. Introduction
Pacific bluefin tuna (Thunnus orientalis) is a highly migratorypecies, having the largest home range of any tuna in the genushunnus. Pacific bluefin tuna, hereafter PBFT, are primarily dis-ributed throughout the temperate waters of the northern Pacificcean but also range into the western South Pacific (Bayliff, 1994;ollette and Nauen, 1983). Two spawning areas are currently rec-gnized; one in the southwestern North Pacific off Taiwan and thether in the Sea of Japan (Okiyama, 1974; Chen et al., 2006; Tanakat al., 2007). PBFT in spawning condition have been taken in theseaters in the months of April through August. Genetic structureas not been detected to date in PBFT, and one stock is currentlyecognized throughout the Pacific Ocean.
Commercial fisheries exist for PBFT throughout their range andre most intensive in the northwestern (WPO) and northeastern
acific Ocean (EPO). Annual reported ocean-wide catches since thearly 1950s have varied between 8000 and 35,000 tons (IATTC,005), averaging around 25,000 tons between 1950 and 1980 and∗ Corresponding author. Current address: Finnish Game and Fisheries Researchnstitute, Viikinkaari 4, P.O. Box 2, FI-00791 Helsinki, Finland.el.: +358 20 575 1439; fax: +358 205 751 201.
E-mail address: [email protected] (R.E. Whitlock).
165-7836/$ – see front matter © 2012 Elsevier B.V. All rights reserved.oi:10.1016/j.fishres.2011.12.015
© 2012 Elsevier B.V. All rights reserved.
15,000 tons thereafter. Catches in the EPO have declined sincethe 1960s, although the last decade saw catches rapidly increase(Aires-da-Silva et al., 2007). Concomitantly, fishing effort in the EPOdecreased between 1960 and 1990 but has rebounded since the late1990s in concert with expansion of the PBFT ranching industry offBaja Mexico (Aires-da-Silva et al., 2007). PBFT are also exploited bya variety of fisheries in the WPO, including purse-seine, longlineand gillnet fisheries (Bayliff, 2001).
A preliminary stock assessment was conducted for PBFT by theInter-American Tropical Tuna Commission (IATTC) (Bayliff, 2001).However, the available catch and effort data and length-frequencydata for the WPO were insufficient for calculation of abundanceindices for the WPO or to conduct cohort analysis for the entirePacific Ocean (Bayliff, 2001). A full stock assessment includingupdated catch and effort and length-frequency data for the WPOwas conducted by the International Scientific Committee for Tunaand Tuna-like Species in the North Pacific Ocean (ISC) in 2008(Anon., 2008). Estimates of PBFT fishing mortality rates (F) in recentyears were above fishing mortality levels corresponding to targetreference points such as FMSY (the fishing mortality that wouldachieve maximum sustainable yield) (ISC, 2008).
The stock assessment for PBFT is subject to uncertainty aboutseveral basic life-history characteristics, foremost among themthe rate of natural mortality, M (Bayliff, 2001). M is of primaryimportance in fish stock assessments as it determines potential
1 Resear
mBvpHfideoataodwtfio
tWttsioibbCdfmcvirMfp
iaa
Ft
16 R.E. Whitlock et al. / Fisheries
aximum sustainable yield (MSY) (Beddington and Cooke, 1983;eamesderfer and North, 1995) and a population’s response to har-est. Higher rates of natural mortality are associated with moreroductive stocks and their ability to sustain higher harvest rates.owever, for most exploited fish populations, M is typically dif-cult to estimate because it is not feasible to monitor naturaleaths (Quinn and Deriso, 1999) and it is difficult to separate theffects of natural mortality, fishing mortality and recruitment inbservations of fish abundance (Hightower et al., 2001; Hilbornnd Walters, 1992). Moreover, methods available for the estima-ion of M for fish populations have onerous data requirements andssumptions that are not easily satisfied. For example, estimationf M using catch curve analysis (Ricker, 1975; Vetter, 1988) requiresata from an unexploited or very lightly exploited population andhen catch-at-age data become available, exploitation rates are
ypically non-negligible. In contrast, tagging experiments with suf-ciently rigorous tagging design and high tag recovery rates areften not feasible in many instances (Walters and Martell, 2004).
M has commonly been identified as a key source of uncer-ainty in fish stock assessments (Lapointe et al., 1989; Hilborn and
alters, 1992). The treatment of age-specific Ms as fixed parame-ers fails to capture this uncertainty, which could ultimately leado loss of yield or overexploitation of the stock. Currently an age-pecific vector for M, with M for ages 4 and above equal to 0.25 yr−1
s used in the PBFT stock assessment. Lower values for M for fishf age 4 and older yielded estimates of the depletion of spawn-ng biomass between 1952 and 2005 (<5%) and unfished spawningiomass (about 1.4 million tons) that were considered implausi-le by the working group (Anon., 2008; Aires-da-Silva et al., 2009).urrently, only the value of M for age-0 PBFT has been empiricallyerived using tagging data (Takeuchi and Takahashi, 2006). Valuesor fish of age 1 and older were derived using life-history based
ethods and estimates for southern bluefin tuna (Thunnus mac-oyi) (Polacheck et al., 1997). However, when considered together,alues for M of 0.25 yr−1 and above with moderate to high fish-ng mortality rates for adult PBFT may be incongruous with theireported longevity (maximum age of 26 years, Shimose et al., 2009).ore information on M for PBFT aged 4 and above may thus be use-
ul to help reduce the substantial uncertainty associated with thisarameter.
Tagging data can be informative with respect to rates of fish-ng and natural mortality. A major caveat to using tagging data is
requirement that the tag reporting rate is known or can be reli-bly estimated (Bacheler et al., 2009; Pollock et al., 1991, 2001).
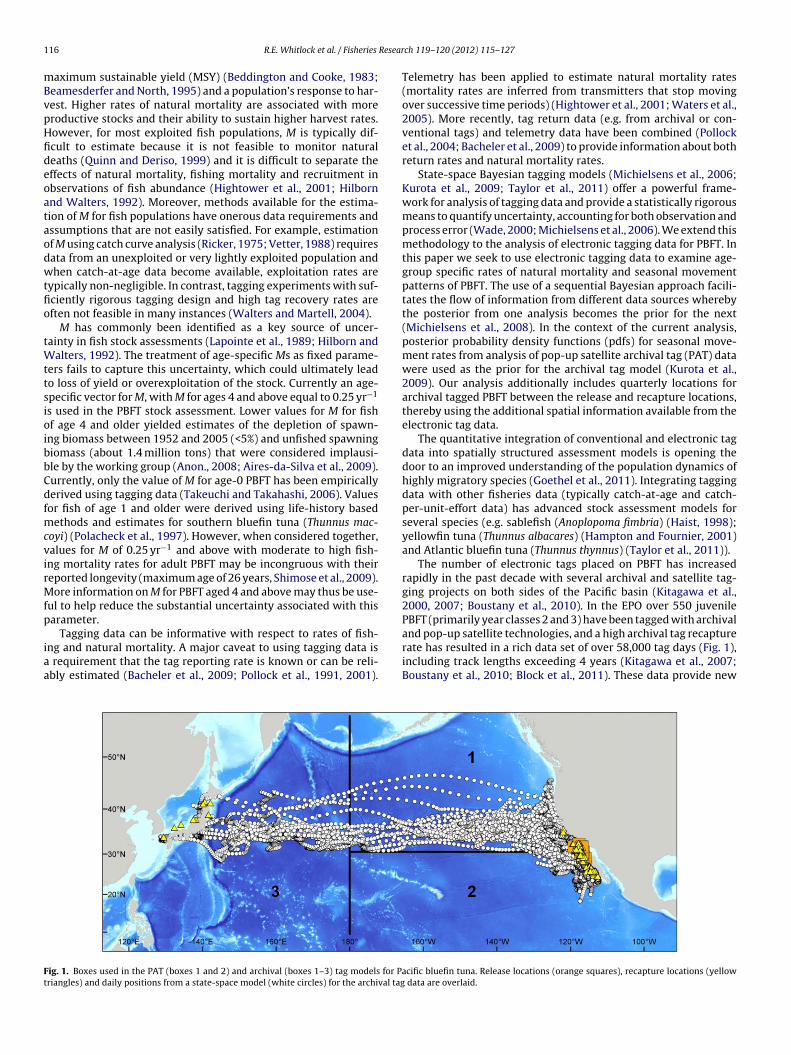
ig. 1. Boxes used in the PAT (boxes 1 and 2) and archival (boxes 1–3) tag models for Priangles) and daily positions from a state-space model (white circles) for the archival tag
ch 119– 120 (2012) 115– 127
Telemetry has been applied to estimate natural mortality rates(mortality rates are inferred from transmitters that stop movingover successive time periods) (Hightower et al., 2001; Waters et al.,2005). More recently, tag return data (e.g. from archival or con-ventional tags) and telemetry data have been combined (Pollocket al., 2004; Bacheler et al., 2009) to provide information about bothreturn rates and natural mortality rates.
State-space Bayesian tagging models (Michielsens et al., 2006;Kurota et al., 2009; Taylor et al., 2011) offer a powerful frame-work for analysis of tagging data and provide a statistically rigorousmeans to quantify uncertainty, accounting for both observation andprocess error (Wade, 2000; Michielsens et al., 2006). We extend thismethodology to the analysis of electronic tagging data for PBFT. Inthis paper we seek to use electronic tagging data to examine age-group specific rates of natural mortality and seasonal movementpatterns of PBFT. The use of a sequential Bayesian approach facili-tates the flow of information from different data sources wherebythe posterior from one analysis becomes the prior for the next(Michielsens et al., 2008). In the context of the current analysis,posterior probability density functions (pdfs) for seasonal move-ment rates from analysis of pop-up satellite archival tag (PAT) datawere used as the prior for the archival tag model (Kurota et al.,2009). Our analysis additionally includes quarterly locations forarchival tagged PBFT between the release and recapture locations,thereby using the additional spatial information available from theelectronic tag data.
The quantitative integration of conventional and electronic tagdata into spatially structured assessment models is opening thedoor to an improved understanding of the population dynamics ofhighly migratory species (Goethel et al., 2011). Integrating taggingdata with other fisheries data (typically catch-at-age and catch-per-unit-effort data) has advanced stock assessment models forseveral species (e.g. sablefish (Anoplopoma fimbria) (Haist, 1998);yellowfin tuna (Thunnus albacares) (Hampton and Fournier, 2001)and Atlantic bluefin tuna (Thunnus thynnus) (Taylor et al., 2011)).
The number of electronic tags placed on PBFT has increasedrapidly in the past decade with several archival and satellite tag-ging projects on both sides of the Pacific basin (Kitagawa et al.,2000, 2007; Boustany et al., 2010). In the EPO over 550 juvenilePBFT (primarily year classes 2 and 3) have been tagged with archival
and pop-up satellite technologies, and a high archival tag recapturerate has resulted in a rich data set of over 58,000 tag days (Fig. 1),including track lengths exceeding 4 years (Kitagawa et al., 2007;Boustany et al., 2010; Block et al., 2011). These data provide newacific bluefin tuna. Release locations (orange squares), recapture locations (yellow data are overlaid.

R.E. Whitlock et al. / Fisheries Resear
Fig. 2. Boxplot of days-at-large by deployment year for archival tagged Pacificbluefin tuna. Thick horizontal lines denote medians; the lower and upper limits oftio
iimsettW2tme
odltersifRavoIe
2
2
uoti
he boxes represent lower and upper quartiles. The dotted lines extend to the min-mum and maximum values and open circles represent outliers (defined as valuesutside 3/2 times the interquartile range).
nformation on the migrations of PBFT and have revealed that PBFTn the EPO have predictable seasonal patterns of north-south move-
ent that recur annually in the California Current in relationship toeasonal oceanographic changes (Kitagawa et al., 2007; Boustanyt al., 2010; Block et al., 2011). The positional data also show thathe California Current is retentive for young PBFT that migrate tohe EPO, usually for one to four years with eventual return to the
PO along the North Pacific transition zone front (Boustany et al.,010). Archival tagging experiments have also been carried out inhe WPO, primarily to study ambient temperature preferences and
igration patterns in young PBFT (Itoh et al., 2003a,b; Kitagawat al., 2006, 2009).
This paper presents results from a novel tagging model basedn EPO electronic tag data sets where fishing mortality rates wereirectly estimated from archival tag returns. With the relatively
ong times at large for electronically tagged PBFT, particularly inhe early years of the study (2002–2004, Fig. 2) and the high recov-ry rates of tags, the tagging data should also be informative withespect to age-specific Ms. The mark-recapture model is spatiallytructured and allows estimation of seasonal movement probabil-ties, which is desirable for robust estimation of exploitation ratesor highly migratory fish such as tunas (Walters and Martell, 2004).esults are presented for informative and uninformative priors forge-group specific Ms. The consistency of alternative candidate Mectors proposed for the PBFT stock assessment with the structuref the tagging data set was evaluated by computing the Deviancenformation Criterion (DIC) for each fixed M-vector (Spiegelhaltert al., 2002; Bolker, 2008).
. Materials and methods
.1. Data
Electronic tagging data covering the period 2000–2009 were
sed in analyses described below. Tagging experiments, inclusivef deployments utilizing archival tags and pop-up satellite archivalags (PAT tags) were conducted under the Tagging of Pacific Pelag-cs (TOPP) Program (see Kitagawa et al., 2007; Boustany et al., 2010;ch 119– 120 (2012) 115– 127 117
Block et al., 2011). PAT tags (N = 35) were applied between 2000 and2008 off the Baja California coast, with a maximum programmedtime at large of 365 days. Pop-up satellite archival tags (severalWildlife Computers models, including PAT 2.0, 3.0 and Mk10) wereattached to the PBFT using monofilament leaders with a shrink-wrap cover (Marcinek et al., 2001; Block et al., 2005). All tags wereplaced in the vicinity of the second dorsal fin region with a pene-tration of 8–10 cm.
Surgically implanted archival tags (Lotek, LTD 2310 series A–D)were deployed during cruises at sea off the coast of California andMexico aboard the fishing vessel Shogun (Kitagawa et al., 2007;Boustany et al., 2010). Data used in the mark-recapture model com-prise release location (vessel GPS) data for 523 surgically implantedarchival tags released off the Baja California coast between 2002and 2009. Recapture end point GPS locations were available for270 archival tagged PBFT. Additionally, quarterly locations wereobtained for archival tagged fish (in quarters intermediate betweenrelease and recapture) by finding the model area in which max-imal occupancy (number of days) occurred during each quarter.Geolocation estimates of daily positions were obtained using light(longitude) and sea surface temperature (latitude) based algo-rithms (Teo et al., 2004). A state-space modeling approach (Jonsenet al., 2005; Block et al., 2011) was used to refine daily position esti-mates and quantify the uncertainty associated with the positions.
Curved lengths were measured in the tagging cradle for all elec-tronically tagged fish. Ages were assigned (following conversion ofcurved length to straight length) using an inverse von-Bertalanffyequation with parameters taken from Shimose et al. (2009). Thetagged tuna ranged in age (based on length) from 1 to 5 years atrelease.
3. Model structure
The Pacific Ocean was subdivided into three areas (boxes) for thepurposes of the model. These areas correspond roughly to Japan andtrans-Pacific (box 3); California (box 1) and Mexico (box 2) (Fig. 1).The boundary between the northern and southern boxes in the EPOwas assigned such that an approximately equal number of releasesoccurred on either side of the boundary to facilitate estimation ofmovement rates between the EPO boxes. This division was also cho-sen as it coincides approximately with the southernmost limit ofthe USA’s Exclusive Economic Zone (EEZ) in the Pacific Ocean andas such has relevance with regard to fishing dynamics and fish-ery management. The WPO box (box 3) was not used for the PATmodel, since no releases or recoveries of PAT tags occurred in theWPO. We also note that in a few runs not reported below, slightlydifferent configurations of the spatial boxes were applied to eval-uate the sensitivity of results to different configurations. Estimatesof movement parameters were similar, probably because most fishmoved well beyond the current dividing line in their north-southmigration. Both PAT and archival tag models follow the fate ofcohorts of tagged fish released in a particular year, quarter and area.The archival tag model had additional age group structure (age-structure was not used in the PAT model owing to the relativelysmall number of tags modeled).
4. PAT model
The model of PAT tags included only those tags for which pop-upsatellite tag location data were available (about 90%). This modelwas primarily used to estimate prior distributions for seasonal
movement rates between two areas (north and south EPO, boxes 1and 2). Fishing and natural mortality rates were not estimated inthe PAT model. Few (<5) tags were known to have been recoveredby fishers; the majority of tags used in this analysis were recovered
1 Resear
apawc(aiaapTa
atdps
wleaTmtssPpia
5
aenaif
5
wbsomPfralfoio
af(
18 R.E. Whitlock et al. / Fisheries
s a result of release from fish at or close to a pre-programmedop-up time. A vector of parameters describing the probability for
tag to pop-up x quarters earlier than its programmed pop-up dateas used (Kurota et al., 2009) owing to the lack of information to
learly distinguish the state associated with tag release/recoverye.g. tag popped-up after a natural mortality event, tag shed from
live fish etc.) in the data. This is just another way of express-ng the probability of a tag popping up a given number of quartersfter release. This formulation was adopted since it appears that thectual pop-up time is more likely to depend on the programmedop-up time than the actual time (i.e. year and season of release).ags that release before the scheduled time may also be of interests these may be more likely to be shedding events.
Seasonal (quarterly) probabilities of movement from area j torea k (pjk) were estimated, with the probability of residency equalo 1 − pjk. Movement in any time step was assumed to be indepen-ent of all prior locations except that in the previous time step. Betarior pdfs (the conjugate prior for binomial data) were placed oneasonal movement probabilities in the PAT model.
A Dirichlet prior pdf (the conjugate prior for multinomial data)as placed on the probability for a tag to pop-up × quarters ear-
ier than its programmed pop-up date, with equal probabilities forach quarter. The number of tags that popped off in each time andrea cell was assumed to follow a negative binomial distribution.he negative binomial distribution has a variance no less than itsean, and can describe the overdispersion or clustering of recap-
ure events. It therefore provides an appropriate representation inituations where random mixing of fish in space does not occur,o that recapture events are not independent. The suitability of aoisson versus negative binomial observation error model for theop-up tag data was addressed using a likelihood ratio test. This
ndicated that the PAT recovery data are over-dispersed relative to Poisson distribution (�2 = 84 on 1 degree of freedom, p < 0.001).
. Archival tag model
Fishing mortality rates were estimated by area group, wherennual patterns in fishing mortality were estimated for the north-astern Pacific Ocean (boxes 1 and 2, Fig. 1) (EPO) and theorthwestern Pacific Ocean (box 3, Fig. 1) (WPO). 94% of recapturedrchival tags were recovered in the EPO boxes, so this analysis isntended primarily to estimate fishing and natural mortality ratesor the EPO.
.1. Movement
The archival tag model comprised three boxes (with a north-estern Pacific box in addition to the two northeastern Pacific
oxes used in the PAT model). The posterior beta pdfs for season-pecific movement rates in the eastern Pacific Ocean from analysisf PAT tag data were used to parameterize the Dirichlet prior forovement rates between the EPO areas in the archival tag model.
osterior correlations between estimated movement parametersrom the PAT model were low (maximum absolute pairwise cor-elation of 0.30). We therefore chose not to include informationbout correlations between movement parameters when formu-ating the prior for the archival tag analysis. Seasonal movementsrom areas 1 and 2 (the EPO) to area 3 (the WPO) were assignedne third of the total prior probability for movements originatingn those areas. Parameters describing seasonal movement rates outf the WPO box were set equal to 0.
For archival tag data, quarterly locations for the entire timet large were used to inform estimates of movement parametersor recaptured and reported tags. For this purpose, an additionalmultinomial) likelihood component was added to describe the
ch 119– 120 (2012) 115– 127
probability of observing a certain number of tags in each area attime t (where t is intermediate between the quarters of release andrecapture), given the predicted distribution of tagged animals atthat time.
5.2. Fishing and natural mortality rates
Three age groups were used for estimation of M (ages 2 and3, group 1; age 4, group 2; ages 5+ group 3). This grouping wasused because attempts at estimation with parameters stratified byactual ages indicated over-parameterization (no updating of pri-ors for F and M parameters for some ages). The grouping adoptedwas the most disaggregated in terms of the number of age groupsthat still resulted in an adequate amount of updating of priors. Pro-cess error was included in age group specific survival rates; thiswas implemented through the use of an error term with variancedependent on the length of the model time step (Michielsens et al.,2006). A symmetric uniform distribution centered around 1 wasused to model process error in survival rate: the quarterly processerror was bounded between 0 and eZ (where Z is the total mortalityrate), the latter to ensure that the number of tagged fish could notincrease between subsequent time steps.
The suitability of a Poisson versus negative binomial observationerror model for the recapture data was addressed using a likeli-hood ratio test. This indicated that the recapture data are highlyoverdispersed and a negative binomial observation model is thus abetter candidate than the Poisson distribution �2 = 993 on 1 degreeof freedom, p < 0.001.
Fs in the EPO areas were not disaggregated by fleet or gear type,since a high proportion (88%) of the tags was recovered by the Mex-ican purse seine fishery. In order to avoid estimation of too manyF parameters, within-year Fs were estimated by area group, quar-ter and age group, and an annual F multiplier was estimated whichwas applied to within-year Fs in a given year (i.e. the within-yearseasonal pattern was assumed to be the same across years for theEPO and WPO respectively) (Eq. (1i)). The F multiplier in the firstyear in the time series (2002) was set equal to 1 (Eq. (1ii)); esti-mated F multipliers for subsequent years are thus relative to the2002 value:
Ftot y,g(a),s,h(k) = Fg(a),s,h(k)�y,h(k) (1i)
�2002,h(k) = 1 (1ii)
where Fg(a),s,h(k) is the quarterly fishing mortality rate for fish in agegroup g in season s and area group h. Area group 1 corresponds tothe EPO areas (boxes 1 and 2), while area group 2 corresponds tothe WPO (box 3) and �y,h(k) is the annual F multiplier for year y andarea group h.
The prior applied to within-year Fs in the EPO (areas 1 and 2)implied a seasonal pattern; a lognormal prior was placed on quar-terly Fs with lower medians for the winter seasons (quarters 1 and4) relative to the summer (quarters 2 and 3) (Table 1). Note that weuse the median as the key statistic for central tendency of priors andposteriors throughout since this is the conventional statistic for thelognormal distribution which is applied extensively in this analysis.Moreover, the use of the median rather than the mean has becomecommon practice in many Bayesian stock assessments since amongother things it is easier to interpret than the mean. Due to a lackof information regarding the possible seasonality of WPO fisheries(area 3), a prior that implied equal F for all quarters was placed onWPO within-year Fs (Table 1). Priors for F multipliers in the EPObetween 2003 and 2006 were based on the ratios of estimates of
annual fishing effort in this region to estimated fishing effort in2002 (Aires-da-Silva et al., 2007). Priors for EPO Fs were furtherspecified such that the annual Fs implied encompassed estimatedvalues for annual Fs corresponding to different fixed schedules
R.E. Whitlock et al. / Fisheries Resear
Table 1Prior probability density functions for estimated parameters in the Bayesian mark-recapture model for Pacific bluefin tuna: see equations in population dynamicssection for definitions. M is in units of yr−1, Fs are in units of quarter−1.
Model Parameter Prior Prior median
PAT Dirichlet[] Equal priorprobabilities
PAT p Beta(1,1) 0.50Archival FEPO (winter) Lognormal(−3.00,0.452) 0.05Archival FEPO (summer) Lognormal(−1.0, 0.452) 0.37Archival FWPO Lognormal(−1.50, 0.502) 0.22Archival �EPO,2003 Lognormal(0.05,0.602) 1.04Archival �EPO,2004 Lognormal(0.58,0.602) 1.79Archival �EPO,2005 Lognormal(0.33,0.602) 1.39Archival �EPO,2006 Lognormal(0.81,0.602) 2.24Archival �EPO,2007–2009 Lognormal(0,0.602) 1.00Archival �WPO,2003–2009 Lognormal(0,0.602) 1.00Archival M1 base-case Lognormal(−0.91,0.632) 0.40Archival M2 base-case Lognormal(−1.38,0.632) 0.25Archival M3 base-case Lognormal(−1.60,0.632) 0.20Archival M1
a Uniform(0.01,1.5) 0.75Archival M2
a Uniform(0.01,1.5) 0.75Archival M3
a Uniform(0.01,1.5) 0.75Archival p Dirichlet[] Posterior
mediansfrom PATmodel
Archival �EPO Beta(2,2) 0.50Archival �WPO Beta(2,2) 0.50
f2
ee
atp9aftpMLia
5
iptsdrW
TAt
Archival � Beta(1.25,19) 0.05
a Prior used in sensitivity analysis.
or M from ISC’s assessment model (Table 2) (Aires-da-Silva et al.,009).
Owing to concerns about the proximity of releases to fishingffort in some years, Fs were also estimated using a data set thatxcluded recaptures and releases that occurred in the same quarter.
Lognormal priors placed on Ms for the 3 age groups used in therchival tag model were moderately informative and were specifiedo be consistent with values used in the PBFT stock assessment—therior median for age group 1 (ages 2 and 3) was 0.40 yr−1 with a5% credibility interval of 0.12–1.38 yr−1. The prior placed on M forge group 2 (age 4) had a lower median (0.25 yr−1). This is the valueor M for age 4 PBFT that is currently used in ISC’s stock assessment;his prior had a 95% credibility interval of 0.07–0.86 yr−1. A lowerrior median of 0.20 yr−1 was used for the age 5+ (age group 3), since M can generally be assumed to decrease with size (e.g.
orenzen, 2000; Hampton, 2000). This prior had a 95% credibilitynterval of 0.06–0.69 yr−1. As a sensitivity analysis, the model waslso run with uniform priors for M for all 3 age groups (Table 1).
.3. Tag reporting rate
Separate reporting rates were estimated for fisheries operatingn the EPO and WPO. While it is generally not proper to developriors with knowledge of the data, the use of slightly informa-ive priors for archival tag reporting rates was felt to be justified
ince a very high proportion of tags have been recaptured for someeployment years (>70%) providing a minimum threshold for theeporting rate. Because we lacked independent information aboutPO and EPO reporting rates we chose to apply the same prior pdf
able 2lternative scenarios for age-specific rates of natural mortality (yr−1). Scenarios
aken from Aires-da-Silva et al. (2009).
M schedule Age 1 Age 2 Age 3 Age 4 Age 5+
2006 0.8 0.4 0.25 0.25 0.252008 base case 0.46 0.27 0.2 0.12 0.12Ishigaki 0.39 0.25 0.25 0.25 0.25
ch 119– 120 (2012) 115– 127 119
in both areas. A moderately informative beta prior with median0.50, 2.5th percentile 0.10 and 97.5th percentile of 0.90 was there-fore used for archival tag reporting rates in the EPO and WPO(Table 1).
5.4. Tagging-induced mortality
A fairly informative prior was placed on the probability of mor-tality resulting from archival tag implantation (� , Table 1). Thisprior had a median of 0.05, which was felt to be justified becauseof the high recapture rates and since observations in captive tanksutilizing similar procedures do not result in significant mortality.
5.5. Evaluations of the plausibility of alternative M schedules
For evaluations of alternative assumptions about the M-at-agevector, M was simply fixed to represent natural mortality rate sce-narios used in ISC sensitivity analyses (Aires-da-Silva et al., 2009).These are listed in Table 2. Since the Ishigaki WP04 and WG sce-narios are fairly similar, only the Ishigaki WG schedule was used inevaluations, hereafter referred to as “Ishigaki”.
The Deviance Information Criterion, DIC (Spiegelhalter et al.,2002) is a measure of model fit based on the trade-off betweenthe fit of the data to the model and the complexity of the model.DIC is defined analogously to AIC as:
DIC = D(�̄) + 2pD (2)
where D(�̄) is the deviance with the likelihood substituted with theprobability of the data given the posterior mean of the parametervalues �̄.
D(�̄) = −2 log(p(data|�̄)) (3)
and pD is an estimate of the effective number of parameters (ameasure of model complexity):
pD = E�|y[D] − D(E�|y[�]) = D̄ − D(�̄) (4)
i.e. the posterior mean deviance minus the deviance evaluated atthe posterior mean of the parameters. The model with the small-est DIC is estimated to best predict a replicate dataset of the samestructure as that observed. DIC differences of 5–10 indicate that onemodel is clearly better than another, while differences of more than10 are sufficient to remove the inferior model from consideration(Spiegelhalter et al., 2002; Bolker, 2008).
6. Population dynamics
For notational simplicity, subscripts for year, season and area ofrelease are omitted from the following equations. The subscriptsbelow refer to the year, season and area for the current quarter atlarge.
7. PAT tags
In the equations that follow, S denotes the number of seasons(4), while J denotes the number of areas (2) in the PAT tag model.The number of tagged fish in area k with tags programmed to pop-up after l quarters at large in year y and season s, in the first quarterat large (i.e. the quarter of release) is given by:
Nk,l,y,s = Rj,l,y,sps,j,k (5)
where Rj,l,y,s is the number of tagged fish released in area j in yeary and season s programmed to pop-up after l quarters at large andps,j,k is the probability of movement from area j to area k in seasons.
1 Resear
in
P
w
tgit
N
N
8
wTtaq
N
wiai
s
N
N
wsmAaFiva2em
s
N
y
C
wi
20 R.E. Whitlock et al. / Fisheries
The number of PAT tags that pop-up or were shed from a fishn year y, season s and area k, t quarters before the programmedumber of quarters at large l is given by:
k,l,y,s,t = Nk,l,y,s t (6)
here t is the probability that a PAT tag pops-up t quarters early.For quarters following the quarter of release, the number of PAT
agged fish at the end of season s in year y and area k with tags pro-rammed to pop-up after l quarters at large is given by the numbern the previous time step minus the number that released duringhe previous time step:
k,l,y,1 =∑J
j=1(Nj,l,y−1,S − Pj,l,y−1,S,t)ps,j,k s = 1 (7i)
k,l,y,s =∑J
j=1(Nj,l,y,s−1 − Pj,l,y,s−1,t)ps,j,k s > 1 (7ii)
. Archival tags
In the equations that follow, S denotes the number of seasons (4),hile J denotes the number of areas (3) in the archival tag model.
he archival tag model describes the survival, movement and cap-ure of archival tagged fish. The number of tagged fish of age a inrea k in year y and season s, in the first quarter at large (i.e. theuarter of release) is given by:
′a,y,s,k =
J∑j=1
Ra,y,s,j ps,j,k(1 − �) (8)
here Ra,y,s,j is the number of tagged fish of age a released in area jn year y and season s, and ps,j,k is the probability of movement fromrea j to area k in season s. � is the fraction of fish dying from injuriesnduced by tagging (applied only to newly tagged and released fish).
The number of tagged fish of age a surviving at the beginning ofeason s in year y and area k is given by:
a,y,s,k = N′a−1,y−1,S,ke
−(Mg(a−1)+Fg(a−1),S,h(k)�y−1,h(k))εg(a−1) S=1 (9i)
a,y,s,k = N′a,y,s−1,ke
−(Mg(a)+Fg(a),s−1,h(k)�y,h(k))εg(a) S>1 (9ii)
here Mg(a) is the rate of natural mortality for fish in age group g,caled to the quarterly time step, Fg(a),s,h(k) is the quarterly fishingortality rate for fish in age group g in season s and area group h.rea group 1 corresponds to the EPO areas (boxes 1 and 2), whilerea group 2 corresponds to the WPO (box 3). �y,h(k) is the annual
multiplier for year y and area group h and e−(Mg(a)+Fg(a),s−1,h(k)�y,h(k))
s the quarterly survival rate. εg(a) represents process error in sur-ival for age group g. A symmetrical uniform distribution centeredround 1 was used for the process error term (see Michielsens et al.,006 for details). This formulation allows scaling of the processrror variance according to the size of the time step and the totalortality rate Z.The number of tagged fish of age a in area k in year y and season
is given by:
′a,y,s,k =
J∑j=1
Na,y,s,jps,j,k (10)
The predicted number of recaptured tagged fish of age a in year, season s and area k, Ca,y,s,k is given by:
a,y,s,k = N′a,y,s,k
Fg(a),s,h(k)�y,h(k)
Mg(a)+Fg(a),s,h(k)�y,h(k)
× (1 − e−(Mg(a)+Fg(a),s,h(k)�y,h(k)))�h(k) (11)
here �h(k) is the average fraction of archival tags that are reportedn area group h.
ch 119– 120 (2012) 115– 127
The number of reported and recaptured tags in each quarter,area and age group was assumed to follow a negative binomialdistribution. A parameterization of the negative binomial probabil-ity density function for the number of recaptures given parametervector � in terms of the mean Ca,y,s,k and overdispersion parame-ter � was used (Hilborn and Mangel, 1997). WinBUGs code for thisparameterization was provided by Samu Mantyniemi, Universityof Helsinki.
p(Oa,y,s,k∣∣� ) = (� + Oa,y,s,k)
(�)Oa,y,s,k!
(�
� + Ca,y,s,k
)�(Ca,y,s,k
Ca,y,s,k + �
)Oa,y,s,k
(12)
where Oa,y,s,k is the observed number of reported recaptures for fishof age a in year y, season s and area k.
A multinomial likelihood was used for quarterly positions forrecaptured and reported archival tags, for quarters intermediatebetween release and recapture. In each time step the number ofrecaptured tags in each area was subtracted from the number oftags at large in that area. Movement between the three areas in eachtime step was assumed to be governed by the movement parame-ters ps,j,k. The likelihood for the number of tags on live fish in areas1–3 is therefore:
p(ta,s,1, ta,s,2, ta,s,3|a,s,1, a,s,2, a,s,3)
= Ta,s!ta,s,1!ta,s,2!ta,s,3!
ta,s,1a,s,1ta,s,2a,s,2
ta,s,3a,s,3 (13)
where ta,s,k is the observed number of tags on fish of age a in seasons and area k; Ta,s is the total number of tags on fish of age a in seasons, and a,s,k is the probability that a tagged fish of age a is in area kin season s.
Bayesian mark-recapture models were implemented usingWinBUGS (Bayesian inference using Gibbs sampling) software, ver-sion 1.4 (http://www.mrc-bsu.cam.ac.uk/bugs). To avoid basinginference on early draws from the Markov chain, which are stillinfluenced by the starting values and thus may not be representa-tive of the target posterior density function, the initial sequence ofdraws is usually discarded (referred to as “burn-in”). In this analysis,two chains were run, and convergence to the posterior distributionwas assessed by applying the Gelman–Rubin diagnostic (Gelmanand Rubin, 1992) and Monte Carlo error statistic (Spiegelhalteret al., 2003) leading the first 25,000 samples to be discarded. Statis-tics for model parameters were based on the first 10,000 samplesafter burn-in.
9. Results
This study examined the data set originating from deploymentof 523 tags between August 2002 and October 2009. Over 270archival tagged PBFT were recaptured during the study; recoveryrates of archival tagged fish were substantial, varying between 43and 75% by deployment year excluding the final year of the study(Table 3, final column). A summary of release and recapture num-bers by year is given in Table 3. The mean time at liberty for archivaltagged PBFT was 600 days; times at liberty decreased steadily overthe study period (Fig. 2). This decline in part reflects the fact thatlater tagged cohorts have not had so much time to be recaptured,although the high recapture rates (e.g. 2005, 2008, Table 3) indicatethat times at liberty have really decreased. Based on age-at-release(modal age 3 years) and time at liberty, ages at recovery varied
between 2 and 9 years, with approximately 37% of recaptures fallinginto age group 1 (ages 2 and 3), 45% in age group 2 (age 4), and 18%in age group 3 (ages 5 and above). The age frequencies of releasesand recaptures from the tagging experiment are shown in Fig. 3.
R.E. Whitlock et al. / Fisheries Research 119– 120 (2012) 115– 127 121
Table 3Summary of archival tag release and recapture numbers by year and area for Pacific bluefin tuna. The final column contains recovery percentages by deployment year.
Year Releases Recaptures % recoveries by release year
Box 1 Box 2 Box 3 Box 1 Box 2 Box 3
2002 35 53 0 1 3 0 522003 0 103 0 3 19 1 742004 8 0 0 6 64 2 752005 109 0 0 21 25 5 672006 67 0 0 9 29 1 19
0
5
0
1
trimTpp(
Etd(owab
1
wr
Ft
2007 23 0 0 12008 106 1 0 52009 18 0 11
0. PAT tags
PAT tags were deployed most often in the third quarter (aroundwo thirds). The estimated probabilities for a tag to pop-up andeport in a given quarter showed that tags had the highest probabil-ty of releasing during the programmed quarter (Fig. 4). Tags were
ore likely to pop-up before than after the programmed quarter.he probability of releasing and surfacing 2 or 3 quarters before therogrammed pop-up date was high (54%), while there was a lowrobability for tags to release after the programmed pop-up date8%) (Fig. 4).
Priors for seasonal movement rates between the north and southPO were updated by the PAT data, although the information inhe tagging data did not lead to large reductions in prior standardeviations for most seasonal-specific movement vectors. Residencyremaining in the same area) was prevalent for most combinationsf season and originating area (Table 4). Notable exceptions to thisere northward movement (from area 2 to 1) between the third
nd fourth quarters and southward movement (from area 1 to 2)etween the fourth and first quarters.
1. Archival tags
Priors for season-specific movement rates from the PAT modelere further updated by the archival tagging data. The following
esults are shown for the base case model with informative priors
ig. 3. Age frequencies of released (dark bars) and recaptured (light bars) archivalagged Pacific bluefin tuna.
3 2 435 1 632 3 3
for age group specific natural mortality rates Mg(a) and tag reportingrates (Table 1) unless otherwise stated.
Informative priors for age group specific Ms were updated bythe tagging data, particularly for ages 5+ (age group 3, Fig. 5a). Theestimated posterior median M for ages 2 and 3 (age group 1) wassubstantially higher than that for ages 5+ (0.40 yr−1 versus 0.15 yr−1
(Fig. 5a). The posterior median M for age group 2 was intermediatebetween these values (0.19 yr−1). When an uninformative uniformprior was used (median 0.75 yr−1), the posterior for ages 2 and 3was fairly diffuse (median 0.72 yr−1); however, posteriors for age4 (age group 2) and ages 5+ (age group 3) showed more updating(medians of 0.43 yr−1 and 0.13 yr−1, respectively) (Fig. 5b).
Priors for archival tag reporting rates were also updated, partic-ularly that for the EPO (Fig. 6), to yield posterior pdfs with means of0.74 (EPO) (standard deviation of 0.10) and 0.62 (WPO) (standarddeviation of 0.17).
The prior for the fraction of tagging-induced mortalities wasupdated slightly by the archival tag data to a more precise betadistribution with a mean and standard deviation of 0.04, relative tothe prior mean of 0.06 and standard deviation of 0.05.
Estimates of within-year quarterly Fs revealed a strong seasonalpattern to the EPO fishery, with much higher rates of recaptureoccurring in the second quarter, and to a lesser extent the thirdquarter, relative to the first and fourth quarters (Fig. 7a). Maxi-mal within-year quarterly F values for each age group occurred in
the second quarter, with the exception of age group 1 and area 2,for which the maximum F occurred in the third quarter (Fig. 7a).Total quarterly Fs for the EPO (the product of the estimated within-year fishing mortality rate and F multiplier) ranged between 0.02Fig. 4. Median and 95% probability intervals for the probability that a pop-up satel-lite archival tag surfaces and reports × quarters earlier than its programmed pop-update.

122 R.E. Whitlock et al. / Fisheries Research 119– 120 (2012) 115– 127
Table 4Prior and posterior means and standard deviations for season-specific movements rates for Pacific bluefin tuna in the PAT and archival tag models. Modal movement ratesoriginating in a given area and season are bolded.
Quarter Originatingarea
Destinationarea
PSAT priormean
PSAT priorSD
PSATposteriormean
PSATposteriorSD
Archival posteriormean (start andendpoints only)
Archival posteriorSD (start andendpoints only)
Archivalposteriormean
ArchivalposteriorSD
1 1 1 0.50 0.29 0.35 0.24 0.11 0.11 0.35 0.041 1 2 0.50 0.29 0.65 0.24 0.87 0.12 0.63 0.051 1 3 – – – – 0.02 0.03 0.01 0.01
1 2 1 0.50 0.29 0.32 0.24 0.24 0.26 0.23 0.121 2 2 0.50 0.29 0.68 0.24 0.57 0.33 0.75 0.121 2 3 – – – – 0.19 0.24 0.02 0.03
2 1 1 0.50 0.29 0.52 0.28 0.95 0.05 0.58 0.042 1 2 0.50 0.29 0.48 0.28 0.02 0.04 0.36 0.042 1 3 – – – – 0.02 0.03 0.07 0.03
2 2 1 0.50 0.29 0.53 0.23 0.15 0.10 0.07 0.042 2 2 0.50 0.29 0.47 0.23 0.84 0.10 0.91 0.042 2 3 – – – – 0.01 0.02 0.02 0.02
3 1 1 0.50 0.29 0.60 0.20 0.89 0.11 0.91 0.083 1 2 0.50 0.29 0.40 0.20 0.08 0.10 0.08 0.073 1 3 – – – – 0.03 0.04 0.01 0.02
3 2 1 0.50 0.29 0.50 0.22 0.61 0.16 0.90 0.033 2 2 0.50 0.29 0.50 0.22 0.36 0.16 0.10 0.033 2 3 – – – – 0.03 0.03 0.00 0.01
4 1 1 0.50 0.29 0.49 0.13 0.77 0.25 0.75 0.044 1 2 0.50 0.29 0.51 0.13 0.19 0.25 0.24 0.044 1 3 – – – – 0.03 0.04 0.00 0.01
0.25 0.61 0.32 0.69 0.080.25 0.30 0.30 0.30 0.08– 0.10 0.13 0.01 0.02
ai2tvf
Wium(wtaqti
0.000
0.005
0.010
0.015
0.020
1.000.800.600.400.200.00
Pro
babi
lity
dens
ity
Reporting rate, λ
Fsls
4 2 1 0.50 0.29 0.64
4 2 2 0.50 0.29 0.36
4 2 3 – – –
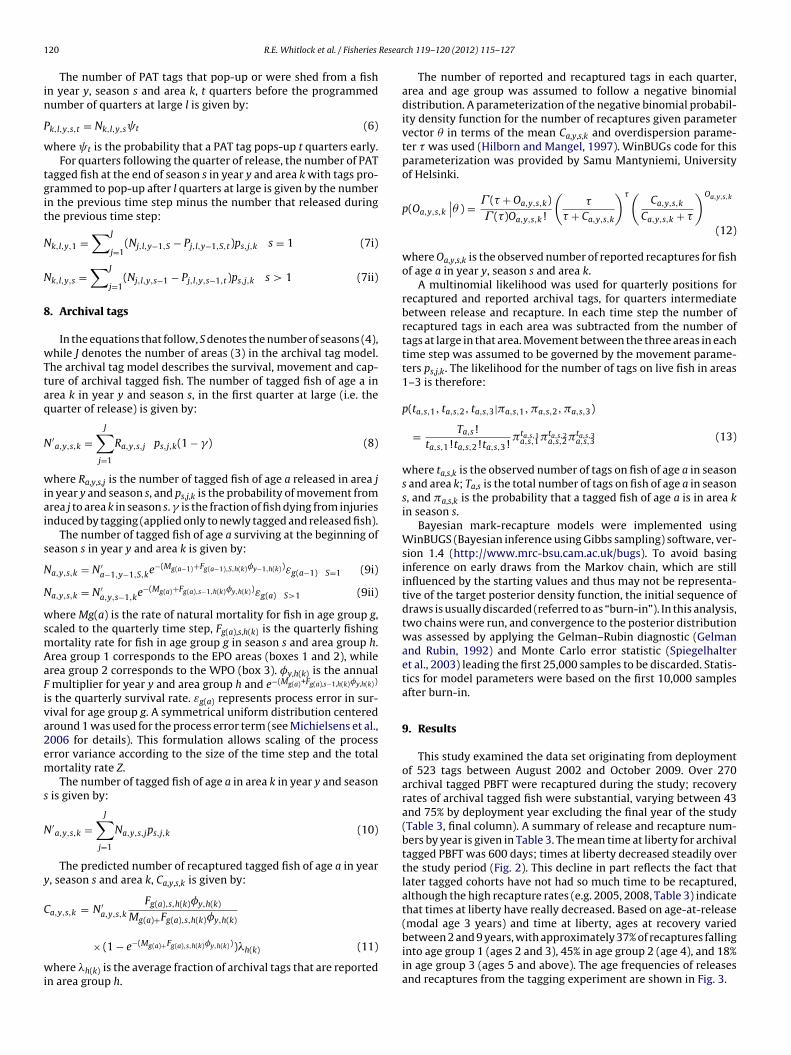
nd 1.92. Estimated F multipliers for the EPO showed an increas-ng trend between 2003 and 2006, followed by a decrease up to009; EPO F multipliers in 2005 and 2006 were significantly higherhan that in 2003 (based on non-overlapping 95% probability inter-als) (Fig. 8). 95% posterior probability intervals were fairly wideor some years (e.g. 2006 and 2008, Fig. 8).
Around 6% of all recaptured archival tags were recovered in thePO. The archival tag data were much less informative about Fs
n the WPO, with wide posterior probability intervals and littlepdating of priors for Fs and F multipliers (Figs. 7b and 8). Esti-ated quarterly Fs for the WPO ranged between 0.18 and 0.53
Fig. 7b). The annual pattern in WPO F multipliers was fairly flat,ith a modest (non-significant) increase in 2005 and 2006. Pos-
erior correlations between F and M were low, with a maximum
bsolute pairwise correlation of 0.05. Median annual total Fs (totaluarterly Fs (the product of the estimated within-year F and F mul-iplier) summed over the year) are shown in Fig. 9. These reflect thenterannual patterns of estimated F multipliers. Annual Fs rangedFig. 6. Prior (dotted grey line) and posterior probability density functions forarchival tag reporting rates in the EPO (solid black line) and WPO (dashed blackline).
0.000
0.005
0.010
0.015
0.020
0.025
1.21.00.80.60.40.20.0
Pro
babi
lity
dens
ity
M yr-1
0.00
0.01
0.02
0.03
0.04
0.05
1.51.00.50.0
Pro
babi
lity
dens
ity
M yr-1
a b
ig. 5. (a) Prior and posterior probability density functions (pdfs) for natural mortality rates for three age groups. Age group 1 (ages 2 and 3), dotted light grey line (prior),olid light grey line (posterior); age group 2 (age 4), dotted black line (prior) and solid black line (posterior); age group 3 (ages 5+), dashed grey line (prior) and dashed blackine (posterior). (b) Posterior probability density functions (pdfs) for natural mortality rates for three age groups estimated using a uniform prior. Age group 1 (ages 2 and 3),olid grey line; age group 2 (age 4), solid black line; age group 3 (ages 5+), dashed black line. The dotted black line denotes the uniform prior pdf.

R.E. Whitlock et al. / Fisheries Research 119– 120 (2012) 115– 127 123
Fig. 7. (a) Quarterly fishing mortality rates in the EPO. Solid black line, 2002; dashed black line, 2003, dot-dash black line, 2004; dotted black line, 2005; solid grey line, 2006;d ostert dotte2 04).
bW
rtm
ashed grey line, 2007; dot-dash grey line, 2008; dotted grey line, 2009 (the 95% phe WPO. Solid black line, 2002; dashed black line, 2003, dot-dash black line, 2004;008; dotted grey line, 2009 (the 95% posterior probability interval is shown for 20
etween approximately 0.5 and 3 in the EPO and 0.75–1.5 in thePO, Figs. 7–9.
Total quarterly Fs estimated from a model in which releases andecaptures occurring in the same quarter were excluded revealedhat most quarterly F estimates were unaffected. All of the esti-
ated quarterly Fs except for seven differed by less than 10%
ior probability interval is shown for 2004). (b) Quarterly fishing mortality rates ind black line, 2005; solid grey line, 2006; dashed grey line, 2007; dot-dash grey line,
from the estimate corresponding to the complete data set. Of theseseven, where estimated Fs differed by 10% or more, four occurred
in quarter 3 and three occurred in quarter 2. However, therewere no significant differences in quarterly F estimates from thetwo models, based on non-overlapping 95% posterior probabilityintervals.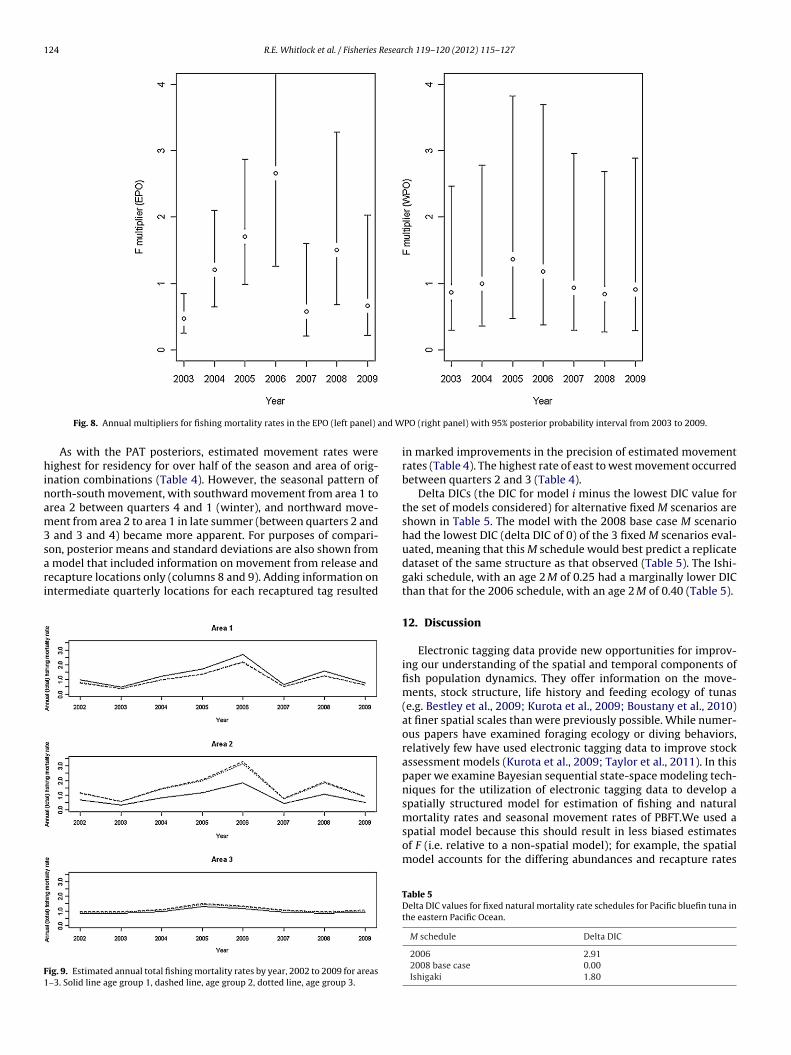
124 R.E. Whitlock et al. / Fisheries Research 119– 120 (2012) 115– 127
nd W
hinam3sari
F1
Fig. 8. Annual multipliers for fishing mortality rates in the EPO (left panel) a
As with the PAT posteriors, estimated movement rates wereighest for residency for over half of the season and area of orig-
nation combinations (Table 4). However, the seasonal pattern oforth-south movement, with southward movement from area 1 torea 2 between quarters 4 and 1 (winter), and northward move-ent from area 2 to area 1 in late summer (between quarters 2 and
and 3 and 4) became more apparent. For purposes of compari-
on, posterior means and standard deviations are also shown frommodel that included information on movement from release andecapture locations only (columns 8 and 9). Adding information onntermediate quarterly locations for each recaptured tag resulted
ig. 9. Estimated annual total fishing mortality rates by year, 2002 to 2009 for areas–3. Solid line age group 1, dashed line, age group 2, dotted line, age group 3.
PO (right panel) with 95% posterior probability interval from 2003 to 2009.
in marked improvements in the precision of estimated movementrates (Table 4). The highest rate of east to west movement occurredbetween quarters 2 and 3 (Table 4).
Delta DICs (the DIC for model i minus the lowest DIC value forthe set of models considered) for alternative fixed M scenarios areshown in Table 5. The model with the 2008 base case M scenariohad the lowest DIC (delta DIC of 0) of the 3 fixed M scenarios eval-uated, meaning that this M schedule would best predict a replicatedataset of the same structure as that observed (Table 5). The Ishi-gaki schedule, with an age 2 M of 0.25 had a marginally lower DICthan that for the 2006 schedule, with an age 2 M of 0.40 (Table 5).
12. Discussion
Electronic tagging data provide new opportunities for improv-ing our understanding of the spatial and temporal components offish population dynamics. They offer information on the move-ments, stock structure, life history and feeding ecology of tunas(e.g. Bestley et al., 2009; Kurota et al., 2009; Boustany et al., 2010)at finer spatial scales than were previously possible. While numer-ous papers have examined foraging ecology or diving behaviors,relatively few have used electronic tagging data to improve stockassessment models (Kurota et al., 2009; Taylor et al., 2011). In thispaper we examine Bayesian sequential state-space modeling tech-niques for the utilization of electronic tagging data to develop aspatially structured model for estimation of fishing and natural
mortality rates and seasonal movement rates of PBFT.We used aspatial model because this should result in less biased estimatesof F (i.e. relative to a non-spatial model); for example, the spatialmodel accounts for the differing abundances and recapture ratesTable 5Delta DIC values for fixed natural mortality rate schedules for Pacific bluefin tuna inthe eastern Pacific Ocean.
M schedule Delta DIC
2006 2.912008 base case 0.00Ishigaki 1.80

Resear
oems2islisoa
cKupsta2esuwtttecmsbcts
1vMfarw
tepapilmrstttg3otowlt
R.E. Whitlock et al. / Fisheries
f tagged PBFT in different quarters and areas which will affectstimates of F. A growing number of stock assessments of highlyigratory species like other species of bluefin tunas make use of
patially structured models (e.g. Kurota et al., 2009; Taylor et al.,011). This may be appropriate for a number of reasons includ-
ng accounting for differential habitat use by different life-historytages, or populations, and understanding implications of habitatoss or modification as well as describing the spatial reach of fish-ng fleets and governance structures (national boundaries). Use ofpatially structured models may also be desirable for evaluationf spatial management options (e.g. seasonal closure of spawningreas).
The seasonal movement patterns estimated in this analysis wereonsistent with patterns of movement described elsewhere (e.g.itagawa et al., 2007; Boustany et al., 2010). The spatial box modeltilized here captured the movements of PBFT that were taggedrimarily in the third quarter off the coast of Baja Mexico and sub-equently moved northward. The northward movement is thoughto be associated with increasing surface water temperatures and
decrease in upwelling and associated production (Block et al.,011). PBFT achieve their most northerly locations along the west-rn coast of North America late in the fourth quarter and moveouthward or offshore in winter months (first quarter). Sequentialpdating of the prior distributions for seasonal movement ratesas evident from the progressive reduction in the standard devia-
ions from the PAT prior through the PAT posterior to the archivalag data posterior (Table 4). The movement rates estimated withhe archival tag data demonstrate one of the key advantages oflectronic tag data over conventional tag data, namely that if geolo-ation is feasible, a data set that is much more informative aboutovement rates can be generated, resulting in improved preci-
ion of movement rate estimates. In addition, locations obtainedy geolocation are independent of fisheries and should thereforeonstitute a less biased source of information about the spatial dis-ribution of fish populations than recapture locations, which will toome extent be affected by the spatial distribution of fishing effort.
Rates of annual fishing mortality for PBFT of ages 2–3 (age group) estimated using archival tagging data were consistent with pre-iously reported estimates from a scenario that assumed the 2008
schedule, but were otherwise somewhat higher than estimatesrom other analyses (e.g. Aires-da-Silva et al., 2009). Estimatednnual Fs for age 4 PBFT were considerably higher than estimateseported elsewhere, even relative to previous estimates obtainedith the 2008 M schedule (around 0.4, Aires-da-Silva et al., 2009).
Mark-recapture data can be valuable for estimation of M whenag recovery rates are high and reporting rates are known orstimable which is the case for PBFT in the WPO. We have thusresented the first empirical estimates of M for PBFT aged 2 andbove. Although the experiment in which the data analyzed in thisaper were collected was not designed for the purpose of estimat-
ng Ms, the high tag recovery rate combined with long times atarge achieved, particularly in the early years of the experiment
ake these data informative with respect to M. The relatively higheporting rate estimates in this study probably reflect the fact that aignificant financial reward ($500) was offered for return of archivalags, resulting in an exceptionally high tag return rate. The archivalagging data analyzed in this study appeared to be fairly informa-ive with respect to the Ms for PBFT of age 4 and ages 5+ (agesroups 2 and 3), but less so about the M for PBFT of ages 2 and
(age group 1). This probably results from the higher proportionf tags recaptured by age for older ages at release, meaning thathere is more information available about M from the distribution
f times at large for older fish. Using an uninformative prior on Mith a median of 0.75 yr−1 still yielded a posterior with a relativelyow median of 0.13 yr−1 for PBFT aged 5+ (age group 3); conversely,he posterior median estimate of M for ages 2 and 3 (age group 1)
ch 119– 120 (2012) 115– 127 125
showed little updating with a posterior median (0.72 yr−1), close tothe prior median.
Posterior median estimates of M for ages 4 and above werelower than values used in recent stock assessments (e.g. ISC, 2009),although the median for age group 3 (ages 5+) was comparableto M in the 2008 assessment (0.12 yr−1 for ages 4+). The posteriormedian for ages 2 and 3 (age group 1) using an informative priorwas comparable to age 1 M values assumed in ISC’s scenarios. Therewere posterior probabilities of 60% and 76% that Ms for age groups2 (age 4) and 3 (ages 5+) were less than 0.25 yr−1, the value cur-rently used in the PBFT stock assessment for ages 4 and above. Thecorresponding percentages for the uniform M priors were 41% (agegroup 2) and 82% (age group 3). It should be noted that the possibil-ity of there being different reporting rates of recovered tags in theWPO than in the EPO and having relatively little data with whichto accurately estimate the WPO reporting rate could cause bias inestimates of M since the posterior for the WPO reporting rate wouldbe more strongly influenced by its prior. However, mark-recapturemodels that assumed lower fixed values for age 4+ M were alsofound to be more consistent with the tagging data (Table 5).
Estimates of M provide potential information on Fs in the EPO.F and M are typically negatively correlated, since a higher (lower)number of recaptures could be explained by a higher (lower) F orlower (higher) M. Interestingly, very low absolute values for thecorrelation between F and M were obtained in this study. This isin part due to the ability to estimate the EPO reporting rate rea-sonably precisely with these data (posterior CV of 0.14). The tagreporting rate is key in partitioning mortality into its fishing andnatural components in a mark-recapture context. The updating ofthe informative prior for the archival tag reporting rate indicatesthat there was information about this parameter in the tagging data.This is likely to result from the high recovery rates achieved in thePBFT tagging program (Table 3).
Although assuming a lower value of M for older fish (age4+ M = 0.12 yr−1) in the PBFT stock assessment resulted in esti-mates of unfished spawning stock biomass and depletion estimatesthat were considered implausible (Aires-da-Silva et al., 2009), thisapparent inconsistency may arise from other features of the assess-ment that will tend to give low SSB and correspondingly higherdepletion estimates. For example, all else being equal, condition-ing on an estimate of current abundance or biomass, assuming agreater level of density-dependent compensation in recruitmentwill lead to a lower estimate of historic abundance/biomass (e.g.Walters et al., 2006). The PBFT stock assessment used by the ISCassumes a steepness of 1 implying that recruitment is independentof spawning stock size and on average constant down to the verysmallest spawning stock levels. This assumption and the currentapplication of higher values for M, if incorrect could cause a down-wards bias in estimates of unfished stock biomass and upwardsbias in depletion estimates making the population appear to beless depleted and more resilient to exploitation than it actually is.
There are several ways in which this analysis could be extendedand improved upon. Future models could incorporate quarterlyfishing effort or catch data (as a proxy for effort), which wouldimprove fishing mortality estimates. Additionally, conventionaltagging data could be added to the model in order to gain moreinformation about, e.g. age specific, rates of movement and naturaland fishing mortality. More data are needed on rates of movementfrom the WPO and EPO and vice versa; collaborative analysis ofpooled tagging data sets from both sides of the Pacific Ocean in thefuture would help to achieve this.
In the light of the results from this study, it may be instruc-tive to look further into estimating age-specific Ms using electronic
tagging data. Using empirical estimates of age-specific Ms wouldhelp to reduce potential bias in stock reconstructions from the PBFTstock assessment, while accounting for the uncertainty associated
1 Resear
wamfitt
A
owMRiTtdc
R
A
A
A
B
B
B
B
B
B
B
B
B
B
C
C
G
G
H
26 R.E. Whitlock et al. / Fisheries
ith estimates of M would be more consistent with a precautionarypproach. Moreover, integrating tagging data into the stock assess-ent model for PBFT should improve the accuracy of estimated
shing mortality rates and abundance. This would be desirable inhe context of effective regulation of fishing effort for Pacific bluefinuna fisheries.
cknowledgements
The tagging portion of this study was funded by the Taggingf Pacific Pelagics program (TOPP). Electronic tagging and recoveryas supported by funds from the Sloan and Moore Foundations. Theonterey Bay Aquarium Foundation along with the Office of Naval
esearch (ONR) supported electronic tagging and shipboard activ-ties. We thank K. Schaefer and D. Fuller and the Inter-Americanropical Tuna Commission for assisting in the return of electronicags. R. Whitlock was funded by ONR and the Tag-A-Giant Foun-ation. We are grateful to the two anonymous reviewers whoseomments greatly improved our manuscript.
eferences
ires-da-Silva, A., Hinton, M.G., Dreyfus, M., 2007. Standardized catch rates forPacific bluefin tuna caught by United States- and Mexican-flag fisheries in theEastern Pacific Ocean (1960–2006). International Scientific Committee for tunaand tuna-like species in the North Pacific Ocean (ISC) working group paper.ISC/07/PBF-3/01.
ires-da-Silva, A., Maunder, M., Deriso, R., Piner, K., Lee, H., 2009. A sensitivity anal-ysis of alternative natural mortality assumptions in the PBF stock assessment.International Scientific Committee for tuna and tuna-like species in the NorthPacific Ocean (ISC) working group paper. ISC/09/PBF-1/1.
non., 2008. Report of the Pacific Bluefin Tuna Working Group Workshop (Annex 7).International Scientific Committee for Tuna and Tuna-like Species in the NorthPacific Ocean. 67 p.
acheler, N.M., Buckel, J.A., Hightower, J.E., Paramore, L.M., Pollock, K.H., 2009. Acombined telemetry—tag return approach to estimate fishing and natural mor-tality rates of an estuarine fish. Can. J. Fish. Aquat. Sci. 66, 1230–1244.
ayliff, W.H., 1994. A review of the biology and fisheries for northern bluefin tuna,Thunnus thynnus in the Pacific Ocean. In: Interactions of Pacific tuna fisheries.Volume 2. Papers on Biology and Fisheries. FAO Fish. Tech. Pap. 336/2.
ayliff, W.H., 2001. Status of bluefin tuna in the Pacific Ocean. IATTC Stock Assess-ment Report 1.
eamesderfer, R.C.P., North, J.A., 1995. Growth, natural mortality, and predictedresponse to fishing for largemouth bass and smallmouth bass populations inNorth America. N. Am. J. Fish. Manage. 5, 688–704.
eddington, J.R., Cooke, J.G., 1983. On the potential yield of fish stocks. FAO Fish.Tech. Pap., 242.
estley, S., Patterson, T.A., Hindell, M.A., Gunn, J.S., 2009. Predicting feeding suc-cess in a migratory predator: integrating telemetry, environment, and modelingtechniques. Ecology 91, 2373–2384.
lock, B.A., Jonsen, I.D., Jorgensen, S.J., Winship, A.J., Shaffer, S.A., Bograd, S.J., Hazen,E.L., Foley, D.G., Breed, G.A., Harrison, A.-L., Ganong, J.E., Swithenbank, A., Castle-ton, M., Dewar, H., Mate, B.R., Shillinger, G.L., Schaefer, K.M., Benson, S.R., Weise,M.J., Henry, R.W., Costa, D.P., 2011. Tracking apex marine predator movementsin a dynamic ocean. Nature 475, 86–90.
lock, B.A., Teo, S.L.H., Walli, A., Boustany, A., Stokesbury, M.J.W., Farwell, C.J., Weng,K.C., Dewar, H., Williams, T.D., 2005. Electronic tagging and population structureof Atlantic bluefin tuna. Nature 434, 1121–1127.
olker, B.M., 2008. Ecological Models and Data in R. Princeton University Press,Princeton, New Jersey.
oustany, A.M., Matteson, R., Castleton, M., Farwell, C., Block, B.A., 2010. Movementsof pacific bluefin tuna (Thunnus orientalis) in the Eastern North Pacific revealedwith archival tags. Prog. Oceanogr. 86, 94–104.
hen, K.S., Crone, P., Hsu, C.C., 2006. Reproductive biology of female Pacific bluefintuna Thunnus orientalis from the south-western North Pacific Ocean. Fish. Sci.72, 985–994.
ollette, B.B., Nauen, C.E., 1983. FAO Species Catalogue. Vol. 2. Scombrids of theworld. An annotated and illustrated catalogue of tunas, mackerels, bonitos andrelated species known to date. FAO Fish. Synopsis 125 (2.), 137p.
elman, A., Rubin, D.R., 1992. A single series from the Gibbs sampler provides a falsesense of security. In: Bernardo, J.M., et al. (Eds.), Bayesian Statistics 4. OxfordUniversity Press, Oxford, pp. 625–631.
oethel, D.R., Quinn II, T.J., Cadrin, S.X., 2011. Incorporating spatial structure in stockassessment: movement modeling in marine fish population dynamics. Rev. Fish.
Sci. 19, 119–136.aist, V., 1998. Integrated catch-age mark-recapture model: application to B.C.sablefish stocks, in Fishery Stock Assessment Models. In: Funk, F., Quin II,T.J., Heifetz, J., Ianelli, J.N., Powers, J.E., Schweigert, J.J., Sullivan, P.J., Zhang,C.I. (Eds.), Proceedings of the International Symposium on Fishery Stock
ch 119– 120 (2012) 115– 127
Assessment Models for the 21st Century. Alaska Sea Grant College ProgramReport No. AK-SG-98-01, University of Alaska Fairbanks, pp. 679–692.
Hampton, J., 2000. Natural mortality rates ion tropical tunas: size really does matter.Can. J. Fish. Aquat. Sci. 57, 1002–1010.
Hampton, J., Fournier, D.A., 2001. A spatially-disaggregated, length-based, age-structured population model of yellowfin tuna (Thunnus albacares) in theWestern and Central Pacific Ocean. Mar. Freshwater Res. 52, 937–963.
Hightower, J.E., Jackson, J.R., Pollock, K.H., 2001. Use of telemetry methods to esti-mate natural and fishing mortality of striped bass in Lake Gaston, North Carolina.Trans. Am. Fish. Soc. 130 (4), 557–567.
Hilborn, R., Mangel, M., 1997. The Ecological Detective: Confronting Models WithData. Princeton University Press, Princeton, New Jersey, USA.
Hilborn, R., Walters, C.J., 1992. Quantitative Fisheries Stock Assessment: Choice,Dynamics, and Uncertainty. Chapman and Hall, New York.
Inter-American Tropical Tuna Commission, 2005. Tunas and billfishes in the EasternPacific Ocean in 2004. Fishery Status Report No. 3. La Jolla, California.
International Scientific Committee for Tuna and Tuna-like Species in the NorthPacific Ocean, 2008. Report of the Pacific Bluefin Tuna Working Group Workshop,May 28–June 4, 2008. Shimizu, Japan.
International Scientific Committee for Tuna and Tuna-like Species in the NorthPacific Ocean, 2009. Report of the ninth meeting of the International ScientificCommittee for Tuna and Tuna-like Species in the North Pacific Ocean. Kaohsiung,Taiwan.
Itoh, T., Tsuji, S., Nitta, A., 2003a. Migration patterns of young Pacific bluefin tuna(Thunnus orientalis) determined with archival tags. Fish. Bull. 101, 514–534.
Itoh, T., Tsuji, S., Nitta, A., 2003b. Swimming depth, ambient water temperature pref-erence, and feeding frequency of young Pacific bluefin tuna (Thunnus orientalis)determined with archival tags. Fish. Bull. 101, 535–544.
Jonsen, I.D., Flemming, J.M., Myers, R.A., 2005. Robust state-space modeling of animalmovement data. Ecology 86, 2874–2880.
Kitagawa, T., Nakata, H., Kimura, S., Itoh, T., Tsuji, S., Nitta, A., 2000. Effect of ambienttemperature on the vertical distribution and movement of Pacific bluefin tunaThunnus thynnus orientalis. Mar. Ecol. Prog. Ser. 206, 251–260.
Kitagawa, T., Kimura, S., Nakata, H., Yamada, H., 2006. Thermal adaptation of Pacificbluefin tuna Thunnus orientalis to temperate waters. Fish. Sci. 72, 149–156.
Kitagawa, T., Boustany, A.M., Farwell, C., Williams, T.D., Castleton, M., Block, B.A.,2007. Horizontal and vertical movements of juvenile Pacific bluefin tuna(Thunnus orientalis) in relation to seasons and oceanographic conditions. Fish.Oceanogr. 16, 409–421.
Kitagawa, T., Kimura, S., Nakata, H., Yamada, H., Nitta, A., Sasai, Y., Sasaki, H., 2009.Immature Pacific bluefin tuna, Thunnus orientalis, utilizes cold waters in theSubarctic Frontal Zone for trans-Pacific migration. Environ. Biol. Fish. 84, 193–196.
Kurota, H., McAllister, M.K., Lawson, G.L., Nogueira, J.I., Teo, S.L.H., Block, B.A., 2009. Asequential Bayesian methodology to estimate movement and exploitation ratesusing electronic and conventional tag data: application to Atlantic bluefin tuna(Thunnus thynnus). Can. J. Fish. Aquat. Sci. 60, 321–342.
Lapointe, M.F., Peterman, R.M., MacCall, A.D., 1989. Trends in fishing mortality ratealong with errors in natural mortality can cause spurious time trends in fishstock abundances estimated by Virtual Population Analysis (VPA). Can. J. Fish.Aquat. Sci. 46, 2129–2139.
Lorenzen, K., 2000. Allometry of natural mortality as a basis for estimating opti-mal release size in fish stocking programmes. Can. J. Fish. Aquat. Sci. 57, 2374–2381.
Marcinek, D.J., Blackwell, S.B., Dewar, H., Freund, E.V., Farwell, C., Dau, D., Seitz,A.C., Block, B.A., 2001. Depth and muscle temperature of Pacific bluefin tunaexamined with acoustic and pop-up satellite tags. Mar. Biol. 138, 869–885.
Michielsens, C.G., McAllister, M.K., Kuikki, S., Pakarinen, T., Karlsson, L.,Romakkaniemi, A., Pera, I., Mäntyniemi, S., 2006. A Bayesian state-space mark-recapture model to estimate exploitation rates in mixed stock fisheries. Can. J.Fish. Aquat. Sci. 63, 321–334.
Michielsens, C.G.J., McAllister, M.K., Kuikka, S., Mäntyniemi, S., Romakkaniemi, A.,Pakarinen, T., Karlsson, L., Uusitalo, L., 2008. Combining multiple Bayesian dataanalyses in a sequential framework for quantitative fisheries stock assessment.Can. J. Fish. Aquat. Sci. 65, 962–974.
Okiyama, M., 1974. Occurrence of the postlarvae of bluefin tuna, Thunnus thynnus(Linnaeus) in the Japan Sea. Bull. Jpn. Sea Reg. Fish. Res. Lab. 25, 89–97.
Polacheck, T., Hearn, W.S., Miller C., Whitelaw, W., Stanley, C., 1997. Updated esti-mates of mortality rates for juvenile SBT from multi-year tagging of cohorts.CCSBT-SC/9707/26.
Pollock, K.H., Hoenig, J.M., Jones, C.M., 1991. Estimation of fishing and natural mor-tality when a tagging study is combined with a creel survey or port sampling.Monogr.—Am. Fish. Soc. 12, 423–434.
Pollock, K.H., Hoenig, J.M., Hearn, W.S., Calingaert, B., 2001. Tag reporting rate esti-mation. 1. An evaluation of the high reward tagging method. N. Am. J. Fish.Manage. 21 (3), 521–532.
Pollock, K.H., Jiang, H., Hightower, J.E., 2004. Combining telemetry and fisheries tag-ging models to estimate fishing and natural mortality rates. Trans. Am. Fish. Soc.133 (3), 639–648.
Quinn, T.J.I.I., Deriso, R.B., 1999. Quantitative Fish Dynamics. Oxford University Press,Oxford, UK.
Ricker, W.E., 1975. Computation and interpretation of biological statistics of fishpopulations. Fish. Res. Board Can. Bull., 191.
Shimose, T., Tanabe, T., Chen, K., Hsu, C., 2009. Age determination and growth ofPacific bluefin tuna, Thunnus orientalis, off Japan and Taiwan. Fish. Res. 100,134–139.

Resear
S
S
T
T
T
R.E. Whitlock et al. / Fisheries
piegelhalter, D.J., Best, N.G., Carlin, B.P., van der Linde, A., 2002. Bayesianmeasures of model complexity and fit. J. Roy. Stat. Soc. B 64, 583–639.
piegelhalter, D., Thomas, A., Best, N., Lunn, D., 2003. WinBUGS User Manual. Version1.4, January 2003.
akeuchi, Y., Takahashi, M., 2006. Estimate of natural mortality of age 0 Pacificbluefin tuna from conventional tagging data. ISC/06/PBF-WG/07.
anaka, Y., Mohri, M., Yamada, H., 2007. Distribution, growth, and hatch date of
juvenile Pacific bluefin tuna, Thunnus orientalis in the coastal area of the Sea ofJapan. Fish. Sci. 73, 534–542.aylor, N.G., McAllister, M.K., Lawson, G.L., Carruthers, T., Block, B.A., 2011. Atlanticbluefin tuna: a novel multi-stock spatial model for assessing population biomass.PLoS One 6 (12), 1–10.
ch 119– 120 (2012) 115– 127 127
Teo, S.L.H., Boustany, A., Blackwell, S., Walli, A., Weng, K.C., Block, B.A., 2004. Valida-tion of geolocation estimates based on light level and sea surface temperaturefrom electronic tags. Mar. Ecol. Prog. Ser. 283, 81–98.
Vetter, E.F., 1988. Estimation of natural mortality in fish stocks: a review. Fish. Bull.86, 25–43.
Wade, P.R., 2000. Bayesian Methods in Conservation Biology. Cons. Biol. 14,1308–1316.
Walters, C.J., Martell, S., 2004. Fisheries Ecology and Management. Princeton Uni-
versity Press, Princeton, New Jersey.Walters, C.J., Martell, S.J.D., Korman, J., 2006. A stochastic approach to stock reductionanalysis. Can. J. Fish. Aquat. Sci. 63, 212–223.
Waters, D.S., Noble, R.L., Hightower, J.E., 2005. Fishing and natural mortality of adultlargemouth bass in a tropical reservoir. Trans. Am. Fish. Soc. 134 (3), 563–571.