estimating needed capacity of nursing home and...
TRANSCRIPT

Estimating Needed Capacity of Nursing Home and Hospital Beds:
Is the Eugene-Springfield MSA at Capacity?
By Megan Stratman
and Matthew Spellman
Presented to the Department of Economics, University of Oregon, in partial fulfillment of requirements for honors in Economics.
under the supervision of
Professor Bruce Blonigen
June 2006

Estimating Needed Capacity of Nursing Home and Hospital Beds:
Is the Eugene-Springfield MSA at Capacity?
Abstract: We analyzed the impact of demographic, socioeconomic and Certificate of Need
(CON) regulation variables on the supply of nursing home and hospital beds across the nation
and specifically in the Eugene-Springfield area. Our results indicate that CON regulation restrict
the supply of nursing home beds and do not adversely affect the supply of hospital beds. We
found that Eugene-Springfield currently has an insufficient supply of nursing home and hospital
beds.
Keywords: Certificate of Need; nursing home beds; hospitals beds
Approved: __________________________________________________
Professor Bruce Blonigen Date

Table of Contents
1. Introduction
1
2. Literature Review
3
3. Methodology and Hypotheses
11
4. Data Collection
15
5. Regression Analysis
17
6. Applying Regressions
22
7. Alternative Specifications
26
8. Conclusion
29
9. References
30
Appendix A.
33

1. Introduction
As the U.S. population is projected to grow by 48% from 2000 to 2050, it is imperative
that the supply of health care maintains pace with the increased demand. Nursing homes and
hospitals are two primary means of health care that will be impacted by this growth.
Maintaining an adequate supply of beds for both is particularly important due to the rapidly
growing elderly population. In 2003, 12.4% of the American population was sixty-five years
and older; this number is projected to increase to 20.7% by 2050. 1 The elderly portion of
America is increasing both relative to other age segments and in longevity; in 2003, the average
expected additional lifespan of a person sixty-five years old is 18.5 years.2 The combination of a
growing general and elderly population, and increased longevity of the elderly will increase
demand for nursing home and hospital beds. Therefore, it is essential to estimate the needed
supply of nursing home and hospital beds in a given locale.
The current hospital situation in the Eugene-Springfield area highlights the necessity of
estimating the needed capacity of beds. The two hospitals that serve the Eugene-Springfield area
are Sacred Heart and McKenzie-Willamette. Sacred Heart, a non-profit owned by PeaceHealth
and located in Eugene, is the largest with 438 beds. McKenzie-Willamette, a for-profit owned
by Triad Inc. and located in Springfield, has 105 beds. In the past year, PeaceHealth has moved
forward with its plans to establish a new 362-bed, $350 million medical center located along the
McKenzie river in north Springfield. Triad, concerned about increased competition in
Springfield, decided to relocate to north Eugene. However, PeaceHealth also decided to remodel
its existing Hilyard campus facility near downtown Eugene into a 104-bed hospital that will
1 http://www.census.gov/ipc/www/usinterimproj/natprojtab02a.pdf 2 http://www.aoa.gov/PRESS/fact/pdf/Attachment_1304.pdf
M. Stratman and M. Spellman || Department of Economics, University of Oregon (2006) Page 1

M. Stratman and M. Spellman || Department of Economics, University of Oregon (2006) Page 2
house an inpatient psychiatric unit, inpatient rehabilitation unit, a geriatrics unit and a 24-hour
emergency department.3
In a free market, the supply and demand for nursing home and hospital beds would
fluctuate until reaching equilibrium. In the majority of states, however, the market is regulated
by Certificate of Need (CON) regulations. The purpose of a CON regulation is to control
hospital and other health care costs by preventing unnecessary construction of new hospital or
other institutional beds and preventing the unnecessary duplication of services. Oregon has had
CON regulations for hospitals since 1971 and for nursing homes since 1973.
In February 2006, the Oregon Department of Health Services granted a Certificate of
Need for the 104 beds at the Hilyard campus. Also in February, Triad submitted an application
for its 148-bed, $225 million hospital in Eugene.4 There has been significant debate within the
community over whether the Eugene-Springfield area needs this many additional beds.
The need to estimate needed capacity is apparent. We will build two models that analyze
the needed capacity of nursing home and hospital beds. By using national data, we can control
for the influence of demographic and socioeconomic trends and CON regulations. We will use
our models to estimate the needed capacity of beds in the Eugene-Springfield area.
The rest of the paper proceeds as follows. The next section is a review of literature. The
following sections discuss our methodology and hypotheses and how the data is collected. The
remaining sections estimate our regression models and then use the results to estimate needed
capacity in the Eugene-Springfield area. We conclude by comparing estimated needed capacity
with current capacity.
3 All statistics concerning Eugene-Springfield situation may be found online at http://www.registerguard.com/ 4 http://www.oregon.gov/DHS/news/

M. Stratman and M. Spellman || Department of Economics, University of Oregon (2006) Page 3
2. Literature Review
There is extensive literature studying factors of nursing home and hospital bed capacity
and the impact of CON regulations on the health care industry.
2.1. Nursing Homes
The literature on nursing homes ranges from analyzing factors of demand for nursing
home care at the individual level to substitutes of nursing homes to the interaction between
market concentration, quality and cost of nursing homes.
Garber and MaCurdy (1989) study a targeted group of low-income elderly Americans
who have high-risk health characteristics and analyze what factors contribute to the likelihood of
admission and duration of admission. They emphasize three main categories of characteristics
that are important determinants of institutionalization. The first factor is demographics; nearly
every study that controls for age has found that aging is associated with an increased risk of
institutionalization.
The second factor is health and functional status. Two main measures of functional
status are Activities of Daily Living and Instrumental Activities of Daily Living which measure
the ability to perform basic functions (like dressing and eating) and more complex tasks (like
shopping and handling finances). The third factor is financial status. Based on past findings
where being poor led to higher rates of institutionalization, they speculate this may be explained
by increased utilization of home health services by wealthier people.
In their study, Garber and MaCurdy include the following variables: demographics,
health and functional status, social supports (marital status and number of living children),
Medicaid and supplemental insurance, home ownership and educational attainment. Using
individual level data, they find the following variables decrease the likelihood of admission to

M. Stratman and M. Spellman || Department of Economics, University of Oregon (2006) Page 4
nursing homes: home ownership, having living children and being non-white. The following
variables are found to increase the likelihood of admission: Medicaid participation, advanced
age, functional impairments and dementia. Income is not a significant factor. Advanced
education is associated with increased duration of institutionalization.
Lakadawalla and Philipson (1999) analyze how the supply of long-term care responds to
an aging population. They argue that aging may decrease per capita demand for long-term care
because the supply of family-provided care (a substitute) may increase. They also examine the
impact of marital status on the probability of institutionalization. They show the supply of
nursing home beds contracts with the longevity of the scarcer gender, typically males, and
expands with the healthy life-expectancies of the abundant gender, typically females. In general,
the female is able to care for her husband in his old age and home-based care is substituted for
market-based nursing home care. By the time females need living assistance, they tend to be
widowed and need to seek market-based care. Growth in elderly males reduces the per capita
demand for market care while growth in elderly females raises per capita demand. Using
microdata, they find the presence of a spouse more than halves the probability of
institutionalization. They also point out that increases in the relative health of elderly have
helped slow the rate of growth of long-term care.
Some studies focus on the demand and supply of nursing home care; others analyze the
interaction of market concentration, efficiency and quality. Zhou and Suzuki (2005) investigate
whether care providers in highly competitive markets have a higher level of quality and
efficiency than those in highly concentrated markets. Previous research has conflicting
conclusions. Some studies show that hospitals tend to compete on non-price assets.
Consequently, hospitals provide too many high-technology services and hire excess staff which

M. Stratman and M. Spellman || Department of Economics, University of Oregon (2006) Page 5
raises patient costs. Other studies suggest that competition leads to substantially lower costs.
From their model on the Japanese home care industry, the authors find that competition is
associated with lower costs. In another study, Gertler and Waldman (1992) find that increases in
competition are associated with higher levels of both quality and cost.
2.2. Hospitals
The importance of examining the healthcare marketplace can be seen through its frequent
appearance in legislative and policy debates. Furthermore, we need to recognize the strength of
the preferences individuals have for cost effective, high quality and easily accessible health care.
There has been a high level of theoretical interest surrounding the issue of hospital capacity and
utilization, but many studies were conducted prior to the 1986 abolishment of mandatory CON
regulations and neglect recent developments that have occurred in the legislation of the law. The
implications of CON regulations on the number of hospital beds are now more relevant to
examine as we can compare areas that have CON laws versus those that provide healthcare in a
competitive market. Nevertheless, the older studies still serve an important role in our study as
they suggest factors that influence the market for an area’s need for hospital beds.
A study by Joskow (1980) determines what factors affect a hospital’s supply decisions
and classifies them as being the fundamentals of a hospital’s constraint function. Joskow argues
that three characteristics of the market constrain the ability of a hospital to maximize its
objective function. First, a hospital must at least break even, where revenues earned are
sufficient to cover costs. Second, the constraint can be determined by the demand for health care
services. To capture aggregate community demand, Joskow suggests various demographic
factors: population, the extent of insurance coverage of the population and birth and death rates.

M. Stratman and M. Spellman || Department of Economics, University of Oregon (2006) Page 6
Last, Joskow reiterates that hospital behavior may be constrained by government regulation.
This will be examined explicitly in our statistical analysis below.
There are also papers that analyze the “appropriate” role of competition in health care
markets, a topic that has been debated by federal and state legislators, judges and academia for
years. In a report by the Federal Trade Commission and the Department of Justice (2004), they
argue that the structure of the extensive regulation of the health care market at federal and state
levels has significantly altered competition unnecessarily. The authors state that the
“government’s actions as both a both purchaser and regulator have profound effects on the rest
of the health care financing and delivery markets as well” and that “price regulation, even if
indirect, can distort provider responses to consumer demand and restrict consumer access to
health care services” (FTC 2004).
The paper also examines the current operation of the health care market, with specific
focus on consumers and their methods of obtaining health insurance, including publicly funded
programs (Medicare and Medicaid), employer-provided and individual. In their analysis of the
competitive responses of hospitals, the authors contend that while some hospitals attempt to find
ways to decrease costs, improve quality and compete more efficiently, others often exercise
market power to demand price increases from consumers and seek to prevent entry of new
competing hospitals (FTC 2004). This is consistent with the argument that is currently being
made by Triad in the Eugene-Springfield area concerning PeaceHealth’s recent operations of
expansion and relocation. Ed Whitelaw, principal with the consulting group ECONorthwest,
states that “market concentration by one entity increases the bargaining power of the hospital in
its negotiations with insurance providers, which can result in higher fees for hospital services.
[With PeaceHealth’s expansion] Lane County can expect more market concentration, less

M. Stratman and M. Spellman || Department of Economics, University of Oregon (2006) Page 7
competition and higher prices.”5 The authors recognize that if prices were to increase, the
hospital would argue that rather than contributing to the rise in increased market power, it is
instead a result of pressures such as shortages of nurses and other personnel, rising liability
premiums, the costs of improved technology and the obligations of indigent care (FTC 2004).
The paper recognizes that some studies find the relationship between competition and hospital
prices is that high hospital concentration is coupled with increased prices, regardless whether the
hospitals are for-profit or non-profit (FTC 2004).
2.3. Certificate of Need
As mentioned previously, CON regulation attempts to control costs and prevent
unnecessary duplication of health care. There is ongoing debate about the impact of CON
regulation and whether it is beneficial or detrimental to the health care industry. As this paper
seeks to determine how CON influences needed capacity, it is important to understand the
history and discussion of CON regulation.
As of June 30, 2004, 37 states and the District of Columbia have active CON laws that
regulate the supply of healthcare facilities in a designated area (Chung 2005). Proponents of
CON argue that by controlling costs in the health sector, CON regulations can improve and/or
protect the quality of care and access to needed services for the majority of the population.
Opponents of the CON process contend that such constraints can pose serious “competitive
concerns that generally outweigh CON programs’” alleged economic benefits (FTC 2004). They
argue that this determent from a competitive market can result in reduced access, higher prices,
decreased quality of care and serve primarily to protect existing providers. In states with CON
laws, the methodology for determining nursing home bed need is generally based on a state’s bed
to population ratio. In Tennessee, for example, Senate Bill No. 2463, passed during the 1998
5http://www.registerguard.com/

M. Stratman and M. Spellman || Department of Economics, University of Oregon (2006) Page 8
legislative session, establishes a bed need formula that the State’s Health Facilities Commission
must follow when granting CON for nursing home beds in the state. The formula6, given below,
is for “county-bed need” and uses a population-based statistical methodology:
bed need = (0.0005 * pop 65 and under) + (0.0120 * pop 65-74) + (0.0600 * pop 75-84) + (0.1500 * pop 85+)
In addition, age specific consumption rates, a desired occupancy rate and future
population growth are often taken into account (Weiner 1998). Some state’s governing agencies
do not use any mathematical formula to determine how many beds should be in an area. Instead,
they base their decisions on general criteria that usually involve various demographic and
economic factors.
Congress passed the National Health Planning and Resources Development Act of 1974
to require states to implement the CON law. These federal requirements for health planning and
CON were removed in 1986, but as stated above, as of June 30, 2004, 37 states (including the
District of Columbia) continue their CON programs for nursing facilities (Chung 2005).
Whether CON regulations are currently implemented in a state or not, within individual
states there is active debate about whether CON should be maintained, removed, or, in the case of
states that have eliminated CON, reapplied. During 2002, state legislatures discussed more than
30 proposals related to CON.7
Oregon’s CON process has been in operation since 1971 and nursing facilities have been
covered under the program since 1973. The Oregon CON program’s strategies are defined as:
(a) Promoting development of more effective methods of delivering health care;
(b) Improving distribution of health care facilities and services;
6 http://www2.state.tn.us/health/statistics/ 7 http://jama.ama-assn.org/

M. Stratman and M. Spellman || Department of Economics, University of Oregon (2006) Page 9
(c) Controlling increase of health care costs, including the promotion of improved
competition between providers;
(d) Promoting planning for health care services at the facility, regional and state levels;
(e) Maximizing the use of existing health care facilities and services which represent the
least costly and most appropriate levels of care; and
(f) Minimizing the unnecessary duplication of health care facilities and services.8
According to Statute 442.315, Oregon CON laws state that any new hospital or new
skilled nursing or intermediate care service or facility that is attempting to move outside of its
current service area shall obtain a CON from the Department of Human Services prior to
development. After a formal application is submitted by the facility, the Department of Human
Services Health Division sets rules specifying criteria and procedures, using the aforementioned
strategies as a guideline, for making decisions on the need for the new services or facilities and is
the decision-making authority.9
The effect that state CON regulations have on the economics of health care markets is
analyzed in a variety of literature. Previous studies examine the impact CON regulation on a
state’s health care supply. Most focus on the implications on the state’s health care spending.
Conover and Sloan (1998) examine the impact of CON regulation for hospitals on measures of
health spending per capita and hospital supply. Using time series cross-sectional methodology,
they estimate the net impact of CON policies. They find that mature CON programs are
associated with a modest long-term reduction in total per capita spending along with a slight
8 http://www.oregon.gov/DHS/9 http://www.oregon.gov/DHS/
M. Stratman and M. Spellman || Department of Economics, University of Oregon (2006) Page 10
(2%) reduction in bed supply, but higher costs per day and per admission. They find no evidence
of a surge in acquisition of facilities or in costs following removal of a state’s CON regulations.
A study by Harrington, Swan, Nyman, and Camillo (1997) examine the effects of state
CON requirements on the change in nursing home bed growth over a 13 year period between
1979 and 1993. Running a two-stage least squares regression analysis using data primarily from
surveys of state officials concerning their state’s policies, while treating CON as an endogenous
variable, they predict the change in nursing home beds per aged population in the states. The
study finds that states with CON regulations do have significant reductions in the growth in
nursing home beds.
Joskow’s results, based on an analysis that occurred when every state was required to
implement CON laws, indicate that CON regulation and other efforts to restrict hospital capacity
have a significant impact on hospital bed supply decisions. One goal of this paper is to
reexamine these results by analyzing the health care industry using updated market information,
improved data accessibility and the state-to-state variation of CON regulation that allows states
to determine whether they should enact a regulation or let the hospitals participate in a
competitive market.
Because of the ambiguity of operating with or without CON regulations in the health care
market, this study will evaluate the influence of CON regulation on the supply of nursing home
and hospital beds in an area by comparing it to an area with the same characteristics but without
CON. Specifically, we recognize the 14 states not currently under CON regulations as our
control group and the metropolitan statistical areas within them as the areas where market forces
determine the number of health care facilities and beds.

M. Stratman and M. Spellman || Department of Economics, University of Oregon (2006) Page 11
3. Methodology and Hypothesis
3.1. Nursing Home Bed Hypotheses
For the nursing home regressions, our dependent variable is the number of nursing home
beds in each Metropolitan Statistical Area (MSA). Our regressions intend to determine which
variables significantly impact the number of nursing home beds in a MSA and to estimate the
number of beds needed in the area. From our regressions, we will be able to determine whether
Eugene-Springfield is at, exceeding or below capacity relative to other communities with the
same characteristics.
We choose our explanatory variables based on previous research. Our first explanatory
variable is the total population (male and female) 65 years and older measured in thousands of
persons. We hypothesize that the coefficient on this variable will be positive, indicating that the
demand for nursing home beds will increase as the number of persons increases.
Our second explanatory variable is males 65 years and older, measured in thousands. We
hypothesize this variable will be negative. Past literature has shown that as the share of males 65
years and older increases, demand for nursing home beds decreases, all else constant. It is
common for the wife to provide in-home support for her aging husband which decreases his
demand for nursing home care. However, the female tend to be widowed and living alone by the
time she needs assistance. Consequently, she has a higher probability of entering a nursing home
to attain this help. Since male longevity has increased over the past several decades, this trend
may be lessening.
Our third variable is whether the MSA is in a state that has a Certificate of Need (CON)
law. As explained earlier, the majority of states have CON regulations which attempt to regulate
the supply and costs of nursing home beds. Due to this governmental intervention, CON
M. Stratman and M. Spellman || Department of Economics, University of Oregon (2006) Page 12
regulations create a market distortion in the nursing home industry. We hypothesize that the
coefficient on the CON regulation variable will be negative; that is, the presence of CON
regulations constricts nursing home bed capacity. We use a dummy variable to capture the effect
of CON regulations (if present in the year 2004), where 1 denotes presence of CON regulation
and 0 denotes no CON regulation. Since CON regulations vary by state and some MSAs cross
state boundaries, we assigned the dummy variable according to the state that contains the largest
number of nursing home beds in that MSA. For example, MSA 2240 includes cities in both
Minnesota and Wisconsin. Minnesota does not have a CON law while Wisconsin does. Since
more nursing home beds are in Minnesota, the CON law dummy variable is 0. See Appendix A
for a list of all applicable MSAs and their assigned dummy variable.
Our fourth variable is the number of persons 65 and older that are below the poverty
level, measured in thousands of persons. We hypothesize that the coefficient on this variable
will be negative, although we also see arguments indicating a positive coefficient. Intuition
suggests that persons living below the poverty level are unable to afford nursing home care;
consequently, the more people living below the poverty level, the fewer nursing home beds are
needed. However, Medicaid does cover nursing home expenses for persons who meet the state-
determined poverty level and certain health-related criteria.10 This suggests a positive
correlation between number of persons living below the poverty level and number of beds.
Qualifying for Medicaid is a stringent and complex process and relatively few elderly are on
Medicaid. In addition, qualifications vary greatly by state.11 Knowing this, we argue that while
Medicaid may increase nursing home admission, there are not enough elderly on Medicaid to
capture this. Another argument for a positive relationship between poverty level and beds are
10 http://www.consumerreports.org/cro/personal-finance/longterm-care-insurance-1103/what-medicaremedicaid-cover/index.htm 11 http://www.kff.org/medicaid/loader.cfm?url=/commonspot/security/getfile.cfm&PageID=14325

M. Stratman and M. Spellman || Department of Economics, University of Oregon (2006) Page 13
others studies find that higher levels of income lead to lower rates of nursing home admission.
The primary explanation is that the elderly with higher levels of income are more likely to hire
in-home assistance because it is preferred over nursing home care.12
Our fifth variable is presence of functional disability. Most studies include Activities of
Daily Living and Instrumental Activities of Daily Living data to control for functional
impairments. As these data are unavailable by MSA, we instead used data from the Census
Bureau for people 65 years and older who have a self-care disability or a go-outside-of-home
disability, measured in thousands. We hypothesize that the coefficient on this variable will be
positive. That is, as the number of people with functional impairments increase, the demand for
nursing home beds will also increase.
Our final variable is educational attainment. Some literature has indicated an impact of
education level on nursing home demand. For our regression, we use data for people 65 years
and older who have some college or higher, measured in thousands. We hypothesize that the
coefficient on this variable will be positive. The relationship between health and education is
ambiguous; economists have not yet determined which factor has the greatest impact on the
other, or the interplay between the variables. However, we hypothesize that a higher level of
education correlates with a longer lifespan and, thus, an increased likelihood of nursing home
admission.
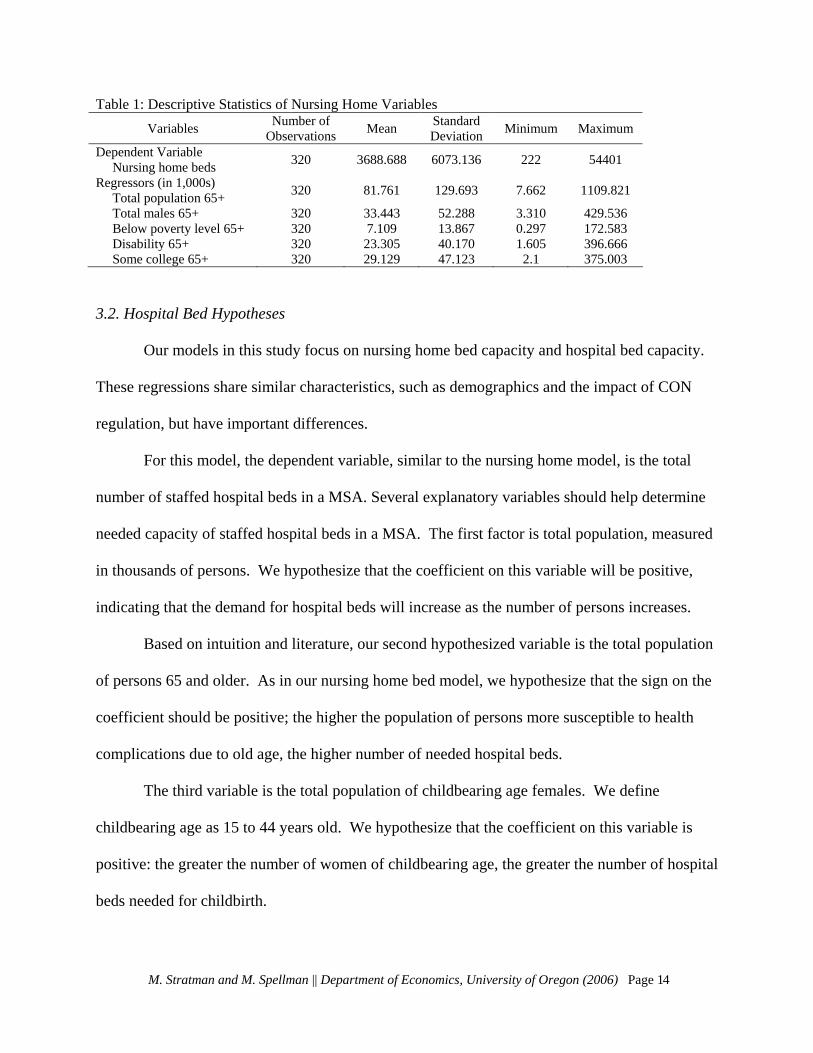
See Table 1 for a summary of the descriptive statistics.
12 Garber and MaCurdy (1989)
M. Stratman and M. Spellman || Department of Economics, University of Oregon (2006) Page 14
Table 1: Descriptive Statistics of Nursing Home Variables Variables Number of
Observations Mean Standard Deviation Minimum Maximum
Dependent Variable Nursing home beds 320 3688.688 6073.136 222 54401
Regressors (in 1,000s) Total population 65+ 320 81.761 129.693 7.662 1109.821
Total males 65+ 320 33.443 52.288 3.310 429.536 Below poverty level 65+ 320 7.109 13.867 0.297 172.583 Disability 65+ 320 23.305 40.170 1.605 396.666 Some college 65+ 320 29.129 47.123 2.1 375.003
3.2. Hospital Bed Hypotheses
Our models in this study focus on nursing home bed capacity and hospital bed capacity.
These regressions share similar characteristics, such as demographics and the impact of CON
regulation, but have important differences.
For this model, the dependent variable, similar to the nursing home model, is the total
number of staffed hospital beds in a MSA. Several explanatory variables should help determine
needed capacity of staffed hospital beds in a MSA. The first factor is total population, measured
in thousands of persons. We hypothesize that the coefficient on this variable will be positive,
indicating that the demand for hospital beds will increase as the number of persons increases.
Based on intuition and literature, our second hypothesized variable is the total population
of persons 65 and older. As in our nursing home bed model, we hypothesize that the sign on the
coefficient should be positive; the higher the population of persons more susceptible to health
complications due to old age, the higher number of needed hospital beds.
The third variable is the total population of childbearing age females. We define
childbearing age as 15 to 44 years old. We hypothesize that the coefficient on this variable is
positive: the greater the number of women of childbearing age, the greater the number of hospital
beds needed for childbirth.

M. Stratman and M. Spellman || Department of Economics, University of Oregon (2006) Page 15
The fourth variable is insurance coverage. We hypothesize that the coefficient on this
variable is positive: the greater degree of health care coverage, the greater the accessibility of
health care and, therefore, the greater the propensity to use it. The data is gathered at the state
level and captures the number of persons that are covered through employer-provided,
individual, Medicaid, Medicare or other public health insurance plans.
Our final variable is the presence of CON regulations. We hypothesize that the
coefficient on the CON dummy variable should be negative. MSAs under CON regulation, such
as the Eugene-Springfield MSA, have restricted competition which should lead to a shortage in
bed supply.
See Table 2 for a summary of the descriptive statistics.
Table 2: Descriptive Statistics of Hospital Variables Variables Number of
Observations Mean Standard Deviation Minimum Maximum
Dependent Variable Hospital Beds 232 1682.823 1891.007 126 12617
Regressors (in 1,000s) Total population 232 461.879 641.453 57.813 5819.100
Total population 65+ 232 56.800 71.055 7.662 459.992 Childbearing age females 232 100.017 128.555 11.852 1000.189 Population covered by insurance 232 388.925 551.353 45.672 5237.190
4. Data Collection
We collect data according to Metropolitan Statistical Areas (MSA) as defined by the U.S.
Census Bureau for the year 2000.13 A MSA, according the Census Bureau, is a “core area
containing a substantial population nucleus, together with adjacent communities having a high
degree of social and economic integration with that core.”14 Using MSAs allows us to assume
that the smaller communities lying outside city boundaries have access to the nursing homes and
13 Definitions for the MSAs may be found online at http://www.census.gov/population/estimates/metro-city/99mfips.txt. 14 http://www.census.gov/population/www/estimates/metroarea.html

M. Stratman and M. Spellman || Department of Economics, University of Oregon (2006) Page 16
hospitals located within the city or surrounding areas. It is important to note that some areas are
listed as Consolidated Metropolitan Statistical Areas (CMSA). These areas contain several
Primary Metropolitan Statistical Areas (PMSA) which are more specific than the CMSAs.
Consequently, we include the PMSAs and exclude the broader CMSAs; this enables greater
precision.
4.1. Nursing Homes
For the nursing home model, we need to collect number of nursing home beds (our
dependent variable) and demographic data. The Medicare website provides the number of
nursing home beds by city and county in the year 2005.15 Using MSA definitions, we aggregate
the number of beds in each MSA. To gather the demographic data, we use the data (by MSA
and PMSA) from the 2000 U.S. Census.16 From this point forward, MSAs and PMSAs will be
jointly referred to as MSAs.
4.2. Hospitals
Our dependent variable in the hospital model is the number of hospital beds. The
American Hospital Association (AHA) database supplies the number of staffed hospital beds
according to MSA for the year 2000. The types of hospitals included are investor-owned (for-
profit), nongovernmental not-for-profit, government (nonfederal and federal), osteopathic and
service hospitals.
As in the nursing home model, we collect demographic data (by MSA) from the U.S.
Census Bureau for the year 2000. Since data on insurance coverage is unavailable by MSA, we
gather state-level data from the Kaiser Family Foundation (KFF) for the year 2003.17 We
assume that a MSA has a health insurance coverage rate consistent with the state-level rate.
15 The Medicare website may be found at www.medicare.gov. 16 U.S. Census data is found at the U.S. Census Bureau website, www.census.gov. 17 The KFF website can be found at www.statehealthfacts.org

M. Stratman and M. Spellman || Department of Economics, University of Oregon (2006) Page 17
Consequently, each MSA within a state is given the same rate as the state. For example, the
Eugene-Springfield, Oregon, MSA is assumed to have a rate of health insurance coverage
consistent to that of Oregon as a whole.
5. Regression Analysis
5.1. Nursing Home Bed Analysis
For the nursing home bed study, we show five different specifications of our model
where with each new specification we incorporate a new variable. This allows us to see the
additional explanatory power for each new variable. Our base model uses the dependent variable
of nursing home beds and the independent variables of total population of 65 years and older in
thousands and population of males 65 years and older in thousands. Both variables are
statistically significant at the 1% level and the R2 is very high at 0.9513, indicating that 95.13%
of the variation in the number of nursing home beds is explained by these independent variables.
The regression model states that, holding all other variables constant, for a 1,000 person increase
in population aged 65 and older, approximately 228 more nursing home beds are needed.
Holding population constant, for every additional 1,000 males aged 65 and older, approximately
456 fewer nursing home beds are needed. These findings confirm our hypotheses.
To this base model, we add the CON law dummy variable. The coefficients on both the
total population and the male population are statistically significant at the 1% level and the
coefficient on the CON law dummy variable is statistically significant at the 10% level. The R2
is slightly higher at 0.9516. The coefficients on the population variables are approximately the
same as the base model. The model states that, holding all other variables constant, a MSA in a

M. Stratman and M. Spellman || Department of Economics, University of Oregon (2006) Page 18
state with CON laws is associated with approximately 215 fewer nursing home beds than a state
without CON laws. This finding indicates that CON laws are in fact restricting bed supply.
To this base model, we add elderly population below the poverty level, measured in
thousands. The coefficient on total population increases slightly to 283 and the coefficient on
male population decreases by approximately 100 to -565. Both coefficients remain significant at
the 1% level. The coefficient on CON decreases slightly to -265 but increases in significance to
the 5% level. The coefficient on poverty level is also significant at the 5%. It indicates that,
holding all else constant, for a 1,000 person increase in elderly below the poverty level 99 fewer
nursing home beds are needed.
We next add the population 65 years and older with a self-care or go-outside-of-home
disability, measured in thousands. The coefficient on total population decreases slightly to 276
and the coefficient on male population remains approximately the same. Both coefficients
remain statistically significant at the 1% level. The coefficient on the CON law variable
increases to -283 and remains statistically significant at the 5% level. Neither of the coefficients
on poverty nor disability is statistically significant.
Finally, we add the total population 65 years and older that has some college education
and higher (in thousands). The coefficient on total population now increases slightly to 285 and
the coefficient on males decreases to -592. Both remain statistically significant at the 1% level.
The coefficient on CON is approximately the same and remains significant at the 5% level. The
coefficients on the poverty, disability and education variables are statistically insignificant. See
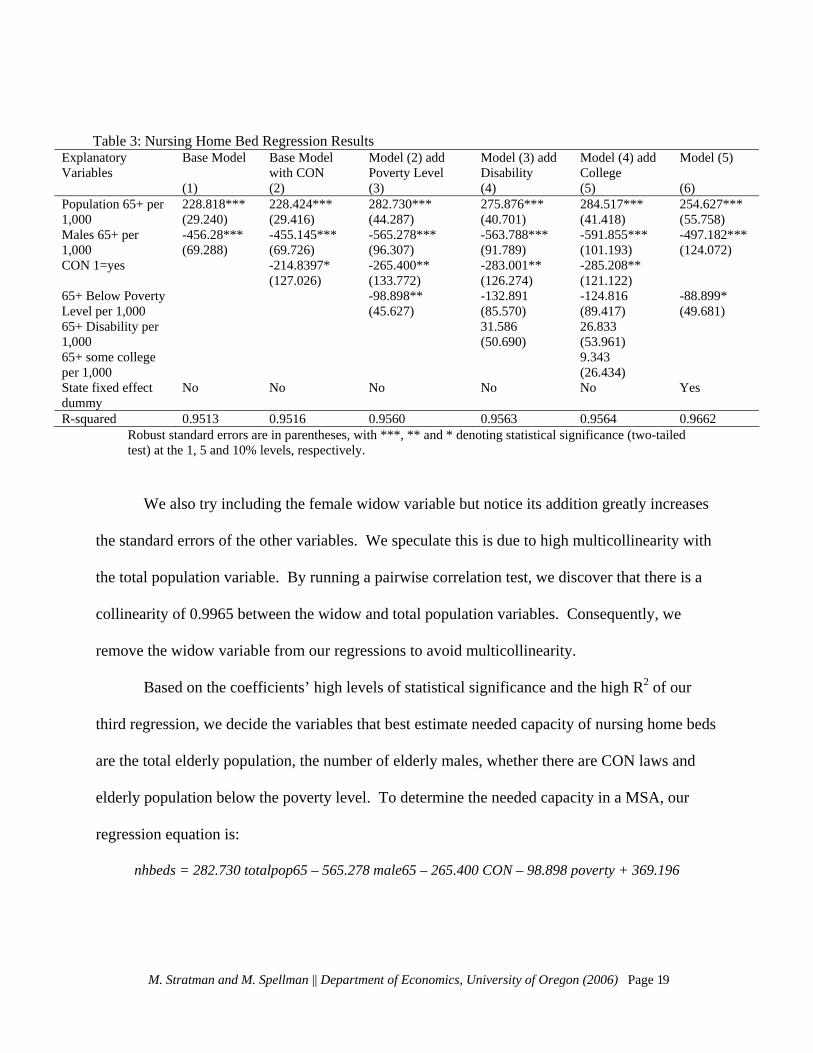
Table 3 for regression results.
M. Stratman and M. Spellman || Department of Economics, University of Oregon (2006) Page 19
Table 3: Nursing Home Bed Regression Results Explanatory Variables
Base Model Base Model with CON
Model (2) add Poverty Level
Model (3) add Disability
Model (4) add College
Model (5)
(1) (2) (3) (4) (5) (6) Population 65+ per 1,000
228.818*** (29.240)
228.424*** (29.416)
282.730*** (44.287)
275.876*** (40.701)
284.517*** (41.418)
254.627*** (55.758)
Males 65+ per 1,000
-456.28*** (69.288)
-455.145*** (69.726)
-565.278*** (96.307)
-563.788*** (91.789)
-591.855*** (101.193)
-497.182*** (124.072)
CON 1=yes -214.8397* (127.026)
-265.400** (133.772)
-283.001** (126.274)
-285.208** (121.122)
65+ Below Poverty Level per 1,000
-98.898** (45.627)
-132.891 (85.570)
-124.816 (89.417)
-88.899* (49.681)
65+ Disability per 1,000
31.586 (50.690)
26.833 (53.961)
65+ some college per 1,000
9.343 (26.434)
State fixed effect dummy
No No No No No Yes
R-squared 0.9513 0.9516 0.9560 0.9563 0.9564 0.9662 Robust standard errors are in parentheses, with ***, ** and * denoting statistical significance (two-tailed test) at the 1, 5 and 10% levels, respectively.
We also try including the female widow variable but notice its addition greatly increases
the standard errors of the other variables. We speculate this is due to high multicollinearity with
the total population variable. By running a pairwise correlation test, we discover that there is a
collinearity of 0.9965 between the widow and total population variables. Consequently, we
remove the widow variable from our regressions to avoid multicollinearity.
Based on the coefficients’ high levels of statistical significance and the high R2 of our
third regression, we decide the variables that best estimate needed capacity of nursing home beds
are the total elderly population, the number of elderly males, whether there are CON laws and
elderly population below the poverty level. To determine the needed capacity in a MSA, our
regression equation is:
nhbeds = 282.730 totalpop65 – 565.278 male65 – 265.400 CON – 98.898 poverty + 369.196

M. Stratman and M. Spellman || Department of Economics, University of Oregon (2006) Page 20
5.2. Hospital Bed Analysis
Replicating the process used in the nursing home model, the hospital bed model to
determine needed bed capacity begins with a base model and additional models are formulated in
order to gauge the interaction of the variables in each subsequent regression. The base model
uses the total number of staffed beds as the dependent variable and total population as the
explanatory variable. Total population is found statistically significant at the 1% level and R2 is
0.8320; this indicates that 83.20% of the variation in the number of hospital beds is explained by
the independent variable. It is important to note that this R2 is relatively high considering only
one explanatory variable is included in the model. To simplify interpretation, the independent
variable is divided by 1,000 to create a coefficient that represents the effect of a 1,000-person
change in the population in a MSA has on the number of hospital beds needed. The regression
model indicates that, holding all other variables constant, for a 1,000 person increase in total
population, approximately 2.7 more hospital beds are needed. This positive influence of total
population reflects our hypotheses.
To this base model, we add the total population of persons 65 and over in thousands. The
coefficients on both total population and total population 65 and older are statistically significant
at the 1% level and positive, as we hypothesized. The coefficient on total population remains
positive, indicating the addition of elderly population is justified. The model indicates that,
holding total population constant, for every additional 1,000 persons 65 and older, approximately
13 more hospital beds are needed.

Table 4: Hospital Bed Regression Results
Robust standard errors are in parentheses, with ***, ** and * denoting statistical significance (two-tailed test) at the 1, 5 and 10% levels, respectively.
Explanatory Variables
Base Model
Base Model with Population over 65
Model (2) add Females Child Bearing Age
Model (2) add Population Insured
Model (2) add CON
Model (2) add State Fixed Effects
(1) (2) (3) (4) (5) (6) Total Population per 1,000
2.713*** (0.255)
1.372*** (0.337)
0.401 (0.295)
1.903 (3.340)
1.371*** (0.335)
1.237*** (0.313)
Population 65+ per 1,000
13.169*** (3.152)
12.391*** (2.937)
13.015*** (2.721)
13.207*** (3.139)
15.551*** (3.268)
Females of Child Bearing Age per 1,000
5.420*** (1.685)
Population covered by health insurance per 1,000
-.602 (2.967)
CON 1 = Yes -58.440 (99.629)
State Fixed Effects
No No No No No Yes
R-squared 0.8320 0.8705 0.8781 0.8706 0.8707 0.9154
The third variable we add to the model is the total population of childbearing age (15 to
44 years old) females. The coefficient on this variable is highly statistically significant at the 1%
level; however, the coefficient on total population becomes statistically insignificant. That the
total population variable becomes insignificant after including childbearing age females indicates
that population levels of childbearing age females may not vary enough state to state to be a
significant factor. With that said, we stay consistent with literature that suggests this
demographic does influence the number of hospital beds needed in an area but is instead
captured within the total population variable.
In our next model, we include the number of persons covered by health insurance (either
employer-provided, individual, Medicaid, Medicare or other), measured in thousands, and omit
childbearing age females. The coefficients on both health insurance coverage and total
population are statistically insignificant; the population over 65 remains statistically significant M. Stratman and M. Spellman || Department of Economics, University of Oregon (2006) Page 21

M. Stratman and M. Spellman || Department of Economics, University of Oregon (2006) Page 22
at the 1% level. Similar to the childbearing age variable, this result suggests that insurance levels
may not vary enough by state to be a significant factor in the model.
In our final model, we include total population, total elderly population and the CON
dummy variable. The coefficients on total population and elderly population are very close to
what they are in the second model (which includes only those two variables) and remain
statistically significant at the 1% level. The coefficient on the CON dummy variable is
statistically insignificant. Thus, the model indicates that the CON laws do not distort the market;
that is, the state's criteria accurately determines the number of beds that would be needed in a
competitive market. See Table 4 for regression results.
Based on the statistical significance of the coefficients of the second model (which
includes total population and total population of persons 65 and older), we determine this model
is most representative of needed capacity for staffed hospital beds in a MSA. Our regression
equation is:
Hospital beds = 1.372 totpop + 13.169 pop65over + 309.189
6. Applying Regressions
6.1. Nursing Homes
In the previous section, we ran several regressions using nursing home beds as our
dependent variable. We selected the model that best estimates needed capacity of beds and will
now apply that regression to several MSAs to determine whether they are at, below or above
needed capacity.
Recall that our final regression included total elderly population, total elderly male
population, the presence of CON and elderly population below the poverty level. The equation
is: nhbeds = 282.730 totalpop65 – 565.278 male65 – 265.400 CON – 98.898 poverty + 369.196.

M. Stratman and M. Spellman || Department of Economics, University of Oregon (2006) Page 23
Table 5: Nursing home bed MSA-specific data, estimations and comparisons
MSA Total Pop 65+
Male Pop 65+
Presence of CON 1=yes
65+ Below Poverty Level
Estimated # of Beds
Actual # of Beds
Difference: Actual –
Estimated Eugene-
Springfield OR 42,954 18,140 1 3,149 1,683 1,229 – 454
Medford-Ashland OR 28,991 12,635 1 1,944 966 596 – 370
Spokane WA 51,949 21,198 1 4,021 2428 3,686 + 1258
Albuquerque NM 80,421 33,995 0 7,213 3177 2,302 – 875
To estimate needed capacity, we insert a MSA’s data into the above equation. We will
estimate needed capacity in the following MSAs: Eugene-Springfield, OR; Medford-Ashland,
OR; Spokane, WA; and Albuquerque, NM. The Oregon MSAs will help show if there are
similarities within the state; the Washington MSA will allow a comparison between the two
northwestern states; and New Mexico does not have CON regulations. Table 5 shows the data
used for each MSA, the estimated number of beds and the actual number of beds.
As Table 5 shows, Eugene-Springfield, Medford-Ashland and Albuquerque are all under
needed capacity while Spokane is above needed capacity. Chart 1 provides a visual of the
difference between estimated and actual numbers of beds in these MSAs. Specifically, our
regression estimates that, based on its demographic characteristics, the Eugene-Springfield MSA
needs approximately 454 more beds than it currently has. It is important to note that although
the Eugene-Springfield MSA includes the entirety of Lane County, it is reasonable to assume the
majority of nursing home bed demand lies within the Eugene-Springfield area.

Chart 1: Graph of actual and estimated number of nursing home beds
0
500
1000
1500
2000
2500
3000
3500
4000
Eugene‐Springfield, OR Medford‐Ashland, OR Spokane, WA Albuquerque, NM
Actual
Estimated
6.2. Hospitals
For our hospital bed model, we use our final regression equation to determine the needed
capacity of hospital beds in Eugene-Springfield. The final regression equation includes total
population and total elderly population: Hospital beds = 1.372 totpop + 13.169 pop65over + 309.189.
Again, for comparison purposes, we apply the model to another MSA in Oregon
(Medford-Ashland), a MSA in another state with CON regulations (Spokane, WA), and a MSA
in a state without CON regulations (Albuquerque, NM). The results are presented in Table 6.
The regression estimates that the Eugene-Springfield MSA needs approximately 1318
staffed hospital beds, based on its characteristics. With a current total of 586 beds, the model
suggests the area needs approximately 732 additional staffed hospital beds. Again assuming
Eugene-Springfield’s predominance of Lane County, the majority of this need should lie within
the Eugene-Springfield area.
M. Stratman and M. Spellman || Department of Economics, University of Oregon (2006) Page 24

Table 6: Hospital bed MSA-specific data, estimations and comparisons
MSA Total Pop Total Pop over 65
Estimated # of Beds
Actual # of Beds
Difference: Actual – Estimated
Eugene-Springfield 322,959 42,954 1,318 586 -732 Medford-Ashland 181,269 28,991 940 384 -556
Spokane, WA 417,939 51,949 1,567 1,625 +58 Albuquerque, NM 712,738 80,421 2,346 1,970 -376
We again see in Table 6, consistent with the nursing home regression, that Eugene-
Springfield, Medford-Ashland and Albuquerque are below needed capacity and Spokane is
above needed capacity. Chart 2 provides a visual of the difference between estimated and actual
numbers of beds in these MSAs.
Chart 2: Graph of actual and estimated number of hospital beds
0
500
1000
1500
2000
2500
Eugene‐Springfield,OR
Medford‐Ashland, OR Spokane, WA Albuquerque, NM
Actual
Estimated
M. Stratman and M. Spellman || Department of Economics, University of Oregon (2006) Page 25

M. Stratman and M. Spellman || Department of Economics, University of Oregon (2006) Page 26
7. Alternative Specifications
7.1. Log-Log Model
Our nursing home and hospital bed models use linear functional forms to estimate needed
capacity. We want to see whether log-log functional forms would provide better estimates since
a log-log model normalizes everything into percent changes. Using our selected nursing home
bed model (total elderly population, elderly males, presence of CON and elderly below poverty
level), we run another regression in log-log form. The regression equation is:
ln(nhbeds) = 6.097 ln(totalpop65) – 5.02 ln(male65) – 0.165 ln(CON) – 0.158 ln(poverty) – 6.934.
The signs on each coefficient are the same as the linear model; the coefficient on the poverty
level variable is statistically significant at the 5% level and the remaining coefficients are statistically
significant at the 1% level. In addition, the needed capacity estimates are very similar to the
estimates from our linear regression. For example, the log-log model estimates the Eugene-
Springfield MSA needs 1689 beds; the linear model estimates 1683 beds.
Next, we convert our linear model for hospital beds to a log-log functional form. The
regression equation is:
ln(hospital beds) = 0.817 ln(totpop) + 0.0512 ln(pop65over) + 2.208.
The coefficient for population over 65 is less statistically significant, now at the 10%
level. Nevertheless, if we are to look at the predictions, they are consistent with the linear
model; the Eugene-Springfield, Medford-Ashland and Albuquerque MSAs are all under capacity
while the Spokane MSA stays above.
The log-log models provide estimations consistent with the linear models; this indicates
that our linear models can be seen as the correct specifications to be used.

M. Stratman and M. Spellman || Department of Economics, University of Oregon (2006) Page 27
7.2. State Fixed Effects
We return to our linear regression models and investigate state fixed effects. The
regression model applied in Section 6. compares a specific MSA to MSAs across the nation.
Now we want to determine whether there is a fixed effect that occurs in an individual state. In
other words, we will now control for each state’s fixed effect. Specifically, we will control for
Oregon’s fixed effect—whether there are factors in Oregon that impact needed nursing home
and hospital bed capacity.
To control for state fixed effects, we create a dummy variable for each MSA in every
state. The dummy variable takes the value of 1 if we are investigating that particular state’s
fixed effects. For example, when looking at Oregon’s state fixed effects, the fixed effect dummy
variable takes the value of 1 for all the MSAs in Oregon and a value of 0 for the MSAs in the
remaining states.18
For nursing homes, we run a regression including the state fixed effects dummy variable,
elderly population, elderly males and elderly below the poverty level. We exclude the CON
dummy variable because this effect is captured by the state fixed effects dummy variable. See
Column (6) in Table 3 for the regression results. All of the coefficients are statistically
significant and the R2 is very high at 0.9662. The coefficient on the Oregon fixed effects dummy
variable is -866 and is statistically significant at the 10% level. This indicates that the MSAs in
Oregon are below capacity for nursing home beds, relative to MSAs in other states.
As for hospitals, we run a regression including the state fixed effects dummy variable,
total population and elderly population. Similar to the nursing home model, both of the
explanatory coefficients are statistically significant at the 1% level and the R2 is high at 0.9154.
18 Some MSAs cross state boundaries. These MSAs are assigned to the state in which the majority of nursing home beds are located. See Appendix 1 for a list of all applicable MSAs and their assigned state.

M. Stratman and M. Spellman || Department of Economics, University of Oregon (2006) Page 28
The coefficient on the Oregon fixed effects dummy variable is approximately -532 and is
statistically significant at the 1% level, once again indicating that all MSAs in Oregon are below
capacity for hospital bed, relative to MSAs in other states. See Column (6) in Table 4 for the
regression results.
There are several factors that may cause Oregon to have lower needed capacity: the
influence and/or strength of CON regulations relative to other states; preferences of its residents
(for example, preferring home-based care rather than nursing home care); or other characteristics
unique to Oregon.
Using this regression with Oregon’s fixed effects, we estimate needed nursing home bed
capacity in Eugene-Springfield to be 736 beds, which indicates an excess of 493 beds. This
shows that after controlling for Oregon’s fixed effects, Eugene-Springfield is not under capacity
when compared to other Oregon MSAs. Conversely, the estimate of needed hospital bed
capacity in the MSA is 681 beds, still indicating an undersupply of 95 beds. We conclude that for
hospital beds, after controlling for Oregon’s fixed effects, Eugene-Springfield is slightly under
capacity compared to other Oregon MSAs.

M. Stratman and M. Spellman || Department of Economics, University of Oregon (2006) Page 29
8. Conclusion
Our study shows that the Eugene-Springfield area needs increased capacity in both
nursing home and hospital beds. These results show there is excess demand not currently met by
hospital bed supply, indicating there should be no concern over the planned hospital expansions.
These regressions that control for demographic, socioeconomic and CON regulation
characteristics are important to ensure that the supply of beds meets the demand. It is
particularly important to carefully monitor supply in states with CON regulations. Our
regression results indicate that the CON regulations constrict the supply of nursing home beds
below market demand. However, CON regulations for hospital beds appear to accurately supply
the demanded number of beds. The growth of the American population, in particular the elderly,
emphasizes the need for adequate supply of nursing home and hospital beds. Studies such as this
are important tools for policy-makers to use when determining needed supply of health care.

M. Stratman and M. Spellman || Department of Economics, University of Oregon (2006) Page 30
9. References Administration on Aging. 2006. A Statistical Profile of Older Americans Aged 65+. http://www.aoa.gov/PRESS/fact/pdf/Attachment_1304.pdf (accessed May 1, 2006). Chung, K., 2005. Comparative Assessment of Certificate of Need Programs. Governors State University. 1-13. http://www.idph.state.il.us/ (accessed May 5, 2006). Conover, C., Sloan, F., 1998. Does removing certificate-of-need regulations lead to a surge in health care spending? Journal of Health Politics, Policy, and Law. 23 (3): 455-81. Consumer Reports. 2003. What Medicare and Medicaid Cover. http://www.consumerreports.org/cro/personal-finance/longterm-care-insurance-1103/what-medicaremedicaid-cover/index.htm (accessed May 31, 2006). Federal Trade Commission and The Department of Justice. Improving Health Care: A Dose of Competition. July 2004. Garber, A.M., MaCurdy, T. 1989. Predicting Nursing Home Utilization Among the High-Risk Elderly. NBER Working Paper No. 2843. Gertler, P.J., Waldman, D.M. 1992. Quality-adjusted Cost Functions and Policy Evaluation in the Nursing Home Industry. Journal of Political Economy. 100 (6): 1232-1256. Harrington, C., Swan, J., Nyman, J., Camillo, H., 1997. The Effect of Certificate of Need and Moratoria Policy on Change in Nursing Home Beds in the United States. Medical Care. 35 (6): 574-588. http://www.lww-medicalcare.com/ (accessed March 23, 2006). Harwood, J., 2005. Hospitals do battle over ER at Hilyard. Register Guard, November 23, sec. City/Region. http://www.registerguard.com/ (accessed December 17, 2006). Health Systems Planning, 2006. Purpose, Applicability and Definitions for Certificate of Need. Department of Heath Services. http://www.oregon.gov/DHS/ (accessed March 15, 2006). Joskow, P., 1980. The Effects of Competition and Regulation on Hospital Bed Supply and Reservation Quality of the Hospital. The Bell Journal of Economics. 11 (2): 421-447. http://www.jstor.org/ (accessed April 15, 2006). Kaiser Family Foundation. 2003. Health Coverage and Uninsured Statistics. http://www.statehealthfacts.org (accessed April 10, 2006). Kaiser Family Foundation. 2003. Kaiser Commission on Medicaid and the Uninsured. http://www.kff.org/medicaid/loader.cfm?url=/commonspot/security/getfile.cfm&PageID=14325 (accessed June 2, 2006).

M. Stratman and M. Spellman || Department of Economics, University of Oregon (2006) Page 31
Knickman, J., Snell, E. 2002. The 2030 Problem: Caring for Aging Baby Boomers. Health Services Research. 37 (4): 849-884. Lakdawalla, D., Philipson, T. 1999. Aging and the Growth of Long-Term Care. NBER Working Paper No. 6980. http://www.nber.org/papers/w6980 (accessed February 16, 2006). Medicare. 2005. Nursing Home Compare. http://www.medicare.gov (accessed March 15, 2006). Newcomer, R., Swan, J., Karon, S., Bigelow, W., Harrington, C., Zimmerman, D. 2001. Residential Care Supply and Cognitive and Physical Problem Case Mix in Nursing Homes. Journal of Aging and Health. 13 (2): 217-247. Oregon Department of Human Services news release, 2006. DHS grants Certificate of Need for Sacred Heart Medical Center's Hilyard Street location. http://www.oregon.gov/DHS/news/ (accessed March 12, 2006). Popescu, I., Vaughan-Sarrazin, M., Rosenthal, G., 2006. Certificate of Need Regulations and Use of Coronary Revascularization After Acute Myocardial Infarction. Journal of American Medical Association. 295 (18): 2141-2147. http://jama.ama-assn.org/ (accessed May 17, 2006). Tennessee Health Planning Commission, 2000. Criteria and Standards for Certificate of Need. Tennessee’s Health Guidelines for Growth. http://www2.state.tn.us/health/statistics/ (accessed February 12, 2006). U.S. Census Bureau. 2000. Census 2000 Summary File 1 (SF 1) 100-Percent Data. http://factfinder.census.gov (accessed March 1, 2006). U.S. Census Bureau. 2000. Census 2000 Summary File 3 (SF 3) Sample Data. http://factfinder.census.gov (accessed March 1, 2006). U.S. Census Bureau. 1999. Metropolitan Areas and Components [for 2000 Census]. http://www.census.gov/population/estimates/metro-city/99mfips.txt (accessed February 21, 2006). U.S. Census Bureau. 2006. Metropolitan and Micropolitan Statistical Areas. http://www.census.gov/population/www/estimates/metroarea.html (accessed May 21, 2006). U.S. Census Bureau. 2004. Projected Population of the United States, by Age and Sex: 2000-2050. http://www.census.gov/ipc/www/usinterimproj/natprojtab02a.pdf (accessed May 1, 2006). Weiner, J., Stevenson, D., Goldenson, S., 1998. Controlling the Supply of Long-Term Care Providers at the State Level. The Urban Institute. Paper 22. http://www.urban.org/ (accessed March 10, 2006).

M. Stratman and M. Spellman || Department of Economics, University of Oregon (2006) Page 32
Zhou, Y., Suzuki, W. 2005. Market Concentration, Efficiency and Quality in Japanese Home Help Industry. https://www.nber.org/books/US-Japan03/zhou-suzuki9-29-05.pdf (accessed February 20, 2006).

M. Stratman and M. Spellman || Department of Economics, University of Oregon (2006) Page 33
Appendix A. Some Metropolitan Statistical Areas (MSAs) cross state boundaries. In order to gauge the effect of CON regulations or state fixed effects, we assign these MSAs to the state in which the majority of the MSA’s beds are located. The following chart lists the affected MSAs and their assigned unique state:
MSA code Assigned state 0600 Georgia 1520 North Carolina 1560 Tennessee 1640 Ohio 1660 Kentucky 1800 Georgia 1900 Maryland 1960 Illinois 2440 Indiana 2520 North Dakota 2720 Arkansas 2985 Minnesota 3760 Missouri 4120 Nevada 4160 Massachusetts 4520 Kentucky 4920 Tennessee 5120 Minnesota 5920 Nebraska 6160 Pennsylvania 6440 Oregon 6450 New Hampshire 6480 Rhode Island 7040 Missouri 8360 Texas