estimating populations affected by disasters: a … estimating populations affected by disasters: a...
TRANSCRIPT

1
Estimating populations affected by disasters:
A review of methodological issues and research gaps
Debarati Guha-Sapir1, Philippe Hoyois2
Centre for Research on the Epidemiology of Disasters (CRED), Institute of Health and Society (IRSS), Université catholique de Louvain, Brussels
March, 2015
-------------------------------------------------------
1.0 Why measure disaster impact
In the last ten years, a total of 3,583 disasters occurred, over four times the number in the 1970
-79 decade. Nearly 85% of these occurred in Asia and in total they affected about 1.7 billion
people again, mostly in Asia. These affected people include mainly those who are immediately
and directly affected by the event. To what extent these estimates include those that are more
indirectly affected such as those permanently disabled due to sustained injuries , orphaned and
motherless children who are at higher risk of mortality or large numbers forced away from their
homes to settle and inflate populations in nearby city slums – is less well known. Convincing
evidence on the mechanisms by which these disasters actually affect household, communities
and the knock on effects on key social processes such as rural-urban migration, entrenched
malnutrition is a major gap.
Of all disasters, extreme climate events (such as droughts, floods, storms) represent over 80% of
all disasters in the past decades. The statistics indicate the largest absolute share of disaster
victims are in upper middle income countries (WB classification) which includes China. But those
1 Professor, Public Health and Epidemiology, Institute of Health and Society, Université catholique de Louvain,
Brussels 2 Invited Fellow, as above

2
who are most vulnerable to further impoverisation and delayed risk of death are those affected
in the poorer countries. Typically, these victims have the least schooling, lower nutritional
status and scanty financial reserves compared to national averages when disaster strikes. Their
condition therefore deteriorates further with little means to recover from these shocks.
Research on access to health services among the slums in Kolkata and elsewhere indicate that
nearly half of the slum dwellers in Kolkata have arrived to escape poverty brought on by
recurrent floods in their villages (reference to the EC slum study). Different studies indicate the
overwhelming slum populations and their increase in metropolises such as Dhaka or Manila are
significantly if not largely fed by flood, storms and drought related migration (Sultana et al.,
2014; Jahan, 2012). Of these three, floods and storms have the highest frequency of occurrence
accounting for nearly 78% of all disasters and a lion’s share of all affected (80%). On the other
hand, they also enjoy a strong potential for early warning and structural prevention (floods and
droughts especially). There are also early suggestions from scientific studies that soft options
such as practical education of mothers can reduce the effect of floods on child malnutrition
(Paper by Jose). Much more evidence is required through sound operational research to
establish the most effective interventions for disaster risk reduction.
In resource limited settings where tough priorities have to be set, disasters are essentially
relevant as setbacks to development process. In addition to the direct impacts (mainly deaths,
injuries, homelessness), they destroy harvests, public buildings and other infrastructure,
livelihoods of fragile populations. At this time, disaster risk reduction and preparedness is
largely formulated on assumptions with little field based findings that are useful for national
development planners or for priority setting for the areas locally exposed to specific disasters.
Vulnerability to disasters needs to be clearly defined and the object of the vulnerability
transparently stated: vulnerability to what? Or at risk of what? Without such clarity it is difficult
to monitor progress or indeed target interventions that will answer questions like “what do we
want to reduce by this intervention?”

3
As the lack of evidence is increasingly recognized by policy makers, more studies are now
appearing that examine the ways in which disasters actually affect a population. These and
other studies have made in-depth empirical analyses on the impact of disasters on key
development indicators that were adversely affected by a catastrophic event and which had
long term implications. Baez and Santos examined effects on schooling attendance on
communities hit by Hurricane Mitch as well the effects of intra-household aid versus
international aid (Baez and Santos, 2007). Another work studied the effect of malnutrition and
floods in Odisha, India and found that children exposed to recurrent flooding show significantly
higher levels of stunting, a form of permanent malnutrition from which they will never recover
(Rodriguez-Llanes et al., 2011). Conjecturally as persuasive evidence is not available, effects of
a major earthquake and loss of family or the limited assets in poorer setting may be
substantially higher. Others have found significant impact of key social development indicators
using panel data, a powerful approach to identify effects (Coffman and Noy, 2009; Rodriguez-
Oreggia E. et al., 2013; Fergusson et al., 2014)
Systematic data is in increasing demand to establish broad trends over time in the numbers
affected and dead or economic loss. None of these typically use denominators making it difficult
to say something about the real change with confidence. Monitoring whether countries are
actually making progress through their investments of DRR and DRM will need better (but not
necessarily more sophisticate) tool and most importantly establish the relation between
disasters and impoverisation.
The Integrated Research on Disaster Risk (IRDR) section of the ICSU leads a global disaster data
collection expert group to improve data quality. Demographers and statisticians are not yet
represented in this group.
More recently, United Nations - Economic and Social Commission for Asia and the Pacific (UN-
ESCAP) has launched a promising initiative actively engaging National Statistical Offices, and
Civil and vital registration specialists to develop sustainable systems at the country level.
Resolution 69/12 of the ESCAP Committee provides one paragraph that mandated the work

4
which was followed through by an Expert Group Meeting in Sendai in November 2014. The
results were taken to the ESCAP committee which elevated the matter to the Commission and a
dedicated resolution was created (United Nations Economic and Social Council, 2013).
The regional standard for collecting valid disaster impact data, consisting of a framework and an
implementing guide will be presented to the Commission for endorsement in 2016.
The above provides a brief overview of the global context, current gaps and initiatives on the
subject of the disaster impact data. This briefing note examines quality of disaster impact data
with special attention to the estimation of disaster affected and its use for sustainable
development progress monitoring. It draws on experience from the EM-DAT database to
highlight options that balance soundness and rigour of methods and realities on the ground3.
2.0 Indicators of impact
The most common measures of impact due to a catastrophic event are direct deaths, injured,
disaster-affected and economic losses. Of all these indicators, the last two are arguably the
most challenging for definition, measurement and for interpretation.
EMDAT defines affected as follows:
“People requiring immediate assistance during a period of emergency, i.e. requiring basic
survival needs such as food, water, shelter, sanitation and immediate medical assistance.
This may include displaced or evacuated people”. (Guha-Sapir et al., 2006)
3 EMDAT, a widely used multi sourced standardized global disaster database (www.emdat.be) that systematically
collects and validates data from 1900 to the current day for all disasters and for 184 UN member states. About 40 variables are recorded as available, for each disaster (Appendix 1 – List). Deaths, injured and disaster-affected are reported for the vast majority of the incidents and by almost all the participating sources. These are widely used by different actors to convey the extent or severity of a disaster.

5
Although this description adequately reflects most of the field reports from the different
sources, it still requires better precision and wider usage by reporting sources.
Since affected numbers are commonly used by important policy setting organisations such as
the United Nations (UN) agencies, the Intergovernmental Panel on Climate Change (IPCC), the
International Monetary Fund (IMF), national governments, statistically sound methods are
urgently needed. .
There are two specific weaknesses that undermine the estimations of disaster affected.
First, a measurable definition of who is affected is urgently needed. While a definition that will
respond to all viewpoints and capture the entire spectrum of people affected is a Herculean
task, some clarity on what is and what is not a characteristic of an affected population is
fundamental. An important component of the measurement of affected is the establishment of
concepts that distinguishes between directly disaster-affected and those disaster-affected
indirectly is under debate. The challenge will be to mediate between those who feel the indirect
effects are too significant to be excluded and others who may argue that indirect effect are so
wide as to practically englobe everything that happens to the family in the future.
The criteria used by sources vary widely. Some report strictly only those who are affected by the
disaster and are receiving relief. Others report the population of the entire district or province
where the disaster (typically floods) has occurred. The criteria for homeless or displaced is
uncertain – some consider a few nights away from home as displaced and others only those
who have permanently lost their homes and have to rebuild or relocate.
Not much progress has been made in proposing to a definition that is realistic for national
authorities or field agencies such as the Red Cross to apply and at the same time does not
overestimate the numbers, undermining the credibility of the process. Discussions to replace
this indicator by other options such as ‘people exposed’, ‘people in need’ or ‘people living in the
disaster-affected area’ are ongoing and may lead to better clarification of this measure. These
alternatives are particularly promising in view of new technologies (discussed below) which may
6
improve the quality (especially coverage and accuracy) of the estimates of affected. The use of a
systematic quality scoring system could also help the user in assessing the value of the estimate.
Second, the lack of a methodology to measure the indicator is an important barrier to reliable
data and for monitoring. These limitations make comparisons across countries difficult. Even
within countries, monitoring across time is unreliable since the definition may change from one
year to the next.
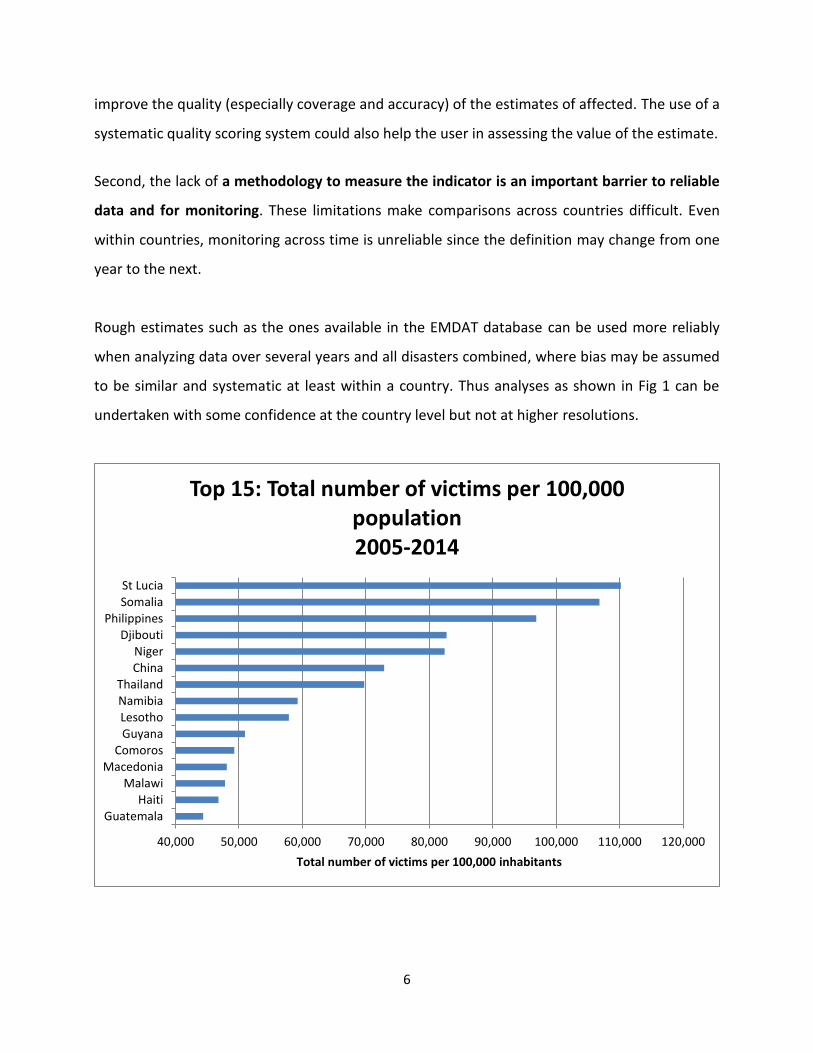
Rough estimates such as the ones available in the EMDAT database can be used more reliably
when analyzing data over several years and all disasters combined, where bias may be assumed
to be similar and systematic at least within a country. Thus analyses as shown in Fig 1 can be
undertaken with some confidence at the country level but not at higher resolutions.
40,000 50,000 60,000 70,000 80,000 90,000 100,000 110,000 120,000
GuatemalaHaiti
MalawiMacedonia
ComorosGuyanaLesothoNamibiaThailand
ChinaNiger
DjiboutiPhilippines
SomaliaSt Lucia
Total number of victims per 100,000 inhabitants
Top 15: Total number of victims per 100,000 population 2005-2014
7
3.0 Initiatives and Approaches: Selected examples
Several groups have worked on new thinking and original methods to improve the quality of
disaster data. The following section gives an overview of only some of the different efforts.
3.1 Definitions and data collection methods
A major contribution to the efforts to define disaster-affected was made by the Comisión
Económica para América Latina y el Caribe (CEPAL) and the Pan American Health Organisation
(PAHO) which undertook an excellent analyses of ways to define disaster impact data and
proposed pragmatic ways to measure disaster-affected (ECLAC, 2004) . They broadly defined
disaster-affected but then divided them clearly into operationally useful sub-categories as
follows.
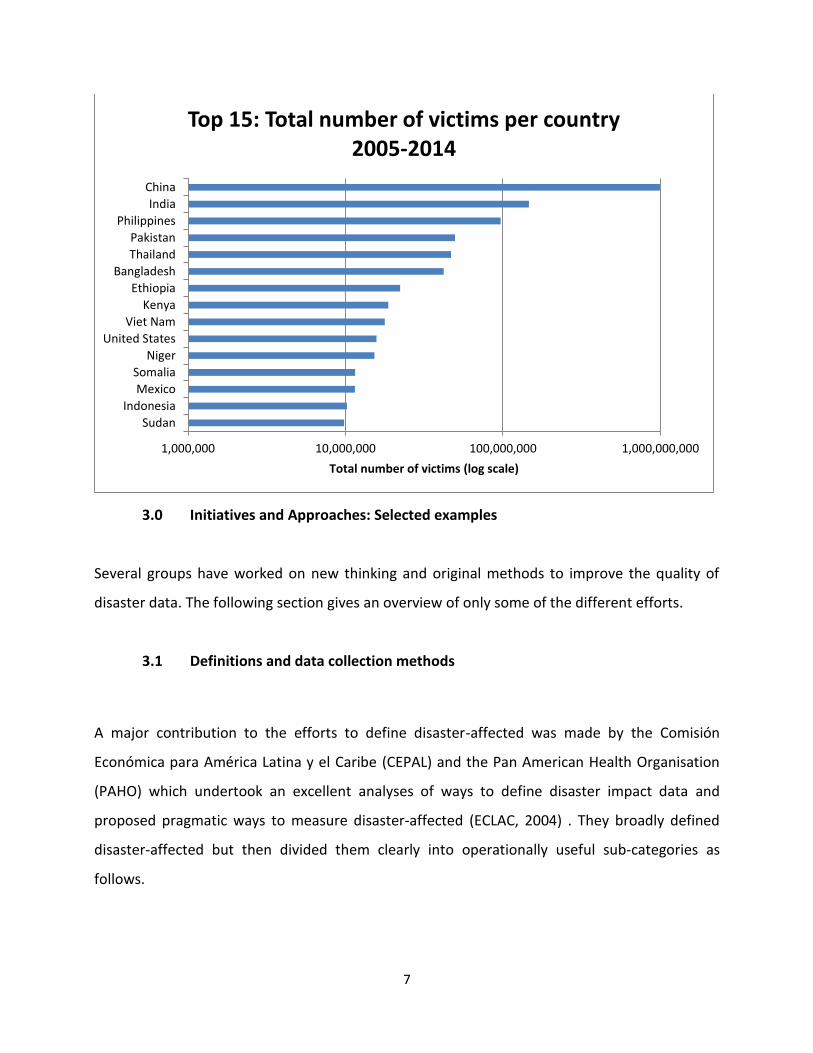
1,000,000 10,000,000 100,000,000 1,000,000,000
Sudan
Indonesia
Mexico
Somalia
Niger
United States
Viet Nam
Kenya
Ethiopia
Bangladesh
Thailand
Pakistan
Philippines
India
China
Total number of victims (log scale)
Top 15: Total number of victims per country 2005-2014

8
First, the primary population is in the direct path of the disaster and suffers the direct effects
(death, homelessness, injury) of the disaster. Next, the secondary population is near the path
of the disaster and suffers the indirect effects of the event. These persons may include care
givers to the disaster-affected and family and neighbors who take in the homeless. Third,
tertiary population is outside of the disaster zone but is affected by the disaster, e.g. through
injury or other damages due to panic, loss of essential medical or social services, or any other
severe disruption or inconvenience due to the disaster.
CEPAL provided guidance on data requirements and underscored the importance of the need
for precision in enumerating the entire disaster-affected population ensuring the age, sex, and
ethnicity of the individual being enumerated.
More recently, the Assessment Capacities Project (ACAPS) produced an excellent technical brief
based on a previous desk review. It provides practical field level guidance on how to select and
use suitable methods when conducting a population estimation exercise (ACAPS, 2012).
3.2 Surveys
Persuasive evidence (but admittedly, not the most time efficient method) to assess disaster-
affected population are from sample surveys. The most robust approach, familiar to social
scientists, epidemiologists and statisticians, is representative sampling: that is selecting a
disaster disaster-affected subgroup to gain information about the entire population of disaster-
affected. In the last decade the use of spatial, geographic information system (GIS), remote
sensed and GPS techniques are increasingly used to identify a sampling frame in post disaster
and post conflict settings (Noji, 2005). Standardized Monitoring and Assessment of Relief and
Transitions (SMART) surveys undertaken by NGOs and some specialized UN agencies are also
good examples of the use of survey designs to assess impact.

9
3.3 Geo spatial techniques for estimating affected areas and populations
As spatial technology is increasingly available and user-friendly and GIS expertise is on the
increase, countries have been exploring these channels to by-pass ground data collection. In
2007, the US National Academy of Sciences led by Susan Cutter convened an Expert Group on
assessing populations at risk of disasters using population estimating tools (Committee on the
Effective Use of Data, 2007). Although not strictly speaking focused on disaster-affected but
rather on potentially disaster-affected, the group’s conclusions are very relevant, systemic and
cost efficient. They proposed research on the better use of spatial databases, to identify
populations at risk through a global grid of quadrilateral areas of specified size. They also
suggested proxy measures using remotely sensed imagery to improve population estimates and
locations for areas where little reliable information exists. Socio-economic information on the
communities disaster-affected is nearly impossible to obtain directly from remotely sensed
imagery but social status of area residents by interpreting characteristics such as building size,
amenities such as vegetation and road networks may be indirectly inferred.
A wide-ranging and insightful review of spatial techniques for assessing population disaster-
affected and disaster footprints by Albert et al. (2012), concluded that a promising option was
the Population Explorer, that uses Land Scan population distribution to estimate local
population and demographic composition of the disaster-affected area to users (Jordan et al.,
2012).
A good example of an approach that balances both soundness of the basic conceptual frame
and the complexity of data needs was used for Typhoon Ketsan in the Philippines (Gorokhovich
and Doocy, 2012.). GIS-based environmental vulnerability models derived from cyclone advisory
data and Shuttle Radar Topographic Mission (SRTM) global data set, coupled with pre-disaster
population data from the Global Rural Urban Mapping Project was overlaid on vulnerability
models to produce total affected population. They also tested a vulnerability index score that
incorporates both the area and population at risk.
10
3.4 Telecommunications and crowd sourcing
More recently, telecommunications options have proliferated for information sharing. Social
networks and mobile phone technology are explored to crowd source information from
disasters where access to victims is difficult. A good example is the application of the Ushaidi
open-source crisis-mapping software in Haiti which gathered Information through social media
(e.g. Twitter and Facebook) and text messages sent via mobile phones.
Here efforts to harness crowd sourced information on who is disaster-affected where and how
resulted in vast quantities of information available to anyone with an Internet connection.
Challenges arose in verifying the volume of reports for which ad hoc solutions were found in
Haiti. Although the exercise was aimed at providing immediate information for relief response
to the disaster-affected, some use of this data once it is verified, could contribute to assessing
the final numbers of disaster-affected (Heinzelman and Waters, 2010)
3.5 Models
Modelling the risk and the potential impact is a promising option for projections and for regions
where data is largely missing, although the modelled values will be as good as the data used to
generate them and the conceptual soundness of the parameters.
There are two financial and insurance related models which may not bring any direct
contribution to the discussion on estimating disaster-affected population but some of their
thinking and approaches could usefully inform this process.
The International Institute for Applied Systems Analysis (IIASA), Austria, which enjoys as well
established expertise in catastrophe loss modelling mainly oriented towards the upper and

11
middle income economies, developed Integrated Catastrophe Risk Management model (CRIM)4.
The model assesses losses in the financial sector and proposes effective insurance coverage
(Cardona et al., 2012), and was used in Russia and Italy. Although the model designs optimal
portfolios of financial instruments in catastrophe management, it also accounts for
vulnerabilities and numbers of victims and could potentially contribute methodological inputs
for a global methodology.
The Comprehensive Approach to Probabilistic Risk Assessment (CAPRA) developed in the
University of Colombia, Manisales models losses (mainly earthquakes) on exposed elements
using probabilistic metrics, such as the exceedance probability curve, expected annual loss and
probable maximum loss, for multi-hazard/risk analyses. It may be used to design risk transfer
instruments, probabilistic cost-benefit ratios of the risk mitigation strategies, such as building
retrofitting. Its use for estimating or projecting affected populations need to be further
explored.
Both of the above are directly oriented towards financial instruments and require data inputs
that are probably quite demanding for most countries. But lessons on ways to estimate affected
populations could be drawn from these models.
The United States Geological Survey (USGS) runs a model focused on earthquakes estimating
expected deaths and affected through shake maps and historical data. The Prompt Assessment
of Global Earthquakes for Response model (PAGER) has been used for years for earthquake
impact simulation and provides not only the shake maps, estimates of houses destroyed and
deaths within hours of the event. Their outputs feed directly into the decision making process of
Office of U.S. Foreign Disaster Assistance (USAID/OFDA), the Disaster risk Reduction (DRR) and
the Disaster risk management (DRM).
4 http://www.iiasa.ac.at/web/home/research/researchPrograms/EcosystemsServicesandManagement/CRIM-
Model.en.html
12
Finally, simpler models have been proposed using straight forward linear regression models by
OXFAM-UK. This model forecasted on average over 375 million people per year are likely to be
affected by climate-related disasters by 2015 - over 50% more than have been affected in an
average year during the previous decade (Ganeshan and Diamond, 2009). The model used a
technique called Double Exponential Smoothing’, which gives higher weights to recent events
compared to those in the past. However, such time series analytical models depend of the
quality of data, frequencies of occurrence of disasters, length of series and, overall, are sensitive
to the (sometimes very high) annual variations of disaster impacts on populations and
economies. Because of these limitations, their use at a country level is sometimes controversial.
4.0 Conclusions
Capturing the human impact of disasters is unquestionably useful to inform development
programmes especially in countries such as East Asia or East Africa where extreme climate
events are very frequent. Since disaster-affected is a commonly used indicator of impact,
challenges of definitions and measures need attention and should draw on past experience on
what has worked and what has not.
1. First, we need clear guidance on measurable definitions of the disaster affected. Along with
the definition, methods to measure this indicator and the interpretation of the result will
make it practical for the development community to actually undertake this exercise.
Statistical techniques to impute missing data exist and are widely used in many different
fields including demography and epidemiology but have yet to be used for disaster impact.
This exercise should draw expertise not only of disaster specialists but also of professional
statisticians, demographers, epidemiologists, development focused econometricians.
National experts from these disciplines will ensure pragmatism on what can or what cannot
be realistically achieved at local levels.
Softwares are an important link in the chain for easy data entry and analyses but should only
developed once the concepts, definitions and methods are fully developed.

13
2. Second, the impact of disasters is a development issue and successful development
programme will have the strongest effect on reducing the impact of disasters. Short data
modules to capture more accurately those affected by disasters could be included in the
large scale surveys such as Demographic and Health Surveys (DHS), Multiple Indicator
Cluster Survey (MICS), World Bank (WB) livelihood surveys. This would effectively capture
the impact on health, nutrition, education and livelihood and be relevant for Disaster risk
reduction (DRR) and Disaster risk management (DRM) purposes.
3. Third, small scale sentinel surveys for disaster impact indicators can be envisaged for priority
countries. These would provide overall estimates but also generate data on disaster related
rural-urban migration, effects on livelihoods and educational attainment. Data on this would
make a central contribution to evaluate progress on sustainable development.
4. Finally, nontraditional sources of data especially from regions where communities are
remote, living in insecurity and data collection on limited, resources for data collection
should be harnessed. NGOs are increasingly competent for surveys and they should be
drawn in to contribute to this process. Remote sensed and GIS technology have high
potential and should be further used.
Bibliography
Albert D.P. (ed.) (2012) Geospatial Technologies and Advancing Geographic Decision Making: Issues and Trends. IGI Global, 2012, 423 p. Assessment Capacities Project (2012) Estimation of affected population figures. Technical Brief ACAPS, 30p. Baez J.E. and Santos I.V. (2007) Children’s Vulnerability to weather shocks : A natural disaster as a natural experiment, 47p. Cardona O.D., Ordaz M.G., Reinoso E., Yamín L.E. , Barbat A.H. (2012) CAPRA - Comprehensive Approach to Probabilistic Risk Assessment: International Initiative for Risk Management Effectiveness; 15WCEE, Lisboa, 10p.

14
Coffman M. and Noy I. (2009) A Hurricane’s Long-Term Economic Impact: the Case of Hawaii’s Iniki. University of Hawaii at Manoa, Department of Economics, Working Paper No. 09-5, 22p. Committee on the Effective Use of Data, Methodologies, and Technologies to Estimate Subnational Populations at Risk, National Research Council (2007) Tools and Methods for Estimating Populations at Risk from Natural Disasters and Complex Humanitarian Crises. National Academy Press, 264p. ECLAC Subregional Headquarters for the Caribbean (2004) The affected population in : Disaster Assessment Training manual for SIDS (DATM), pp.59-76. Fergusson D. M., Boden J. M., Horwood L. J., Mulder R. T. (2014). Perceptions of distress and positive consequences following exposure to a major disaster amongst a well-studied cohort. Australian & New Zealand Journal of Psychiatry. Advance online publication. doi: 10.1177/0004867414560652 Ganeshan S. and Diamond W. (2009) Forecasting the numbers of people disaster-affected annually by natural disasters up to 2015; Oxfam GB, 10p. Gorokhovich Y. and Doocy S. (2012) Rapid Estimation of Areas and Populations affected by Typhoon Ketsana in the Philippines. Department of International Health, Johns Hopkins Bloomberg School of Public Health, Baltimore, 6p. Guha-Sapir D. and Below R. (2006) Collecting Data on disasters: Easier said than done, Asian Disaster Management News, 12 (2), 9-10.
Heinzelman J. and Waters C. (2010) Crowdsourcing crisis information in disaster-affected Haiti; United States Institute of Peace, Special Report 252, 16p.
Jahan M. (2012) Impact of rural urban migration on physical and social environment: the case of Dhaka city. International Journal of Development and Sustainability; 1 (2), 186-94.
Jordan L., Watkins B., Biegon P., Mwangi M. Rose R. (2012). Practical Approaches to Spatial Estimation of Disaster-Affected Populations in : Albert D.P. (ed.) Geospatial Technologies and Advancing Geographic Decision Making: Issues and Trends; pp.205-22.
15
Noji E.K. (2005) Estimating population size in emergencies (Editorial), Bulletin of the World Health Organization, 83 (3): 164 Rodriguez-Oreggia E., De La Fuente A., De La Torre R., Moreno H.A. (2013) Natural Disasters, Human Development and Poverty at the Municipal Level in Mexico. Journal of Development Studies, Vol 49, Issue 3, 442-455 Rodriguez-Llanes J.M., Ranjan-Dash S., Degomme O., Mukhopadhyay A., Guha-Sapir D. (2011) Child malnutrition and recurrent flooding in rural eastern India: a community-based survey, BMJ Open 1(2) { e00019. doi: 10.1136/bmjopen-2011-000109} Rodriguez-Llanes J.M., Ranjan-Dash S., Mukhopadhyay A., Guha-Sapir D. (2015) The role of parental education on child wasting and stunting in post-flood settings: a population-based cross-sectional study in rural Odisha, India (publication forthcoming) Sultana Naznin Nahar, Nath Biswajit, Das Apu Kumar, Islam Hiamul (2014) Migration pattern and everyday life of slum people: A study on Chittagong city. International Journal of Physical and Social Sciences, 4 (4): 272-88. United Nations Economic and Social Council (2013) Enhancing regional cooperation for building resilience to disasters in Asia and the Pacific. E/ESCAP/69/L.12
(http://www.unescapsdd.org/files/documents/Res-69-12%20Disasters.pdf)