estimating the ‘coordinated effects’ of … · (2004)), multi-product firms, competitive...
TRANSCRIPT

ESTIMATING THE ‘COORDINATED EFFECTS’ OF MERGERS
Peter DavisCristian HuseJanuary 2010

1
Estimating the ‘coordinated effects’ of mergers*
Peter J Davis
** Cristian Huse***
Competition Commission UK Stockholm School of Economics
January 2010
Abstract
Mergers can be blocked if they increase the likelihood of coordination. This paper presents the first empirical coordinated effects merger simulation model in a differentiated product market. We study the network server market. We find that the incentives to coordinate actually fell as a result of the merger between Hewlett Packard (HP) and Compaq and show, contrary to conventional economic logic, that incentives to coordinate will ceteris paribus often fall in this way after a merger. We extend the model to empirically examine the impact of multi-market contact, a competitive fringe, and the presence of an antitrust authority imposing punishments on tacit colluders in the form of fines.
Keywords: antitrust, mergers, coordination, coordinated effects, joint dominance, network servers, computers, oligopoly, differentiated products.
JEL classification: L1, L4, L63.
1. Introduction
This paper empirically evaluates the incentives firms face to tacitly collude in differentiated product markets and how they change following a merger. Both academics1 and regulators2 have recognized that mergers can potentially facilitate tacit collusion by changing the incen-tives firms face when setting prices.3
*The views expressed in this paper are solely those of the authors and are not approved or endorsed by the UK Competition Commission. We are deeply indebted to John Van Reenen, who began this project with us and, among many contributions, provided the data on the network server industry. We also thank Louise de Villiers for providing us with useful information on network servers. In addition, for helpful comments and suggestions we would like to thank Marcus Asplund, Joe Harrington, Margaret Levinstein, Otto Toivanen, Frode Steene and numerous other seminar participants including attendees at the 10th Annual CEPR Conference on Applied IO, EEA, EARIE, NIE and a number of European competition agencies. All remaining errors are of course our own.
**Email address: [email protected] . Correspondence address: Competition Commission, Victoria House, Southampton Row, London WC1B 4AD, UK. ***Email address: [email protected]. Correspondence address: Stockholm School of Economics, Department of Finance, Box 6501, SE-113 83 Stockholm, Sweden. 1Chamberlin (1929) argued this point informally, while Stigler (1964) and Friedman (1971) formalized this intuition in the theory of repeated games. Following Stigler (1964), in order to sustain collusion firms must be able to (i) come to an agreement (which can be difficult when products are complex and differentiated), (ii) monitor each other’s behaviour (in order to detect under-cutting) and, of course, (iii) enforce collusive behaviour collectively by punishing the cheating firms. See Aumann (1985, 1989) and Mertens (1987) for surveys. 2See, for example, the EU, UK or US Horizontal Merger Guidelines. 3Recent examples where antitrust authorities have invoked the theory of coordinated effects when attempting to block mergers include the Nestlé–Perrier, Kali and Salz, Gencor–Lenrho, Airtours–First Choice and Sony–BMG cases in the EU jurisdiction, Safeway, Smith–Linpac and Wienerberger–Baggeridge Brick in the UK and Cruise Ships Hospital Corporation and Arch Coal in the USA. See Nestlé–Perrier [1992] OJ L356/1 Case No IV/M.190, decision dated 22 July 1992. Kali and Salz Joined Cases C-68/94 and C-30/95, France and Others v Commission ('Kali & Salz'), judgment of 31 March 1998. Gencor–Lenrho Case No IV/M. 619 decision dated 24 April 1996. Airtours–First Choice Case No IV/M.1524 decision dated 11 September 1999. And judgment of the Court of First Instance, T-342/99 dated 6 June 2002. Sony–BMG Case No Comp/M.3333 decisions dated 19 July 2004 and 3 October 2007. As well as judgment of the Court of First Instance T464/04 (Impala v Commission) which annulled the first Commission decision and the judgment of the ECJ which set aside the ‘Impala’ judgment of the CFI C233/10. Safeway Plc/Tesco/Asda/Sainsbury/Wm Morrison (2003). See www.competition-commission.org.uk/inquiries/completed/2003/safeway/index.htm and DS Smith plc/LINPAC Containers Limited (2004) and

2
The intuition that mergers can result in coordinated effects is often described using Friedman (1971). For example, in a high-profile recent report for DG Competition, Ivaldi, Jullien, Rey, Seabright and Tirole (2003) follow most industrial organization textbooks and argue that if N is the number of firms, δ is the discount rate and firms follow grim strategies, then that collusion will be sustainable with N symmetric firms if
DefectionNash
defectionmonopoly
Collusion VN
V =−
+>−
=)1()1( δ
δππδ
π
where Nashπ and defectionπ respectively represent the profits to a firm under static Nash behaviour and to a firm which is assumed to successfully cheat for one period. Since an individual firm’s share of monopoly profits is declining in N, this relationship suggests that generically mergers, falls in N, will make coordination easier to sustain. As we shall describe, our empirical results found the opposite to be true and so we considered the extent to which this intuition is in fact helpful for policy makers. In what follows, we show that this intuitive result is, in large part, misleading for differentiated product markets. Moreover, the elemen-tary version of this theory will generally predict precisely the opposite—that mergers will make tacit collusion harder to sustain, not easier. We establish this theoretical result in Proposition 1 and discus the intuition for our results there.
Empirically, our strategy is to construct an empirical model following a number of central aspects of Friedman (1971) closely, notably by assuming grim strategies (rather than optimal punishments; Abreu (1986, 1998); Abreu, Pearce and Stachetti (1990)). However, we must generalize the textbook model in a number of important directions before taking it to data.4
Our research builds on and contributions to three significant literatures. First, we build on the empirical literature on unilateral effects merger simulation (UEMS).
Specifically, we allow for asymmetric (firm-specific) discount factors (Harrington (1989)), asymmetric costs (Rothschild (1999), Vasconcelos (2005)), product differentiation (Kuhn (2004)), multi-product firms, competitive fringes and multimarket contact (Bernheim and Whinston (1990)). On the other hand, in our empirical example we do not observe data on capacities so we do not explore asymmetry in capacities in this paper (Lambson (1996), Compte, Jenny and Rey (2002)).
5 The UEMS literature uses the Bertrand differentiated product model as its benchmark model and we shall use that underlying model as the stage game of our coordinated effects model.6
Second, we build on the empirical literature attempting to evaluate the conduct of firms using game-theoretic pricing models.
7
- - - - - - - - - - Wienerberger Finance Service BV/Baggeridge Brick plc (2007). Royal Caribbean Cruises LTD/P&O Princess Cruises Plc and P&O Princess Cruises Plc /Carnival Corporation FTC File no 0041. Hospital Corp of America v FTC, 807 F.2d 1381, 1386 (7th Cir. 1986). FTC v Arch Coal, Inc, 329 F. Supp 2d 109 (DDC 2004)
This literature considers prices predicted by collusive and Nash equilibria and evaluates which model better predicts observed market outcomes. Corts (1999) critiqued this empirical literature arguing that the mapping between the empirical test of collusive behaviour and the underlying theory of collusion was incomplete. Our paper
4Friedman’s model makes a number of important and certainly unrealistic assumptions, most notably that firms benefit from complete information. Even so, since Friedman’s model forms the basis of analysis in both textbooks and, at least in significant part, law—via the ‘Airtours’ tests introduced by the Court of First Instance (CFI) in the Airtours judgment in Europe, we consider that empirically exploring the economics of this benchmark model is a useful contribution. Future empirical research will, of course, need to explore coordinated effects merger simulation in incomplete information settings. 5This literature has evolved over the last two decades following the work of Davidson and Deneckere (1985), Farrell and Shapiro (1990), Baker and Bresnahan (1999), Hausman et al (1994) and Nevo (2000). 6In addition to the UEMS literature, the model has also been used in models to evaluate vertical integration and restraints. See Brenkers and Verboven (2006), Dubois et al (2006, 2008), Villas-Boas (2007) and most recently DG-Comp’s decision in the TomTom–TeleAtlas case (2008). 7See, in particular, Gollop and Roberts (1979), Roberts (1983), Suslow (1986), Bresnahan (1982, 1987), Nevo (2001), Slade (2002) and Salvo (2004).

3
takes a modest step towards addressing that criticism by taking an actual model of tacit coordination to data.
Third, we build on the (primarily theoretical) literature on tacit coordination under asymmetry. Harrington (1989) considers the role of asymmetric (firm-specific) discount factors. Lambson (1994, 1996) studies asymmetric capacities in homogenous product industries and argues that slight asymmetries can reduce the danger of tacit coordination because the firm with greater capacity may have the greatest incentive to undercut its rivals (cheat) and also the greatest ability to punish deviation by others. Compte, Jenny and Rey (2002) explore this logic in greater detail and argue that asymmetric capacities can indeed make collusion more difficult to sustain when aggregate capacity is limited. Vasconcelos (2005) extends Rothschild (1999) and Harrington (1991), and argues that the smallest firms (in his case the highest-cost firm) are the most difficult to induce to coordinate while the largest ones are hardest to induce to credibly punish.8
Kühn (2004) provides an important theoretical contribution to this literature as the first paper to study differentiated product markets. He finds that the economic forces at work are similar to Vasconcelos (2005) in that, all else equal, small firms may be hardest to incentivize to coordinate while large firms may be hardest to induce to punish credibly, since they will suffer most from severe punishment periods
We follow Kühn (2004) in studying the Bertrand differentiated product game. In some elements he studies a richer context than we do, for example allowing for optimal symmetric punishment schemes following Abreu, Pearce and Stachetti (1990) while we study only grim strategies. He also considers the highest feasible collusive price while we study various forms of perfect coordination, although not always involving all firms in the industry. On the other hand, Kühn makes a number of considerably stronger assumptions than we do, which make his model difficult to use for empirical work. For instance, he considers only symmetric in prices demand systems, discount factors that are common across firms and constant marginal costs that are equal for all (differentiated) products. Such assumptions facilitate theoretical analysis but are restrictive. For example, the consequence of these assumptions is that under coordination the price per product will be identical for all brands while Nash price asymmetries are heavily constrained. In contrast, we use demand structures, discount rates and marginal costs that may be highly asymmetric and, as a result, firms will frequently choose prices to be highly asymmetric in both Nash and collusive equilibria. Despite the generality of the setting, our theoretical results are far simpler to prove than those provided in the earlier literature and also allow us to study arbitrary concentrations in product owner-ship structures. Thus, the context and theoretical results are substantively different, but—unsurprisingly in retrospect—our results share a considerable amount of economics and intuition with both Kühn and Vasconcelos. In addition, of course, our primary focus is to provide a full empirical analysis of a real-world case.
In terms of applied papers, Kovacic et al (2007) suggest empirically investigating the profit-ability of coordination relative to Nash outcomes in order to evaluate the incentives to coordinate. Davis and Sabbatini (2010) note that this is one aspect of the incentive to coordinate according to the theory of repeated games and suggest undertaking coordinated effects merger simulation to consider the implications of incentive compatibility constraints; they explore a linear differentiated product demand model numerically. In addition, a number of the theoretical papers discussed above include numeric simulations. For example, Compte, Jenny and Rey (2002) calibrate their model with the data from the Nestlé–Perrier
8In essence: (1) a fully collusive agreement might involve allocating a small share, or in extremis, actually involve shutting down an inefficient producer’s plant and so, absent side payments, such outcomes will not be incentive compatible for these ‘small’ firms. And (2) Vasconcelos (2005) agrees with Compte, Jenny and Rey (2002) that in a punishment phase it will be the largest firm which is proportionately most penalized in a punishment period and so who will find harsh punishment strategies hard to find incentive compatible.

4
case while Kuhn (2004) considers a duopoly model numerically and examines a number of issues including multimarket contact.
The rest of the paper is organized as follows. In Section 2, we describe the network server industry. Section 3 sets the framework for evaluating the incentives to collude. In Section 4, we describe the data, while Section 5 discusses the implementation of the model. Results are presented in Section 6.
2. The network server industry
Servers are computers that provide resources (such as software and files) with other, client, computers on a computer network.9
Gartner Group (2008) report that global sales in 2007 were $55 billion on a volume of 9 million units. Globally, IBM, HP-Compaq, Sun and Dell jointly achieve over 75 per cent of world revenues (see Table 1) with financial corporations, the communications sector and Government respectively responsible for 25, 14 and 11 per cent of purchases.
Servers are often deployed to run round the clock to tackle critical computing tasks such as keeping track of a retail chain’s sales, managing a customer database or reconciling stock transactions. Servers range from high-end Unix servers, with numerous processors and multimillion-dollar price tags, to comparatively inexpensive Intel-based machines running a Linux or Microsoft Windows operating system used, for instance, to power small local area networks.
10 Network servers have also been at the centre of a number of recent competition policy debates, most notably the European Commission’s decision in 2004 against Microsoft.11
TABLE 1 Market shares in the world server market
1999 2001 2002 2007 Firms Sales Units Sales Units Sales Units Sales Units
IBM 28.3 17.3 29.0 15.0 31.1 14.3 31.1 14.5 HP 14.4 12.3 26.6 9.7 25.2 30.1 28.3 29.8 Compaq 14.0 28.0 16.0 23.3 - - - - Sun 14.0 5.2 15.4 5.8 15.1 6.0 10.8 3.8 Dell 4.1 11.7 6.5 16.1 7.5 18.5 11.4 21.4 Others 25.2 24.9 6.5 30.1 21.1 31.1 13.9 27.1 Market revenue US$48.5bn US$47.0bn US$43.1bn US$54.8bn Market shipments 3.4m units 4.4m units 4.6m units 8.8m units
Note: Data from Gartner Group (2000, 2002, 2003, 2008). Figures reported under sales and quantity are, respectively, revenue- and quantity-based market shares, illustrating the different presence of the players across market segments. Market shipments report the number of units sold in a given year worldwide.
More firms compete in the low-specification end of the market than at the higher end; low-end servers tend to be less differentiated and based on more standard designs, such as Intel-based platforms. Some smaller players produce high-end products, but usually only in very specific market niches such as technical computing and visualization.
The second half of the 1990s was marked by a series of mergers and acquisitions in the network server industry—see Table 2. HP’s acquisition of Compaq was the highest profile.
9For a basic discussion of servers see, for example, Sybex (2001). See Bresnahan and Greenstein (1996) for an economic analysis of the transition from mainframe-based systems to the now dominant ‘client-server’ computer architecture. 10Gartner Group (2007). 11In March 2004, the European Commission found Microsoft guilty of violating the EU competition legislation and fined it €497 million, the biggest-ever fine in an EU competition case. The European Commission argued that Microsoft took advantage of its Windows virtual monopoly, unfairly leveraging its dominance over PC operating systems into other markets, especially the market for servers and media player software. In the server market the allegations were that Microsoft was not allowing easy interaction between computer servers using a Windows OS and applications from vendors other than Microsoft itself. Microsoft subsequently appealed DG-Comp’s decision to the CFI, who upheld, in large part, the decision in 2008.

5
Other acquisitions include those of Sequent (by IBM), Data General (by EMC), DEC and Tandem (each by Compaq) and the Fujitsu-Siemens joint venture.
Market consolidation since the mid-1990s may have resulted from the falling prices of servers. Market observers attribute falling prices to both demand shocks12 and a process of commoditization.13 Van Reenen (2006) estimates the yearly quality-adjusted price fall for servers to be of the order of 30 per cent between 1996 and 2001 in the USA (and about 22 per cent in Western Europe).14
HP and Compaq formally announced their plans to merge on 4 September 2001—see Table 2—in a deal valued at approximately $25 billion.
Increasing concentration and product commoditization together with significant falls in price can sometimes result in mergers and also, on occasion, firms resorting to attempts at coordination.
15 At the time, Compaq ranked first in worldwide server sales. The prevailing view at the time of the merger was that Compaq could help HP with additional market share in both desktops and servers, and enable a ‘substantial additional presence’ in the service market, given its prior acquisition of DEC.16,17
Such a global merger required clearance in a number of jurisdictions and the merger was ultimately cleared in all markets where it underwent scrutiny. The Canadian Competition Bureau, European Commission and FTC respectively cleared the merger in December 2001, early 2002 and March 2002. Investigators focused on the markets for PCs, servers, PDAs, storage solutions and services.
3. Evaluating the incentives to collude
3.1 Qualitative analysis of coordinated effects in the HP–Compaq merger
Following Chamberlin (1929) and Stigler (1964), economic theory, antitrust merger guide-lines and court judgments (in particular Airtours) have argued that whether firms can tacitly sustain coordinated prices depends on a number of factors. Specifically, Stigler (1964) argues that in order to sustain coordination firms must be able to (i) come to an agreement (which can be difficult when products are complex and differentiated), (ii) monitor each other’s behaviour (in order to detect undercutting) and, of course, (iii) enforce coordinated behaviour collectively by punishing the cheating firms and keep rivals out.
12The ‘Millenium Bug’ meant extensive new equipment purchases at the end of the 1990s, suggesting positive demand shocks in the late 1990s. That extra demand was temporary and its removal together with the availability of quality used equipment from bankrupt Internet companies in the early 2000s and uncertainties regarding the economic outlook led to a temporary slowdown in ICT spending and, in particular, on server purchases. IDC (2002) reports that ‘[t]he fallout from the dot-com bubble and the ”perfect storm” in the IT industry that preceded it caused the worldwide server market to decline by nearly 20 per cent in 2001’. 13For example, evidence of competition can be seen in both the high-end server arena, where in early 2001 Sun introduced its newest line at half the price of comparable IBM products, and at the lower end of the market, where Dell and Compaq, the top two Windows server sellers, were reportedly involved in a price war to keep market share. Gartner Group (1999) documents that US revenues dropped by 4.3 per cent, whereas shipments grew by 15.9 per cent from 1997Q4 to 1998Q4. 14Even before making any adjustments for quality increase, van Reenen (2006) reports price falls of about 10 per cent in the USA in the period 1996 to 2001. 15Although the value of the deal on completion was closer to $19 billion. 16See www.hp.com/hpinfo/abouthp/histnfacts/ for details of HP’s history. 17According to Reuters, ‘[b]road hints from HP and a look at market share led industry observers to conclude that HP would use Compaq’s well-regarded storage system and its NT servers, low-end network computers that run Microsoft Windows, in stitch-ing together its product line-up. The combined company was also expected to use HP’s own high-end Unix servers and Compaq’s mainframe-style computer, the (Tandem) Himalaya’. See: www.reuters.com/article/filmNews/idUSN0245554920020322.

6
TABLE 2 Key events in the network server industry, 1996 to 2002
Date Event
1996 February Cray acquired by SGI (Silicon Graphics); Packard Bell acquired by NEC, inter alia
July Sun acquires Cray Business System Division from SGI
1997 June Tandem acquired by Compaq
August AST Research acquired by Samsung
1998 June DEC (Digital) acquired by Compaq
1999 April Eckhard Pfeiffer resigns as Compaq’s CEO
June Joint venture creates Fujitsu Siemens
August Data General announced being acquired by EMC
September Intergrah exits PC and server business; Sequent acquired by IBM
2000 March SGI sells Cray to Tera Computer
April Tera Computer renamed Cray Inc
2001 September HP and Compaq announce plans to merge; Moody’s downgrades HP debt; Standard & Poors puts HP on negative outlook
December HP-Compaq merger cleared in Canada
2002 January HP-Compaq merger cleared by EU DG Competition
March US FTC clears HP-Compaq merger; HP and Compaq shareholders approve merger
May Compaq becomes part of HP; new HP-Compaq officially launched
Agreement
The server industry involves a significant number of large players, but with a material competitive fringe of smaller firms. The distribution of brands and market shares varies across time and markets, but participants in our dataset include AST, Acer, Apple, Compaq, Data General, Dell, Digital, Fujitsu, Gateway, HP, Hitachi, IBM, Micron, Mitsubishi, NCR, NEC, Siemens, SGI, Sun, Toshiba, Unisys and VA Linux. Most firms are multiproduct firms and so the number of products is substantial. In our dataset, a single geographic market has a maximum of 222 products for sale in a single quarter.18 At face value, such a large number of differentiated products appear to make the problem of agreeing on a tacitly collusive outcome very difficult in this industry. On the other hand, much of the product heterogeneity may not be greatly valued by customers in the sense that firms may face elastic demands as consumers readily substitute across providers—at least within quality segments.19
In this paper, we will suppose that firms can achieve such an agreement, despite the con-siderable complexity even without the ability to meet to exchange information and/or audit each other’s accounts. However, we make this assumption cautiously and we do note that this is potentially an important caveat for our results, as well as an important area for future research. Ideally, we would like to be able to capture the way in which the number of dimen-sions of an agreement affects the likelihood of collusion but we leave such models for future research, except to note that the way in which prices are related to product characteristics may provide such a dimension-reducing solution for tacit coordinators (Lancaster, 1966, Gorman, 1955).
20
18The maximum number of products observed in our dataset was in Q3 of 2000 in the EU market area.
19There is clearly a big quality difference between a high- and a low-end server. However, it is less clear that consumers perceive significant differences across providers at a given point in the product quality spectrum. 20In the famous case involving GE and Westinghouse in electrical turbines, a published pricing book with formulae was used to help to map product characteristics to prices. Similarly, in the US airline industry the prospect of ‘per-mile’ pricing was allegedly used as a potential simplifying tool to facilitate a proposed tacitly-collusive arrangement.

7
Monitoring
One of the Airtours21 conditions is sufficient market transparency to ensure that all tacitly coordinating oligopolists would become aware ‘sufficiently precisely and quickly’ of the way in which other members’ market conduct is evolving. There is a considerable amount of publicly available market information about servers, since companies such as IDC and Gartner publish detailed quarterly information on shipments (quantities) and revenues by product by geographic region. This appears a considerably greater degree of transparency than was available in the Sony/BMG merger that was the subject of the Impala judgments by the CFI and subsequently by the ECJ.22
Industry associations, publications and conferences each also provide opportunities for informal communication and/or intelligence gathering. There is also a considerable degree of multimarket contact and firms will often meet in forums, such as standard-setting organiz-ations, as well as sometimes explicitly and legitimately cooperating through joint ventures.
That said, even this information must be treated carefully as at least some information is collated from voluntary reports from companies which can have incentives to either over- or under-report sales.
23
Enforcement
There are two aspects to stability of tacit coordination, internal and external stability which, respectively, apply to the ability of those tacitly colluding to sustain the coordinated out-come(s) and the inability of those not tacitly colluding to gain by disrupting it. In this paper we focus primarily on techniques that can help evaluate these aspects of a tacitly coordinating theory of harm. One of the Airtours conditions24 was that tacit collusion must be sustainable over time and the CFI noted that some notion of retaliation was ‘inherent’ in this condition.25
We begin with two observations in relation to the HP–Compaq merger. First, while there are a number of market features that potentially facilitate coordination in the server industry and others hindering it, neither the DOJ/FTC nor DG-Comp reported seriously considering a
Retaliation can take a number of forms, from a reversion to Nash equilibrium to temporary price wars. (See Green and Porter (1984) and Porter (1983)’s analysis of the railroad Joint Executive Committee in the 1880s.)
21Case T-342/99, Airtours v Commission, CFI Judgment of 6 June 2002 (see in particular paragraph 62). ‘[F]irst, each member of the dominant oligopoly must have the ability to know how the other members are behaving in order to monitor whether or not they are adopting the common policy. As the Commission specifically acknowledges, it is not enough for each member of the dominant oligopoly to be aware that interdependent market conduct is profitable for all of them but each member must also have a means of knowing whether the other operators are adopting the same strategy and whether they are maintaining it. There must, therefore, be sufficient market transparency for all members of the dominant oligopoly to be aware, sufficiently precisely and quickly, of the way in which the other members' market conduct is evolving;’ 22In Sony/BMG and the appeals by Impala, the question before the courts was whether or not the fact that sales numbers were published weekly in Billboard Magazine was sufficient to establish a level of transparency that would enable a competition authority to consider blocking the merger, even though transaction prices between retailers and music distributors were not published. 23One such case is the NEC–Mitsubishi joint venture of computer monitors and LCD panels, agreed upon in September 1999, see http://findarticles.com/p/articles/mi_m0CGN/is_3750/ai_55805203. Another such example is the collaboration between HP and NEC to develop Internet protocol servers for the Japanese market agreed upon in July 1999. See www.hoise.com/primeur/99/articles/monthly/AE-PR-08-99-19.html. 24See also Gencor v Commission, paragraph 276. 25Case T-342/99, Airtours v Commission, CFI judgment of 6 June 2002 (see in particular paragraph 62). ‘[S]econd, the situation of tacit coordination must be sustainable over time, that is to say, there must be an incentive not to depart from the common policy on the market. As the Commission observes, it is only if all the members of the dominant oligopoly maintain the parallel conduct that all can benefit. The notion of retaliation in respect of conduct deviating from the common policy is thus inherent in this condition. In this instance, the parties concur that, for a situation of collective dominance to be viable, there must be adequate deterrents to ensure that there is a long-term incentive in not departing from the common policy, which means that each member of the dominant oligopoly must be aware that highly competitive action on its part designed to increase its market share would provoke identical action by the others, so that it would derive no benefit from its initiative (see, to that effect, Gencor v Commission, paragraph 276);’

8
theory of harm that the HP–Compaq merger could lead to coordinated effects. Second, there were no significant objections to the merger from rivals such as Dell, IBM and Sun.26
3.2 The benchmark model
Our benchmark model builds on Friedman (1971),27
The stage game
and appropriately generalizes it to allow for firm-specific discount factors, differentiated products, asymmetric costs and multiproduct firms.
The UEMS literature often uses the differentiated product Bertrand pricing game28
Jj ,..1= and we
do the same. Suppose there are J products indexed and Ff ,..,1= active firms. Denote firm f’s products as },..,1{ Jf ⊆ℑ and the one-period profits to firm f
∑ℑ∈
−=fj
jjjf pDcpp )()()(π
where jp and jc are respectively the price and constant marginal cost of product j. The
Nash equilibrium ),...,( 1NEJ
NENE ppp = for the stage game involves each firm choosing their
prices to maximize static profits, )(max}|{
pfjp fj
πℑ∈
given prices of rivals so that the J first-order
conditions for these F (static) problems can be written as:
0)(
)(*)(1
=∂
∂−∆+∑
=
J
j k
jjjjkk p
pDcppD k=1,..,J
where },|},..,1{{1 fjk kjFf ℑ∈∈∃=∆ is the indicator function taking the value one if products j and k are produced by the same firm and zero otherwise. Define the ‘ownership matrix’ Δ of dimension J by J with jkth element, jk∆ . Changing ownership structure amounts to changing Δ while a perfect cartel’s prices are calculated by setting every element of Δ equal to one. Nash and perfectly collusive prices are familiar objects in both the UEMS and conduct literatures. For compactness, we define the Nash equilibrium payoff to firm f as
)( NEf
NEf pππ ≡ and the one-period return to collusion by firm f as )( Coll
fCollf pππ ≡ where
∑=
−≡F
ffff
pp
Coll pppJ 1},..,{
),(maxarg1
π
26Capacity constraints can facilitate or hinder tacit collusion, perhaps resulting from the shortage of silicon (used to manufacture processors), processors themselves, or other components, such as memory and hard discs. However, we do not consider such issues further as we do not have data on either inventories or production capacities. In addition, future market growth can be relevant to an evaluation of the likelihood of tacit collusion in an industry. At the end of the period of our dataset, the ‘perfect storm’ in the IT industry led many observers to believe that the market for servers was expected to shrink. Research from Gartner Group in August 2001 argued that companies had overspent $1 billion on application server technology since 1998. Their report estimated that an additional $2 billion was expected to be overspent in the following two years, and recommended that companies be cautious when acquiring server technology. In Gencor/Lonrho, for example, market growth was noted as a factor that made collusion more difficult. Although interesting, our focus is elsewhere and so we have left these issues for future research. 27The model we present builds upon a vast literature in the last four decades. Notable contributions to the literature of repeated games include Abreu (1986), who studies symmetric Cournot repeated games, and Brock and Scheinkman (1985) and Lambson (1987), who investigate symmetric Bertrand repeated games. Davidson and Deneckere (1984) study how mergers impact collusion using trigger strategies and exogenous market sharing rules, starting from a setting with symmetric capacities and Bertrand competition. 28See Werden and Froeb (1994), Berry (1994), Hausman et al (1994), Berry, Levinsohn and Pakes (1995) and Nevo (2002).

9
where fp denotes the prices of all firm f products while fp− denotes the prices of products produced by all rival firms.29
The repeated game
Following Friedman (1971) we study sub-game perfect equilibria (see Selten (1965)) of the repeated game using grim strategies. The literature has subsequently explored a range of possible punishment mechanisms, including ‘simple penal codes’, as presented in Abreu(1988), and optimal punishment mechanisms à la Abreu, Pearce and Stacchetti (1990).30
Define the one-period ‘defection’ gain to firm f when all other firms are playing collusively as
),(max)(}|{
Collfffjp
Collf
Deff ppp
fj−ℑ∈− ≡ ππ
or, more compactly, Deffπ .
When rivals are playing grim strategies, a defector earns his one period defection payoff and then subsequently receives only his Nash equilibrium profits. The net present value (NPV) of a stream of future profits is:
∑∞
=
=0
)(t
fttfffV πδδ
so the NPV of anticipated returns to defection today for firm f is:
f
NEffDef
fDef
fVδ
πδπ−
+≡1
.
Notice that we allow for firm-specific discount factors, following, for example, Lehrer and Pauzner (1999), since investors may require a higher rate of return from particular companies, eg late entrants or those following new business models. The NPV payoff to collusion today and in all subsequent periods given that rivals continue to collude is
f
CollfColl
fVδ
π−
≡1
.
Hence, firm f has no incentive to deviate from collusive pricing provided that:
29Davis and Sabbattini (2010) consider a range of other potential definitions for collusive prices. Specifically, we may alterna-tively define collusive prices as those which maximize the sum of colluding firms’ profits subject to the incentive compatibility constraints for the colluding players. Alternatively, collusive prices may be defined as the solution to the Nash bargaining problem and this in turn may also be made subject to the incentive compatibility constraints for the colluding players. Each of these approaches can be incorporated into a simulation approach. 30Doing so has a number of advantages. First, Abreu (1988, Theorem 5) shows that simple strategies—a constant sequence of the same static Nash equilibrium—suffice to achieve any feasible subgame-perfect equilibrium payoff. Second, if any deviation is followed by a Nash reversion, the punishments are automatically ensured to be credible (Friedman, 1971). However, Nash reversion is usually not the most severe punishment to defection—this happens only if the Nash equilibrium of the stage game coincides with the minmax payoffs. However, understanding Nash reversion appears likely to be a useful and tractable bench-mark, leaving more sophisticated forms of punishment for further research. One view on the topic was recently provided by Professor Jullien recently: ‘We have this very fancy theory applying the optimal penal code on players , giving the maximum punishment on the deviator, which is a very complex story, because to do that you have to give optimal punishment if he doesn’t. I am sceptical on how they would coordinate on that. But to run a case it is sufficient to run the old theory of collusion, which is: firms collude on high price and if one deviates, they go back to Nash.’ UK Office of Fair Trading and Competition Commission roundtable on Coordinated Effects Theories of Harm in Merger Analysis. Transcript available from: www.competition-commission.org.uk/about_us/our_organisation/workstreams/analysis/pdf/roundtable_transcript_final_2.pdf.

10
Deff
Collf VV > or
f
NEffDef
ff
Collf
δπδπ
δπ
−+>
− 11
for each firm. These F incentive compatibility constraints (ICCs) play the key role in defining the set of situations in which tacit collusion is individually rational for each firm—and hence feasible. Notice that, under perfect collusion, the only new elements of the ICCs compared with a standard UEMS are (i) the payoffs to defection Def
fπ and (ii) the discount factors fδ for each firm. The former depends directly on the nature of the static profit function for each firm and so may be easily calculated using the techniques developed in the UEMS literature for a given proposed vector of collusive prices.
3.3 Extensions to the benchmark model
3.3.1 Introducing a competitive fringe: partial coalitions
Next we study the effects of a competitive fringe on firms’ incentives and ability to cooperate. To that end, suppose that firms can be divided into dF dominant firms and cF firms in the competitive fringe, where cd FFF += . Define also subsets of their respective products,
},..,1{ Jd ⊂ℑ and },..,1{ Jc ⊂ℑ . We assume the tacitly collusive profits for a given dominant group of firms are those that result from the Nash equilibrium outcome that would have occurred if, counterfactually, all the members of the coalition had merged.31
( ) ),(max cdjj
jjp
ppDcpd
d∑ℑ∈
−
This model allows those not tacitly cooperating to respond optimally (in a static sense) to (free-ride on) the actions of the cartel while the cartel maximizes its joint profits given the actions of the non-cartel members,
.
Naturally, all firms’ products will be incorporated into the differentiated product demand system we estimate so that the data will determine the extent to which fringe producers in aggregate constrain the ability of a cartel consisting only of the dominant players to raise prices. The extent of the constraint will depend on the degree of product differentiation between the fringe and non-fringe producers.
Intuitively, tacit coordination involving only a subset of firms will leave the dominant firm group worse off since they have less collective flexibility when setting prices compared with a full cartel. Since our dominant firm group act collectively as if they had undergone a merger, the fact that intuition is correct follows immediately from the standard result in Bertrand pricing games that mergers between firms producing substitutes are always (at least weakly) profitable. However, it is important to note that it does not immediately follow that each individual member of a cartel is better off when the set of participants in the cartel is increased. In particular, changes in the set of firms which are cooperating will change the cartel’s objective function and, as a result in the absence of side payments, individual firms may actively prefer to exclude particular rival interests.
31Initially, in considering a fringe model we supposed that firms in the competitive fringe could face a perfectly elastic own-price demand curve for each product, so that the fringe would always price at marginal cost. However, after reflection this approach appears better since it allows the fringe and dominant firms to price according to a Nash equilibrium. In particular, we can consider the effects of the fringe attempting to free-ride off the dominant firms’ high prices.

11
3.3.2 Multimarket contact
Bernheim and Whinston (1990) argue that if firms interact repeatedly, not only over time but also across some number of markets M>1, be it geographical markets or market niches, tacit collusion can occur. In a context where firms interact over time, multimarket contact essen-tially pools the ICC of the different markets where firms interact.
Let m=1,..,M denote markets and define
∑∑==
−
+==M
m mf
NEmfmfDef
mf
M
m
Defmf
DefMf VV
11 1 δπδπ and ∑∑
==
−
==M
m mf
Collmf
M
m
Collmf
CollMf VV
11 1 δπ
to be the value functions constructed for firm f as the sums across markets of the value functions to defection and collusion (where the value associated with a market where firm f is not active will be zero.)
The multimarket ICC for collusion for firm f then reads simply: Def
MfColl
Mf VV > .
Previously we had one constraint for each active firm in each market; in the multimarket context we have just one constraint for each firm that is active in at least one market. Such a formulation makes clear that asymmetry in market activity may, in principle, affect the sustainability of tacitly collusive outcomes as much as cross-firm asymmetry.
3.3.3 Accounting for antitrust action
Fourthly, we introduce an antitrust authority. Specifically, we assume that there is at least some (albeit perhaps small) probability that firms engaging in tacit coordination could be subject to antitrust action. While tacit coordination itself is often considered hard to prose-cute,32 the line between tacit and explicit coordination is easily crossed perhaps even inadvertently in practice. For example, if over-enthusiastic middle managers decide to sort out a decline in margins by having a single meeting to discuss it, the line between tacit coordination and explicit coordination, at least EU law, is crossed.33
32In some jurisdictions, tacit collusion can at least in principle be prosecuted. This description draws heavily on Whish (2003), in particular the discussion in Chapter 14. In Europe, for example, tacit collusion can potentially be either a violation of Article 81 or Article 82 (and hence their member state equivalents). Under Article 82, tacit collusion could, at least potentially, be prose-cuted as an exploitative abuse by a collectively dominant oligopoly (see, in particular, the Commission’s P&I decision, which contemplated doing so). Article 81 forbids agreements and concerted practice that prevent, restrict of distort competition, where the term ‘concerted practice’ potentially catches any situation in which firms substitute competition for practical cooperation. The case law in this area includes Dyestuffs, where the ECJ found that: (i) a concerted practice does not need to have all the elements of a contract, but includes coordination apparent from firm behaviour; (ii) parallel behaviour itself is not a concerted practice, since there may, for instance, be common cost shocks driving common price movements, but ‘it may however amount to strong evidence of such a practice’; (iii) every producer is free to change his prices, taking into account in so doing the present or foreseeable conduct of his competitors; (iv) that ‘nevertheless it is contrary to the rules on competition contained in the Treaty for a producer to co-operate with his competitors in any way whatsoever, in order to determine a coordinated course of action relating to a price increase and to ensure its success by prior elimination of all uncertainty as to each others conduct regarding the essential elements of that action, such as the amount, subject matter, date and place of the increases’ (para-graph 118). Thus the case law has evolved to make prosecution of parallel behaviour as a concerted practice difficult, but not impossible, while placing apparently strong restrictions on ‘facilitating practices’, such as the exchange of information that makes a market more transparent and hence makes tacit coordination easier.
If so, then those com-panies should factor both the probability that collusion is detected by the antitrust authorities and the potential to be fined by way of punishment into their value functions. Allowing for
33In T-Mobile v NMa (Case C-8/08), the ECJ upheld a fine imposed by the Netherlands competition authority (NMa) that just one meeting between mobile telecommunications company executives to discuss proposed reductions in standard dealer remunerations. The court held that a single meeting can provide a sufficient basis for a ‘concerted practice’ and thus can be a violation of Article 101 (previously Article 81). In addition, there is no need to look for actual effects (eg price rises) once it is apparent that the objective of a concerted practice is to restrict competition.

12
coordination detection, we model the value to coordination of firm f given that rivals continue to collude is:
−
−+−+= Coll
ff
fNEf
fColl
ffCollff
Collf vqVqV Re
1)()()1()( τ
δδπδδπδ
where q is the single period probability of being ‘caught’ by the antitrust authorities and τ is the fraction of revenue of the affected goods and services, so that the fine after being caught is Coll
fvReτ . We assume that if a firm colludes it will manage to do so for one period, while in future periods it will either (with probability 1-q) manage to continue tacitly cooperating or else it will get caught. If it is caught then, following the logic of grim strategies, we assume that competition re-emerges in the industry, so the future periods are characterized by the static Nash equilibrium outcome, while a fine consisting of a fraction of worldwide revenues is paid. Rearranging, the value function associated with collusion can be rewritten as:
−
−+
−−= Coll
ff
fNEf
fCollf
ff
Collf vq
qV Re
1)(
)1(11)( τ
δδπδπ
δδ
For the value of defection to firm f, we again assume firms get defection profits for one period and then are neither caught nor punished.34
−
+=f
fNEf
fDefff
DeffV
δδπδπδ
1)()(
Thus the value of defecting remains that of the benchmark model:
.
As before, firm f has no incentive to deviate from collusive pricing provided that )()( f
Defff
Collf VV δδ > , for Ff ,..,1= .
4. Data
We use data from the International Data Corporation’s (IDC) Quarterly tracker database.35
IDC data covers the population of available products. It gathers revenue and characteristics data from vendors in all the main regions and then cross-checks the company totals with global HQs and its own customer surveys. Transaction prices
It provides data on price, revenue and number of units sold corresponding to every server from the first quarter of 1996 to the first quarter of 2001 in three major regions: the USA, Western Europe and Japan.
36
A product in a given region and time period (quarter) is a vendor-family-model-operating system combination—for example, Sun Microsystem’s (vendor) Ultra-Enterprise (family) 1000HE series (model) running UNIX (operating system). Descriptive statistics are available in an unpublished appendix available from the authors. There are 33 separately identified vendors, most of whom will have only two or three families of models (IBM has the most models and 17 individual ‘families’).
are also estimated on a region-specific, quarterly, model-by-model basis based on discussions with industry partici-pants. These prices take into account the various discounts offered off the list price, as well as trade-ins.
34There are a number of potentially interesting alternative formulations. For example, we could allow for defection with leniency applications wherein defection by one player was coincident with ‘shopping’ one’s rivals to the antitrust authorities. We stick to the simplest formulation here. 35We use the 7 June 2001 version. For a full description of this database and the recent evolution of the market, see IDC (1998, 2000b). 36Called ‘street prices’ by IDC.
13
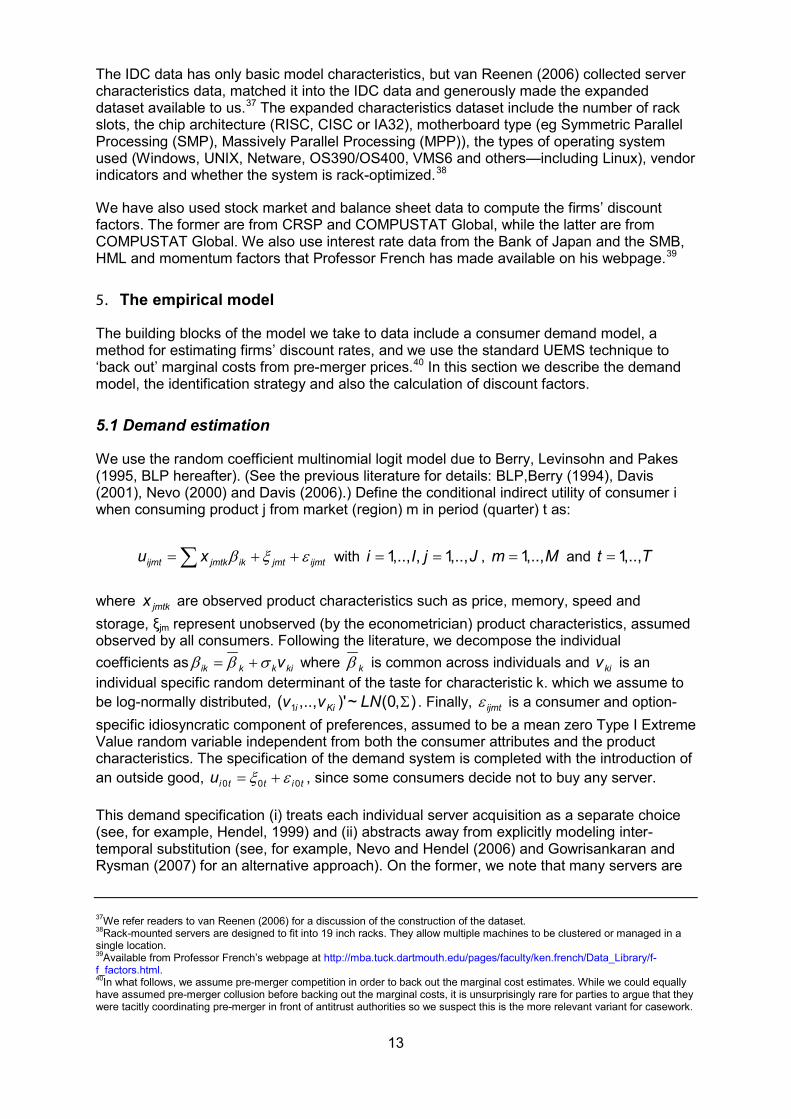
The IDC data has only basic model characteristics, but van Reenen (2006) collected server characteristics data, matched it into the IDC data and generously made the expanded dataset available to us.37 The expanded characteristics dataset include the number of rack slots, the chip architecture (RISC, CISC or IA32), motherboard type (eg Symmetric Parallel Processing (SMP), Massively Parallel Processing (MPP)), the types of operating system used (Windows, UNIX, Netware, OS390/OS400, VMS6 and others—including Linux), vendor indicators and whether the system is rack-optimized.38
We have also used stock market and balance sheet data to compute the firms’ discount factors. The former are from CRSP and COMPUSTAT Global, while the latter are from COMPUSTAT Global. We also use interest rate data from the Bank of Japan and the SMB, HML and momentum factors that Professor French has made available on his webpage.
39
5. The empirical model
The building blocks of the model we take to data include a consumer demand model, a method for estimating firms’ discount rates, and we use the standard UEMS technique to ‘back out’ marginal costs from pre-merger prices.40
5.1 Demand estimation
In this section we describe the demand model, the identification strategy and also the calculation of discount factors.
We use the random coefficient multinomial logit model due to Berry, Levinsohn and Pakes (1995, BLP hereafter). (See the previous literature for details: BLP,Berry (1994), Davis (2001), Nevo (2000) and Davis (2006).) Define the conditional indirect utility of consumer i when consuming product j from market (region) m in period (quarter) t as:
∑ ++= ijmtjmtikjmtkijmt xu εξβ with JjIi ,..,1,,..,1 == , Mm ,..,1= and Tt ,..,1=
where jmtkx are observed product characteristics such as price, memory, speed and storage, ξjm represent unobserved (by the econometrician) product characteristics, assumed observed by all consumers. Following the literature, we decompose the individual coefficients as kikkik vσββ += where kβ is common across individuals and kiv is an individual specific random determinant of the taste for characteristic k. which we assume to be log-normally distributed, ),0(~)',..,( 1 ΣLNvv Kii . Finally, ijmtε is a consumer and option-specific idiosyncratic component of preferences, assumed to be a mean zero Type I Extreme Value random variable independent from both the consumer attributes and the product characteristics. The specification of the demand system is completed with the introduction of an outside good, tittiu 000 εξ += , since some consumers decide not to buy any server.
This demand specification (i) treats each individual server acquisition as a separate choice (see, for example, Hendel, 1999) and (ii) abstracts away from explicitly modeling inter-temporal substitution (see, for example, Nevo and Hendel (2006) and Gowrisankaran and Rysman (2007) for an alternative approach). On the former, we note that many servers are 37We refer readers to van Reenen (2006) for a discussion of the construction of the dataset. 38Rack-mounted servers are designed to fit into 19 inch racks. They allow multiple machines to be clustered or managed in a single location. 39Available from Professor French’s webpage at http://mba.tuck.dartmouth.edu/pages/faculty/ken.french/Data_Library/f-f_factors.html. 40In what follows, we assume pre-merger competition in order to back out the marginal cost estimates. While we could equally have assumed pre-merger collusion before backing out the marginal costs, it is unsurprisingly rare for parties to argue that they were tacitly coordinating pre-merger in front of antitrust authorities so we suspect this is the more relevant variant for casework.

14
purchased by businesses and so this is probably a strong assumption. However, since we have no information about the numbers of servers purchased by purchaser, and little indi-cation that such effects ultimately make the aggregate sales of servers ‘lumpy’ in the way that might concern us, we do not consider our approach unreasonable for our purposes. On the second issue of inter-temporal substitution, again the approach seems not unreasonable in light of the relatively short lives of computers and the fact that the focus of our paper lays not directly in the dynamics on the demand side, although abstracting in this way clearly represents a pragmatic modelling approximation to actual consumer choice behaviour in the industry and future research may relax such assumptions.
The closest empirical demand paper is Ivaldi and Lörincz (2008, henceforth I&L) who estimated a nested multinomial logit (N-MNL) model for servers. Instead of reinventing the wheel, we build on their work and focus our analysis on two particular market segments they identify as separate antitrust markets, namely (1) servers priced below $4,000 and (2) servers priced between $4,001 and $10,000.41 We refer to these market segments as 0–4 and 4–10, respectively. Doing so provides 5,537 and 8,799 observations, respectively, for analysis.42
5.2 Identification of the demand model
Pre-merger, only the ‘big four’ firms have market shares above 1 per cent in all three regions in the 0–4 market segment (all of them have more than 5 per cent, in fact), and the associated four-firm concentration ratios are 51, 69 and 61.5 per cent for the USA, EU and Japan respectively. In the 4–10 segment, only five players—those above plus Sun—have market shares above 1 per cent in all three regions. The associated C4 and C5 concentration ratios are, respectively, 88, 82, 39 and 94 per cent, 86 per cent, 46 per cent for the USA, EU and Japan, respectively, so there is considerably greater concentration in the 4–10 segment and outside Japan.
This section describes our identification strategy for demand. Following the literature we treat price as endogenous in our demand specification. A positive first observation is that there is plenty of price variation in the dataset. Prices fell rapidly for servers (van Reenen (2006)) and quality improved dramatically during the period covered by the data. We used three types of instruments for price in a given product in a given regional market (USA, Japan and Western Europe). First, we followed Hausman, Leonard and Zona (1994) using prices of a product in other regions to instrument its price in a given region. We refer to these as ‘Hausman instruments’.
Second, we followed BLP (‘BLP instruments’) and constructed instruments consisting of the number of firms operating in the market, the number of other products of the same firm and the sum of characteristics of products produced by rival firms.
41We note that market research companies informally delineate market segments, also typically using price thresholds. IDC, for instance, defines the volume market segment as the one constituted of servers priced below $25,000, the mid-range segment as the one with servers priced between $25,000 and $500,000, and the high-end segment as the one with servers priced above $500,000. In contrast, in a number of competition rulings, including the Compaq–DEC, Fujitsu–Siemens and the HP–Compaq merger cases, DG-Comp delineated the server markets on the basis of price bands into separate markets for entry-level servers (below $100,000), medium level servers ($100,000 – $999,999) and large servers (above $1,000,000). 42Ivaldi and Lörincz (2008) studied the US, European and Japanese markets separately conducting two versions of the SSNIP test: first, that following the 1997 EU guidelines (EU97) and second, that following the US guidelines from 1984 (US84) test. The former involves asking whether a hypothetical monopolist would have an incentive to increase the prices of the merging firms by 5 to 10 per cent while the latter involves asking whether the merger would lead to an equilibrium increase in price of between 5 and 10 per cent. The 10 per cent EU97 and 15 per cent US84 tests suggested the same first price threshold at $4,000 (the 5 per cent EU97 test suggested $3,000 for Japan and the 10 per cent US84 test suggested $3,000 for the USA). The 10 per cent EU97 test also suggested a second price threshold of $10,000 for both the USA and Europe, and $9,000 for Japan. When it comes to the following price thresholds, the methods disagree markedly: the 10 per cent EU97 test suggests a threshold at $1 million for all three regions, but the 15 per cent US84 test suggests a total of five market segments for the USA and six for both the EU and Japan, but the thresholds are markedly different. As a pragmatic solution we decided to consider a market segment with servers priced below $4,000 and another with servers priced between $4,000 and $10,000. These are wider than Ivaldi and Lorincz’s results suggest may be strictly necessary so these appear conservative baseline market defin-ition presumptions.
15
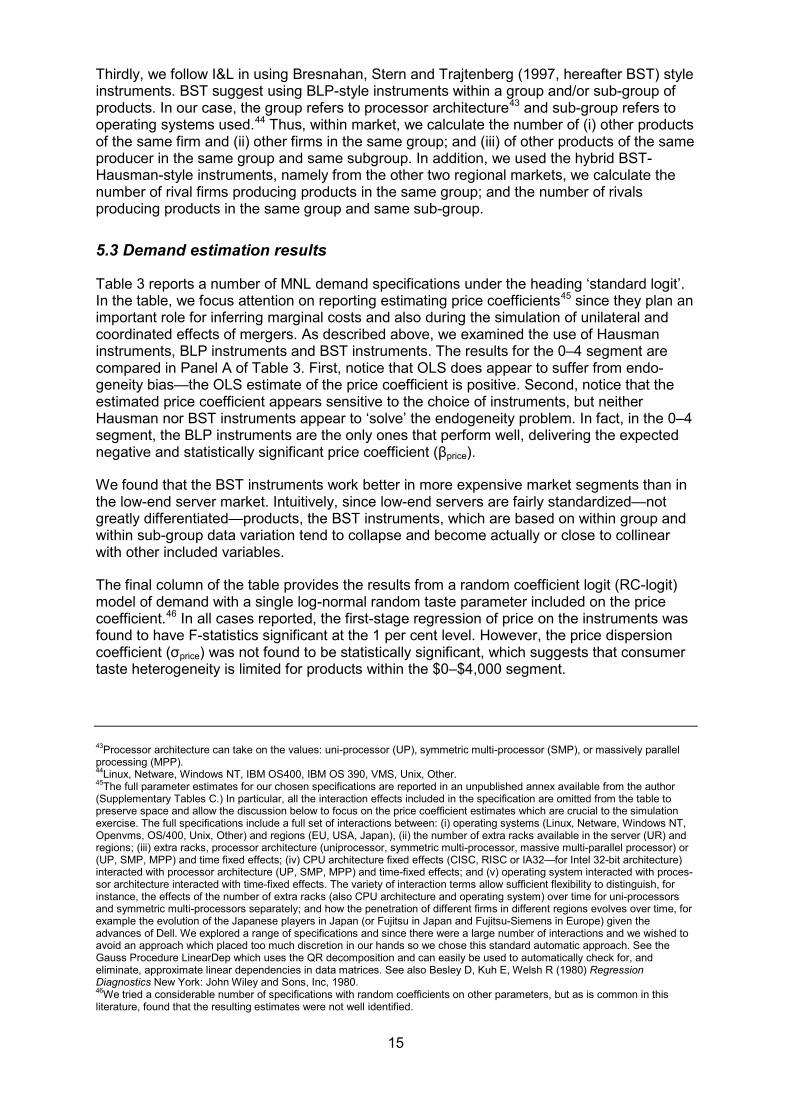
Thirdly, we follow I&L in using Bresnahan, Stern and Trajtenberg (1997, hereafter BST) style instruments. BST suggest using BLP-style instruments within a group and/or sub-group of products. In our case, the group refers to processor architecture43 and sub-group refers to operating systems used.44
5.3 Demand estimation results
Thus, within market, we calculate the number of (i) other products of the same firm and (ii) other firms in the same group; and (iii) of other products of the same producer in the same group and same subgroup. In addition, we used the hybrid BST-Hausman-style instruments, namely from the other two regional markets, we calculate the number of rival firms producing products in the same group; and the number of rivals producing products in the same group and same sub-group.
Table 3 reports a number of MNL demand specifications under the heading ‘standard logit’. In the table, we focus attention on reporting estimating price coefficients45
We found that the BST instruments work better in more expensive market segments than in the low-end server market. Intuitively, since low-end servers are fairly standardized—not greatly differentiated—products, the BST instruments, which are based on within group and within sub-group data variation tend to collapse and become actually or close to collinear with other included variables.
since they plan an important role for inferring marginal costs and also during the simulation of unilateral and coordinated effects of mergers. As described above, we examined the use of Hausman instruments, BLP instruments and BST instruments. The results for the 0–4 segment are compared in Panel A of Table 3. First, notice that OLS does appear to suffer from endo-geneity bias—the OLS estimate of the price coefficient is positive. Second, notice that the estimated price coefficient appears sensitive to the choice of instruments, but neither Hausman nor BST instruments appear to ‘solve’ the endogeneity problem. In fact, in the 0–4 segment, the BLP instruments are the only ones that perform well, delivering the expected negative and statistically significant price coefficient (βprice).
The final column of the table provides the results from a random coefficient logit (RC-logit) model of demand with a single log-normal random taste parameter included on the price coefficient.46
43Processor architecture can take on the values: uni-processor (UP), symmetric multi-processor (SMP), or massively parallel processing (MPP).
In all cases reported, the first-stage regression of price on the instruments was found to have F-statistics significant at the 1 per cent level. However, the price dispersion coefficient (σprice) was not found to be statistically significant, which suggests that consumer taste heterogeneity is limited for products within the $0–$4,000 segment.
44Linux, Netware, Windows NT, IBM OS400, IBM OS 390, VMS, Unix, Other. 45The full parameter estimates for our chosen specifications are reported in an unpublished annex available from the author (Supplementary Tables C.) In particular, all the interaction effects included in the specification are omitted from the table to preserve space and allow the discussion below to focus on the price coefficient estimates which are crucial to the simulation exercise. The full specifications include a full set of interactions between: (i) operating systems (Linux, Netware, Windows NT, Openvms, OS/400, Unix, Other) and regions (EU, USA, Japan), (ii) the number of extra racks available in the server (UR) and regions; (iii) extra racks, processor architecture (uniprocessor, symmetric multi-processor, massive multi-parallel processor) or (UP, SMP, MPP) and time fixed effects; (iv) CPU architecture fixed effects (CISC, RISC or IA32—for Intel 32-bit architecture) interacted with processor architecture (UP, SMP, MPP) and time-fixed effects; and (v) operating system interacted with proces-sor architecture interacted with time-fixed effects. The variety of interaction terms allow sufficient flexibility to distinguish, for instance, the effects of the number of extra racks (also CPU architecture and operating system) over time for uni-processors and symmetric multi-processors separately; and how the penetration of different firms in different regions evolves over time, for example the evolution of the Japanese players in Japan (or Fujitsu in Japan and Fujitsu-Siemens in Europe) given the advances of Dell. We explored a range of specifications and since there were a large number of interactions and we wished to avoid an approach which placed too much discretion in our hands so we chose this standard automatic approach. See the Gauss Procedure LinearDep which uses the QR decomposition and can easily be used to automatically check for, and eliminate, approximate linear dependencies in data matrices. See also Besley D, Kuh E, Welsh R (1980) Regression Diagnostics New York: John Wiley and Sons, Inc, 1980. 46We tried a considerable number of specifications with random coefficients on other parameters, but as is common in this literature, found that the resulting estimates were not well identified.

16
TABLE 3 Results for alternative demand specifications—world market
Standard logit RC logit OLS Hausman BLP BST BLP-LN
Panel A: 0–4 segment Mean price 0.539
(3.158) ***
22.138 (3.543)
***
–13.168 (–2.262)
**
5.547 (3.216)
***
–12.189 (–2.150)
** Price dispersion 0.155
(0.010) -
J-statistic p-value N/A 0.241 0.374 0.856 N/A 100% elastic own-price effects? No No Yes No Yes Median own-price effects:
EU –31.290 –30.917 USA –30.163 –29.804 Japan –32.284 –31.921
Panel B: 4–10 segment Mean price –0.079
(–1.398) -
–0.135 (0.233)
-
–1.631 (–1.434)
-
–1.877 (–2.029)
**
–3.979 (–2.872)
*** Price dispersion 0.978
(1.600) *
J-statistic p-value N/A 0.084 0.984 0.802 0.601 100% elastic own-price effects? No No No Yes Yes Median own-price effects:
EU –10.602 –22.727 USA –9.808 –21.145 Japan –11.159 –23.796
Note: The table reports estimates of the (mean) price coefficient of logit model, t.statistics (reported within brackets) and the p-value of the price coefficient and the J-statistic of overidentifying restrictions, whenever applicable (N/A denotes an exactly identifed model). The last column displays results for a random-coefficients logit with BST instruments and Lognormal random draws. The symbols—(resp. *, **, ***) denote not-significant (resp. significant at the 10%, 5%, 1% significance level—note that one-sided t-tests are used for price dispersion). It also reports whether 100% of the own-price elasticities were elastic and, whenever this is the case, reports the median own-price elasticity.
In the 0–4 segment, the product level own-price elasticities are within the range between –11 and –40 (–13 to –40 in the USA, —17 to –40 in the EU and –11 and –40 in Japan). These results are consistent with low-end servers being close to homogeneous products in the eyes of consumers so that price differences for equivalent products drive large movements in volumes across providers. Similar results are provided by I&L who report an average own-price elasticity of approximately 41. While such elasticities are certainly large, they are the same order of magnitude as those found for cars in Berry, Levinsohn and Pakes (1995).47
In the 4–10 segment, the BLP and the BST instruments provide similar results providing negative and statistically significant price coefficients, although, intuitively, we found them to be of smaller magnitude than those of the $0–$4,000 segment. Turning to the random coefficient specification in the final column of the table, we found that the random coefficient was statistically significant at the 10 per cen5 level using a one-tailed test.
48
47See the debate between Charlotte Wojczik (2000) and Berry and Pakes (2001) about the reasonableness of price elasticities in the region of –20 (in particular, on p49 of Berry and Pakes (2001)).
The elasticities obtained for this market segment were somewhat lower than the $0–$4,000, with medians between –21 and –23.
48Using the normal approximation to the t-distribution, 90 per cent of the distribution lies below 1.282 and 95 per cent lies below 1.645. Since variance parameters can only take on positive numbers, the appropriate test to apply is the one-sided test.

17
For each segment, we consider these estimates to be on the higher end of the range of plausible elasticities. We note that these kinds of magnitudes are familiar in the literature (eg in BLP) but primarily, we show below that our main results simply do not depend on the exact numbers we obtain from demand estimation. As such, the central character of the results we present below will be robust to the situation that we have estimated demand elasticities which are in truth too high.
5.4 Estimating discount factors
Discount factors are used to calculate the NPV of the profits from each element of the ICC. In an antitrust case, where internal documents are available, one approach would be to use the firms’ hurdle rate for the internal rate of return for projects. A second approach relies on asset pricing models (APMs) to infer an appropriate discount rate.49
dfr
We can use the latter approach since the firms in our dataset are listed. Thirdly, following the theoretical literature, we can calculate the range of discount factors for which collusion can be sustained. We take the second and third approaches and compare the results. First, we calculate the weighted average cost of capital (WACC) each firm faces where the cost of debt is obtained as the ratio of interest expenses to debt for a given firm50
TABLE 4 Quarterly discount factors for firms in the server industry
and the cost of equity is obtained from an APM.
Firm Disc factor Firm Disc factor Firm Disc factor
Compaq 0.967 NCR 0.971 Mitsubishi 0.990 Dell 0.957 SGI 0.976 NEC 0.988 Gateway 0.962 Sun 0.959 Toshiba 0.989 HP 0.967 Unisys 0.971 AST 0.950 IBM 0.972 Fujitsu 0.989 Data General 0.950 Micron 0.963 Hitachi 0.989 VALinux 0.950
Note: The calculation of quarterly discount factors was performed as described in Section 5.4.
Specifically, we followed the finance literature in exploring three specific APMs, namely CAPM, Fama-French (1993, henceforth FF) and Fama-French plus Momentum following Carhart (1997) (FFM). We found that CAPM provided the most reliable results in practice and so have focused the text on the results from that model.51
( ) ( ) ttMtftft errrr +−=− β
CAPM assumes that a stock’s systematic risk is measured by its beta, the slope of the regression of excess stock returns on excess market returns: where fr is the return of the stock of
firm f, r is the risk-free rate, Mr is the return of the market portfolio and te is the unexplained part of firm excess stock returns. Following FF use the one-month Treasury Bill for the risk-free rate, while the excess return on the market, ( )tMt rr − , is defined as the value-weighted return on all NYSE, AMEX and NASDAQ stocks (from CRSP). In practice we used ‘long-run’ averages for the risk-free rate and the market risk premium. The firm’s rate of return on equity can then be estimated using
49See Berk and DeMarzo (2007) for an introduction to capital budgeting. 50Doing so involves calculating a weighted average of the cost of equity and the cost of debt according to their respective participation in the value of the firm: e
fd
ff rVEr
VDr +−= )1(* γ where
VD and
VE are, respectively, the ratio of debt and equity to the
value of the firm, dfr is the cost of debt, e
fr is the cost of equity and γ is the marginal corporate tax rate. We used the book-value of debt for D and the market value of equity (number of shares outstanding times share price) for E, while by definition V=E+D. The cost of debt d
fr is obtained as the ratio of interest expenses to debt for a given firm, whereas the cost of equity is obtained from an asset pricing model. 51See Appendix B, we compared a number of alternative variable definitions and asset pricing models (namely CAPM, Fama-French and FFM). We carried out a number of checks for robustness and consistency, in the sense that discount factor values were between zero and one.
18
( )tMtfte
ft rrrr −+= β̂ˆ .
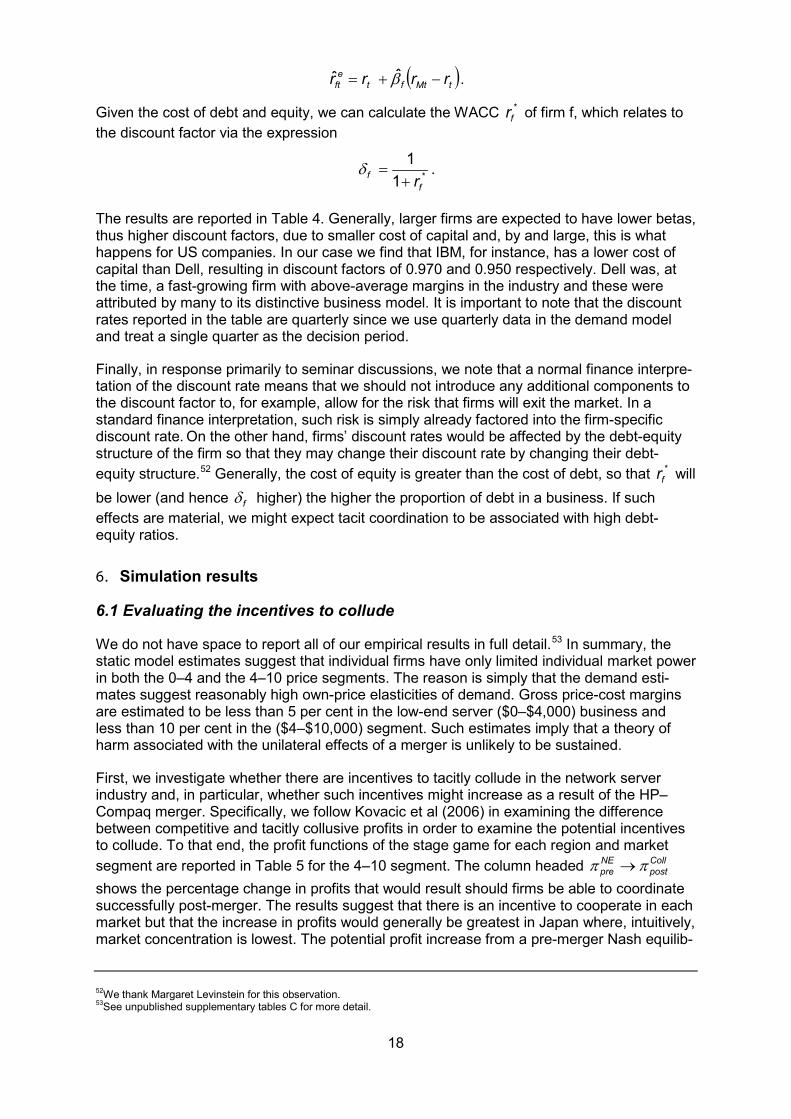
Given the cost of debt and equity, we can calculate the WACC *fr of firm f, which relates to
the discount factor via the expression
*11
ff r+=δ .
The results are reported in Table 4. Generally, larger firms are expected to have lower betas, thus higher discount factors, due to smaller cost of capital and, by and large, this is what happens for US companies. In our case we find that IBM, for instance, has a lower cost of capital than Dell, resulting in discount factors of 0.970 and 0.950 respectively. Dell was, at the time, a fast-growing firm with above-average margins in the industry and these were attributed by many to its distinctive business model. It is important to note that the discount rates reported in the table are quarterly since we use quarterly data in the demand model and treat a single quarter as the decision period.
Finally, in response primarily to seminar discussions, we note that a normal finance interpre-tation of the discount rate means that we should not introduce any additional components to the discount factor to, for example, allow for the risk that firms will exit the market. In a standard finance interpretation, such risk is simply already factored into the firm-specific discount rate. On the other hand, firms’ discount rates would be affected by the debt-equity structure of the firm so that they may change their discount rate by changing their debt-equity structure.52 *
fr Generally, the cost of equity is greater than the cost of debt, so that will be lower (and hence fδ higher) the higher the proportion of debt in a business. If such effects are material, we might expect tacit coordination to be associated with high debt-equity ratios.
6. Simulation results
6.1 Evaluating the incentives to collude
We do not have space to report all of our empirical results in full detail.53
First, we investigate whether there are incentives to tacitly collude in the network server industry and, in particular, whether such incentives might increase as a result of the HP–Compaq merger. Specifically, we follow Kovacic et al (2006) in examining the difference between competitive and tacitly collusive profits in order to examine the potential incentives to collude. To that end, the profit functions of the stage game for each region and market segment are reported in Table 5 for the 4–10 segment. The column headed
In summary, the static model estimates suggest that individual firms have only limited individual market power in both the 0–4 and the 4–10 price segments. The reason is simply that the demand esti-mates suggest reasonably high own-price elasticities of demand. Gross price-cost margins are estimated to be less than 5 per cent in the low-end server ($0–$4,000) business and less than 10 per cent in the ($4–$10,000) segment. Such estimates imply that a theory of harm associated with the unilateral effects of a merger is unlikely to be sustained.
Collpost
NEpre ππ →
shows the percentage change in profits that would result should firms be able to coordinate successfully post-merger. The results suggest that there is an incentive to cooperate in each market but that the increase in profits would generally be greatest in Japan where, intuitively, market concentration is lowest. The potential profit increase from a pre-merger Nash equilib- 52We thank Margaret Levinstein for this observation. 53See unpublished supplementary tables C for more detail.

19
rium to a post-merger collusive equilibrium are in the range 9–15 per cent in the USA, about 13 per cent in the EU, and in the range 20–23 per cent in Japan for the non-merging parties. Notice also that the incentive to coordinate varies substantially across firms.
TABLE 5 Pre- and post-merger static profits—4–10 price segment
Pre-merger Post-merger % change Firm Coll Def Nash Coll Def Nash → →
Panel A: USA Compaq 7,816 8,776 7,026 HP 1,388 1,686 1,258 9,204 10,219 8,304 11.1 0.2 NEC 1 1 1 1 1 1 9.1 0.9 IBM 4,383 5,141 3,964 4,383 5,142 3,992 10.5 0.7 Data Gen 2 3 2 2 3 2 8.9 0.9 Dell 19,221 20,015 16,702 19,221 20,015 16,806 15.0 0.6 NCR 305 405 279 305 405 281 9.3 0.8 Sun 1,843 2,299 1,677 1,843 2,299 1,690 9.8 0.8 Toshiba 31 38 28 31 38 28 10.3 0.7 Panel B: EU Compaq 19,097 20,276 16,390 HP 3,878 4,633 3,440 22,976 23,946 20,002 15.9 0.9 Fujitsu 3,220 3,964 2,868 3,220 3,964 2,964 12.2 3.4 NEC 672 812 596 672 812 613 12.6 2.9 IBM 6,571 7,689 5,814 6,571 7,689 5,999 13.0 3.2 AST 352 418 312 352 418 321 12.6 2.7 Dell 6,718 7,662 5,944 6,718 7,662 6,110 13.0 2.8 Gateway 1 2 1 1 2 1 12.6 2.6 Sun 1,261 1,597 1,124 1,261 1,597 1,162 12.2 3.4 Toshiba 62 75 55 62 75 57 12.6 2.8 Unisys 25 33 23 25 33 23 12.2 3.3 VA Linux 52 62 46 52 62 47 12.6 2.8 Panel C: Japan Compaq 2,390 2,870 1,962 HP 1,246 1,578 1,022 3,636 4,235 2,992 21.9 0.3 Fujitsu 3,163 3,769 2,579 3,163 3,769 2,603 22.6 0.9 NEC 3,748 4,384 3,043 3,748 4,384 3,071 23.1 0.9 IBM 1,220 1,551 1,001 1,220 1,551 1,010 21.8 0.9 AST 24 30 20 24 30 20 20.5 0.8 Dell 1,272 1,548 1,052 1,272 1,548 1,060 20.9 0.8 Gateway 1 1 1 1 1 1 21.0 0.8 Hitachi 667 872 547 667 872 552 21.8 0.9 Mitsubishi 414 523 341 414 523 344 21.2 0.8 NCR 13 16 11 13 16 11 20.6 0.8 Sun 1,047 1,353 858 1,047 1,358 866 22.0 0.9 Toshiba 976 1,242 804 976 1,242 811 21.4 0.9
Note: Figures are in thousand 1996 US dollars per quarter. The last two columns report the percentage changes in profits following a merger between HP and Compaq in two situations: (i) from a pre-merger Nash equilibrium to a post-merger collusive equilibrium; and (ii) from a pre-merger to a post-merger Nash equilibrium. The post-merger values for HP report the percentage change of the post-merger values of the merged entity, HP–Compaq, with respect to the combined pre-merger values of HP and Compaq.
An important feature of these results (reported in Table 5) is that the collusive and defection payoffs are independent of market structure—they do not change pre- and post-merger except of course that the merging firms obtain the sum of the pre-merger static payoffs. Notice also that static defection payoffs are always larger than collusive profits. However, the size of the incentive effect is generally modest but potentially interesting. In the 4–10,000 segment, the size of these effects increase substantially with the static gains to IBM or Dell in the US or EU markets would each be more than $700,000 per quarter per market area. For example, Dell in the USA would have a static payoff under coordination of $19,221,000 per quarter which would rise to $20,015,000 if defecting against the collusive agreement, an increase of just $794,000 per quarter.

20
6.2 Incentive compatibility constraints: the benchmark model
Next we examine the IC constraints and in particular consider how the value of colluding compares with the value of defecting in the benchmark model. In later sections we consider how the results change with (i) a competitive fringe, (ii) multi-market contact and (iii) the introduction of an antitrust authority which ensures that tacitly colluding firms run the risk of incurring fines.
To do so, we consider price segments (0–4 and 4–10) and geographic markets (USA, EU and Japan) separately. Notably, we find that at discount factors calculated using each firm’s estimated WACC, the NPV from collusion is always greater than the NPV of defection. This result implies that the returns to collusion are positive and non-negligible both pre- and post-merger, appears to be robust across all three geographic regions and both market segments.
For example, in the low-end server market segment, the results presented in Table 6 show that the net gains from colluding are significant in all geographic markets. The column headed V(C–D) reports the difference between the value of coordination and defection, the slack in the IC constraint. The results suggest that, prior to the merger, a firm such as Dell would obtain gains of $4.7 million pre-merger in the USA and almost $1 million and $0.5 million in Europe and Japan respectively, whereas the gains of IBM in the three markets would be about $2.5 million, $1.1 million and $0.7 million. On the other hand, by acquiring Compaq, the net gains perceived by HP as a result of collusion increase from $2 million to $8.8 million. Similar results are presented for the $4–$10,000 market segment in Table 7.
While neither collusive nor defection payoffs are affected by the merger, strikingly, the merger is predicted to make the net gains from colluding V(C–D) smaller for every firm in every market area. With the benefit of hindsight, the reason is intuitive—the merger (absent efficiencies) increases Nash equilibrium profits for all players in the market and thus reduces the incentive to collude. This result is a general one. At least to the extent that optimally collusive prices do not change with market structure, neither will each non-merging firm’s defection payoffs, and so (other things being equal) unilateral effects of a merger will generically tend to narrow the incentive to coordinate. The only potential exceptions to this can appear through the merging firms’ incentives to collude. We capture this result in Proposition 1.
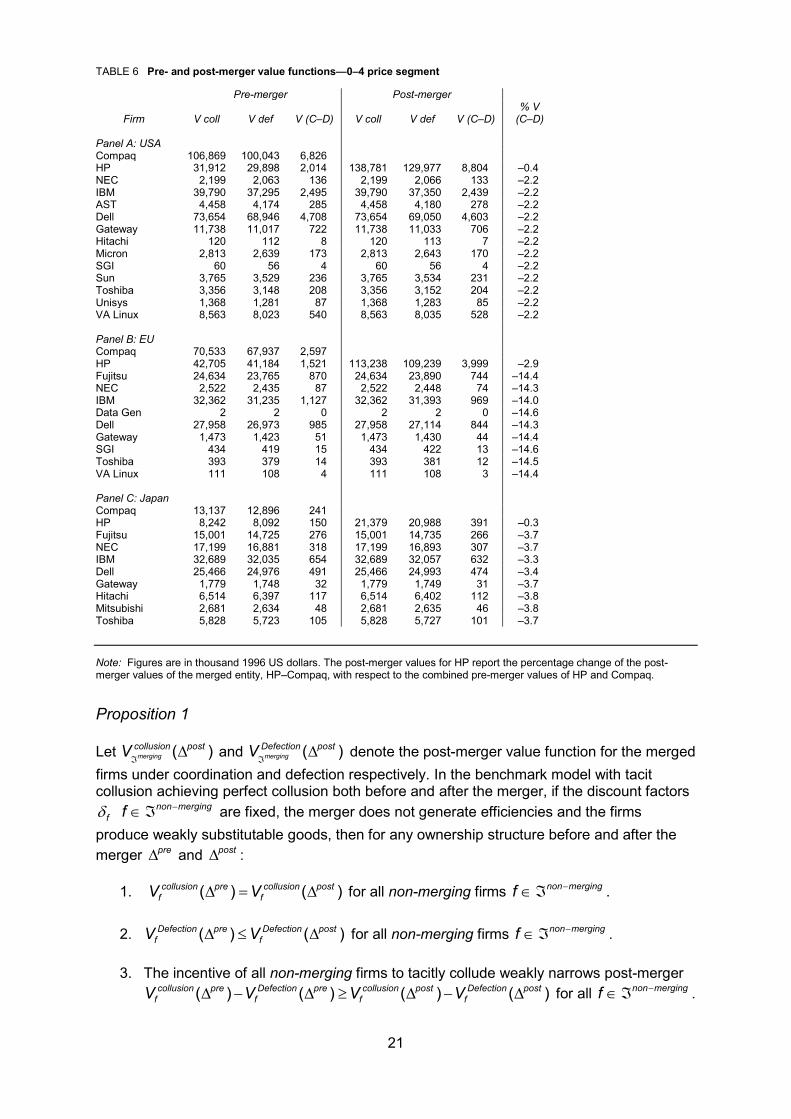
21
TABLE 6 Pre- and post-merger value functions—0–4 price segment
Pre-merger Post-merger
Firm V coll V def V (C–D) V coll V def V (C–D) % V
(C–D)
Panel A: USA Compaq 106,869 100,043 6,826 HP 31,912 29,898 2,014 138,781 129,977 8,804 –0.4 NEC 2,199 2,063 136 2,199 2,066 133 –2.2 IBM 39,790 37,295 2,495 39,790 37,350 2,439 –2.2 AST 4,458 4,174 285 4,458 4,180 278 –2.2 Dell 73,654 68,946 4,708 73,654 69,050 4,603 –2.2 Gateway 11,738 11,017 722 11,738 11,033 706 –2.2 Hitachi 120 112 8 120 113 7 –2.2 Micron 2,813 2,639 173 2,813 2,643 170 –2.2 SGI 60 56 4 60 56 4 –2.2 Sun 3,765 3,529 236 3,765 3,534 231 –2.2 Toshiba 3,356 3,148 208 3,356 3,152 204 –2.2 Unisys 1,368 1,281 87 1,368 1,283 85 –2.2 VA Linux 8,563 8,023 540 8,563 8,035 528 –2.2 Panel B: EU Compaq 70,533 67,937 2,597 HP 42,705 41,184 1,521 113,238 109,239 3,999 –2.9 Fujitsu 24,634 23,765 870 24,634 23,890 744 –14.4 NEC 2,522 2,435 87 2,522 2,448 74 –14.3 IBM 32,362 31,235 1,127 32,362 31,393 969 –14.0 Data Gen 2 2 0 2 2 0 –14.6 Dell 27,958 26,973 985 27,958 27,114 844 –14.3 Gateway 1,473 1,423 51 1,473 1,430 44 –14.4 SGI 434 419 15 434 422 13 –14.6 Toshiba 393 379 14 393 381 12 –14.5 VA Linux 111 108 4 111 108 3 –14.4 Panel C: Japan Compaq 13,137 12,896 241 HP 8,242 8,092 150 21,379 20,988 391 –0.3 Fujitsu 15,001 14,725 276 15,001 14,735 266 –3.7 NEC 17,199 16,881 318 17,199 16,893 307 –3.7 IBM 32,689 32,035 654 32,689 32,057 632 –3.3 Dell 25,466 24,976 491 25,466 24,993 474 –3.4 Gateway 1,779 1,748 32 1,779 1,749 31 –3.7 Hitachi 6,514 6,397 117 6,514 6,402 112 –3.8 Mitsubishi 2,681 2,634 48 2,681 2,635 46 –3.8 Toshiba 5,828 5,723 105 5,828 5,727 101 –3.7
Note: Figures are in thousand 1996 US dollars. The post-merger values for HP report the percentage change of the post-merger values of the merged entity, HP–Compaq, with respect to the combined pre-merger values of HP and Compaq.
Proposition 1
Let )( postcollusionmergingV ∆
ℑ and )( postDefection
mergingV ∆ℑ
denote the post-merger value function for the merged firms under coordination and defection respectively. In the benchmark model with tacit collusion achieving perfect collusion both before and after the merger, if the discount factors
fδ mergingnonf −ℑ∈ are fixed, the merger does not generate efficiencies and the firms produce weakly substitutable goods, then for any ownership structure before and after the merger pre∆ and post∆ :
1. )()( postcollusionf
precollusionf VV ∆=∆ for all non-merging firms mergingnonf −ℑ∈ .
2. )()( postDefectionf
preDefectionf VV ∆≤∆ for all non-merging firms mergingnonf −ℑ∈ .
3. The incentive of all non-merging firms to tacitly collude weakly narrows post-merger )()()()( postDefection
fpostcollusion
fpreDefection
fprecollusion
f VVVV ∆−∆≥∆−∆ for all mergingnonf −ℑ∈ .

22
4. If postpref mergingℑ
≥ δδ for all mergingf ℑ∈ then the aggregate returns to the merging firms
tacitly colluding pre-merger are no smaller than the returns post-merger:
)()( postcollusion
f
precollusionf merging
merging
VV ∆≥∆ℑ
ℑ∈∑ .
If δδδ ==ℑpostpre
f merging for all mergingf ℑ∈ then for the merging firms
)()( postcollusion
f
precollusionf merging
merging
VV ∆=∆ℑ
ℑ∈∑ .
That is the returns to tacit collusion for the merging parties are greater pre-merger than post-merger provided that post-merger the cost of capital for the enlarged firm is no smaller than for each of its constituent parts.
5. For the merging firms, aggregate static defection payoffs
∑ℑ∈
∆∆ℑ≥
mergingprepostmerging
f
Deff
Def pp )()( ππ
are no smaller post-merger than pre-merger as are aggregate post-merger Nash equilibrium profits,
∑ℑ∈
∆∆ℑ≥
mergingprepostmerging
f
NEf
NE pp )()( ππ .
If δδδ == postf
pref for all mergingf ℑ∈ then ∑
ℑ∈ℑ
∆≥∆merging
merging
f
preDefectionf
postDefection VV )()( .
6. If, δδδ == postf
pref for all mergingf ℑ∈ then the net incentive to collude decreases
post-merger:
)()()()( postDefectionpostCollusion
f
preDefectionf
f
precollusionf mergingmerging
mergingmerging
VVVV ∆−∆≥∆−∆ℑℑ
ℑ∈ℑ∈∑∑ .
Proof
See Appendix.

23
TABLE 7 Pre- and post-merger value functions—4–10 price segment
Pre-merger Post-merger
Firm V coll V def V (C–D) V coll V def V (C–D) % V
(C–D) Panel A: USA Compaq 236,851 214,658 22,193 HP 42,057 38,555 3,502 278,908 253,537 25,371 –1.3 NEC 16 15 1 16 15 1 –10.8 IBM 132,809 121,300 11,508 132,809 122,126 10,683 –7.1 Data Gen 63 59 4 63 59 4 –11.4 Dell 582,458 509,446 73,011 582,458 512,476 69,982 –4.1 NCR 9,238 8,577 661 9,238 8,646 592 –10.4 Sun 55,843 51,442 4,402 55,843 51,827 4,016 –8.7 Toshiba 943 865 78 943 871 73 –7.3 Panel B: EU Compaq 578,699 500,550 78,149 HP 117,528 105,432 12,095 696,227 610,075 86,152 –4.5 Fujitsu 97,581 88,005 9,576 97,581 90,822 6,758 –29.4 NEC 20,357 18,288 2,069 20,357 18,787 1,570 –24.1 IBM 199,119 178,054 21,065 199,119 183,484 15,634 –25.7 AST 10,661 9,569 1,092 10,661 9,814 847 –22.4 Dell 203,585 181,848 21,737 203,585 186,697 16,888 –22.3 Gateway 39 35 4 39 36 3 –21.9 Sun 38,224 34,538 3,686 38,224 35,643 2,582 –29.9 Toshiba 1,889 1,696 193 1,889 1,741 148 –23.4 Unisys 771 697 74 771 719 52 –29.7 VA Linux 1,560 1,401 159 1,560 1,438 122 –23.3 Panel C: Japan Compaq 72,434 60,362 12,072 HP 37,760 31,538 6,222 110,194 91,919 18,275 –0.1 Fujitsu 95,836 79,348 16,489 95,836 80,032 15,805 –4.1 NEC 113,564 93,563 20,001 113,564 94,364 19,200 –4.0 IBM 36,953 30,871 6,082 36,953 31,138 5,815 –4.4 AST 740 624 116 740 628 112 –3.8 Dell 38,548 32,370 6,179 38,548 32,615 5,934 –3.9 Gateway 27 23 4 27 23 4 –4.0 Hitachi 20,209 16,906 3,303 20,209 17,055 3,155 –4.5 Mitsubishi 12,536 10,520 2,017 12,536 10,603 1,934 –4.1 NCR 388 327 61 388 329 59 –3.8 Sun 31,720 26,493 5,227 31,720 26,729 4,991 –4.5 Toshiba 29,577 24,793 4,785 29,577 25,000 4,577 –4.3
Note: Figures are in thousand 1996 US dollars. The post-merger values for HP report the percentage change of the post-merger values of the merged entity, HP–Compaq, with respect to the combined pre-merger values of HP and Compaq.
Notice that the last result applies to our case, since our cost of capital estimates found that 967.0== CompaqHP δδ . It follows from part 4 of Proposition 1 that for the merging parties the
aggregate payoff to collusion does not change following the merger,
∑ℑ∈
ℑ∆=∆
mergingmerging
f
precollusionf
postCollusion VV )()(
and this result can be seen in Tables 6 and 7. Similarly, it follows from part 5 of Proposition 1 that the aggregate payoff to defection increases following the merger
∑ℑ∈
ℑ∆≥∆
mergingmerging
f
preDefectionf
postDefection VV )()( .
Again, this result can be seen in each of the panels in Tables 6 and 7. As a result, part 6 of proposition follows immediately that in this case the net incentive to collude decreases post-merger:
)()()()( postDefectionpostCollusion
f
preDefectionf
f
precollusionf mergingmerging
mergingmerging
VVVV ∆−∆≥∆−∆ℑℑ
ℑ∈ℑ∈∑∑ .

24
Although the magnitude of the decrease depends on the estimates on the demand side of the model, this result establishes that the direction of the change does not, rather it relies on our empirical finding that CompaqHP δδ = . Thus, for our central finding, ultimately the reader does not in fact even need to believe our demand estimates!
Next we compare the critical discount factors of the firms operating in a given market. The critical discount factor of a firm, *
fδ , is the minimum discount factor sustaining collusion and is obtained by equating the value to colluding to the value to defecting, ie
NEf
Deff
Collf
Deff
f ππππδ
−−
=* .
Proposition 2: Critical discount factors for non-merging firms
Define the critical discount factor of firm f for a given market structure ∆ as:
)()()()(*
∆−∆∆−∆
= NEf
Deff
Collf
Deff
f ππππδ .
If we consider perfect collusion both before and after the merger and the merger generates no efficiencies, then )()( postColl
fpreColl
fCollf ∆=∆= πππ for all mergingnonf −ℑ∈ ,
)()( postDeff
preDeff
Deff ∆=∆= πππ for all mergingnonf −ℑ∈ and, provided the products in the
market are weak substitutes, )()( postNEf
preNEf ∆≤∆ ππ for all mergingnonf −ℑ∈ . In that case,
critical discount factors for non-merging firms do not decrease following a concentration:
PostfpostNE
fDeff
Collf
Deff
preNEf
Deff
Collf
Deffe
f**Pr
)()(δ
ππππ
ππππδ =
∆−−
≤∆−
−=
for all mergingnonf −ℑ∈ .

25
TABLE 8 Pre- and post-merger critical discount factors—0–4 and 4–10 price segments
0–4 price segment 4–10 price segment Firm Pre- Post- % change Pre- Post- % change
Panel A: USA
Compaq 0.102 0.549 HP 0.166 0.080 –52.1 0.697 0.530 –23.9 NEC 0.189 0.193 1.8 0.807 0.821 1.8 IBM 0.158 0.161 1.9 0.644 0.660 2.4 AST 0.196 0.199 1.8 - - - Data Gen - - - 0.817 0.832 1.8 Dell 0.130 0.132 1.9 0.240 0.247 3.2 Gateway 0.179 0.182 1.8 - - - Hitachi 0.192 0.196 1.8 - - - Micron 0.187 0.191 1.8 - - - NCR - - - 0.795 0.810 1.8 SGI 0.198 0.202 1.8 - - - Sun 0.191 0.195 1.8 0.733 0.749 2.1 Toshiba 0.189 0.192 1.8 0.711 0.725 1.9 Unisys 0.197 0.201 1.8 - - - VA Linux 0.189 0.192 1.8 - - - Panel B: EU Compaq 0.198 0.303 HP 0.270 0.114 –57.6 0.632 0.246 –61.1 Fujitsu 0.320 0.354 10.6 0.679 0.744 9.6 NEC 0.364 0.399 9.8 0.650 0.706 8.5 IBM 0.291 0.322 10.8 0.596 0.662 10.9 AST - - - 0.626 0.680 8.5 Data Gen 0.380 0.417 9.7 - - - Dell 0.310 0.343 10.7 0.549 0.608 10.6 Gateway 0.371 0.408 9.7 0.623 0.676 8.4 SGI 0.379 0.415 9.7 - - - Sun - - - 0.710 0.771 8.6 Toshiba 0.375 0.411 9.7 0.646 0.701 8.4 Unisys - - - 0.724 0.782 8.0 VA Linux 0.372 0.408 9.7 0.646 0.700 8.4 Panel C: Japan Compaq 0.522 0.528 HP 0.530 0.481 –9.2 0.597 0.482 –19.3 Fujitsu 0.527 0.536 1.7 0.510 0.520 2.0 NEC 0.519 0.528 1.7 0.475 0.484 2.0 IBM 0.408 0.416 1.9 0.602 0.612 1.6 AST - - - 0.578 0.587 1.5 Dell 0.455 0.463 1.8 0.556 0.565 1.7 Gateway 0.581 0.589 1.5 0.607 0.616 1.5 Hitachi 0.573 0.582 1.5 0.632 0.642 1.5 Mitsubishi 0.590 0.599 1.5 0.601 0.610 1.5 NCR - - - 0.586 0.595 1.5 Sun - - - 0.618 0.629 1.6 Toshiba 0.563 0.572 1.5 0.606 0.616 1.6

26
Table 8 reports the critical discount factors, those above which collusion is incentive-compatible. We find that they are substantially lower than those estimated as each firm’s WACC, and the difference is starkest in the 0–4 price segment while the two are closest in the $4–$10,000 segment where threshold values are above 0.8 in the USA and slightly below that in the other markets. Applying the results in Proposition 2, notice that the critical discount factor for non-merging firms always increases from pre-merger to post-merger levels. This move is consistent with the merger making it harder for non-merging firms to tacitly coordinate. There is no analogous general result for merging firms, and indeed, one interesting feature of Table 8 is that the critical discount factors for the merging parties fall after the merger. In that sense, the merging parties find that collusion is ‘easier’ to sustain post-merger than pre-merger which stands in contrast to the non-merging parties who each find that their critical discount factors increase as a result of the merger. The reason for the latter effect is that non-merging firms’ static collusive and defection payoffs do not change pre- and post-merger, while their Nash equilibrium payoffs unambiguously rise.
6.3 Multimarket contact
The effect of multimarket contact essentially amplifies the results of the standard model. Given non-binding incentive-compatibility constraints, their aggregation across geographical markets puts an increased wedge between the value of tacitly colluding when compared with the value of defecting. Table 9 shows that for the 0–4 market the pre-merger gains to tacitly colluding are in excess of $9.6 million in present value terms for Compaq, $3.6 million for HP (making a total of $13.3 million), $6 million for Dell and $4.2 million for IBM, whereas the corresponding post-merger values are marginally lower at $13.2 million for HP–Compaq while Dell and IBM’s incentives similarly decrease by fairly small amounts. For the same reasons as in the benchmark case, the net gains from colluding decreased for all non-merging parties (see %V(C–D).)
In the 4–10 market segment, the gains from coordination both pre- and post-merger are more substantial in both absolute and relative terms. For example, the results suggest that a player such as Dell would gain almost $93 million post-merger by sustaining the collusive outcome. The gains from Fujitsu and NEC are also noticeable, especially when compared with IBM’s post-merger $32 million, and come mostly from their strong position in the Japanese market. However, as in the benchmark case, all non-merging firms see a decrease in their relative incentive to collude post-merger relative to the situation pre-merger. In our example, the merging parties also see a decrease in their relative payoff to collusion following the merger. An analysis of the critical discount factors shows qualitatively similar results as those obtained for the single market contact case (see the discussion of Table 8.) Finally, for completeness, we note that unreported results obtained for the case aggregating across both geographical markets and market niches also provides similar results.54
54See Supplementary Tables C for further results on critical discount factors.

27
TABLE 9 Multimarket value functions
Pre-merger Post-merger Firm V coll V def V (C–D) V coll V def V (C–D) % V (C–D)
Panel A: 0–4 price segment Compaq 190,539 180,875 9,664 HP 82,859 79,173 3,685 273,398 260,204 13,193 –1.2 Fujitsu 39,635 38,490 1,145 39,635 38,625 1,009 –11.8 NEC 21,920 21,379 541 21,920 21,407 514 –5.0 IBM 104,840 100,565 4,276 104,840 100,800 4,040 –5.5 AST 4,458 4,174 284 4,458 4,180 278 –2.2 Data Gen 2 2 0 2 2 0 –14.6 Dell 127,078 120,894 6,184 127,078 121,157 5,921 –4.2 Gateway 14,991 14,187 805 14,991 14,211 780 –3.0 Hitachi 6,634 6,510 124 6,634 6,514 119 –3.7 Micron 2,813 2,639 173 2,813 2,643 170 –2.2 Mitsubishi 2,681 2,634 48 2,681 2,635 46 –3.8 SGI 494 476 19 494 478 17 –12.1 Sun 3,765 3,529 236 3,765 3,534 231 –2.2 Toshiba 9,576 9,250 327 9,576 9,260 316 –3.2 Unisys 1,368 1,281 87 1,368 1,283 85 –2.2 VA Linux 8,674 8,130 544 8,674 8,143 532 –2.3 Panel B: 4–10 price segment Compaq 887,984 775,570 112,414 HP 197,344 175,525 21,820 1,085,328 955,530 129,798 –3.3 Fujitsu 193,417 167,352 26,065 193,417 170,854 22,563 –13.4 NEC 133,937 111,866 22,072 133,937 113,166 20,771 –5.8 IBM 368,880 330,225 38,655 368,880 336,748 32,132 –16.8 AST 11,401 10,193 1,208 11,401 10,442 959 –20.6 Data Gen 63 59 4 63 59 4 –11.4 Dell 824,591 723,664 100,927 824,591 731,787 92,803 –8.0 Gateway 66 57 9 66 58 8 –12.6 Hitachi 20,209 16,906 3,303 20,209 17,055 3,155 –4.4 Mitsubishi 12,536 10,520 2,017 12,536 10,603 1,934 –4.1 NCR 9,626 8,904 722 9,626 8,975 650 –9.8 Sun 125,787 112,472 13,314 125,787 114,198 11,589 –12.9 Toshiba 32,409 27,354 5,056 32,409 27,612 4,797 –5.1 Unisys 771 697 74 771 719 52 –29.7 VA Linux 1,560 1,401 159 1,560 1,438 122 –23.3
Note: Figures are in thousand 1996 US dollars. The post-merger values for HP report the percentage change of the post-merger values of the merged entity, HP–Compaq, with respect to the combined pre-merger values of HP and Compaq.
6.4 The competitive fringe model
Next we report the results of the competitive fringe model. We examined a number of alternative sets of dominant firms, including four (Compaq, HP, Dell, IBM), five (plus Sun) or six (plus Fujitsu-Siemens) dominant firms. In fact, we obtained qualitatively similar results in each case, so we only report results for the competitive fringe (CF hereafter) model with four dominant firms; see Table 10.

28
TABLE 10 Competitive fringe model value functions—0–4 and 4–10 price segments
Pre-merger Post-merger Firm V coll V def V (C–D) V coll V def V (C–D) % V (C–D)
Panel A: 0–4 price segment Region: USA Compaq 100,194 99,804 390 HP 29,902 29,823 79 130,096 129,670 426 –0.4 Dell 52,951 52,785 165 52,951 52,865 86 –1.9 IBM 43,967 43,844 122 43,967 43,910 56 –1.9 Region: EU Compaq 68,364 67,853 511 HP 41,380 41,131 249 109,744 109,111 632 –16.8 Dell 20,786 20,676 110 20,786 20,783 3 –97.5 IBM 36,978 36,763 215 36,978 36,950 28 –87.1 Region: Japan Compaq 12,931 12,882 48 HP 8,113 8,083 30 21,044 20,968 76 –2.8 Dell 19,237 19,151 86 19,237 19,164 73 –15.0 IBM 37,921 37,720 202 37,921 37,745 176 –12.7 Region: USA/ EU/Japan Compaq 181,489 180,540 949 HP 79,395 79,037 358 260,884 259,749 1,134 –13.2 Dell 92,973 92,612 361 92,973 92,811 162 –55.2 IBM 118,866 118,327 539 118,866 118,606 260 –51.7 Panel B: 4–10 price segment Region: USA Compaq 221,678 213,785 7,893 HP 39,304 38,352 952 260,982 252,540 8,442 –4.6 Dell 418,323 390,127 28,196 418,323 392,420 25,903 –8.1 IBM 146,204 142,172 4,031 146,204 143,147 3,057 –24.2 Region: EU Compaq 536,485 498,470 38,015 HP 108,938 104,794 4,144 645,423 607,656 37,767 –10.4 Dell 145,295 139,037 6,258 145,295 142,692 2,603 –58.4 IBM 217,368 208,487 8,881 217,368 214,871 2,497 –71.9 Region: Japan Compaq 60,341 59,501 840 HP 31,356 31,011 345 91,697 90,675 1,021 –13.8 Dell 24,767 24,489 278 24,767 24,663 103 –62.8 IBM 36,163 35,764 399 36,163 36,061 102 –74.5 Region: USA/ EU/Japan Compaq 818,504 771,756 46,748 HP 179,598 174,157 5,442 998,102 950,871 47,231 –9.5 Dell 588,384 553,652 34,732 588,384 559,775 28,609 –17.6 IBM 399,734 386,423 13,311 399,734 394,079 5,656 –57.5
Note: Figures are in thousand 1996 US dollars. The post-merger values for HP report the percentage change of the post-merger values of the merged entity, HP–Compaq, with respect to the combined pre-merger values of HP and Compaq.
In examining the results reported in Table 10, it is useful to compare them with those in Tables 6 and 7 for the full set of firms coordinating. For example, in the US $0–$4,000 segment, Dell’s NPV of pre-merger cooperative profits drop from $73,654,000 (see Table 6) to $52,951,000 (see Table 10). In general, a smaller dominant group should be expected to support only lower coordinated prices and hence achieve lower profits and indeed Compaq and HP have a similar experience to Dell in that their profits from full coordination (all firms) are higher than with only a partial coalition. However, notice that not all firms are worse off with the smaller dominant firm group. IBM, for example, actually does better with the smaller coordinating group—its share of coordinated profits in the US $0-4,000 rise from $39.8 million (see Table 6) to $44 million (see Table 10). Intuitively, if some tacitly co-ordinating members are heavily constrained by outsiders while others are not, then the

29
smaller group may find it optimal to sacrifice disproportionately the profits of the most constrained firms. In our case, this appears to be the case, to IBM’s benefit.
TABLE 11 Comparison of critical discount factors for the 0–4,000 price segment for alternative market configurations
I II III IV V (Table 4) (Table 8) (Table 11)
Firms CAPM discount
factor Benchmark model Multimarket
contact Competitive fringe Multimarket &
competitive fringe
USA EU Japan USA/EU/
Japan USA EU Japan USA/EU/ Japan
Compaq 0.967 0.102
0.198 0.522 0.149 0.360 0.363 0.630 0.385
HP 0.967 0.166
0.270 0.530 0.236 0.652 0.532 0.654 0.577
Dell 0.957 0.130
0.310 0.291 0.202 0.510 0.611 0.484 0.541
IBM 0.972 0.158
0.291 0.408 0.245 0.623 0.573 0.379 0.534
Which firms tacitly collude according to the model?
All All ‘Big four’ ‘Big four’
Note: The market configuration referred to in Column II is such that all firms tacitly collude, meaning 14, 11 and 10 firms in the US, European and Japanese market respectively (see Table 6 for the corresponding value functions). The market configuration referred to in Column III is such that 17 firms tacitly collude (see Table 9, Panel A, for the corresponding value functions). Finally, the market configurations referred to in Columns IV–V is such that only the ‘Big Four’ firms (Compaq, HP, Dell and IBM) tacitly collude (see Table 10 for the corresponding value functions).
Next we introduce both multimarket contact and a competitive fringe. Doing so involves incorporating two forces acting, generally, in different directions. In the main, multimarket contact helps cooperation while a competitive fringe generally makes it more difficult. In our empirical example, the net impact is that firms retain the ability to coordinate both pre- and post-merger (see Table 10). We obtained similar results when allowing for multimarket contact across the price segments as well as across regions.
Table 11 collects and compares the estimates of (pre-merger) critical discount factors across models in the $0–$4,000 price segment. Interestingly, multimarket contact has distinctly ambiguous effects empirically across jurisdictions. For instance, the critical value for Compaq under multimarket contact (see column III of Table 11) is 0.149 while in the benchmark model (column II) the critical values, which naturally vary by jurisdiction, is lower at 0.102 in the USA but higher at 0.198 in the EU and considerably higher at 0.522 in Japan. Thus multimarket contact would ease the difficulty of coordination in Japan, but it would make it actively more difficult in the USA. This empirical result is intuitive—pooling the IC constraints effectively means that an ‘averaging’ of critical values occurs across markets. In the model with both multimarket contact and a competitive fringe, column V shows that multi-market contact does not fully offset the disadvantages of the competitive fringe for coordination so that critical discount factors remain substantially above those for the benchmark model.
6.5 Smaller partial coalitions
Next we consider the three firm cooperative groups formed by Compaq, HP and IBM and, in particular, the effect of the HP–Compaq merger on such a small group of coordinating firms. Table 12 reports the results. We find that while pre-merger, the gains to cooperating are positive for all firms in all jurisdictions and market segments (see columns headed Pre-merger), post-merger cooperation is, in contrast, not always incentive-compatible. For example, in the USA and EU in the $0–$4,000 price segment the model suggests that IBM

30
would not be willing to coordinate.55
55Similarly, the EU and Japan in the 4–10 market segment (while the incentive to cooperate in the USA is predicted to remain positive, but drop by 75 per cent as a result of the merger.)
Thus, the model suggests that the HP–Compaq merger will make tacit cooperation harder to sustain. The results with multimarket contact show that it is not to be enough to reintroduce the concerns around competition in this instance. Of course, as we have already noted, the test being applied throughout this paper is whether ‘perfect’ tacit coordination among cooperating firms can be sustained. Allowing for imperfect cooperation, would mean that while the coordinating group doesn’t succeed in maximizing their collective profits, they may nonetheless be able to find a set of prices at which IBM and HP–Compaq are willing to coordinate. Davis and Sabbatini (2010) study such situations numerically and find, intuitively, that the large firm will often be willing to ‘give up’ some collusive profits to make it worthwhile for unwilling partner(s) to cooperate. Doing so typically involves selecting prices which are above the perfectly collusive prices for the unwilling partner and below the collusive prices for the ‘leader’ in the coordinating group. We pause to note that such predictions are, at least in principle, testable using conventional techniques from the empirical identification of conduct literature.

31
TABLE 12 Value functions for the tacit coordination among Compaq, HP and IBM
Pre-merger Post-merger Firm V coll V def V (C–D) V coll V def V (C–D) % V (C–D)
Panel A: 0–4 market segment Region: USA Compaq 99,957 99,791 166 HP 29,831 29,818 13 129,788 129,654 133 –25.7 IBM 43,862 43,838 24 43,862 43,904 –42 Region: EU Compaq 68,137 67,841 296 HP 41,243 41,122 121 109,380 109,096 284 –31.9 IBM 36,855 36,757 99 36,855 36,944 –89 Region: Japan Compaq 12,887 12,879 8 HP 8,086 8,081 4 20,973 20,963 10 –22.1 IBM 37,794 37,713 81 37,794 37,739 55 –31.7 US/EU/Japan markets Compaq 180,981 180,510 471 HP 79,160 79,022 138 260,141 259,714 427 –29.9 IBM 118,512 118,308 204 118,512 118,587 –75 Panel B: 4–10 market segment Region: USA Compaq 216,202 213,050 3,152 HP 38,398 38,163 236 254,600 251,743 2,858 –15.7 IBM 142,961 141,661 1,301 142,961 142,638 323 –75.2 Region: EU Compaq 519,135 497,591 21,545 HP 105,411 104,515 896 624,546 606,829 17,717 –21.1 IBM 210,292 208,043 2,249 210,292 214,476 –4,184 Region: Japan Compaq 60,042 59,482 560 HP 31,203 30,999 204 91,245 90,698 547 –28.4 IBM 35,986 35,752 234 35,986 36,069 –82 US/EU/Japan markets Compaq 795,380 770,122 25,258 HP 175,012 173,677 1,335 970,391 949,270 21,121 –20.6 IBM 389,240 385,455 3,785 389,240 393,183 –3,943 Panel C: Multimarket contact across geographical markets and price segments Compaq 976,361 950,632 25,728 HP 254,172 252,698 1,473 1,230,532 1,208,984 21,549 –20.8 IBM 430,819 427,514 3,305 430,819 434,273 –3,454
Note: Figures are in thousand 1996 US dollars. The post-merger values for HP report the percentage change of the post-merger values of the merged entity, HP–Compaq, with respect to the combined pre-merger values of HP and Compaq.
6.6 Side payments and ‘balanced temptation’
Next, following Sabattini (2006), recall that Friedman (1971) introduced a notion of the ‘balanced temptation’ equilibrium as a mechanism for achieving a cooperative outcome in a non-cooperative setting. The idea is that all firms would, in a particular sense, be equally tempted to defect from the tacitly cooperating group of firms, specifically, that they would have the same discount factor.56
56In Friedman’s words (p9), ‘the ratio of short term gain … to the loss per period of having done so is identical for all players’.
Friedman argued that this was the lowest discount factor capable of sustaining cooperation on the Pareto frontier of the set of feasible profits of the

32
industry and that this was a less extreme solution than that suggested by the maximization of industry profits.
One way to implement this equilibrium is to allow for side payments across firms up to the point that discount factors are uniform, so that firms which benefit from a collusive solution are allowed to make transfers to others and in so doing will generate incentives for other firms to take part in the collusive agreement. In particular, side payments may make co-operation incentive-compatible for every player, thus making the collusive agreement more stable. Specifically, for any given Fδδδ === ..1 we can calculate, the net side payments
fλ f=1,..,F required for each firm to sustain cooperation:
)()()()(∆−∆−∆−∆
= NEf
Deff
fCollf
Deff
f ππλππδ .
Since side-payments must add to zero, 01
=∑=
F
ffλ we can determine both δ and the set of
fλ ’s. As always, we can consider both full and partial coalitions.
Table 13 reports the results and shows that the side payments required are generally quite small, less than $300,000 per quarter in each of the markets and market segments we con-sidered. Mechanisms, such as purchases of goods from rival companies, could potentially be used to achieve side payments of this kind of magnitude. The form of the transfers required are themselves interesting. In Panel A, transfers are each from Compaq to its smaller rivals (pre-merger; and from HP–Compaq post-merger) as the small firms must be induced to cooperate. The one interesting exception to this pattern is in Japan in the 4–10 market segment, where Dell is found to need to compensate HP and HP–Compaq.

33
TABLE 13 Side payments to sustain uniform critical discount factors across coordinating firms
0–4 market segment 4–10 market segment
Firm Pre-
merger Post-
merger Pre-
merger Post-
merger
Panel A: Compaq-HP-IBM tacit coordination Region: USA Compaq –1.9 –25.0 HP 0.9 –1.9 12.5 –25.0 IBM 0.9 1.9 12.5 25.0 Region: EU Compaq –2.4 –248.6 HP 1.0 –4.0 108.1 –229.4 IBM 1.3 4.0 140.5 229.4 Region: Japan Compaq 0.4 –4.1 0.0 HP 0.3 0.4 2.0 –6.3 IBM –0.8 –0.4 2.1 6.3 US/EU/Japan markets Compaq –3.8 –277.1 HP 2.3 –5.5 123.0 –259.8 IBM 1.5 5.5 154.1 259.8 Panel B: Compaq-HP-Dell tacit coordination Region: USA Compaq –1.8 165.9 HP 1.3 –2.3 66.1 181.8 Dell 0.6 2.3 –232.0 –181.8 Region: EU Compaq –2.4 –214.8 HP 0.9 –3.9 108.4 –184.8 Dell 1.5 3.9 106.4 184.8 Region: Japan Compaq 0.2 –3.5 HP 0.2 0.1 2.2 –5.2 Dell –0.4 –0.1 1.4 5.2 US/EU/Japan markets Compaq –4.1 –53.2 HP 2.4 –6.1 176.3 –10.2 Dell 1.7 6.1 –123.1 10.2
Note: Figures are in thousand 1996 US dollars per quarter.
6.7 Accounting for antitrust action
Next we examine the possibility of punishment for participating in tacitly cooperative agree-ments following the IC constraint developed in Section 3.3.3 above. The expanded IC constraint is:
−
+>
+
−+
−− f
fNEf
fDeff
Collf
f
fNEf
fCollf
f
vqq δ
δπδπτδδπδπ
δ 1)(Re
1)(
)1(11

34
TABLE 14 Value functions accounting for enforcement in the competitive fringe model
Pre-merger Post-merger Firm V coll V def V (C–D) V coll V def V (C–D)
US jurisdiction 0–4 price segment Compaq 95,850 99,804 –3,954 HP 27,907 29,823 –1,917 123,768 129,670 –5,902 Dell 50,262 52,785 –2,524 50,277 52,865 –2,588 IBM 41,468 43,844 –2,376 41,485 43,910 –2,425 4–10 price segment Compaq 210,159 213,785 –3,626 HP 36,807 38,352 –1,545 247,098 252,540 –5,442 Dell 406,820 390,127 16,693 407,256 392,420 14,836 IBM 140,175 142,172 –1,997 140,433 143,147 –2,713 Multimarket contact: 0–4 & 4–10 segments Compaq 306,010 313,589 –7,580 HP 64,713 68,175 –3,462 370,866 382,210 –11,343 Dell 457,081 442,912 14,170 457,533 445,285 12,248 IBM 181,643 186,017 –4,374 181,919 187,057 –5,138 EU jurisdiction 0–4 price segment Compaq 63,991 67,853 –3,862 HP 39,344 41,131 –1,787 103,368 109,111 –5,744 Dell 18,107 20,676 –2,569 18,127 20,783 –2,655 IBM 34,454 36,763 –2,309 34,504 36,950 –2,447 4–10 price segment Compaq 517,930 498,470 19,460 HP 105,643 104,794 849 624,729 607,656 17,073 Dell 137,949 139,037 –1,087 138,645 142,692 –4,047 IBM 210,025 208,487 1,538 211,718 214,871 –3,154 Multimarket contact: 0–4 & 4–10 segments Compaq 581,921 566,323 15,598 HP 144,986 145,924 –938 728,097 716,768 11,329 Dell 156,056 159,712 –3,656 156,772 163,475 –6,702 IBM 244,479 245,250 –771 246,221 251,821 –5,600 Japan jurisdiction 0–4 price segment Compaq 8,668 12,882 –4,215 HP 6,130 8,083 –1,953 14,799 20,968 –6,169 Dell 16,564 19,151 –2,587 16,566 19,164 –2,597 IBM 35,402 37,720 –2,317 35,409 37,745 –2,336 4–10 price segment Compaq 50,609 59,501 –8,892 HP 29,041 31,011 –1,970 79,693 90,675 –10,982 Dell 18,650 24,489 –5,839 18,683 24,663 –5,980 IBM 31,217 35,764 –4,547 31,296 36,061 –4,765 Multimarket contact: 0–4 & 4–10 segments Compaq 59,277 72,383 –13,107 HP 35,171 39,094 –3,923 94,492 111,643 –17,151 Dell 35,214 43,640 –8,426 35,250 43,827 –8,577 IBM 66,619 73,483 –6,864 66,705 73,806 –7,101
Note: Figures are in thousand 1996 US dollars.
We set τ=0.1 since evidence on fine levels in the three geographic regions considered suggested that would be broadly appropriate.57
57Specifically, in the EU, the maximum fine for each firm is 10 per cent of its total turnover in the preceding business year. See Regulation EC No 1/2003 at
Calibrating a reasonable value for q, the
http://europa.eu/scadplus/leg/en/lvb/l26092.htm. In the USA, the 2007 Federal Sentencing Guidelines state that for an organization, the fine shall be 20 per cent of the volume of affected commerce. See www.ussc.gov/2007guid/2r1_1.html. In Japan, the maximum fine by the Japanese Fair Trade Commission is 10 per cent of the sales value of the relevant goods or services. See the amendments of the Japanese Antimonopoly Act introduced in 2005 at www.icn-kyoto.org/documents/materials/Fines%20report%20-%20FINAL.pdf and www.jftc.go.jp/e-page/index.html for more

35
probability that a tacitly cooperating firm is caught in a given quarter, given that it was not caught before, is difficult, both for us and, no doubt, for firms considering such coordination. One admittedly imperfect approach to the problem is to use the results from Levenstein and Suslow (2006), whose survey reports that the average cartel lasts for between 3.7 and 7.5 years (11 and 30 quarters respectively). For each figure, we compute the corresponding parameter of a geometric distribution (the discrete counterpart of the exponential distri-bution), leading to a probability of a cartel being caught at a given quarter (given that it was not caught before) of 0.091 and 0.033 respectively. Since we expect this particular type of cartel to be difficult to detect and difficult to take enforcement action against, in what follows we began by using the smaller of these two numbers but primarily, for reasons we explain below, we report the results using q =0.01.
We compute the incentive-compatibility constraints for each jurisdiction (geographic market —USA, EU and Japan) separately in the case where the dominant firm group consists of Compaq, HP, Dell and IBM. The results in Table 14 suggest that tacit cooperation does not pay off for any of the large firms in the 0–4 price segment in any jurisdiction. The same is true in Japan in the 4–10 price segment; however, it does pay for some of the firms to cooperate in that segment (Dell in the USA, pre- and post-merger; HP, Compaq and IBM pre-merger and HP–Compaq post-merger in the EU).
The results, while based on strong assumptions, do indicate that even if the probability of cartel detection and prosecution is small, if authorities use the full potential magnitude of their powers to fine, then such punishments can play a role in inhibiting collusive behaviour. Of course, whether incentives are, in practice, changed sufficiently to deter tacit cooperation will depend both on firms’ expectations of the probability of successful enforcement action and also on the details of the industry being considered. Specifically, the deterrent effect of a fining regime based on maximum fines involving a fraction of worldwide revenues for an industry will depend on the relative scale of annual revenues and the NPV of profits. In the server market, our demand estimates suggest that the industry has large revenues but, even under cooperation, relatively high own-price elasticities of demand and hence low price-cost margins. Such circumstances are likely to be favourable for this structure of fines to work to deter collusive behaviour.
- - - - - - - - - - information. In practice, fine levels can be smaller than these figures. First, in the EU and Japan they are maximums, and second, jurisdictions operate leniency and other programmes which mean that ‘discounts’ may be available.

36
TABLE 15 Rejections of the null hypothesis of equality between model-implied and CAPM betas against the two-sided alternative
Pre-merger Post-merger 0–4
segment 4–10
segment 0–4
segment 4–10
segment Standard model USA 12/12 6/8 11/11 5/7 EU 9/9 10/10 5/8 7/9 Japan 7/10 11/12 7/9 10/11 Standard model + MM contact (aggregation
across regions) 14/14 11/13 13/13 11/12 Standard model + MM contact (aggregation
across regions and price segments) 13/15 12/14 Competitive fringe model (HP, Compaq, Dell, IBM) USA 4/4 4/4 3/3 3/3 EU 3/4 4/4 3/3 3/3 Japan 3/4 4/4 3/3 3/3 Competitive fringe model + MM contact
(aggregation across regions) 3/4 2/4 3/3 2/3 Competitive fringe model + MM contact
(aggregation across regions and price segments) 1/4 2/3 Tacit coordination model (HP, Compaq, Dell, IBM) USA 4/4 4/4 3/3 3/3 EU 3/4 4/4 3/3 3/3 Japan 3/4 1/4 3/3 3/3 Tacit coordination model + MM contact
(aggregation across regions) 3/4 2/4 3/3 2/3 Tacit coordination model + MM contact
(aggregation across regions and price segments) 2/4 2/3
Note: The table reports the number of rejections at the 1 per cent significance level of the null hypothesis of equality between the model-implied and CAPM betas against the two-sided alternative. For a given combination of rows and columns, the first number is the number of rejections, whereas the second number is the number of firms which operate in the market and for which the CAPM was estimated. Whenever the null was not rejected, the name of the firm is reported.
6.8 Testing the difference between critical and estimated discount factors
Next, we consider how far apart critical discount factors are from the discount factors estimated using the finance models. We consider this issue by comparing the implied betas instead of discount factors directly since we estimated betas using a linear model so that approximate statistical tests are easier to deal with. To make the comparison we back out the betas implied by the critical discount factors and examine whether they are within the 99 per cent confidence interval of the corresponding asset pricing betas.58
Table 15 reports that, in the main, critical discount factors from our various models are significantly smaller than the estimated discount factors reflecting the firms cost of capital. In the benchmark model, no more than three have an implied beta which falls within the 99 per cent confidence interval for the CAPM beta. By and large, this result is unaffected by multi-market contact and suggests that coordination would be sustainable if the benchmark model is a reasonable approximation to reality. Although critical discount factors rise once we allow for a competitive fringe, indicating that coordination appears harder to sustain in that model,
For the great majority of the firms for which we estimate the cost of capital, it is very well approximated by the cost of equity since firms finance themselves using mostly equity (the only firms financed less than 90 per cent by equity are SGI and Unisys).
58Obviously this is an approximate technique since a full statistical analysis would need to consider the way in which uncertainty in the demand estimates translated into our calculations of critical discount factors as well as accounting for the uncertainty arising from the stock market data underlying the finance models. While we could make assumptions such as independence of the demand side and stock market beta estimates and then bootstrap test statistics, even that approach would remain approxi-mate since to fully implement a statistical test we would need to know at least the correlation structure of all our estimated parameters. Since doing so would add a great deal of complication and not a great deal of additional insight, we have not taken that route, despite the probable technical desirability of doing so.

37
we continue to find that in most instances the critical discount factors lie significantly below the estimated discount factors.
Conclusion
This paper attempts to take the coordination literature following Friedman (1971) seriously and to use it to understand the incentives to tacitly coordinate in a particular differentiated product market, the network server market. In doing so, we build on the literature on UEMS, the analysis of firm conduct, the theory of repeated games and the literature on asymmetry and coordination.
We find that in the benchmark tacitly collusive model (built directly on Friedman, 1971) the incentives to collude are substantial, even without assuming sophisticated punishment mechanisms. We find that the merger between HP and Compaq affects the incentive to cooperate, but that the merger actively decreases firms’ incentives to tacitly cooperate. We show that such results will occur in a fairly wide range of circumstances, suggesting that, other things being equal, mergers will generally reduce the incentive to cooperate in the benchmark model. Intuitively, the result emerges because the unilateral effects of a merger will mean that Nash equilibrium payoffs will increase following the merger. In so doing, the return to cooperation falls.
We considered a number of generalizations. First, we considered multimarket contact, following Bernheim and Whinston (1990). Empirically, we found that multimarket contact generally amplifies the incentives to cooperate compared with the benchmark model. How-ever, we found that critical discount factors may increase or decrease relative to their single market cases as multimarket contact pools IC constraints and in so doing means that critical discount rates are effectively ‘averaged’.
Second, we considered the effect of a competitive fringe. Intuitively, we found that models incorporating a competitive fringe constrained the coordinating firms’ ability to raise prices compared with a fully tacitly coordinating industry. However, we found that individual players can be either better or worse off when only a subset of firms tacitly coordinate. A smaller number of firms following the objective of maximizing total profits of the cooperating group may be able to improve the rewards paid to individual members of the smaller group since the objective of the group and the objectives of its members are more closely aligned. On the other hand, individual players may be disproportionately affected by the competitive constraint from the fringe and so a partial coalition may choose to sacrifice individual firms’ profitability for the overall benefit of the group. Clearly, such results will rely heavily on the detailed structure of payoffs in the industry.
Third, we introduced an antitrust authority into the model. We found that even a fairly small probability of a member of a tacitly coordinating coalition being fined by the antitrust authorities, as can happen at least in theory in a number of jurisdictions, would affect firms’ incentives to cooperate in the server market. We found that for realistic fine levels (10 per cent of revenue) and fairly small probabilities of being successfully prosecuted and fined by the antitrust authorities tacit coordination frequently ceases to be incentive-compatible. Such results may suggest that, even if the probability of a cartel being detected is small, the fines can be sufficient to affect the incentive to engage in coordinated behaviour. Naturally, if the reader believes that our estimate of being fined by a competition agency should, in truth, be far smaller than the 1 per cent chance we worked with, then the deterrence effectiveness of fines would become considerably smaller.
By way of closing remarks we first note that in modelling tacit coordination by following Friedman (1971) we make a number of very strong assumptions. In particular, our model is silent about entry and exit by either firms or products. In addition, we do not account for uncertainty and imperfect monitoring as in Green and Porter (1984). As is appropriate for a

38
first piece of empirical work in an area, we recognize that these are strong assumptions and expect that future work simulating the coordinated effects of mergers will attempt to address each of these areas.
Finally, we should be absolutely clear what we are not arguing in this paper. Specifically, our point is not that mergers cannot, or even do not generally, have coordinated effects. Rather our message is more hopeful for coordinated theories of harm and yet also probably more challenging. Mergers we find can have coordinated effects but the precise mechanisms at work are currently not well understood and the tools for evaluating whether individual merger cases have coordinated effects are very limited. Building empirical models seems likely to help us understand the various mechanisms that can be at play and our aim has been to make a first albeit perhaps modest contribution in that process.
39
References
Abreu, D (1986), ‘Extremal Equilibria of Oligopolistic Supergames’, Journal of Economic Theory, 39(1), 191–225.
Abreu, D (1988), ‘On the Theory of Infinitely Repeated Games with Discounting’, Econometrica, 56(2), 383–396.
Abreu, D, D G Pearce and E Stacchetti (1986), ‘Optimal Cartel Equilibria with Imperfect Monitoring’, Journal of Economic Theory, 39(1), 251–69.
Abreu, D, D G Pearce and E Stacchetti (1990), ‘Toward a Theory of Discounted Repeated Games with Imperfect Monitoring’, Econometrica, 58, 1041–1063.
Aumann, R (1985), ‘Repeated Games’ in Issues in Contemporary Microeconomics and Welfare, ed. G R Feiwel. London: Macmillan.
Aumann, R (1989), ‘Survey of repeated games’ in Essays in Game Theory and Mathematical Economics in Honor of Oskar Morgenstern. Manheim: Bibliographisches Institut.
Bagwell, K and R Staiger (1997), ‘Collusion over the Business Cycle’, RAND Journal of Economics, 28(1), Spring, 82–106.
Baker, J B and T F Bresnahan (1985), ‘The Gains from Merger or Collusion in Product differentiated Industries’, Journal of Industrial Economics, 33, 427–44.
Berk, J and P DeMarzo (2007), ‘Corporate Finance’, Boston: Addison-Wesley.
Bernheim, D B, and M D Whinston (1990), ‘Multimarket Contact and Collusive Behavior’, RAND Journal of Economics, 21(1), 1–26.
Berry, S (1994), ‘Estimating discrete choice models of product differentiation’, RAND Journal of Economics, 25(2), 242–262.
Berry, S, J Levinsohn and A Pakes (1995), ‘Automobile Prices in Market Equilibrium’, Econometrica, 63(4), 841–890.
Berry, S, J Levinsohn and A Pakes (2004), ‘Differentiated product demand systems from a combination of micro and macro data: The new car market’, Journal of Political Economy, 112, 68–105.
Besley D, Kuh E, Welsh R (1980), ‘Regression Diagnostics’, New York: John Wiley and Sons, Inc.
B onnet, C, and P Dubois (2008), ‘Inference on Vertical Contracts between Manufacturers and Retailers Allowing for Non Linear Pricing and Resale Price Maintenance’, IDEI Working Paper, No 519.
Bonnet, C, P Dubois and M Simioni(2006), ‘Two-Part Tariffs versus Linear Pricing between Manufacturers and Retailers: Empirical Tests on Differentiated Products Markets’, IDEI Working Paper, No 370 (revised).
Brenkers, R and F Verboven (2006), ‘Liberalizing a Distribution System: the European Car Market,’ Journal of the European Economic Association, 4(1), 216–251.

40
Bresnahan, T (1982), ‘The Oligopoly Solution Concept is Identified,’ Economics Letters, 10, 87–92.
Bresnahan, T (1986), ‘Measuring the spillovers from technical advance: Mainframe computers in financial services’, American Economic Review, 76,(4), 742–755.
Bresnahan, T (1987), ‘Competition and Collusion in the American Automobile Market: The 1955 Price War’, Journal of Industrial Economics, 35(4), 457–482.
Bresnahan, T and S Greenstein (1996), ‘Technical Progress and Co-invention in computing and in the uses of computers’, Brooking Papers on Economic Activity: Microeconomics, 1–78.
Bresnahan, T, S Stern and M Trajtenberg (1997), ‘Market segmentation and the sources of rents from innovation: Personal computers in the late 1980s’, RAND Journal of Economics 28, S17–S44.
Brock, W A, and J A Scheinkman (1985), ‘Price Setting Supergames with Capacity Constraints’, Review of Economic Studies, 52(3), 371–82.
Carhart, M (1997), ‘On Persistence in Mutual Fund Performance’, Journal of Finance 45(5),57–82.
Chamberlin, E (1929), ‘Duopoly: Value where sellers are few’, Quarterly Journal of Economics, 43, 63–100.
Chan, L K, N Jegadeesh and J Lakonishok (1996), ‘Momentum strategies’, Journal of Finance, 51, 1681–1714.
Compte, O Jenny, F and Rey, P (2002) ‘Capacity Constraints, Mergers and Collusion’, European Economic Review, 46, 1–29.
Corts, K S (1999), ‘Conduct Parameters and the Measurement of Market Power,’ Journal of Econometrics, 88(2), 227–250.
Davidson, C and Deneckere, R J (1984a), ‘Horizontal Mergers and Collusive Behavior,’ International Journal of Industrial Organization, 2, 117–132.
Davidson, C, and Deneckere, R J (1984b), ‘Excess Capacity and Collusion’, International Economic Review, 31(3), pp521–41.
Davidson, C and Deneckere, R J (1985), ‘Incentives to Form Coalitions with Bertrand Competition’, RAND Journal of Economics, 16(4), 473–86.
Davis, P and Sabbatini, P (2008), ‘How to Simulate the Coordinated Effects of a Merger’, mimeo.
European Commission (2004), Judgment on European Commission vs Microsoft, Brussels, 24 March 2004.
Fama, E and K French (1992), ‘The Cross-Section of Expected Stock Returns’, Journal of Finance, 47, 427–465.
Fama, E, and K French (1993), Common Risk Factors in the Returns on Stocks and Bonds, Journal of Financial Economics, 33, 3–53.

41
Fama, E and K French (2001), ‘Multifactor Explanations of Asset Pricing Anomalies’, Journal of Finance, 51, 55–84.
Farrell, J and C Shapiro (1990), ‘Horizontal Mergers: An Equilibrium Analysis’, American Economic Review, 80, 107–25.
Foncel, J and M Ivaldi (2001), ‘Operating System Prices in the Home PC market’, Journal of Industrial Economics, 53(2), June, 265–97.
Friedman J (1971), ‘A Non-cooperative Equilibrium for Supergames’, Review of Economic Studies, 38, 1–12.
Gartner Group (1999, 2000, 2001, 2002, 2003, 2008). Gartner Dataquest.
Gollop, F and M Roberts (1979), ‘Firm interdependence in oligopolistic markets’, Journal of Econometrics, 10, 313–331.
Gorman, W M (1955), ‘The Intransitivity of Certain Criteria Used in Welfare Economics’, Oxford Economic Papers, Vol 7, pp25–35.
Gorman, T (1970), ‘Two Stage Budgeting’, mimeo University of North Carolina, reprinted in C Blackorby and A F Shorrocks (eds) Separability and Aggregation Volume I: The Collected Works of Terence Gorman, Oxford: Oxford University Press.
Green E J and R Porter (1984), ‘Noncooperative Collusion Under Imperfect Price Information’, Econometrica, January, 52(1), 87–100.
Gowrisankaran, G and M Rysman (2007), ‘Dynamics of Consumer Demand for New Durable Goods’, forthcoming in Econometrica.
Hausman, J, G Leonard and D Zona (1994), ‘Competitive Analysis with Differentiated Products’, Annales d’Economie et de Statistique, 34, 159–180.
Hausman, J (1997), ‘Valuation of New Goods under perfect and imperfect competition’, Chapter 5 in Timothy Bresnahan and Robert Gordon (eds) The Economics of New Goods, Chicago: University of Chicago Press.
Harrington J (1989), ‘Collusion Among Asymmetric Firms: The Case of Different Discount Factors’, International Journal of Industrial Organization, pp289–307.
Harrington J (1991): ‘The Determination of Price and Qutput Quotas in a Heterogeneous Cartel’, International Economic Review, Vol. 32, p. 767–792;
Hendel, I (1999), ‘Estimating Multiple-Discrete Choice Models: An Application to Computerization Returns’, Review of Economic Studies, April, 423–46.
Hendel, I, and A Nevo (2006), ‘Measuring the Implications of Sales and Consumer Inventory Behaviour’, Econometrica, November, 74(6), 1637–73.
International Data Corporation (1998), ‘IDC's Server Market Methodology, Database Structure, and Definitions’, IDC report no 15909R, April 1998.
International Data Corporation (2000a), ‘Server Operating Environments Market Forecast and Analysis, 2000–2004’, IDC report no 22347, June 2000.
International Data Corporation (2000b), ‘Server Market Forecast and Analysis, 1996–2004’, IDC report no 22538, July 2000, pp11–14.

42
International Data Corporation (2002), ‘Delivering value in the Volume Server Market – Sun's V480 Attacks the 4-Way Space’.
International Data Corporation (2007), ‘Quad-core Processors Bring Higher Performance and Lower Cost to Mainstream Computing’, White Paper no 206309, April 2007.
Ivaldi, M and S Lörincz (2008), ‘Implementation Relevant Market Tests in Antitrust Policy: Applications to Computer Servers’, Review of Law and Economics.
Ivaldi, M, B Jullien, P Rey, P Seabright and J Tirole (2003), ‘The Economics of Tacit Collusion’, Final Report for DG Competition, March 2003. Available from: http://ec.europa.eu/competition/mergers/studies_reports/the_economics_of_tacit_collusion_en.pdf (last verified, January 2010).
Ivaldi, M and F Verboven (2001), ‘Quantifying the effects of horizontal mergers in European Competition Policy’, Centre for Economic Policy Research Discussion Paper No 2697.
Jegadeesh, N and S Titman (1993), ‘Returns to buying Winners and selling Losers: Implications for stock market efficiency’, Journal of Finance, Vol 48, pp65–91.
Kovacic, W E, R C Marshall, L M Marx, and S P Schulenberg (2007), ‘Coordinated Effects in Merger Review: Quantifying the Payoffs from Collusion’, mimeo, Duke University.
Kühn, K-U (2004), ‘The Coordinated Effects of Mergers in Differentiated Product Markets’, John M Olin Center for Law and Economics, Working Paper Series, paper 34.
Lambson, V E (1987), ‘Optimal Penal Codes in Price-Setting Supergames with Capacity Constraints’, Review of Economic Studies, 54:385–397.
Lambson, V E (1994), ‘Some Results on Optimal Penal Codes in Asymmetric Bertrand Supergames’, Journal of Economic Theory, 62, 444–468.
Lambson, V E (1995), ‘Optimal Penal Codes in Nearly Symmetric Bertrand Supergames with Capacity Constraints,’ Journal of Mathematical Economics, 24(1), 1–22.
Lancaster, K J (1966), ‘A New Approach to Consumer Theory’, Journal of Political Economy, 74(2), 132–157.
Lehrer, E and A Pauzner (1999), ‘Repeated games with differential time preferences’, Econometrica, 67, 393–412.
Levenstein, M and V Suslow (2006), ‘What Determines Cartel Success?’, Journal of Economic Literature, 54, March, 43–95.
Mertens, J-F (1986), ‘Repeated Games’, in Proceedings of the International Congress of Mathematicians, 1528–77.
Motta, M (2004), Competition Policy: Theory and Practice, Cambridge: Cambridge University Press.
Nakanishi, M and L G Cooper (1974), ‘Parameter Estimate for Multiplicative Interactive Choice Model: Least Squares Approach’, Journal of Marketing Research, 11, 303–311.
Nevo, A (1998), ‘Identification of the Oligopoly Solution Concept in a Differentiated Products Industry’, Economics Letters, 59(3), 391–395.

43
Nevo, A (2000), ‘Mergers with Differentiated Products: The Case of the Ready-to-Eat Cereal Industry’, RAND Journal of Economics, 31(3), 395–421.
Nevo, A (2001), ‘Measuring Market Power in the Ready to Eat Cereal Industry’, Econometrica, 69, 307–342.
Porter, R (1983), ‘A Study of Cartel Stability: The Joint Executive Committee, 1880–1886’, Bell Journal of Economics, 15(2), Autumn, 301–14.
Roberts, M (1984), ‘Testing oligopolistic behavior: An application of the variable profit function’, International Journal of Industrial Organization, 2(4), 367–83.
Rosen, S (1974), ‘Hedonic Prices and Implicit Markets: Product Differentiation in Pure Competition’, Journal of Political Economy, 82, 34–55.
Rotemberg, J and G Saloner (1986), ‘A Supergame-theoretic Model of Business Cycle and Price Wars during Booms’, American Economic Review, 76, 390–407.
Rothschild, R (1999), ‘Cartel Stability when Costs are Heterogeneous’, International Journal of Industrial Organization, 17, pp717–734.
Sabbatini, P (2004), ‘How to Simulate the Coordinated Effect of a Merger’, Working paper, Italian Antitrust Authority, November 2004.
Salvo, A (2004), ‘Inferring Conduct Under the Threat of Entry: The Case of the Brazilian Cement Industry’, mimeo, LSE.
Scheffman, D and M Coleman (2003), ‘Quantitative Analysis of Potential Competitive Effects from a Merger’, George Mason University Law Review, Winter Antitrust Symposium.
Selten, R (1965), Spieltheoretische Behandlung eines Oligopolmodells mit Nachfrageträgheit, Zeitschrift für die Gesamte Staatswissenschaft, 121, 301–24 and 667–89.
Slade, M E (2004), ‘Market power and joint dominance in UK brewing’, Journal of Industrial Economics, 52(1), 133–63.
Stavins, J (1997), ‘Estimating Demand elasticities in a differentiated product industry: The Personal Computer market’, Journal of Economics and Business, 49, 347–367.
Stigler, G J (1964), ‘A Theory of Oligopoly’, Journal of Political Economy, 72, 44–61.
Suslow, V (1986), ‘Estimating monopoly behaviour with competitive application to Alcoa’, RAND Journal of Economics, 17, 389–403.
Sybex (2001), Networking Complete, San Francisco: Sybex.
United States Courts of Appeal (2001), United States vs Microsoft Corporation, No 00–4212.
Van Reenen, J (2006), ‘The Growth of Network Computing: Quality-adjusted Price changes for Network Servers’, The Economic Journal, 116, F29–F44.
Vasconcelos, H (2005), ‘Tacit collusion, cost asymmetries, and mergers’, RAND Journal of Economics, 36, 39–62.

44
Villas-Boas, S (2007), ‘Vertical Relationships Between Manufacturers and Retailers: Inference With Limited Data’, The Review of Economic Studies, 74(2), 625–652.
Werden, G and L Froeb (1994), ‘The Effects of Mergers in Differentiated Products Industries: Structural Merger Policy and the Logit Model’, Journal of Law, Economics & Organization, 10, 407–426.
White, H (1980), ‘A heteroskedastic-consistent covariance matrix estimator and a direct test for heteroskedacity’, Econometrica, 48, 817–838.

45
APPENDIX
Proof to Proposition 1
For non-merging firms mergingnonf −ℑ∈
Since the vector of the industry profit maximizing tacitly collusive prices Collp are indepen-
dent of market structure, f
CollfColl
fpVδ
π−
≡1
)( we have immediately that
)()( postcollusionf
precollusionf VV ∆=∆ provided of course that the discount factors fδ for those
firms remain unchanged post-merger. Turning to the defection payoff, for any non-merging
firm )()( postDeff
preDeff ∆=∆ ππ since collusive prices of rivals have not changed and neither
has the profit function of the non-merging firm. Turning to the Nash payoffs, if a merger
occurs between firms producing substitutes then absent efficiencies, all non-merging firms
are (weakly) better off so that )()( preNEf
postNEf ∆≥∆ ππ for all non-merging firms. Since
f
NEffDef
fDef
fVδ
πδπ−
+≡1
, we can therefore write )()( postDefectionf
preDefectionf VV ∆≤∆ for all non-
merging firms. Since )()( postcollusionf
precollusionf VV ∆=∆ and )()( postDefection
fpreDefection
f VV ∆≤∆ we
have that if a non-merging firm was not willing to collude pre-merger,
)()( preDefectionf
precollusionf VV ∆<∆ , then )()()( postDefection
fpreDefection
fpostcollusion
f VVV ∆≤∆<∆ so that
it is not willing to collude post-merger. Stated alternatively, we can write
)()()()( postDefectionf
postcollusionf
preDefectionf
precollusionf VVVV ∆−∆≥∆−∆ for all mergingnonf −ℑ∈ .
Merging firms
Notice that for any mergingf ℑ∈ since f
CollfColl
fpVδ
π−
≡1
)( while collusive prices are independent
of who owns which products, the profits attributed to any subset of products remains
constant under collusion we can write )()( postcollusion
f
precollusionf merging
merging
VV ∆≥∆ℑ
ℑ∈∑ provided
postpref mergingℑ
≥ δδ for all mergingf ℑ∈ . Finally, notice that aggregate static defection payoffs are
always greater post-merger than pre-merger, ∑ℑ∈
∆∆ℑ≥
mergingprepostmerging
f
Deff
Def pp )()( ππ , since the
enlarged firm has greater flexibility to cheat by undercutting so cannot be made worse off in
so doing than the sum of its constituent parts solving their analogous problems. Similarly,
aggregate post-merger Nash equilibrium profits will be higher for the merged firm since any

46
merger will (weakly) increase Nash equilibrium prices towards collusive levels. Finally, we
note that ∑ℑ∈
ℑ∆≥∆
mergingmerging
f
preNEf
postNE )()( ππ since mergers in pricing games between firms
producing products are profitable so that if δδδ ==ℑpostpre
f merging for all mergingf ℑ∈ , then
∆
−≥
∆
− ∑ℑ∈
ℑmerging
merging
f
preNEf
postNE )(1
)(1
πδ
δπδ
δ, and so
∆
−+∆≥
∆
−+∆ ∑∑
ℑ∈ℑ∈ℑℑ
mergingmergingmergingmerging
f
preNEf
f
preDeff
postNEpostDef )(1
)()(1
)( πδ
δππδ
δπ which allows
us to write ∑ℑ∈
ℑ∆≥∆
mergingmerging
f
preDefectionf
postDefection VV )()( or )()( postDefection
f
preDefectionf merging
merging
VV ∆−≥∆−ℑ
ℑ∈∑ .
Since collusive payoffs do not change, this in turn implies that under our assumptions
)()()()( postDefectionpostCollusion
f
preDefectionf
f
precollusionf mergingmerging
mergingmerging
VVVV ∆−∆≥∆−∆ℑℑ
ℑ∈ℑ∈∑∑ . QED.