estimating the distribution of strontium isotope ratios ... · finland (n=6544) is used to estimate...
TRANSCRIPT
Bulletin of the Geological Society of Finland, Vol. 83, 2011, pp 95–113
LARS KAISLANIEMI
Department of Geosciences and Geography, University of Helsinki, Finland
Estimating the distribution of strontium isotoperatios (87Sr/86Sr) in the Precambrian of Finland
AbstractA method to estimate the 87Sr/86Sr ratio of a rock based on its age and Rb/Sr ratio ispresented. This method, together with data from the Rock Geochemical Database ofFinland (n=6544) is used to estimate the 87Sr/86Sr ratios in the Precambrian of Finlandand in its different major units. A generalization to cover the whole area of Finland isachieved by smoothing of estimation points. The estimation method is evaluated bycomparing its results to published Rb-Sr isotope analyses (n=138) obtained on the Fin-nish Precambrian. The results show correspondence to different geological units of Fin-land, but no systematic difference between Archaean and younger areas is evident.Evaluation of the method shows that most of the estimates are reliable and accurate tobe used as background material for provenance studies in archaeology, paleontologyand sedimentology. However, some granitic rocks may have large (>1.0 %) relative errors.Strontium concentration weighted average of the estimates differs only by 0.001 fromthe average 87Sr/86Sr ratio (0.730) of the rivers on the Fennoscandian shield.
Key words: bedrock, isotopes, Rb/Sr, Sr-87/Sr-86, spatial distribution, provenance,Precambrian, Finland
Corresponding author email: [email protected]
Editorial handling: Arto Luttinen
1. Introduction
Strontium isotopes are commonly used in palaeon-tology and archaeology to find out the territory andmigration paths of organisms and the origins of toolsand organic building materials (e.g. Beard and John-son, 2000; Curran et al., 2001; English et al., 2001;Hodell et al., 2004; Feranec et al., 2007) as well asin sedimentological provenance (e.g. Krom et al.,1999) and environmental change studies (e.g. Åberg,1995). The age and rock type dependent variations
of the strontium isotope ratios in the bedrock areinduced by the decay of 87Rb to 87Sr and by thedifferences in compatibility of strontium and rubi-dium in magmatic systems (Faure & Mensing,2005).
The isotopic fractionation of strontium is closeto nil in physical and chemical processes in sedi-ments, hydrosphere and food chain, and thus theisotope ratio measured from an organism reflectsthe isotope ratios of its nutriment and, ultimately,of its environment (Capo, 1998; Price et al., 1985;
Bulletin_83_2_s95_114_Kaislaniemi.pmd 2.2.2012, 9:0195

96 Lars Kaislaniemi
Halicz et al., 2008). For provenance studies it isnecessary to estimate the strontium isotope ratiosof this environment – soil, sediment, vegetation,etc. – in potential provenance areas, which requiressampling. However, the source of strontium is inthe bedrock (local or allogenic weathered) and, tosome extent, in atmospheric inputs (Gosz & Moo-re, 1989; Miller et al., 1993). This allows the esti-mation of the strontium isotope ratios (87Sr/86Sr) inthe environment if the ratios of the underlying Pre-cambrian basement are known and atmosphericinputs are assumed to be small.
The strontium isotope analyses available fromthe bedrock of Finland are sparse, not allowing toobtain a general view of the strontium isotope ra-tios of the bedrock. This study estimates the spatialdistribution of the 87Sr/86Sr ratios in the Finnishbedrock using data from elemental Rb and Sr ana-lyses and age determinations of the rocks; considersthe usability of the estimate; and discusses the pos-sible regularities in the estimated spatial distributi-on of the isotope ratios. The aim is to provide asufficiently precise and accurate estimate that canbe used as background material for sedimentologi-cal, archaeological and palaeontological provenan-ce studies.
1.1 Rb and Sr ingeological processes
Rubidium has two naturally occurring isotopes, 85Rband 87Rb. 87Rb is radioactive and decays to stable87Sr with an half-life of 48.8 Ga. Rb+ substitutes K+
in potassium-bearing minerals like muscovite, bio-tite, phlogopite and lepidolite, in potassium felds-par and in some clay and evaporite minerals. Stron-tium has four stable isotopes: 84Sr, 86Sr, 88Sr and ra-diogenic 87Sr. Sr2+ substitutes Ca2+ in 8-fold coordi-nation. Thus Sr occurs in minerals like plagioclase,apatite and calcite. Both elements are incompatiblein silicate magmatic systems during the early stagesof fractional crystallization, Rb, however, more st-rongly. This causes the elemental Rb/Sr ratio to in-crease with the degree of differentiation, the highestratios exceeding ten, for example in pegmatites,while the lowest ratios are close to zero, in carbona-
tites and Ca-rich plutonic rocks. Sr is also moreprone to weathering than Rb. (Faure & Mensing,2005)
Rb and Sr start to diffuse through the crystallattice and grain boundaries even in a modest tem-perature increment of 100–200°C. Furthermore,radiogenic 87Sr has different charge and ionic radi-us than the original replaced 87Rb, causing 87Sr tobreak more readily from the crystal lattice. As a con-sequence, the concentrations of Sr, Rb and especi-ally 87Sr may balance between the minerals in therock. The Rb-Sr system of the minerals is reset, butthe whole rock Rb and Sr concentrations and iso-tope ratios remain constant, apart from immediatevicinity of rock unit contacts. Rb and Sr are bothmobile elements and, if present, fluid transportati-on may cause them to move long distances also bet-ween rock units. (Faure & Mensing, 2005)
2. Materials
The Rb and Sr elemental analyses from the RockGeochemical Database of Finland (2008) (RGDB,n=6544) have been used. The ages of the samplesin the database are classified to discrete classes(> 2500 Ma; 2500–2300 Ma; 2300–2000 Ma;2000–1950 Ma; 1950–1850 Ma; 1850–1800 Ma;1800–1600 Ma; < 1600 Ma), based on the age ofthe bedrock unit from which the sample has beentaken. The strontium isotope ratio has been esti-mated based on RGDB data (for database samplecoverage and bedrock units to be discussed, see Fig.1).
Published Rb-Sr isotope analyses from FinnishPrecambrian have been gathered together (Fig. 1and Table 1) and they have been used to evaluatethe method of Sr isotope ratio estimation. Rb-Srisotope analyses in Finland are used to reveal petro-logical problems and for age determinations. Ho-wever, the amount of analyses is limited and spatialdistribution unequal because age determinations areusually conducted with the U-Pb method on zir-con. The spatial distribution of the collected analy-ses covers small areas from Central Finland, greens-tone belts in Eastern Finland and from the granuli-te belt in Lapland.
Bulletin_83_2_s95_114_Kaislaniemi.pmd 2.2.2012, 9:0196

97Estimating the distribution of strontium isotope ratios (87Sr/86Sr) in the Precambrian of Finland
Fig. 1. The distribution of the RGDB sample points (grey dots) and of the sample points from publishedSr isotope analyses (black box). Major bedrock units are marked according to Korsman et al. (1997).
Bulletin_83_2_s95_114_Kaislaniemi.pmd 2.2.2012, 9:0197
98 Lars Kaislaniemi
G7 28.97 64.45 granite 2410 ± 40 233 33G4 28.97 64.45 granite 2410 ± 40 226 312b 29.42 64.58 granite 2290 ± 110 256 1181a 27.64 63.08 carbonatite 2610 ± 78 154
6874 23.53 61.63 dacite 1898 ± 50 100 1866867 24.25 61.65 trachyte 1847 ± 92 79 5626877 23.53 61.62 basalt 1898 ± 50 29 213
1e 28.56 64.65 granite 2500 ± 270 142 2609a 27.64 63.08 carbonatite 2610 ± 167 2146
H395 29.27 64.42 TTG 2670 ± 300 91 2666875 23.53 61.63 andesite 1898 ± 50 40 172H405 29.27 64.42 TTG 2670 ± 300 70 302
OTR-83-40 22.27 61.99 granite 1867 ± 5.6 164 2145a 27.64 63.08 carbonatite 2610 ± 1 8842
OTR-83-16 22.35 62.12 gabbro 1823 ± 15 11 4722 27.64 63.08 carbonatite 2610 ± 51 6211
OTR-83-11 22.35 62.12 quartz diorite 1823 ± 15 16 554OTR-83-14,8 22.35 62.12 diorite 1823 ± 15 31 521
R5-53,4 22.35 62.12 gabbronorite 1823 ± 7 8 925 27.64 63.08 carbonatite 2610 ± 3 8200
H406 29.27 64.42 TTG 2670 ± 300 61 2699b 27.64 63.08 carbonatite 2610 ± 2 51255b 27.64 63.08 carbonatite 2610 ± 3 8827
4435 26.65 68.51 charnockite 1918 ± 107 40 47582a-MN-94 25.19 61.87 quartz monzonite 1851 ± 80 44 252
6928 23.49 61.62 feldspar porphyry 1740 ± 70 157 1689 27.64 63.08 carbonatite 2610 ± 26 4030
1c 28.56 64.57 granodiorite 2500 ± 270 91 362G149 28.97 64.45 metagranite 2500 ± 70 143 3014445 26.65 69.87 charnockite 1918 ± 107 5 405
106-BAE-96 25.19 61.87 granite 1851 ± 80 132 2626695 23.48 61.62 granite 1775 ± 52 144 186H70 29.47 64.26 TTG 2860 ± 90 57 596
6869 24.24 61.65 basaltic trachyandesite 1847 ± 92 69 860H391 29.27 64.42 TTG 2670 ± 300 75 264
231-MN-94 25.19 61.87 granite 1851 ± 80 171 306H396 29.27 64.42 TTG 2670 ± 300 58 2384438 26.65 68.51 charnockite 1918 ± 107 57 488H34 29.71 64.50 TTG 2620 ± 70 75 716
3753 26.70 68.54 charnockite 1918 ± 107 52 300H50 29.35 64.33 TTG 2860 ± 90 104 340
2c 29.35 64.56 granite 2290 ± 110 316 49G155 28.97 64.45 metagranite 2500 ± 70 100 686
H74 29.47 64.26 TTG 2620 ± 70 67 290G224 28.97 64.45 metagranite 2500 ± 70 47 918H402 29.51 64.48 granodiorite-granite 2500 ± 52 349
7 27.64 63.08 carbonatite 2610 ± 82 2394
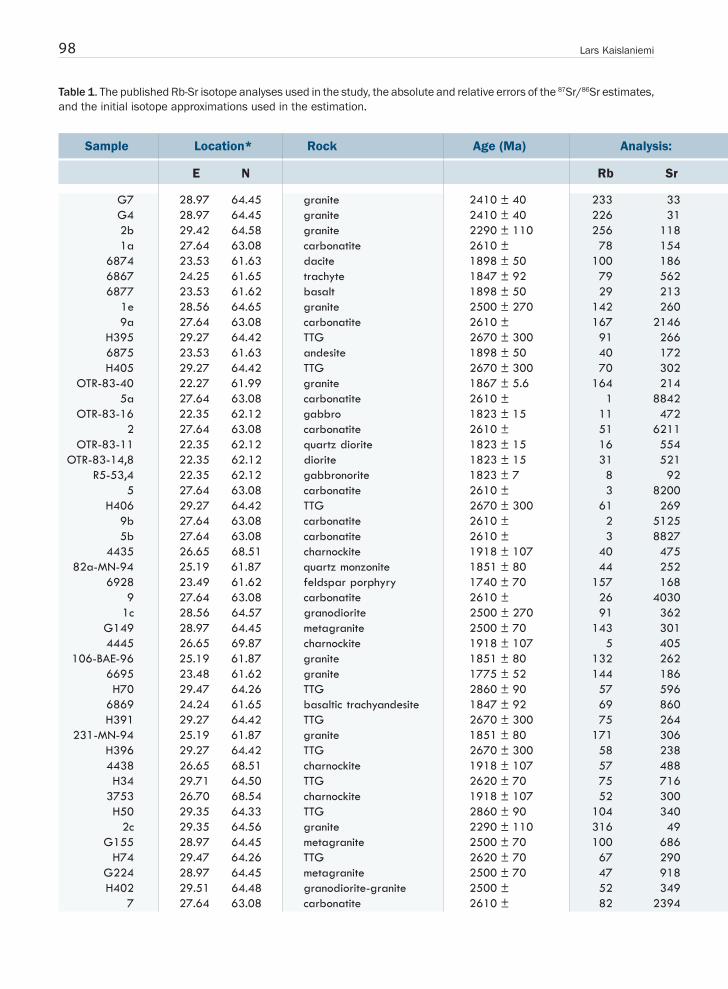
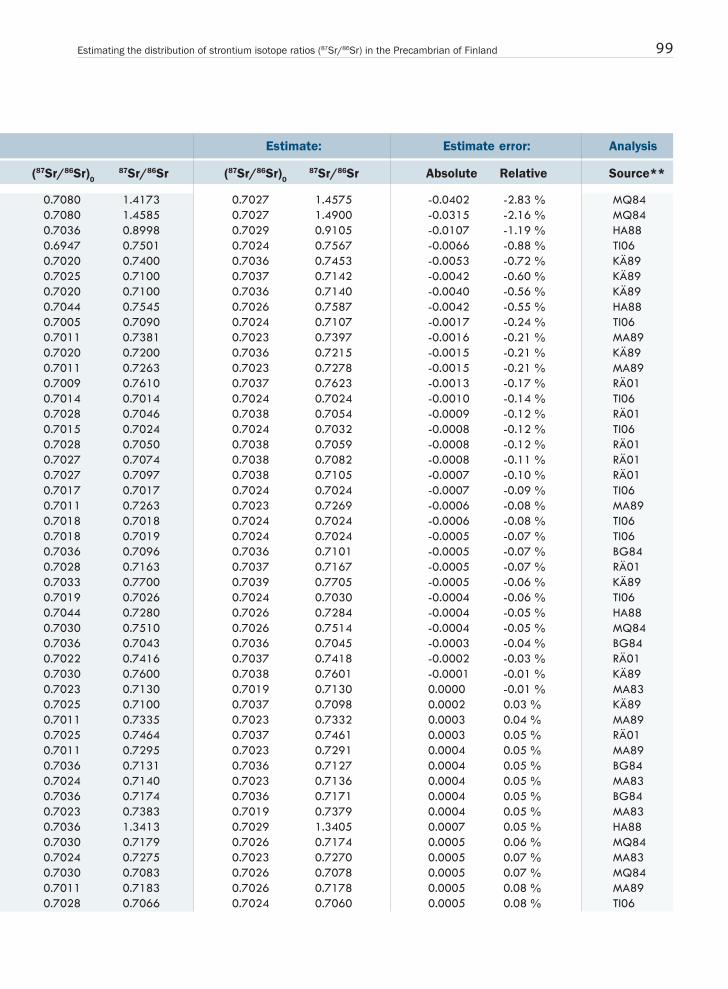
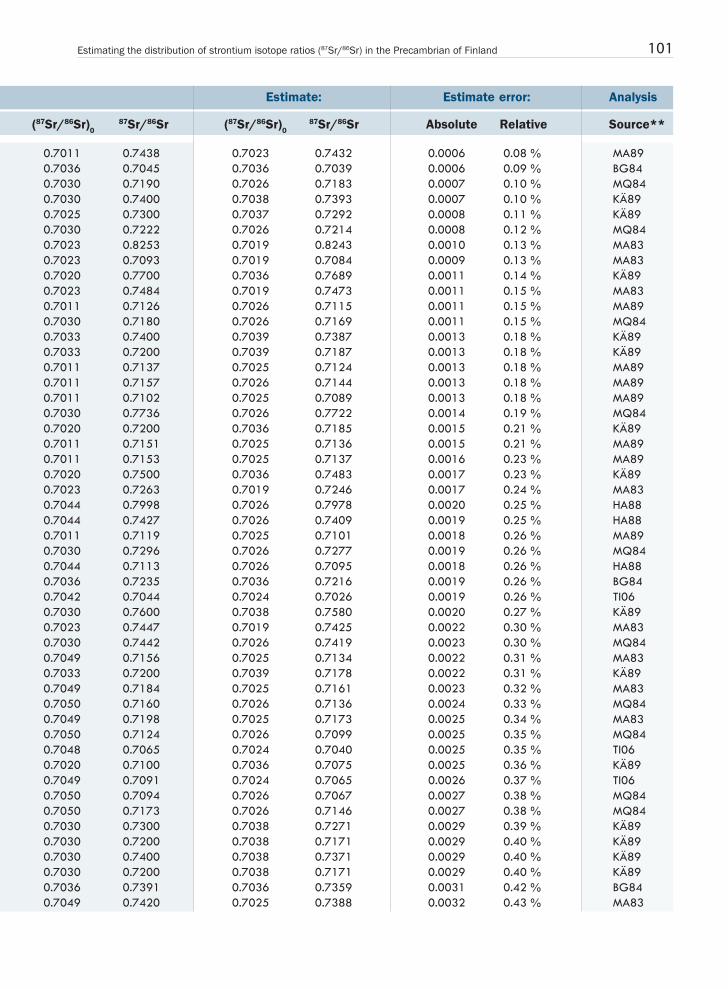
Table 1. The published Rb-Sr isotope analyses used in the study, the absolute and relative errors of the 87Sr/86Sr estimates,and the initial isotope approximations used in the estimation.
Sample Location* Rock Age (Ma) Analysis:
E N Rb Sr (87
Bulletin_83_2_s95_114_Kaislaniemi.pmd 2.2.2012, 9:0198
99Estimating the distribution of strontium isotope ratios (87Sr/86Sr) in the Precambrian of Finland
0.7080 1.4173 0.7027 1.4575 -0.0402 -2.83 % MQ840.7080 1.4585 0.7027 1.4900 -0.0315 -2.16 % MQ840.7036 0.8998 0.7029 0.9105 -0.0107 -1.19 % HA880.6947 0.7501 0.7024 0.7567 -0.0066 -0.88 % TI060.7020 0.7400 0.7036 0.7453 -0.0053 -0.72 % KÄ890.7025 0.7100 0.7037 0.7142 -0.0042 -0.60 % KÄ890.7020 0.7100 0.7036 0.7140 -0.0040 -0.56 % KÄ890.7044 0.7545 0.7026 0.7587 -0.0042 -0.55 % HA880.7005 0.7090 0.7024 0.7107 -0.0017 -0.24 % TI060.7011 0.7381 0.7023 0.7397 -0.0016 -0.21 % MA890.7020 0.7200 0.7036 0.7215 -0.0015 -0.21 % KÄ890.7011 0.7263 0.7023 0.7278 -0.0015 -0.21 % MA890.7009 0.7610 0.7037 0.7623 -0.0013 -0.17 % RÄ010.7014 0.7014 0.7024 0.7024 -0.0010 -0.14 % TI060.7028 0.7046 0.7038 0.7054 -0.0009 -0.12 % RÄ010.7015 0.7024 0.7024 0.7032 -0.0008 -0.12 % TI060.7028 0.7050 0.7038 0.7059 -0.0008 -0.12 % RÄ010.7027 0.7074 0.7038 0.7082 -0.0008 -0.11 % RÄ010.7027 0.7097 0.7038 0.7105 -0.0007 -0.10 % RÄ010.7017 0.7017 0.7024 0.7024 -0.0007 -0.09 % TI060.7011 0.7263 0.7023 0.7269 -0.0006 -0.08 % MA890.7018 0.7018 0.7024 0.7024 -0.0006 -0.08 % TI060.7018 0.7019 0.7024 0.7024 -0.0005 -0.07 % TI060.7036 0.7096 0.7036 0.7101 -0.0005 -0.07 % BG840.7028 0.7163 0.7037 0.7167 -0.0005 -0.07 % RÄ010.7033 0.7700 0.7039 0.7705 -0.0005 -0.06 % KÄ890.7019 0.7026 0.7024 0.7030 -0.0004 -0.06 % TI060.7044 0.7280 0.7026 0.7284 -0.0004 -0.05 % HA880.7030 0.7510 0.7026 0.7514 -0.0004 -0.05 % MQ840.7036 0.7043 0.7036 0.7045 -0.0003 -0.04 % BG840.7022 0.7416 0.7037 0.7418 -0.0002 -0.03 % RÄ010.7030 0.7600 0.7038 0.7601 -0.0001 -0.01 % KÄ890.7023 0.7130 0.7019 0.7130 0.0000 -0.01 % MA830.7025 0.7100 0.7037 0.7098 0.0002 0.03 % KÄ890.7011 0.7335 0.7023 0.7332 0.0003 0.04 % MA890.7025 0.7464 0.7037 0.7461 0.0003 0.05 % RÄ010.7011 0.7295 0.7023 0.7291 0.0004 0.05 % MA890.7036 0.7131 0.7036 0.7127 0.0004 0.05 % BG840.7024 0.7140 0.7023 0.7136 0.0004 0.05 % MA830.7036 0.7174 0.7036 0.7171 0.0004 0.05 % BG840.7023 0.7383 0.7019 0.7379 0.0004 0.05 % MA830.7036 1.3413 0.7029 1.3405 0.0007 0.05 % HA880.7030 0.7179 0.7026 0.7174 0.0005 0.06 % MQ840.7024 0.7275 0.7023 0.7270 0.0005 0.07 % MA830.7030 0.7083 0.7026 0.7078 0.0005 0.07 % MQ840.7011 0.7183 0.7026 0.7178 0.0005 0.08 % MA890.7028 0.7066 0.7024 0.7060 0.0005 0.08 % TI06
Estimate: Estimate error: Analysis
(87Sr/86Sr)087Sr/86Sr (87Sr/86Sr)0
87Sr/86Sr Absolute Relative Source**
Bulletin_83_2_s95_114_Kaislaniemi.pmd 2.2.2012, 9:0199

100 Lars Kaislaniemi
Sample Location* Rock Age (Ma) Analysis:
E N Rb Sr (87
H52 29.27 64.42 TTG 2670 ± 300 93 2503525 26.79 69.48 charnockite 1918 ± 107 2 661G154 28.97 64.45 metagranite 2500 ± 70 102 6626690 23.50 61.61 granodiorite 1775 ± 52 131 2686870 24.24 61.65 trachyte 1847 ± 92 173 511G195 28.97 64.45 metagranite 2500 ± 70 121 659
H77 29.47 64.26 TTG 2860 ± 90 266 258H32 29.47 64.26 TTG 2860 ± 90 71 1285
6873 23.53 61.63 rhyolite 1898 ± 50 81 97H49 29.35 64.33 TTG 2860 ± 90 121 314
H397 29.51 64.48 granodiorite-granite 2500 ± 72 822G6 28.97 64.45 metagranite 2500 ± 70 107 764
6929 23.49 61.62 plagioclase porphyry 1740 ± 70 161 3296926 23.49 61.62 plagioclase porphyry 1740 ± 70 92 441H446 29.14 65.23 granodiorite 2550 ± 250 55 575H399 29.51 64.48 granodiorite-granite 2500 ± 94 816H451 29.14 65.23 granodiorite 2550 ± 250 44 713G187 28.97 64.45 metagranite 2500 ± 70 165 2446876 23.53 61.63 basalt 1898 ± 50 39 202H447 29.14 65.23 granodiorite 2550 ± 250 53 500H450 29.14 65.23 granodiorite 2550 ± 250 56 5226872 23.53 61.63 dacite 1898 ± 50 91 158H53 29.52 64.43 TTG 2860 ± 90 136 706
1f 28.57 64.65 granite 2500 ± 270 130 1411d 28.60 64.70 granite 2500 ± 270 91 244
H449 29.14 65.23 granodiorite 2550 ± 250 49 670G193 28.97 64.45 metagranite 2500 ± 70 125 509
1a 28.59 64.61 tonalite 2500 ± 270 37 5543933 26.03 68.88 khondalite 1918 ± 107 58 252
6 27.64 63.08 carbonatite 2610 ± 16 80696689 23.40 61.65 granodiorite 1775 ± 52 129 173H46 29.35 64.33 TTG 2860 ± 90 121 351
G148 28.97 64.45 metagranite 2500 ± 70 132 344H60 28.80 64.76 metagranite/-granodiorite 2510 ± 110 59 554
6927 23.49 61.62 feldspar porphyry 1740 ± 70 81 413H59 29.04 64.81 metagranite/-granodiorite 2510 ± 110 102 774S17 29.25 65.28 metatuff 2500 ± 100 26 243
H356 28.80 64.76 metagranite/-granodiorite 2510 ± 110 47 323S70 29.25 65.28 metatuff 2500 ± 100 39 541
4 27.64 63.08 carbonatite 2610 ± 34 22236878 23.53 61.62 basaltic andesite 1898 ± 50 13 254
1 27.64 63.08 carbonatite 2610 ± 104 2680S29 29.25 65.28 metatuff 2500 ± 100 9 223
S160 29.25 65.28 metatuff 2500 ± 100 48 4106694 23.49 61.62 monzodiorite 1775 ± 52 109 3396692 23.50 61.61 granodiorite 1775 ± 52 70 3796691 23.40 61.65 granodiorite 1775 ± 52 127 2776693 23.50 61.61 granodiorite 1775 ± 52 73 4004698 27.86 68.54 khondalite 1918 ± 107 82 198H62 29.04 64.81 metagranite/-granodiorite 2510 ± 110 96 273
Bulletin_83_2_s95_114_Kaislaniemi.pmd 2.2.2012, 9:01100
101Estimating the distribution of strontium isotope ratios (87Sr/86Sr) in the Precambrian of Finland
Estimate: Estimate error: Analysis
(87Sr/86Sr)087Sr/86Sr (87Sr/86Sr)0
87Sr/86Sr Absolute Relative Source**
0.7011 0.7438 0.7023 0.7432 0.0006 0.08 % MA890.7036 0.7045 0.7036 0.7039 0.0006 0.09 % BG840.7030 0.7190 0.7026 0.7183 0.0007 0.10 % MQ840.7030 0.7400 0.7038 0.7393 0.0007 0.10 % KÄ890.7025 0.7300 0.7037 0.7292 0.0008 0.11 % KÄ890.7030 0.7222 0.7026 0.7214 0.0008 0.12 % MQ840.7023 0.8253 0.7019 0.8243 0.0010 0.13 % MA830.7023 0.7093 0.7019 0.7084 0.0009 0.13 % MA830.7020 0.7700 0.7036 0.7689 0.0011 0.14 % KÄ890.7023 0.7484 0.7019 0.7473 0.0011 0.15 % MA830.7011 0.7126 0.7026 0.7115 0.0011 0.15 % MA890.7030 0.7180 0.7026 0.7169 0.0011 0.15 % MQ840.7033 0.7400 0.7039 0.7387 0.0013 0.18 % KÄ890.7033 0.7200 0.7039 0.7187 0.0013 0.18 % KÄ890.7011 0.7137 0.7025 0.7124 0.0013 0.18 % MA890.7011 0.7157 0.7026 0.7144 0.0013 0.18 % MA890.7011 0.7102 0.7025 0.7089 0.0013 0.18 % MA890.7030 0.7736 0.7026 0.7722 0.0014 0.19 % MQ840.7020 0.7200 0.7036 0.7185 0.0015 0.21 % KÄ890.7011 0.7151 0.7025 0.7136 0.0015 0.21 % MA890.7011 0.7153 0.7025 0.7137 0.0016 0.23 % MA890.7020 0.7500 0.7036 0.7483 0.0017 0.23 % KÄ890.7023 0.7263 0.7019 0.7246 0.0017 0.24 % MA830.7044 0.7998 0.7026 0.7978 0.0020 0.25 % HA880.7044 0.7427 0.7026 0.7409 0.0019 0.25 % HA880.7011 0.7119 0.7025 0.7101 0.0018 0.26 % MA890.7030 0.7296 0.7026 0.7277 0.0019 0.26 % MQ840.7044 0.7113 0.7026 0.7095 0.0018 0.26 % HA880.7036 0.7235 0.7036 0.7216 0.0019 0.26 % BG840.7042 0.7044 0.7024 0.7026 0.0019 0.26 % TI060.7030 0.7600 0.7038 0.7580 0.0020 0.27 % KÄ890.7023 0.7447 0.7019 0.7425 0.0022 0.30 % MA830.7030 0.7442 0.7026 0.7419 0.0023 0.30 % MQ840.7049 0.7156 0.7025 0.7134 0.0022 0.31 % MA830.7033 0.7200 0.7039 0.7178 0.0022 0.31 % KÄ890.7049 0.7184 0.7025 0.7161 0.0023 0.32 % MA830.7050 0.7160 0.7026 0.7136 0.0024 0.33 % MQ840.7049 0.7198 0.7025 0.7173 0.0025 0.34 % MA830.7050 0.7124 0.7026 0.7099 0.0025 0.35 % MQ840.7048 0.7065 0.7024 0.7040 0.0025 0.35 % TI060.7020 0.7100 0.7036 0.7075 0.0025 0.36 % KÄ890.7049 0.7091 0.7024 0.7065 0.0026 0.37 % TI060.7050 0.7094 0.7026 0.7067 0.0027 0.38 % MQ840.7050 0.7173 0.7026 0.7146 0.0027 0.38 % MQ840.7030 0.7300 0.7038 0.7271 0.0029 0.39 % KÄ890.7030 0.7200 0.7038 0.7171 0.0029 0.40 % KÄ890.7030 0.7400 0.7038 0.7371 0.0029 0.40 % KÄ890.7030 0.7200 0.7038 0.7171 0.0029 0.40 % KÄ890.7036 0.7391 0.7036 0.7359 0.0031 0.42 % BG840.7049 0.7420 0.7025 0.7388 0.0032 0.43 % MA83
Bulletin_83_2_s95_114_Kaislaniemi.pmd 2.2.2012, 9:01101

102 Lars Kaislaniemi
Sample Location* Rock Age (Ma) Analysis:
E N Rb Sr (87
* Coordinates (E, N) are in geographical EUREF-FIN system (corresponds approximately to WGS84). If no coordinates weregiven in the original publication, coordinates were approximated from the sample localities map in the publication.
** Sources: BG84 = Bernard-Griffiths et al. (1984); HA88 = Halliday et al. (1988); KÄ89 = Kähkönen et al. (1989); MA89= Martin (1989); MQ84 = Martin and Querré (1984); MA83 = Martin et al. (1983); RÄ99 = Rämö (1999); RÄ01 = Rämöet al. (2001); TI06 = Tichomirowa et al. (2006).
TTG = tonalite-trondhjemite-granodiorite in rock names. Rb and Sr concentrations are in ppm. Constants used in estimatecalculation are: λRb-87 = 1.42×10⁻¹¹ y-11; 84Sr/86Sr = 0.056584; 88Sr/86Sr = (86Sr/88Sr)-1 = 0.1194-1.
S64 29.25 65.28 metatuff 2500 ± 100 76 3816879 23.53 61.62 basaltic andesite 1898 ± 50 28 1626925 23.49 61.62 feldspar porphyry 1740 ± 70 129 214H355 29.04 64.81 metagranite/-granodiorite 2510 ± 110 72 827H63 29.04 64.81 metagranite/-granodiorite 2510 ± 110 108 379
A1040 27.41 61.29 granite 1600 ± 7 255 1516868 24.25 61.65 basaltic trachyandesite 1847 ± 92 39 10466871 24.24 61.65 trachyte 1847 ± 92 127 7523931 26.16 68.88 khondalite 1918 ± 107 83 249
1b 27.64 63.08 carbonatite 2610 ± 17 4572A1042 27.36 61.34 granite 1600 ± 7 229 98
G60 28.97 64.45 granite 2410 ± 40 152 92OTR-84-103a 22.27 61.99 granite 1867 ± 5.6 152 218
2a 29.34 64.72 granite 2290 ± 110 202 2544695 28.11 68.54 khondalite 1918 ± 107 76 311
A1043 27.52 61.21 granite 1600 ± 7 177 1696688 23.40 61.65 granodiorite 1775 ± 52 130 297G15 28.97 64.45 granite 2410 ± 40 188 115
1b 28.77 64.58 tonalite 2500 ± 270 70 3894694 26.05 69.30 khondalite 1918 ± 107 88 290
A1041 27.55 61.32 granite 1600 ± 7 351 58A1044 27.44 61.23 granite 1600 ± 7 322 66
4699 27.86 68.54 khondalite 1918 ± 107 117 140MKT-86-195,2 27.44 61.19 granite 1600 ± 7 182 156
4696 28.11 68.54 khondalite 1918 ± 107 86 214G16 28.97 64.45 granite 2410 ± 40 136 178G59 28.97 64.45 granite 2410 ± 40 172 162G63 28.97 64.45 granite 2410 ± 40 198 154
OTR-87-202,1 27.56 61.25 granite 1600 ± 7 145 1904697 27.86 68.54 khondalite 1918 ± 107 118 260
A1045 27.26 61.21 granite 1600 ± 7 239 79H392 29.27 64.42 TTG 2670 ± 300 85 290
A1358 22.15 62.08 granite 1867 ± 6 217 206G61 28.97 64.45 granite 2410 ± 40 172 178
A1097 27.41 61.32 granite 1600 ± 7 696 9G5 28.97 64.45 granite 2410 ± 40 176 1192e 29.46 64.57 granite 2290 ± 110 445 24
MKT-87-664,2 27.32 61.30 granite 1600 ± 7 683 192f 29.36 64.54 granite 2290 ± 110 502 12
A588 22.24 62.17 granite 1867 ± 6 139 832d 29.35 64.58 granite 2290 ± 110 403 27
Bulletin_83_2_s95_114_Kaislaniemi.pmd 2.2.2012, 9:01102

103Estimating the distribution of strontium isotope ratios (87Sr/86Sr) in the Precambrian of Finland
Estimate: Estimate error: Analysis
(87Sr/86Sr)087Sr/86Sr (87Sr/86Sr)0
87Sr/86Sr Absolute Relative Source**
0.7050 0.7260 0.7026 0.7229 0.0031 0.43 % MQ840.7020 0.7200 0.7036 0.7169 0.0031 0.43 % KÄ890.7033 0.7500 0.7039 0.7468 0.0032 0.43 % KÄ890.7049 0.7147 0.7025 0.7115 0.0032 0.44 % MA830.7049 0.7352 0.7025 0.7319 0.0033 0.45 % MA830.7055 0.8189 0.7042 0.8151 0.0038 0.46 % RÄ990.7025 0.7100 0.7037 0.7065 0.0035 0.49 % KÄ890.7025 0.7200 0.7037 0.7164 0.0036 0.50 % KÄ890.7036 0.7334 0.7036 0.7298 0.0036 0.50 % BG840.7059 0.7063 0.7024 0.7027 0.0036 0.50 % TI060.7055 0.8626 0.7042 0.8579 0.0048 0.55 % RÄ990.7080 0.8738 0.7027 0.8689 0.0049 0.57 % MQ840.7067 0.7616 0.7037 0.7571 0.0044 0.58 % RÄ010.7036 0.7824 0.7029 0.7778 0.0046 0.59 % HA880.7036 0.7271 0.7036 0.7228 0.0043 0.59 % BG840.7072 0.7774 0.7042 0.7728 0.0046 0.59 % RÄ990.7030 0.7400 0.7038 0.7356 0.0044 0.60 % KÄ890.7080 0.8718 0.7027 0.8663 0.0055 0.63 % MQ840.7044 0.7257 0.7026 0.7210 0.0047 0.64 % HA880.7036 0.7325 0.7036 0.7273 0.0052 0.71 % BG840.7033 1.1192 0.7042 1.1112 0.0080 0.72 % RÄ990.7044 1.0392 0.7042 1.0317 0.0075 0.73 % RÄ990.7036 0.7750 0.7036 0.7693 0.0057 0.74 % BG840.7083 0.7863 0.7042 0.7805 0.0059 0.75 % RÄ990.7036 0.7406 0.7036 0.7350 0.0056 0.75 % BG840.7080 0.7845 0.7027 0.7785 0.0060 0.76 % MQ840.7080 0.8149 0.7027 0.8084 0.0065 0.80 % MQ840.7080 0.8377 0.7027 0.8310 0.0067 0.80 % MQ840.7095 0.7604 0.7042 0.7540 0.0065 0.85 % RÄ990.7036 0.7458 0.7036 0.7392 0.0066 0.88 % BG840.7078 0.9132 0.7042 0.9051 0.0081 0.89 % RÄ990.7011 0.7412 0.7023 0.7345 0.0067 0.91 % MA890.7090 0.7920 0.7037 0.7846 0.0075 0.94 % RÄ010.7080 0.8072 0.7027 0.7988 0.0084 1.04 % MQ840.6887 10.8487 0.7042 10.6851 0.1636 1.51 % RÄ990.7080 0.8638 0.7027 0.8505 0.0133 1.54 % MQ840.7036 2.8821 0.7029 2.8228 0.0593 2.06 % HA880.7201 3.8202 0.7042 3.7346 0.0857 2.24 % RÄ990.7036 7.7627 0.7029 7.4278 0.3349 4.31 % HA880.6952 0.8710 0.7037 0.8326 0.0384 4.41 % RÄ010.7036 2.4560 0.7029 2.3351 0.1209 4.92 % HA88
Bulletin_83_2_s95_114_Kaislaniemi.pmd 2.2.2012, 9:01103
104 Lars Kaislaniemi
3. Methods
3.1 Estimating the 87Sr/86Srratio of the rock
In the following a method to estimate the 87Sr/86Srratio of a rock based on its measured Rb/Sr con-centration and age information is derived.
The equation of radioactive decay for Rb-Sr systemis
87Rb/86Sr can be expressed as
where W to refers to the atomic weight of an elementand Ab to the abundance (%) of an isotope. WSr/Ab86Sr can be written as
We can now substitute (3) and (2) to (1), solve for87Sr/86Sr and obtain an estimation (S) for the isotoperatio 87Sr/86Sr. I = (87Sr/86Sr)
0 is used to denote the
initial isotope ratio of a rock:
Unknowns are I, Rb, Sr and t. 84Sr/86Sr and 88Sr/86Srare known and constants. An approximation for theinitial isotope ratio I is made using an assumptionthat rocks originate from the mantle. The 87Sr/86Srratios of the hypothesized magma sources in themantle (depleted MORB mantle, enriched mantletype 1 and 2, “high µ” mantle) fall approximatelybetween 0.702 and 0.707 (today’s values) (Faure &Mensing, 2005). On the other hand, the initial 87Sr/
86Sr ratios of basaltic achondrites are 0.69899 ±0.000047 (Faure & Powell, 1972). Based on thisinformation, the evolution of the initial isotope ra-tio of the mantle source can be approximated if as-sumed that the evolution of their isotope ratios hasbeen linear through the history of the Earth. In thisstudy, the rocks are assumed to have a mantle sour-ce, and a rough linear approximation of their initial87Sr/86Sr ratios has been used to include the plau-sible variation of different possible magma sources:
Where t is the age of the sample, and the range of0.699 to 0.707 is chosen to represent all possiblemantle sources (sampling of heterogenous mantle).
3.2 Spatial interpolation of theestimates for the area of Finland
Below a method to generalize the estimated isotoperatios at single RGDB sample points to cover thewhole area of Finland is described.
Number of suitable points (Sr and Rb concent-ration and age t given) in RGDB for estimate cal-culation is 6379. For every sample in RGDB thebedrock unit has been reported using the unit clas-sification of the bedrock map 1:1 000 000 of Fin-land (Korsman et al., 1997). Using this same classi-fication the estimations at the sample points havebeen divided to eleven major units, for which thequartiles Q
1 and Q
3 and medians of the estimated
values have been calculated. Average values and stan-dard deviations are not supposed to be proper pa-rameters to describe isotope ratios because of signi-ficant skewness of distributions and single large va-lues outside the distributions.
To develop an estimate covering the whole areaof Finland, the estimated 87Sr/86Sr values (S
j) at
RGDB sample points have been interpolated usingsmoothing. The smoothed estimate S
s at any given
point p is
(= + (e λt – 1))87Sr 87Sr 87Rb86Sr 86Sr
o86Sr , (1)
=87Rb Rb (Ab87Rb) (WSr)86Sr Sr (Ab86Sr) (WRb), (2)
= 84 + 86 + 87 + 88WSr 84Sr 87Sr 88SrAb86Sr 86Sr 86Sr 86Sr , (3)
)(Sr WRb . (4)
1 – 87 (e λt – 1)Rb Ab87Rb
S(Rb,Sr,I,t) = Sr WRb 86Sr 86Sr
I + 84 + 86 + 88 (e λt – 1)Rb Ab87Rb 84Sr 88Sr
I(t) = 0.699 +4500 Ma . (5)
(4500 Ma – t) (0.707 – 0.699)
SS(p) =
∑j k(p – x
j , σ) , (6)
∑j S(Rb
j , Sr
j , I
j , t
j ) k(p – xj , σ)
Bulletin_83_2_s95_114_Kaislaniemi.pmd 2.2.2012, 9:01104
105Estimating the distribution of strontium isotope ratios (87Sr/86Sr) in the Precambrian of Finland
where j runs over the sample points, S is theestimated 87Sr/86Sr ratio at the sample point, xj isthe sample point, and k is a Gaussian smoothingkernel as a function of standard deviation σ anddistance between estimation point and point p.
In addition, the smoothing has been weightedby the measured Sr concentration, resulting aweighted smoothed estimate S
sw:
3.3 Evaluation of the method
The following sections consider the significance ofthe initial ratio approximation to the accuracy ofthe final estimate, and describe how to evaluate themethod using published strontium isotope analyses.
3.3.1 Significance of theinitial ratio approximation
The estimation method is easy to generalize to wideareas, if elemental analyses are available. The down-side of the method is the troublesome estimation ofthe initial isotope ratio. On account of easy genera-lization it is not possible to estimate the initial ratiousing information about the possibly known petro-logical history and age of each sample. However,examining the effect of changes in the approxima-ted initial isotope ratio by differentiating equation(4) with respect to the initial ratio I gives
when 3.0 Ga < t < 1.5 Ga and Rb/Sr < 10. Thus thechange in the estimated value of the isotope ratio isequal to the change (ie. error) in the approximatedinitial isotope ratio. This means that the error ofinitial isotope approximation I propagades directlyto the error of the final 87Sr/86Sr estimate.
The 87Sr/86Sr ratios of today’s oceanic islandbasalts (OIB) representing mantle derived magmasvariate between 0.703–0.707 (Faure & Mensing,
2005). The upper part of the sub-oceanic convecti-ve mantle represents depleted mantle (DM), whichis the source for the mid-ocean ridge basalts, MOR-Bs (87Sr/86Sr increasing from 0.7005 to 0.7025 du-ring the time from 3 Ga to today) (Workman &Hart, 2005). Therefore, when dealing with rockswith age of 3–1.6 Ga, as is the case with FinnishPrecambrian, the maximum error of the linear ap-proximation of the initial isotope ratios due to source(mantle) heterogeneity is 0.707–0.7005=0.0065.This difference between depleted and enrichedmantle source isotope ratios narrows down to0.0029 at 1,6 Ga and 0.0015 at 3 Ga, assuminglinear evolution of isotope ratios in the mantle re-servoirs (that is, growing mantle heterogeneity). Itis therefore plausible to assume that, if a rock isundifferentiated and originates from such a source,the maximum error in the approximated value0.699–0.707 of the initial ratio in equation (5) isinsignificant for the final 87Sr/86Sr ratio estimationin desired accuracy. On the other hand, in differen-tiated magma Rb is enriched in the melt relative toSr, raising the Rb/Sr ratio and thus leading to higher87Rb concentration and, in time, higher 87Sr/86Srratios. This reduces the significance of the error inthe approximation of the initial isotope ratio relati-ve to the increase of the 87Sr/86Sr ratio caused by thedecay of 87Rb.
It is noteworthy that equation (5) is an upperlimit approximation of the initial isotope ratios(today’s value of 0.707 accounting for enrichedmantle sources). The approximation gives the bestcorrespondence between measured initial isotoperatios and approximated initial isotope ratios in thesample set. This merely demonstrates the fact thatthe isotope evolution has not been linear, and thatfor example at 3 Ga the DM value 0.7005 (Work-man & Hart, 2005) is underestimated by the linearapproximation giving a value 0.7002.
3.3.2 Strontium isotope analyses
The method is evaluated by applying it to publishedRb-Sr isotope analyses from bedrock samples. Themethod together with age and Rb/Sr data from thepublished analysis is used to calculate an estimated
∑j S(Rb
j , Sr
j , I
j , t
j ) k(p – x
j , σ)Sr
j
∑j k(p – x
j , σ)Sr
j, (7)
SSW
(p) =
= 1
Sr WRb Sr , (8)1 – 87 (e λt – 1) 1 – 0.0085
dI Rb Ab87Rb Rb
dS 1 1
Bulletin_83_2_s95_114_Kaislaniemi.pmd 2.2.2012, 9:01105

106 Lars Kaislaniemi
86Sr/86Sr ratio (S), which then is compared to themeasured value given by the analysis. The absoluteand relative errors are calculated.
4. Results
All results were calculated and all figures producedusing software R (R Development Core Team,2009) and its sp library (Pebesma & Bivand, 2005).
4.1 Spatial interpolation of theestimates for the area of Finland
Table 2 and Fig. 2 show the Sr isotope ratio estimatesof the bedrock of Finland by bedrock units. Bedrock
Table 2..... The medians and interquartile ranges (Q3-Q1) of the 87Sr/86Sr estimates by bedrock unit.
units are listed in Table 2 and can be divided intoArchaean units of Karelian Domain (KrAr,predominantly gneisses of TTG composition),Lapland Granulite Belt and Inari Complex (Grl,Ina), and Proterozoic units of Svecofennian Domain(SvA, SvB, SvC, SvGr, SvCol, arc complexes andorogeny related intrusions; Rap, Rapakivi intrusionsand related mafic rocks) and of Karelian Domain(KrPr, mainly supracrustal rocks). Figures 3 and 4show the smoothed estimation for the isotope ratioin the Finnish bedrock. The Sr concentration (ppmin RGDB samples) weighted average of estimated87Sr/86Sr ratios is 0.7293.
Abbreviations used for the units in the text are in parentheses. The unit names are from Korsman et al. (1997). For theirlocations, see Figure 1.
Svecofennian Domain, Accretionary arc complexof southern Finland (SvA)
Svecofennian Domain, Accretionary arc complexof central and western Finland (SvB)
Svecofennian Domain, Primitive arc complex of centralFinland (SvC)
Svecofennian Domain, Collision-related intrusions(SvCol), overlaps SvA, SvB, SvC
Svecofennian Domain, Intrusions post-dating main stageof crustal thickening (SvGr), overlaps SvA, SvB, SvC
Rapakivi intrusions (Rap)
Karelian Domain, Archean rocks (KrAr)
Karelian Domain, post-Archaean rocks (KrPr)
Lapland Granulite Belt and Inari Complex,post-Archaean rocks (Grl)
Lapland Granulite Belt and Inari Complex, Archaeanrocks (Ina)
Caledonian Domain (Kal)
Other units
825 0.7637 0.1077 4.39 35.75 0.751
705 0.7335 0.0390 3.83 34.33 0.728
227 0.7184 0.0243 2.60 11.59 0.720
1066 0.7169 0.0186 12.72 211.67 0.717
260 0.7628 0.0764 6.79 60.63 0.752
154 0.7617 0.0445 8.29 77.72 0.762
1118 0.7236 0.0285 4.63 31.10 0.726
1464 0.7424 0.1188 17.58 436.39 0.742
301 0.7209 0.0255 14.13 221.97 0.719
67 0.7476 0.0865 1.51 4.68 0.755
12 0.7189 0.0250 0.67 2.18 0.714
180 0.7135 0.0339 9.21 97.47 0.725
Sr conc Unit N Median Q3-Q1 Skewness Kustosis weighted
mean
Bulletin_83_2_s95_114_Kaislaniemi.pmd 2.2.2012, 9:01106

107Estimating the distribution of strontium isotope ratios (87Sr/86Sr) in the Precambrian of Finland
Fig. 2. The medians and first and thirdquartiles of the 87Sr/86Sr estimates bybedrock unit. (For abbreviations, seeTable 2.)
Fig. 3. The smoothed estimation for the 87Sr/86Sr ratioof the Finnish bedrock.σ = 10 km.
Fig. 4. The smoothed and Sr-concentration-weightedestimation for the 87Sr/86Sr ratio of the Finnish bedrock.σ = 10 km.
Bulletin_83_2_s95_114_Kaislaniemi.pmd 2.2.2012, 9:01107

108 Lars Kaislaniemi
4.2 Evaluation of the methodusing published Rb-Srisotope analyses
A total of 138 published Rb-Sr isotope analyses fromthe Finnish Precambrian has been collected (Table1). The absolute errors of the estimates calculatedon the grounds of reported Rb/Sr ratios and agesvariate between -0.335 and 0.040 when comparedwith the 87Sr/86Sr ratios measured in the analyses.The relative errors are less than 4.92 %. Yet, most(129) of the relative estimation errors are less than1.00 %, with an average of 0.32 %. The estimatesfor which the relative errors exceed 1.00 % (9) arefrom granitic (sensu stricto) samples, granitic samp-les numbering 35 in total.
The relative error correlates to some extent withthe Rb/Sr ratio of the rock. The average error of theestimates for the samples with Rb/Sr > 1 (24 samp-les, all except one granitic) is 1.49 %, and for theother samples 0.29 %.
Fig. 5. The measured 87Sr/86Sr ratios from published analyses vs. estimated ratios calculatedfrom Rb and Sr concentrations and age data from the analyses. The equation of the line is y = x.
For samples with Rb/Sr < 1 (114) the root meansquare of errors is (RMS) 0.0028 and the coeffi-cient of determination R2 = 0.9842 (Fig. 5). For allthe 138 analyses and for their estimates correspon-ding values are RMS = 0.0351 and R2 = 0.9990.
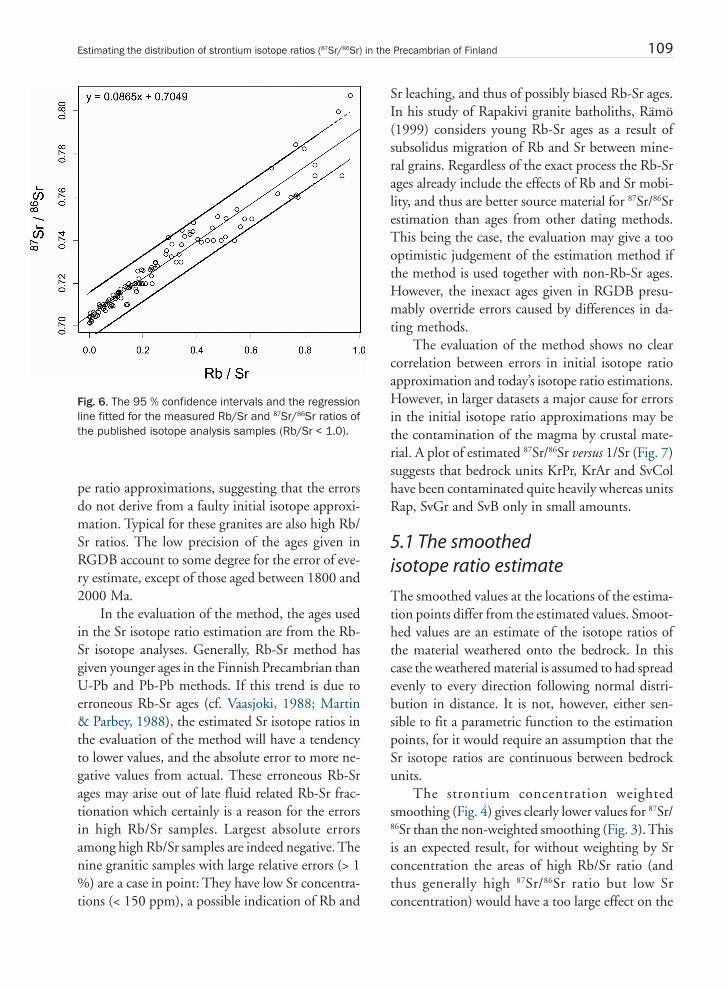
The measured Rb/Sr ratio correlates well(R2 = 0.9415; RMS = 0.0053) with measured 87Sr/86Sr ratio when Rb/Sr < 1 (Fig. 6), but less well whenall the samples are considered (R2 = 0.8546; RMS= 0.4171).
5. Discussion
When applied to the gathered strontium isotopeanalyses for which Rb/Sr < 1, and also when app-lied to all gathered isotope analyses, the methoddescribed above has a better coefficient of determi-nation (R2) and smaller standard residual error thanthe linear correlation of 87Sr/86Sr to Rb/Sr alone (Fig.6). The errors for some granitic rocks are notable.They are larger than the errors of their initial isoto-
Bulletin_83_2_s95_114_Kaislaniemi.pmd 2.2.2012, 9:01108
109Estimating the distribution of strontium isotope ratios (87Sr/86Sr) in the Precambrian of Finland
Sr leaching, and thus of possibly biased Rb-Sr ages.In his study of Rapakivi granite batholiths, Rämö(1999) considers young Rb-Sr ages as a result ofsubsolidus migration of Rb and Sr between mine-ral grains. Regardless of the exact process the Rb-Srages already include the effects of Rb and Sr mobi-lity, and thus are better source material for 87Sr/86Srestimation than ages from other dating methods.This being the case, the evaluation may give a toooptimistic judgement of the estimation method ifthe method is used together with non-Rb-Sr ages.However, the inexact ages given in RGDB presu-mably override errors caused by differences in da-ting methods.
The evaluation of the method shows no clearcorrelation between errors in initial isotope ratioapproximation and today’s isotope ratio estimations.However, in larger datasets a major cause for errorsin the initial isotope ratio approximations may bethe contamination of the magma by crustal mate-rial. A plot of estimated 87Sr/86Sr versus 1/Sr (Fig. 7)suggests that bedrock units KrPr, KrAr and SvColhave been contaminated quite heavily whereas unitsRap, SvGr and SvB only in small amounts.
5.1 The smoothedisotope ratio estimate
The smoothed values at the locations of the estima-tion points differ from the estimated values. Smoot-hed values are an estimate of the isotope ratios ofthe material weathered onto the bedrock. In thiscase the weathered material is assumed to had spreadevenly to every direction following normal distri-bution in distance. It is not, however, either sen-sible to fit a parametric function to the estimationpoints, for it would require an assumption that theSr isotope ratios are continuous between bedrockunits.
The strontium concentration weightedsmoothing (Fig. 4) gives clearly lower values for 87Sr/86Sr than the non-weighted smoothing (Fig. 3). Thisis an expected result, for without weighting by Srconcentration the areas of high Rb/Sr ratio (andthus generally high 87Sr/86Sr ratio but low Srconcentration) would have a too large effect on the
pe ratio approximations, suggesting that the errorsdo not derive from a faulty initial isotope approxi-mation. Typical for these granites are also high Rb/Sr ratios. The low precision of the ages given inRGDB account to some degree for the error of eve-ry estimate, except of those aged between 1800 and2000 Ma.
In the evaluation of the method, the ages usedin the Sr isotope ratio estimation are from the Rb-Sr isotope analyses. Generally, Rb-Sr method hasgiven younger ages in the Finnish Precambrian thanU-Pb and Pb-Pb methods. If this trend is due toerroneous Rb-Sr ages (cf. Vaasjoki, 1988; Martin& Parbey, 1988), the estimated Sr isotope ratios inthe evaluation of the method will have a tendencyto lower values, and the absolute error to more ne-gative values from actual. These erroneous Rb-Srages may arise out of late fluid related Rb-Sr frac-tionation which certainly is a reason for the errorsin high Rb/Sr samples. Largest absolute errorsamong high Rb/Sr samples are indeed negative. Thenine granitic samples with large relative errors (> 1%) are a case in point: They have low Sr concentra-tions (< 150 ppm), a possible indication of Rb and
Fig. 6. The 95 % confidence intervals and the regressionline fitted for the measured Rb/Sr and 87Sr/86Sr ratios ofthe published isotope analysis samples (Rb/Sr < 1.0).
Bulletin_83_2_s95_114_Kaislaniemi.pmd 2.2.2012, 9:01109

110 Lars Kaislaniemi
isotope ratios of the surrounding. Smoothing usingSr concentration requires an assumption that Srweathers at equal rates from different types of rocks.
The non-weighted smoothing follows well themedians and variations of the isotope ratioscalculated by bedrock units. However, the valuesare probably too high because of the effect of Srconcentration variations. The Sr concentrationweighted values are presumably realistic by the orderof magnitude: Åberg (1995) has reported 87Sr/86Srvalues of 0.71–0.8 from lakes, rivers, soil, and treesof Finland and Sweden. The average 87Sr/86Sr ratioof the strontium in the rivers on the Precambrianshield of Fennoscandia are estimated to be 0.730(Löfvendahl et al., 1990), which is very close to theSr concentration weighted average (0.7293) of theestimated values.
Fig. 7. 87Sr/86Sr (estimated) versus 1/Sr mixing plots for samples from the major bedrock units. Note that samples are ofdifferent ages even inside one age group. KrPr shows probably complex mixing of different sources whereas Rap plotsstraight lines within age groups. Others fall between these two end members. The major bedrock units consist ofnumber of smaller units inside large geographical regions, which means that straight lines are probably due to correlationwithin age groups (variable age groups plotting on separate lines) and degrees of differentiation. Pure binary mixing ofthese major units to explain the apparent mixing lines is unlikely. Scattering of the points would thus present smallerscale mixing and general heterogeneity within the bedrock unit.
5.2 The estimateby bedrock units
There is distinct variation in isotope ratios (Table2, Fig. 2) between bedrock units, but no systematicdifference between the Archaean and Proterozoicareas. This could be explained by relatively similarRb/Sr ratios of the rocks in these areas, concealingthe effect of different age. The internal variation inmany units (KrPr, Ina, SvA) is too big to distinctthem clearly from the other units, whereas the unitswith lower medians (Kal, SvCol, SvC, Grl) havesmaller internal variation.
On large scale, six areas of different Sr isotoperatios, partly corresponding to major bedrock units,can be distinguished from the smoothed Sr isotopeestimate maps:
Bulletin_83_2_s95_114_Kaislaniemi.pmd 2.2.2012, 9:01110

111Estimating the distribution of strontium isotope ratios (87Sr/86Sr) in the Precambrian of Finland
1) The southern and south-eastern Finland (Rapand SvA, approximately), consisting mainly ofRapakivi intrusions and Uusimaa, Häme andTampere schist belts (including some Svecofen-nian late-orogenic granites), is dominated byhigh values of Sr isotope ratios. These high va-lues in Rapakivi areas are expected because ofthe high Rb/Sr ratios (> 1) of Rapakivi rocks,due to fractionation during melting of existingcrust.
2) Central Finland (SvB, approximately) hasmostly low values, but has somewhat largedeviation.
3) Three Archaean complexes of Central Karelian,Iisalmi and Pudasjärvi, which form the twosouthern KrAr units, have low values.
4) Areas 2 and 3 are separated by a zone of highervalues from Oulu to south-east, which seemsto intersect with early Proterozoic schist beltsNorth Karelia, Kainuu and northern Bothnian(belonging to KrPr) and Svecofennian late-orogenic granites (belonging to SvC and SvA).The southern side of this zone follows the Raa-he-Ladoga subduction zone and has a sharpborder to lower values.
5) High values dominate also the Proterozoic partof Karelian Domain (KrPr) in central Lapland(consisting of schists of Lapponia and Kareliasupergroups: Peräpohja and Kuusamo schistbelts, Kittilä allochthon).
6) In northernmost Finland the Lapland granulitebelt (Grl) together with western (Proterozoic)Inari area (Ina) has distinctly low Sr isotoperatios.
5.3 Issues to be consideredin utilisation of results
The assumption that weathered material spreadsevenly to its surrounds is hardly ever perfectly va-lid. In addition, the spatial accuracy of the estimateis affected by the value of the standard deviation σused in smoothing. With small values of σ an spati-ally precise estimate with high resolution is acqui-
red, but with possibly low accuracy. However, inthat case the differences between various areas arehard to detect as the number of areas with sameisotope ratio is large and the areas are small.
As a mobile element Rb may have traveled longdistances with fluids in the faults and joints of thebedrock. Thus the sampling convention of theRGDB causes uncertainty to the estimate, for thesamples have been taken from “a distinct and ho-mogeneous lithologic unit” (Rasilainen et al., 2007)and discontinuities may not be well represented inthe sample points.
The basic assumption of the method is that therocks are mantle derived. The validity of this as-sumption should not be taken as granted. If themethod is applied to a specific area or bedrock unit,the Nd isotope studies (or other available indica-tors for mantle derivation) for this area/unit shouldbe checked to see, if major discrepancies from thisassumption exist.
Based on the results, it is not possible to posi-tion a single Sr isotope analysed sediment or orga-nism sample to an exact area or corresponding bed-rock unit of Finland. However, some of the units orareas can be ruled out from possible provenance al-ternatives and large scale approximations of prove-nance can be made. In archaeology/palaeontologythe results are probably most easily exploitable in acase of migrating animals or animals with wide li-ving areas, for the Sr isotope ratios of their tissuesreflect the average strontium isotope compositionof the living area (Feranec et al., 2007). For suchcases a large value for σ in smoothing would beappropriate, minimizing the errors deriving fromsingle estimation points with anomalously high er-ror and from faulty assumption of the spreading ofweathered material. Smaller values of σ are ap-propriate when evaluating the estimated isotoperatios to real values in a restricted region using bo-nes and teeth from small animals inside this area.
6. Conclusions
The presented method to estimate the 87Sr/86Sr ra-tio of the Precambrian of Finland on the basis ofage data and Rb/Sr elemental analyses yields an ac-
Bulletin_83_2_s95_114_Kaislaniemi.pmd 2.2.2012, 9:01111
112 Lars Kaislaniemi
curate result on most rock types showing very goodcorrelation when evaluated against actual Rb-Sr iso-tope analyses. Possibly large errors can occur in are-as where bedrock has undergone Sr redistribution,e.g. due to fluid activity or subsolidus Rb/Sr migra-tion in granitic plutons. The method can be usedtogether with the data from the Rock GeochemicalDatabase of Finland to derive a large-scale generali-zation of 87Sr/86Sr ratios for the Precambrian of Fin-land. Distinct areas of high and low 87Sr/86Sr ratiosare distinguishable in the resulted estimate and ap-proximately six major areas can be outlined. Nosystematic difference between Archaean and youn-ger rocks due to age difference can be seen in theestimated isotope ratios, and 87Sr/86Sr ratio diffe-rences are more likely to be due to rock type andRb/Sr concentration differences. For utilization insedimentological, archaeological or palaeontologi-cal studies the estimation method can bring abouta preliminary approximation about the possibleprovenance areas. Erosional processes and the tran-sportation of Rb and Sr by fluids in rocks need stillto be considered and sampling of soil or sedimentsmust be done in more exact provenance studies.
7. AcknowledgementsThe work is based on my Bachelor’s Thesis, supervised andguided by prof. Juha Karhu and Dr. Hannu Huhma.Valuable aid from Aku Heinonen, Aleksis Karme and EsaHeilimo is acknowledged. Comments from reviewers Ste-fan Claesson and Yann Lahaye improved the quality of themanuscript significantly.
ReferencesÅberg, G., 1995. The use of natural strontium isotopes as tra-
cers in environmental studies. Water, Air and Soil Polluti-on 79, 309–322.
Beard, B.L. & Johnson, C.M., 2000. Strontium isotope com-position of skeletal material can determine the birth placeand geographic mobility of humans and animals. Journalof Forensic Sciences 45, 1049–1061.
Bernard-Griffiths, J., Peucat, J.J., Postaire, B., Vidal, P., Con-vert, J. & Moreau, B., 1984. Isotopic data (U-Pb, Rb-Sr,Pb-Pb and Sm-Nd) on mafic granulites from Finnish Lap-land. Precambrian Research 23, 325–348.
Capo, R.C., Stewart, B.W. & Chadwick, O.A., 1998. Stronti-um isotopes as tracers of ecosystem processes: theory and
methods. Geoderma 82, 197–225.Curran, J., Meighan, I., Simpson, D., Rogers, G. & Fallick,
A., 2001. 87Sr/86Sr: a new discriminant for provenancingneolithic porcellanite artifacts from Ireland. Journal ofArchaeological Science 28, 713–720.
English, N.B., Betancourt, J.L., Dean, J.S. & Quade, J., 2001.Strontium isotopes reveal distant sources of architecturaltimber in Chaco Canyon, New Mexico. Proceedings ofthe National Academy of Sciences 98, 11891–11896.
Faure, G. & Mensing, T.M., 2005. Isotopes: Principles andapplications. 3rd ed. John Wiley and Sons, Hoboken, NewJersey. 897 p.
Faure, G. & Powell, J.L., 1972. Strontium Isotope Geology.No. 5 in Monograph Series of Theoretical and Experi-mental Studies. Berlin. 188 p.
Feranec, R.S., Hadly, E.A. & Paytan, A., 2007. Landscape useof Holocene mammals using strontium isotopes. Oecolo-gia 153, 943–950.
Gosz, J.R. & Moore, D.I., 1989. Strontium isotope studies ofatmospheric inputs to forested watersheds in New Mexi-co. Biogeochemistry 8, 115–134.
Halicz, L., Segal, I., Fruchter, N., Stein, M. & Lazar, B., 2008.Strontium stable isotopes fractionate in the soil environ-ments? Earth and Planetary Science Letters 272, 406–411.
Halliday, A., Luukkonen, E.J. & Bowes, D.R., 1988. Rb-Srwhole-rock isotopic study of late Archaean and early Pro-terozoic granitoid intrusions, Kainuu, Eastern Finland.Bulletin of the Geological Society of Finland 60, 107–113.
Hodell, D.A., Quinn, R.L., Brenner, M. & Kamenov, G., 2004.Spatial variation of strontium isotopes (87Sr/86Sr) in theMaya region: a tool for tracking ancient human migrati-on. Journal of Archaeological Science 31, 585–601.
Korsman, K., Koistinen, T., Kohonen, J., Wennerström, M.,Ekdahl, E., Honkamo, M., Idman, H. & Pekkala, Y.(toim.), 1997. Suomen kallioperäkartta – Berggrundskartaöver Finland – Bedrock map of Finland 1:1 000 000.Geological Survey of Finland, Espoo, Finland.
Krom, M.D., Cli, R.A., Eijsink, L.M., Herut, B. & Chester,R., 1999. The characterisation of Saharan dusts and Nileparticulate matter in surface sediments from the Levanti-ne basin using Sr isotopes. Marine Geology 155, 319–330.
Kähkönen, Y., Huhma, H. & Aro, K., 1989. U-Pb zircon agesand Rb-Sr whole-rock isotope studies of early Proterozoicvolcanic and plutonic rocks near Tampere, southern Fin-land. Precambrian Research 45, 27–43.
Löfvendahl, R., Åberg, G. & Hamilton, P.J., 1990. Strontiumin the rivers of the Baltic Basin. Aquatic Sciences 52, 315–329.
Martin, H., 1989. Archaean chronology in the eastern part ofthe Baltic Shield: a synthesis. Precambrian Research 43,63–77.
Martin, H. & Barbey, P., 1988. Zircon U-Pb versus Rb-Sr
Bulletin_83_2_s95_114_Kaislaniemi.pmd 2.2.2012, 9:01112

113Estimating the distribution of strontium isotope ratios (87Sr/86Sr) in the Precambrian of Finland
whole-rock age data from eastern Finland. PrecambrianResearch 39, 221–226.
Martin, H. & Querré, G., 1984. A 2.5 G.a. reworked sialiccrust: Rb-Sr ages and isotopic geochemistry of late archa-en volcanic and plutonic rocks from E. Finland. Contri-butions to Mineralogy 85, 292–299.
Martin, H., Chauvel, C., Jahn, B.M. & Vidal, P., 1983. Rb-Srand Sm-Nd ages and isotopic geochemistry of Archaeangranodioritic gneisses from eastern Finland. PrecambrianResearch 20, 79–91.
Miller, E.K., Blum, J.D. & Friedland, A.J., 1993. Determina-tion of soilexchangeable cation loss and weathering ratesusing Sr isotopes. Nature 362, 438–441.
Pebesma, E.J. & Bivand, R.S., 2005. Classes and methods forspatial data in R. R News 5 (2), http://cran.r-project.org/doc/Rnews/
Porder, S., Paytan, A. & Hadly, E. A., 2003. Mapping the ori-gin of faunal assemblages using strontium isotopes. Pa-leobiology 29, 197–204.
Price, T.D., Connor, M. & Parsen, J.D., 1985. Bone chemistryand the reconstruction of diet: strontium discriminationin white-tailed deer. Journal of Archaeological Science 12,419–442.
R Development Core Team, 2009. R: a language and environ-ment for statistical computing. R Foundation for Statisti-cal Computing, Vienna, Austria. http://www.R-project.org
Rämö, T., 1999. Sr isotopic composition of Finnish rapakivi
granites: the Suomenniemi batolith. Bulletin of the Geo-logical Society of Finland 71, 339–345.
Rämö, T., Vaasjoki, M., Mänttäri, I., Elliott, B.A. & Nironen,M., 2001. Petrogenesis of the post-kinematic magmatismof the Central Finland Granitoid Complex I; radiogenicisotope constraints and implications for crustal evoluti-on. Journal of Petrology 42, 1971–1993.
Rasilainen, K., Lahtinen, R. & Bornhorst, T., 2007. The RockGeochemical Database of Finland Manual. GeologicalSurvey of Finland, Report of Investigation 164, 1–38.
Rock Geochemical Database of Finland (2008). Version 1.1.Geological Survey of Finland, Espoo, 25th April 2008.Online database accessed 15th June 2008, http://www.gtk.fi/publ/RGDB
Tichomirowa, M., Grosche, G., Götze, J., Belyatsky, B.V., Sa-vva, E.V., Keller, J. & Todt, W., 2006. The mineral isoto-pe composition of two Precambrian carbonatite comple-xes from the Kola Alkaline Province, alteration versus pri-mary magmatic signatures. Lithos 91, 229–249.
Vaasjoki, M., 1988. Zircon U-Pb versus Rb-Sr whole-rock agedata from eastern Finland: a critical comment on the pa-pers of Barbey & Martin and Martin, Precambrian Rese-arch, vol. 35, 1987. Precambrian Research 39, 217–219.
Workman, R.K. & Hart, S.R., 2005. Major and trace elementcomposition of the depleted MORB mantle (DMM).Earth and Planetary Science Letters 231, 53–72.
Bulletin_83_2_s95_114_Kaislaniemi.pmd 2.2.2012, 9:01113