estimating the exchange rate pass-through to prices in · j. f. cortés espada monetaria,...
TRANSCRIPT

287J. F. Cortés Espada Monetaria, July-December, 2013
Josué Fernando Cortés Espada
Estimating the Exchange Rate Pass-through
to Prices in Mexico
Abstract
This paper estimates the magnitude of the exchange rate pass-through to consumer prices in Mexico. Moreover, it analyzes if the pass-through dynamics have changed in recent years. In particular, it uses a meth-odology that generates results consistent with the hierarchy implicit in the cpi. The results suggest that the exchange rate pass-through to the general price level is low and not statistically significant. However, the pass-through is positive and significant for goods prices. Further-more, the exchange rate pass-through declined over the 2000s and the depreciation observed in 2011 did not change this trajectory.
Keywords: depreciation, inflation, exchange rate pass-through, pass-through elasticity.
jel Classification: E31, F31, F41
1. IntroductIon
During the last few decades a large number of emerging economies abandoned the exchange rate as nominal anchor in favor of an inflation targeting scheme with
a free f loating exchange rate. In addition, the number of economies with low and stable inflationary environments has
Directorate General of Economic Research, Banco de México <[email protected]>.

288 Monetaria, July-December, 2013
increased recently. Under this context, literature studying the pass-through of exchange rate shocks to prices has shown that the benefits of a free floating regime become more evident once a stable inflationary process has been achieved. This is due to the fact that, as Taylor (2000) states, the magnitude of the exchange rate pass-through to prices depends on the volatility of the latter’s inflationary process.
The objective of this paper is therefore to determine wheth-er there is a pass-through of exchange rate movements to con-sumer price inflation in Mexico, and measure its magnitude. Special attention will also be placed on determining if the path of Mexico’s consumer price index (cpi) inflation has been af-fected by the recent episodes of depreciation exhibited by the mxn/usd exchange rate. It particularly analyzes the depreci-ation recorded by said exchange rate during the second half of 2011, given the deteriorated international economic envi-ronment. Initially, economic analysts considered that the ex-change rate adjustment would partly reverse within a relatively short time. Even though this reversal place, it took longer than was foreseen. In addition, at the end of 2011 the relative price of goods with respect to services began to increase as a conse-quence of the exchange rate adjustment, in line with Banco de México’s forecast. However, the growth rate of goods prices was higher than anticipated.
The relevance of the topic in Mexico has led to a vast amount of literature that can be divided into two groups. First, the stud-ies of Conesa (1998), González (1998), Garcés (1999), Goldfajn and Ribeiro da Costa (2000), Hausmann et al. (2000), Santaella (2002) and Schwartz et al. (2002), analyze the period of high in-flation before the adoption of the inflation targeting scheme and show that there is a high degree of pass-through from exchange rate shocks to price variations. Second, there are the works of Baqueiro et al. (2003) and Capistrán et al. (2012), indicating that the hypothesis of Taylor (2000) would seem to apply to Mex-ico; i.e., after the change in inflation persistence documented by Chiquiar et al. (2010), the degree of pass-through from ex-change rate movements to inflation has declined significantly.

289J. F. Cortés Espada
Under such context, this paper uses a vector autoregressive (var) model similar to those employed in the literature on the topic. However, this research differs from previous works in five main aspects:
1) It employs an updated sample with information up to Au-gust 2012, allowing study of whether the results found by Capistrán et al. (2012) have changed and analysis of the re-cent episode of exchange rate depreciation that occurred in 2011.
2) Pass-through coefficients are calculated for the 16 main cpi aggregation groups. This allows determining which specific groups from the consumer price basket are affected by ex-change rate fluctuations. Works such as that of Capistrán et al. (2012) analyzed the impact along the whole distribu-tion chain, but did not carry out a disaggregation of the cpi. The main objective of this paper is to analyze the pass-through of exchange rate movements to consumer prices and it therefore does not study the impact along the whole distribution chain.
3) It uses the optimal aggregation method proposed by Hynd-man et al. (2007) for the different cpi subindices. This meth-odology generates estimations that are consistent with the cpi’s hierarchical structure. It also minimizes the distance between estimations made independently for each subin-dex and estimations obtained from the lowest aggregation groups. This is carried out by modifying the estimations of the lowest levels until this distance is minimized. Thus, esti-mations that use a wider group of information and that are consistent with the hierarchy are obtained. It is important to point out that this is first time the optimal aggregation method has been used to analyze the pass-through from ex-change rate movements to inflation in the context of a var model.1
1 In the case of Mexico, this method was applied by Capistrán et al. (2010) to aggregate forecasts of the consumer price indices.

290 Monetaria, July-December, 2013
4) It analyzes how the path of the pass-through coefficient of exchange rate movements has changed. Although in Cap-istrán et al. (2012) said trajectory was estimated through a bivariate regression between inflation and the exchange rate with rolling windows, this paper makes the estimation with a var model, also with the rolling window methodol-ogy. In this way it eliminates any possible bias caused by not including fluctuations in real activity, interest rates and oth-er external variables.
5) The pass-through from the depreciation in mid-2011 is cal-culated. In particular, a counterfactual exercise is carried out to estimate the extent to which the shock suffered by the exchange rate in the second half of 2011 affected consumer prices in Mexico.
The results suggest that the pass-through coefficient of ex-change rate shocks to consumer price inflation in Mexico is low and statistically not significant during the period June 2001-August 2012. However, said pass-through is positive and significant for goods prices due to the positive and significant pass-through to non-food merchandise prices. This is due to the fact that the prices of these groups are mostly determined in the international market. The latter is consistent with the fact only in these groups do exchange rate variations explain an important part of changes in their prices. It is also found that during the 2000s, the path of the exchange rate pass-through to the general price level shifted from positive and significant levels to statistically zero values. Moreover, the depreciation of the exchange rate in 2011 did not change this trajectory.
The rest of the paper is organized as follows: the second Section presents the var model employed for quantifying the pass-through of exchange rate movements to inflation, as well as the aggregation method for the differ rent cpi subindices. The impact of the exchange rate depreciation on consumer prices is addressed in the third Section. Finally, the fourth Sec-tion presents some final remarks.

291J. F. Cortés Espada
2. Methodology
In order to quantify the magnitude of the pass-through from exchange rate shocks to consumer prices, this section presents a vector autoregressive model (var), similar to the one used in Capistrán et al. (2012), which will be used as the basis for the estimations in this research. Additionally, in order to ensure the results generated by said model respect the hierarchies and weights of the groups making up the cpi basket, the aggrega-tion method developed by Hyndman et al. (2007) is employed.
2.1 Model
In order to analyze the pass-through of exchange rate fluc-tuations to consumer price inflation in Mexico a var model is estimated. This modeling strategy was introduced by Sims (1980) as an alternative to structural macroeconomic mod-els, which generally resulted in large systems of equations re-quiring a large amount of restrictions for solving them. The importance of this type of models is that it allows study of the dynamics between a set of variables that are potentially endog-enous, which is very common when analyzing macroeconomic series. In particular, this model allows analyzing the dynam-ics between shocks affecting the exchange rate and consumer price inflation, controlling for the behavior of other macro-economic variables. For this reason, the works of Capistrán et al. (2012), Choudhri et al. (2005), Hahn (2003), McCarthy (2007) and Stulz (2007) opted for this technique for estimat-ing exchange rate pass-through.
The analysis period employed for this estimation var model is from June 2001 to August 2012.2 The selection of this start-ing point for the sample is due to two factors: First, as has been mentioned, Chiquiar et al. (2010) show that after 2001 inflation turned from being a stochastic trend process to a stationary
2 The end of the period is determined by the availability of data from the global economic activity indicator (igae, for its Spanish acronym) at the time of developing this paper.

292 Monetaria, July-December, 2013
process; second, the study of Capistrán et al. (2012) shows that the pass-through coefficient underwent a change during the period January 1997-May 2001 as compared to that of June 2001-December 2010, therefore, given that the analysis will be based on the period where inflation has exhibited low and sta-ble levels only the last time period, updated up to August 2012, will be employed. In this way it can also be studied whether the results obtained by said authors remain valid despite the de-preciation that occurred in 2011.
The model includes a vector of endogenous variables: The global economic activity index (igae); the 28-day Cetes inter-est rate (r); mxn/usd exchange rate (tc), and the national consumer price index (cpi). Additionally, the following exog-enous variables are included: The us industrial production in-dex (pi), one-month us Treasury bonds interest rate (r*), the us consumer price index (cpius) and an international commodity price index (p com).3 This selection of variables is included given that they typically, according to recent New Keynesian litera-ture, characterize the conditions of balance in price-taking economies such as Mexico (i.e., small, open economies). The assumption of exogeneity implies that external variables affect domestic variables, but not vice versa, given that the model rep-resents Mexico as a price-taking economy at the global level. As in the model employed by Capistrán et al. (2012), besides the Cetes and Treasury bill interest rates, which are defined in
3 As in the study of Capistrán et al. (2012), each of the exogenous controls used are statistically significant for at least one of all the endogenous variables. In particular, the sample period June 2001-August 2012 for the model using the cpi yields the following: Just as economic activity in the usa affects that of Mexico, the Trea-sury bill interest rate also impacts the Cetes interest rate. In turn, changes in consumer prices abroad have a statistically significant impact on the igae and the exchange rate. Finally, international prices of commodities affect the exchange rate. The results of cpi disaggregations are similar, but present some peculiarities; for instance, us inflation have a statistically significant impact on the non-food goods price subindex.

293J. F. Cortés Espada
percentage points, the other variables are presented by their annual change expressed in percentage. This allows the vari-ables used in the calculation to be stationary during the study period. Furthermore, with this specification the roots of the characteristic polynomial of the model fulfill stationarity cri-teria set forth by Lütkepohl (2006, Chapter 2.1).
A recursive mechanism is used to identify the pass-through from exchange rate shocks to other endogenous variables, in particular, employing the Cholesky decomposition.4 Through this mechanism a transformation of the variance-covariance matrix of the shocks is obtained from a lower triangular ma-trix. Thus, a shock in the first variable will be immediately passed on to the rest, while one in the last variable will impact the rest with a lag. Based on the aforementioned, the endoge-nous variables mentioned previously were placed in different orders, however, the results were robust to said variations and for this reason the same order used in Capistrán et al. (2012) is employed.
Thus, prices are placed after the exchange rate, allowing shocks to the latter to be immediately transmitted to the for-mer. In turn, the interest rate is placed before both variables, implying that the monetary authority responds to exchange rate and inflationary shocks with a one-period lag. As in Cap-istrán et al. (2012), and following Peersman and Smets (2001), and Kim and Roubini (2000), the igae is placed first, indicat-ing that the real activity reacts with a lag to interest rate shocks, while the exchange rate responds immediately to igae and in-terest rate shocks. This specification has also been used for an-alyzing the exchange rate pass-through to prices by Choudhri et al. (2005), Hahn (2003) and McCarthy (2007).
Based on the above, the model can be expressed as follows:
1 1( ) ( )t t t ty c A L y B L x u−= + + + ,
where:
4 For details of the Cholesky decomposition see Hamilton (1994).

294 Monetaria, July-December, 2013
12 12 12ln l , , ,n n lt t t t ty IGAE R TC INPC∆ ∆ ∆= ,
*12 12 12, ,ln ln , l n com
t t t t tx PI R IPC P∆ ∆ ∆ = .
A(L) and B(L) are matrix polynomials in the lag operator L; c is a vector of constants; ut is a vector of residuals; and 12 ln tz∆ represents the twelfth order logarithmic differences of vari-able zt. Finally, it can be seen that the model to be estimated is in reduced form, meaning that no endogenous variable im-pacts the other immediately.
2.2 Aggregation of the results
The var model explained in the previous section is used to es-timate the pass-through of exchange rate movements to 16 su-perior aggregation groups of the cpi, i.e., an independent var is estimated for each of the following price indices:
• Headline index (IG).
• Subindices: core (IS) and non-core (IN).
• Groups: goods (ISM), services (ISS), agricultural (INA), en-ergy and government approved fares (INE).
• Subgroups: food, beverages and tobacco (ISMA), non-food goods (ISMM), housing (ISSV), education (ISSE), rest of services (ISSR), fruits and vegetables (INAF), livestock (INAP), energy (INEE) and government approved fares (INET).
This method, consisting of estimating the pass-through to prices as if they were independent of each other, will hereaf-ter be referred to as direct estimation. Once the 16 models have been estimated independently, the recursive method (Cho-lesky decomposition) is used to estimate the pass-through of exchange rate shocks to prices by means of impulse-response functions. However, the results obtained from the direct estima-tion method do not include the hierarchical relations among the 16 groups making up the cpi basket, which follow a bottom-up

295J. F. Cortés Espada
aggregation, i.e., superior aggregation groups are generated using the weighted averages of inferior groups. The latter im-plies that the results will not exhibit the consistency observed in the price indices.
In order to solve the above, the results generated by the direct estimation method are aggregated according to the procedure proposed by Hyndman et al. (2007), which will be referred to as optimal combination. This method combines the information of the aggregated and basic indices in line with the hierarchy of cpi groups. Besides, the estimators that present the mini-mum variance from the direct estimation are generated with cer-tain assumptions. This aggregation mechanism was applied by Capistrán et al. (2010) for forecasting price indices in Mexico. However, as far as it is known, this is the first time they have been used to analyze the pass-through of exchange rate fluc-tuations to inflation in the context of a var model.
In order to coincide with the notation of Hyndman et al. (2007), the cpi is defined as aggregation level 0, the subindi-ces as level 1, the groups as level 2 and finally the subgroups as level 3 in the aggregation of the cpi; as mentioned, these four aggregation levels include a total of 16 series. Data for period t for the series of level j are grouped in vector jtI , in such way that vector [ ]0 1 2 3, , ,t t t t tI I I I I= represents the information in t of the 16 indices. Additionally, following Capistrán et al. (2010), a ma-trix P is defined that, unlike the matrix of zeros and ones used by Hyndman et al. (2007), is composed of 16 rows represent-ing the relative weights of each of the level 3 subgroups within each of the indices tI . Said matrix P is presented for the cpi weights based on the second fortnight of December 2012. It is worth mentioning that the weight matrix will remain constant in the exercises presented in the following section.5
5 Although cpi weights changed in June 2002 and December 2010, such changes did not have a statistically significant impact on the estimations. Additionally, given that the analysis carried out in this paper takes place after the last change in the weights its results and conclusions are not affected by such updates.

296 Monetaria, July-December, 2013
0.15 0.20 0.19 0.05 0.18 0.04 0.05 0.10 0.050.19 0.26 0.24 0.07 0.24 0 0 0 0
0 0 0 0 0 0.16 0.21 0.41 0.230.43 0.57 0 0
G
S
N
SM
SS
NA
NE
SMAt
SMM
SSV
SSE
SSR
NAF
NAP
NEE
NET
IIIIIIII
I PIIIIIIII
= =
0 0 0 0 00 0 0.44 0.12 0.43 0 0 0 00 0 0 0 0 0.43 0.57 0 00 0 0 0 0 0 0 0.64 0.361 0 0 0 0 0 0 0 00 1 0 0 0 0 0 0 00 0 1 0 0 0 0 0 00 0 0 1 0 0 0 0 00 0 0 0 1 0 0 0 00 0 0 0 0 1 0 0 00 0 0 0 0 0 1 0 00 0 0 0 0 0 0 1 00 0 0 0 0 0 0 0 1
Thus, it can be seen that with matrix P it is possible to obtain the aggregation of the 16 cpi indices using the bottom-up ( )BU
tI method from the nine subgroups of level 3, i.e., 3
BUt tI PI= .
Furthermore, Hyndman et al. (2007) show that if t̂I are inde-pendent estimations of the four aggregation levels, there is a matrix Q that produces lineal combinations of said estimations with which series tI are generated that fulfill the hierarchies implicit in calculating the cpi.
2 t tI PQI= ˆ
These authors also show that under the assumption that errors 3tε existing between the inferior level independent estimations ( )3tI and those generated by the previous formula ( )3tI fulfill
the hierarchy implicit in matrix P , i.e., if the errors of all the ag-
gregation levels, 0 1 2 3, , ,t t t t tε ε ε ε ε= , fulfill the bottom-up aggre-
gation, 3t tPε ε= , matrix 1 ( )Q P P P−′ ′= generates combination ( )*
tI that, besides fulfilling the hierarchy of the series, minimizes the variance with respect to the independent estimations ( )t̂I .

297J. F. Cortés Espada
3 ( ) 1* ˆt tI P P P P I−′ ′= .
Thus, the procedure of Hyndman et al. (2007) generates es-timations from the information used for all aggregation levels and not only for inferior levels, meaning the group of data is broader than that used by the bottom-up method. The estima-tions will therefore be more efficient than those generated us-ing the latter method given that it is limited within the space of possible combinations generated by matrix Q.
3. exchAnge rAte PAss-through to PrIces
This section presents four exercises that allow for determining the magnitude of the pass-through from exchange rate shocks to consumer prices in Mexico, whether this has changed from December 2010 to date and its behavior during recent decades. It is important to mention that only the results for the head-line index, core and non-core subindices, the groups of servic-es and goods, and the disaggregation of the latter are shown, due to the nonsignificance exhibited by the other cpi6 baskets.
3.1 relation between the cpi and the exchange rate
The first point to analyze is whether there is in fact a correla-tion between cpi inflation and variations in the mxn/usd ex-change rate. In this regard, it should be mentioned that the price formation process in the Mexican economy has changed significantly since 2001, when the inflation targeting scheme was adopted. Chiquiar et al. (2010) show that since then infla-tion turned from being a stochastic trend process to one that can be characterized as stationary. In addition to this, firms’ price revision schemes changed from being mainly state de-pendent to predominantly time dependent (Cortés, Murillo and
6 The results of the cpi groups which were not included are available from the author upon request.
298 Monetaria, July-December, 2013
Ramos-Francia, 2012).7 In contrast, Gagnon (2007) estimates that for the period before the adoption of inflation targeting schemes the price formation process was mostly state dependent.
In this context, Figure 1 shows a change in the relation be-tween the annual trajectory of cpi inflation and the annual change of the nominal exchange rate.8 As can be seen, from 1976 to September 2012, both series are closely correlated (0.79). In fact, it can be observed that the depreciations in 1976-1977, 1982-1983, 1987-1988 and 1995 were accompanied by significant increases in headline inflation. However, since the adoption of inflation targeting schemes in 2001, the degree of correlation between inflation and depreciation declined (0.36). Thus, within the environment of low and stable infla-tion that has prevailed in Mexico during recent years, the ex-change rate pass-through to prices seems to have been low. In particular, the depreciation between 2008 and 2009 had no significant impact on inflation, as opposed to the aforemen-tioned devaluations. The model described in the previous sec-tion is estimated in order to quantify this impact.
3.2 Precise estimation
Once the model is estimated, impulse-response functions are calculated to determine the pass-through of exchange rate shocks to inflation. In order to facilitate interpretation of the results generated from the methodology developed in the pre-vious section, Figures 2 to 4 show the effect in terms of accu-mulated pass-through elasticities, which can be interpreted as
7 Time dependent price revision strategies are defined as those where revisions in order to realize possible price changes are carried out by the firm in pre-established periods, while in state dependent strategies prices are not revised in pre-established schedules, but rather depend on the circumstances faced by the firm at the ma-croeconomic level.
8 This Figure is an updated version of that presented in Capistrán et al. (2012). Its interpretation remains the same even with the sample up to 2012.

299J. F. Cortés Espada
percentage changes in prices given a 1% depreciation of the exchange rate, i.e.:
4 ,
,
%
%t t
tt t
PPT
TCτ
τ
+
+
∆=∆
,
where , % t tP τ+∆ is the percentage change of the price level τ pe-riods after the shock, and ,% t tTC τ+∆ is the percentage change of the exchange rate in the same period. Thus, the vertical axis is measured in percentage points and the responses are pre-sented for a 48-month horizon with 90% confidence intervals, a measure typically used in the literature. The standard errors of the elasticities are obtained from those generated for the impulse-response functions through ordinary least squares.
Figures 2a and 2b show the elasticities of the accumulated pass-through to the general price level using the direct estima-tion method for the period June 2001-December 2010 estimated by Capistrán et al. (2012) and for the period June 2001-August 2012, respectively. The results show that the accumulated pass-through elasticity increased slightly from December 2010 to
–20
30
80
130
180
230
280
sep
76
sep
80
sep
84
sep
88
sep
92
sep
96
sep
00
sep
04
sep
08
sep
12
Exchange rateNational Consumer Price Index
Figure 1NATIONAL CONSUMER PRICE INDEX AND EXCHANGE RATE
(annual variation)
Sources: Banco de México and Inegi.

300 Monetaria, July-December, 2013
August 2012. However, such differences are not statistically significant, given that, as can be seen, the impact is still statis-tically equal to zero. This shows that the exchange rate depre-ciation in 2011 did not significantly change said pass-through. In addition, Figure 2c shows the results obtained using the opti-mal combination method for the second study period. As can be seen, the pass-through elasticity of exchange rate movements to the general level of prices does not exhibit statistically sig-nificant differences after the estimation method is changed, implying that estimations for pass-through elasticities are ro-bust to the method employed.9
The abovementioned results are shown in Table 1. As re-ported in Capistrán et al. (2012), in 2010 the elasticity of the exchange rate pass-through to general consumer prices was 0.02 one year after the shock and 0.04 four years after it. By
9 As would be expected, given that the results generated by the opti-mal combination method have a minimum variance from the those obtained using the direct estimation method, the results from both methods for the remaining cpi levels also exhibit this robustness.
) J 2001-D 2010 D
) J 2001-A 2012 D
) J 2001-A 2012 O
–0.20
–0.15
–0.10
–0.05
0
0.05
0.10
0.15
0.20
0.25
0.30
–0.20
–0.15
–0.10
–0.05
0
0.05
0.10
0.15
0.20
0.25
0.30
–0.20
–0.15
–0.10
–0.05
0
0.05
0.10
0.15
0.20
0.25
0.30
1 9 17 25 33 41 48Months
1 9 17 25 33 41 48Months
1 9 17 25 33 41 48Months
Sources: Own calculations with information provided by Banco de México and Inegi. 1 Doted lines are 90% confidence intervals.
Figure 2IMPACT OF THE EXCHANGE RATE ON THE CPI1
(Accumulated pass-through elasticity)
301J. F. Cortés Espada
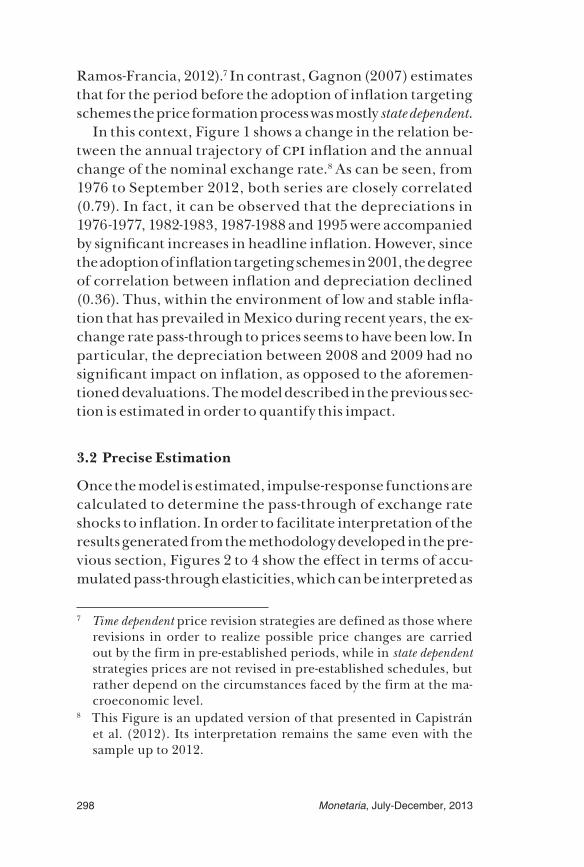
table 1
elAstIcIty of the exchAnge rAte PAss-through to the cPI1
(accumulated pass-through elasticity)Months
12 24 36 48
June 2001 to December 2010 0.021 0.032 0.037 0.038 Direct estimation (0.02) (0.04) (0.04) (0.05)
June 2001 to August 2012 0.033 0.054 0.065 0.070 Direct estimation (0.02) (0.04) (0.06) (0.07)
June 2001 to August 2012 0.039 0.056 0.062 0.063 Optimal combination (0.03) (0.06) (0.08) (0.09)
Source: Own calculations with information provided by Banco de México and Inegi.1 Data in parenthesis represents standard errors.
updating this model with information up to August 2012, the pass-through elasticity is estimated to be 0.03, 12 months after the shock, and 0.07, 48 months after it, although such impact is not statistically significant. Finally with the optimal aggre-gation method of Hyndman et al. (2007) the pass-through co-efficient is estimated to be 0.04 one year after the shock and reaches 0.06 four years after it.
As can be seen in Figure 2 and Table 1, the results of both estimation methods (direct estimation or optimal combination) are not statistically different. However, the optimal combination method satisfies the hierarchical structure of the cpi and yields estimates based on a broader group of information than the bottom-up method. In particular, it generates better estimates for the most inferior levels (due to the way it minimizes the dis-tance with respect to direct estimates) by taking into consider-ation the trajectories that satisfy the hierarchies. This implies that all the groups of information used are combined to cal-culate all the estimates.
Table 2 shows the results for the different price subindices in the period June 2001-August 2012. In the case of core and non-core price indices, pass-through elasticity is found to be

302 Monetaria, July-December, 2013
0.02 and 0.10, respectively, one year after the shock, reaching 0.02 for the former and 0.13 for the latter after 48 months. In turn, the elasticity of the exchange rate pass-through to the goods price subindex is 0.07 twelve months after the shock and 0.17 after four years. In the case of the services price sub-index, the pass-through is practically zero, both one year af-ter the shock and in the long term. Additionally, regarding the food, beverages and tobacco and non-food merchandise price subindices, the elasticities of the exchange rate pass-through are approximately 0.05 and 0.09 after one year, reach-ing 0.13 and 0.19, respectively, after four years. It is important to point out that the estimation results indicate that only in the case of non-food merchandise inflation the exchange rate
table 2
elAstIcIty of the exchAnge rAte PAss-through to PrIce IndIces
(accumulated pass-through elasticity, June 2001-August 2012)Months
12 24 36 48
cpi Elasticity 0.039 0.056 0.062 0.063Standard error (0.03) (0.06) (0.08) (0.09)
Core Elasticity 0.017 0.023 0.025 0.025Standard error (0.01) (0.02) (0.02) (0.02)
Merchandise Elasticity 0.071 0.125 0.153 0.166Standard error (0.02) (0.05) (0.09) (0.12)
Food Elasticity 0.051 0.103 0.128 0.134Standard error (0.03) (0.07) (0.12) (0.16)
Non-food Elasticity 0.086 0.143 0.172 0.191 Merchandise Standard error (0.02) (0.04) (0.06) (0.08)
Services Elasticity 0.002 0.000 −0.001 0.000Standard error (0.01) (0.02) (0.02) (0.02)
Non-core Elasticity 0.095 0.122 0.130 0.131 Standard error (0.09) (0.12) (0.15) (0.16)
Source: Own calculations with information provided by Banco de México and Inegi.

303J. F. Cortés Espada
pass-through coefficient is statistically different from zero in the long term (Figure 3).
Up to this point it has been determined how an exchange rate shock affects prices. In order to complement said analysis, the decomposition of the variance in inflation used by McCar-thy (2007) for the different cpi groups is presented. In particu-lar, the contribution of exchange rate movements to changes in consumer prices during the period June 2001-August 2012 is studied. The results are shown in Figure 4 and support the findings above. It is found that, only in the case of goods and non-food merchandise, a significant part of their change is due to exchange rate movements, given that the latter’s con-tribution is statistically not significant for the other groups.10
3.3 dynamic estimation
The results presented above provide a comprehensive, but pre-cise, account of how consumer prices in Mexico were affected by exchange rate shocks during the period of low and stable inflation between June 2001 and August 2012. However, ana-lyzing the behavior of the exchange rate pass-through when moving from a period of high inflation to one of relative stabil-ity might provide the analysis with a way to detect whether the results of the previous section are robust to the study period, and whether the exchange rate pass-through to prices has not begun to increase due to the recent depreciations.
A first study of this was carried out by Capistrán et al. (2012). Estimation of a rolling window linear regression of annual headline inflation on the annual depreciation rate of the ex-change rate, a constant and a lag of inflation, provides evidence that the pass-through of exchange rate shocks to the general price level changed in 2001 from positive and significant lev-els to levels statistically equal to zero. This coincides with the change in inflation rate dynamics reported by Chiquiar et al.
10 Confidence intervals are obtained using Monte Carlo simulations with 50,000 repetitions.

304 Monetaria, July-December, 2013
) S
) C
–0.20
–0.10
0
0.10
0.20
0.30
0.40
0.50
–0.20
–0.10
0
0.10
0.20
0.30
0.40
0.50
1 9 17 25 33 41 48Months
1 9 17 25 33 41 48Months
1 9 17 25 33 41 48Months
1 9 17 25 33 41 48Months
) N
) M
–0.10
0
0.10
0.20
0.30
0.40
0.50
–0.10
0
0.10
0.20
0.30
0.40
0.50
Figure 3EXCANGE RATE DEPRECIATION EFFECT TO PRICE INDICES1
(Accumulated pass-through elasticity, June 2001-August 2012)
) F, ) N-
–0.20
–0.10
0
0.10
0.20
0.30
0.40
0.50
–0.20
–0.10
0
0.10
0.20
0.30
0.40
0.50
1 9 17 25 33 41 48Months
1 9 17 25 33 41 48Months
Sources: Own calculations with information provided by Banco de México and Inegi.1 Doted lines are 90% confidence intervals.

305J. F. Cortés Espada
1 9 17 25 33 41 48Months
1 9 17 25 33 41 48Months
1 9 17 25 33 41 48Months
1 9 17 25 33 41 48Months
1 9 17 25 33 41 48Months
1 9 17 25 33 41 48Months
1 9 17 25 33 41 48Months
1 9 17 25 33 41 48Months
1 9 17 25 33 41 48Months
Sources: Own calculations with information provided by Banco de México and Inegi.1 Doted lines are 90% confidence intervals.
)
–10–5
05
101520253035
–10–5
05
101520253035
–10–5
05
101520253035
) M
–15–5
515253545556575
–15–5
515253545556575
–15–5
515253545556575
) S
–15–10
–505
101520253035
–15–10
–505
101520253035
–15–10
–505
101520253035
) C
) F
) E
) N-
) N-
) O
Figure 4VARIANCE OF PRICES INFLATION EXPLAINED BY THE EXCHANGE RATE1
(Percentage, June 2001-August 2012)
306 Monetaria, July-December, 2013
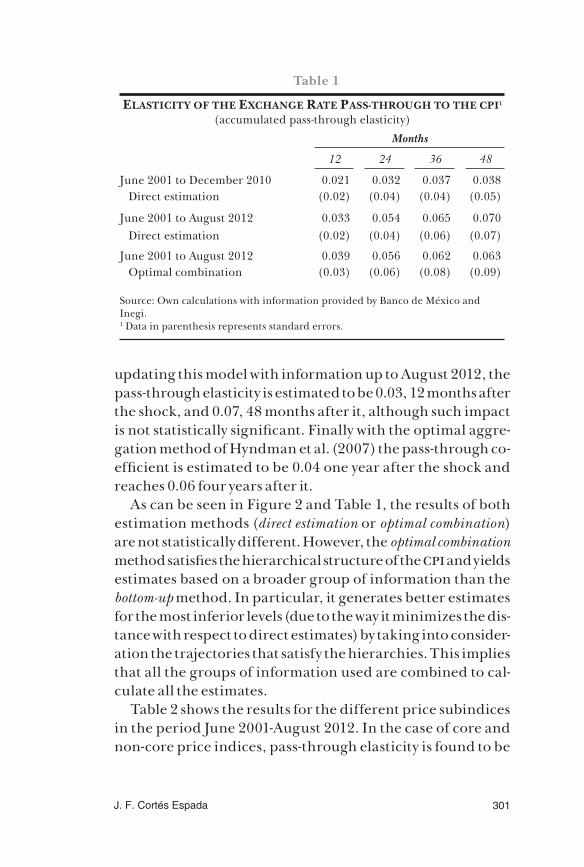
(2010). The results of said estimation were updated to August 2012 and are shown in Figure 5a.
Unlike Capistrán et al. (2012), this section estimates a var model with rolling windows using the group of variables de-scribed previously. The data sample includes the periods of stable and volatile inflation seen in recent decades, using data from 1994 to August 2012. Thus, the behavior of the pass-through coefficient is estimated, controlling for the possible bias generated by excluding changes in real activity, interest
) L C ET AL. (2012)
–0.40
–0.20
0
0.20
0.40
0.60
0.80
1.00
) A -
–0.40
–0.20
0
0.20
0.40
0.60
0.80
1.00
Figure 5aPASS-THROUGH OF EXCHANGE RATE TO CPI IN MEXICO1
(Accumulated pass-through elasticity, June 2001-August 2012)
Sources: Own calculations with information provided by Banco de México and Inegi.1 Doted lines are 90% confidence intervals.
Jan
00Ju
n 00
Nov
00
Apr
01
Sep
01Fe
b 02
Jul 0
2D
ec 0
2M
ay 0
3O
ct 0
3M
ar 0
4A
ug 0
4Ja
n 05
Jun
05N
ov 0
5A
pr 0
6Se
p 06
Feb
07Ju
l 07
Dec
07
May
08
Oct
08
Mar
09
Aug
09
Jan
10Ju
n 10
Nov
10
Apr
11
Sep
11Fe
b 12
Jul 1
2
Jan
00Ju
n 00
Nov
00
Apr
01
Sep
01Fe
b 02
Jul 0
2D
ec 0
2M
ay 0
3O
ct 0
3M
ar 0
4A
ug 0
4Ja
n 05
Jun
05N
ov 0
5A
pr 0
6Se
p 06
Feb
07Ju
l 07
Dec
07
May
08
Oct
08
Mar
09
Aug
09
Jan
10Ju
n 10
Nov
10
Apr
11
Sep
11Fe
b 12
Jul 1
2

307J. F. Cortés Espada
rates and the previously mentioned external macroeconomic variables. In addition to this, the optimal combination method is applied with six-year rolling windows. The calculations men-tioned in the estimation are made for the first window from January 1994 to January 2000, then for February 1994 to Feb-ruary 2000, and so on, up until the window from August 2006 to August 2012.
This type of formula allows analysis of the pass-through co-efficient, while controlling for the mentioned variables, on any
A - 18 )
–0.40
–0.20
0
0.20
0.40
0.60
0.80
1.00
) A - 12
–0.40
–0.20
0
0.20
0.40
0.60
0.80
1.00
Jan
00Ju
n 00
Nov
00
Apr
01
Sep
01Fe
b 02
Jul 0
2D
ec 0
2M
ay 0
3O
ct 0
3M
ar 0
4A
ug 0
4Ja
n 05
Jun
05N
ov 0
5A
pr 0
6Se
p 06
Feb
07Ju
l 07
Dec
07
May
08
Oct
08
Mar
09
Aug
09
Jan
10Ju
n 10
Nov
10
Apr
11
Sep
11Fe
b 12
Jul 1
2
Jan
00Ju
n 00
Nov
00
Apr
01
Sep
01Fe
b 02
Jul 0
2D
ec 0
2M
ay 0
3O
ct 0
3M
ar 0
4A
ug 0
4Ja
n 05
Jun
05N
ov 0
5A
pr 0
6Se
p 06
Feb
07Ju
l 07
Dec
07
May
08
Oct
08
Mar
09
Aug
09
Jan
10Ju
n 10
Nov
10
Apr
11
Sep
11Fe
b 12
Jul 1
2
Figure 5bPASS-THROUGH OF EXCHANGE RATE TO CPI IN MEXICO 1
(Accumulated pass-through elasticity, June 2001-August 2012)
Source: Own calculations with information provided by Banco de México and Inegi. 1 Doted lines are 90% confidence intervals.

308 Monetaria, July-December, 2013
time horizon and not just the immediate impact determined by the linear regression model. Based on this, Figures 5b to 5d present the estimates of said pass-through for horizons of 6, 12 and 18 months after the exchange rate shock.11 It can be seen that, for any study horizon, at the start of the 2000s the pass-through changed from being at positive and statistically signif-icant levels to levels statistically equal to zero.12 It is also found that, despite the depreciation in the second half of 2011, the trajectory of the pass-through coefficient remained unchanged.
The above confirms that the pass-through coefficient of ex-change rate movements to prices has undergone a change of trend as mentioned by Capistrán et al. (2012). However, unlike the bivariate regression carried out in that work, this model al-lows a better approximation of the magnitude and trajectory of said coefficient given that it controls for the interaction that exists with other macroeconomic variables. Additionally, the magnitude of the pass-through elasticity found for 6, 12 and 18 month horizons before 2001 are consistent with the results shown by Capistrán et al. (2012) for the period prior to the infla-tion targeting regime. The latter cannot be obtained through the aforementioned linear regression given that it only ana-lyzes the immediate impact of the exchange rate on prices.13
Furthermore, when using the optimal aggregation method the results fulfill the hierarchy implicit in cpi calculations.14 It
11 Results for other time horizons exhibit the same behavior as those displayed in Figure 5.
12 As can be seen, the change in the pass-through elasticity occurs around 2004, which is different from the date when the inflation targeting scheme was adopted. However, this shift is due to the fact that using rolling windows causes the change to be detected after it occurred because the windows also include data prior to the date of such change.
13 In particular, Capistrán et al. (2012) find that for the period January 1997-May 2001 the pass-through elasticity was 0.16, 0.33 and 0.49 for horizons of 6, 12 and 18 months, respectively.
14 To obtain the results with the optimal combination procedure it is necessary to apply precise estimation to the 16 most aggregated cpi indices. However, given that the results do not exhibit any large

309J. F. Cortés Espada
also confirms the hypothesis of Taylor (2000), which indicates that in an environment of stable inflation derived from a cred-ible monetary policy, firms are less inclined to pass through cost shocks to consumers given that their inflation expecta-tions are well anchored.
3.4 counterfactual exercise
Finally, this section estimates the impact of the exchange rate depreciation observed since August 2011 on consumer pric-es in Mexico. In order to do this the methodology explained above is applied for the period June 2001-July 2011 with the aim of simulating the impact that would have occurred at the moment of the depreciation.
In particular, in mid-2011 the Mexican economy was af-fected by an exchange rate shock, as a reflection of the dete-rioration in the external economic environment that led to a depreciation of over 18% between July and December of that year. Consequently, the observed trajectory of the exchange rate was above that expected by analysts before the referred shock. To define the magnitude of the exchange rate shock that will be analyzed in this section, Figure 6 presents the average exchange rate from August 2011 to September 2012 (13.23 pe-sos per dollar) and the average trajectory expected in July 2011 (11.88 pesos).15 As can be seen, the average exchange rate from August 2011 to September 2012 was 11.42% above the average level implied by economic analysts’ expectations.
To determine the impact of this depreciation on headline in-flation and its components, it will be assumed that the 11.42% shock occurred in August 2011. Thus, by calculating the pass-through elasticity for the mentioned period it is possible to
differences, only those of headline inflation are presented here. 15 These estimations were taken from the Banamex Encuesta de
Expectativas de Analistas de Mercados Financieros, according to which the expected exchange rate was 11.80 pesos per dollar at the end of 2011 and 12.15 pesos for 2012.

310 Monetaria, July-December, 2013
determine how many percentage points of the inflation of the different price subindices can be attributed to the shock in the months after it.
The obtained results show that the exchange rate deprecia-tion in the second half of 2011 impacted annual headline in-flation in September 2012 by 0.34 percentage points (Table 3). This means that 34 basis points from the annual cpi change, which was 4.77 per cent in September 2012, were due to the unexpected exchange rate adjustment. Regarding annual core and non-core inflation, the impact in September 2012 is estimated at 0.16 and 0.74 percentage points, respectively. In the case of annual goods and services core inflation, the im-pact is estimated at 0.82 and zero points that month. Finally, the effect of the shock on food, beverages and tobacco, and non-food merchandise inflation was 0.86 and 0.80 percentage points. Nevertheless, it is important to point out that, as for the period June 2001-August 2012, the impact of the exchange rate depreciation is only statistically significant for the goods
Sources: Banco de México and Encuesta de Expectativas de Analistas de Mercados Financieros elaborated by Banamex, July 2011.
.
8
9
10
11
12
13
14
15
16
Sep
02
Sep
04
Sep
06
Sep
08
Sep
10
Sep
12
Observed exchange rateExpected ER trajectory, June 201111.88 MXN/USD expectations13.23 MXN/USD 11.42%
Average of the observedexchange rate
Average of the exchange rateexpected trajectory
Figure 6NOMINAL EXCHANGE RATE (MXN/USD)

311J. F. Cortés Espada
price subindex, and in particular, for non-food merchandise (Figure 7).
In order to analyze the trajectories that would have been observed if the shock had not occurred, and under the men-tioned assumptions, a counterfactual exercise is carried out that sheds more light on the previous results. The exercise consists of simulating the trajectories of the main cpi compo-nents in the absence of the exchange rate deprecation that oc-curred in August 2011. In order to do this, the impact of the shock was excluded from accumulated inflation after August 2011 and new indices were constructed that did not contain the effect of the shock. The aforementioned allows identifica-tion of the groups of goods and services from the cpi basket
table 3
IMPAct of the dePrecIAtIon on AnnuAl InflAtIon(percentage points)
Dec. 2011
Mar. 2012
Aug. 2012
Sep. 2012
cpi Observed inflation 3.82 3.73 4.57 4.77
Shock 0.20 0.28 0.38 0.34
Core Observed inflation 3.35 3.31 3.70 3.61
Shock 0.09 0.13 0.18 0.16
Merchandise Observed inflation 4.52 4.51 5.23 5.24
Shock 0.32 0.53 0.86 0.82
Food Observed inflation 7.32 6.63 6.81 6.91
Shock 0.22 0.43 0.88 0.86
Non-food Merchandise
Observed inflation 2.39 2.89 4.01 3.96
Shock 0.40 0.61 0.84 0.80
Services Observed inflation 2.40 2.32 2.43 2.25
Shock 0.05 0.04 0.00 –0.01
Non-core Observed inflation 5.34 5.12 7.58 8.81
Shock 0.50 0.68 0.89 0.74
Source: Own calculations with information provided by Banco de México and Inegi.

312 Monetaria, July-December, 2013
) H ) C ) N-
1.0
2.0
3.0
4.0
5.0
6.0
7.0
8.0
9.0
Feb
11A
pr 1
1Ju
n 11
Aug
11
Oct
11
Dec
11
Feb
12A
pr 1
2Ju
n 12
Aug
12
1.0
2.0
3.0
4.0
5.0
6.0
7.0
8.0
9.0
1.0
2.0
3.0
4.0
5.0
6.0
7.0
8.0
9.0
Without shock
Observed
Feb
11A
pr 1
1Ju
n 11
Aug
11
Oct
11
Dec
11
Feb
12A
pr 1
2Ju
n 12
Aug
12
Feb
11A
pr 1
1Ju
n 11
Aug
11
Oct
11
Dec
11
Feb
12A
pr 1
2Ju
n 12
Aug
12
Sources: Own calculations with information provided by Banco de México and Inegi.1 Doted lines are 90% confidence intervals.
) M ) S
) F,
) N-
1.5
2.0
2.5
3.0
3.5
4.0
4.5
5.0
5.5
1.5
2.0
2.5
3.0
3.5
4.0
4.5
5.0
5.5
1.0
2.0
3.0
4.0
5.0
6.0
7.0
8.0
1.0
2.0
3.0
4.0
5.0
6.0
7.0
8.0
Feb
11A
pr 1
1Ju
n 11
Aug
11
Oct
11
Dec
11
Feb
12A
pr 1
2Ju
n 12
Aug
12
Feb
11A
pr 1
1Ju
n 11
Aug
11
Oct
11
Dec
11
Feb
12A
pr 1
2Ju
n 12
Aug
12
Feb
11A
pr 1
1Ju
n 11
Aug
11
Oct
11
Dec
11
Feb
12A
pr 1
2Ju
n 12
Aug
12
Feb
11A
pr 1
1Ju
n 11
Aug
11
Oct
11
Dec
11
Feb
12A
pr 1
2Ju
n 12
Aug
12
Figure 7IMPACT OF EXCHANGE RATE DEPRECIATION IN AUGUST 2011
PRICE INDICES1 (annual variation)

313J. F. Cortés Espada
on which the pass-through of exchange rate movements gen-erate a significant impact.
Figure 7 shows observed inflations and the inflations simu-lated through the counterfactual exercise, as well as the con-fidence intervals around the counterfactual trajectories. The results are presented for the same price indices used in the above exercise. It can be observed that the impact on the two highest cpi aggregation levels is not significant (Figures 7a-7c). Additionally, within the core subindex it can be seen that ex-change rate effect is generated in the goods group and not in that of services (Figures 7d-7e). Finally, and as mentioned, the pass-through to goods inflation is due to the change in prices of non-food merchandise (Figures 7f-7g).
4. fInAl reMArks
In a large number of emerging economies inflation shifted from high and volatile levels to relatively stable conditions, which was accompanied by the adoption of inflation targeting schemes and abandonment of the exchange rate as nominal anchor. Thus, in line with economic theory, said economies have begun to enjoy the benefits of a free floating exchange rate regime, given that in an environment of low and stable in-flation, and the presence of credible and efficient monetary policy, the pass-through of external cost shocks to consumers declines considerably.
This paper measured the pass-through of exchange rate movements to consumer prices in Mexico and analyzed whether the behavior of said pass-through has changed in recent years. It particularly studied the case of the exchange rate deprecia-tion that occurred in the second half of 2011. A methodology that generates results consistent with the hierarchy implicit in the cpi was used for the aforementioned.
The results show that, for the period June 2001-August 2012, the coefficient of the exchange rate pass-through to headline in-flation in Mexico was low and statistically not significant. How-ever, said pass-through is found to be positive and significant

314 Monetaria, July-December, 2013
for the group of goods as a result of the pass-through to prices of non-food merchandise, explained by the fact that these groups include tradable goods the prices of which are determined in international markets. These results coincide with the fact that exchange rate movements determine a significant part of price changes only for these groups. Additionally, at the start of the 2000s, the trajectory of the exchange rate pass-through to the general level of prices shifted from positive and signifi-cant levels to values statistically not different from zero, period coinciding with the change in inflation persistence. Further-more, it is found that the depreciation of the exchange rate in 2011 did not change said trajectory.
This empirical work presents evidence on the relation be-tween the exchange rate and consumer prices in Mexico, which can provide important elements and serve as a reference frame-work in different dimensions for structural and general equi-librium models. It also provides an analysis tool that can be used in the monetary policy decision-making process.
references
Baqueiro, A., A. Díaz de León and A. Torres (2003), ¿Temor a la flotación o a la inflación? La importancia del traspaso del tipo de cambio a los precios, Working Paper, No. 2003-02, Banco de México.
Capistrán, C., R. Ibarra and M. Ramos-Francia (2012), “El traspaso de movimientos del tipo de cambio a los precios: un análisis para México,” El Trimestre Económico, Vol. 74, No. 316, pp. 813-838.
Capistrán, C., C. Constandse and M. Ramos-Francia (2010), “Multi-horizon Inflation Forecasts Using Disaggregated Data,” Economic Modelling, Elsevier, Vol. 27, No. 3, pp. 666-677.
Conesa, A. (1998), Pass-through del tipo de cambio y del salario: teoría y evidencia para la industria manufacturera en México, Working Paper, No. 9803, Banco de México.
Cortés, J., J. Murillo and M. Ramos-Francia (2012), “Evidencia de los micro datos del inpc respecto al proceso de formación de precios,” manuscript, Banco de México.
Chiquiar, D., E. A. Noriega and M. Ramos-Francia (2010), “A Time Series Approach to Test a Change in Inflation Persistence: The Mexican Experience,” Applied Economics, Vol. 42, pp. 3067-3075.

315J. F. Cortés Espada
Choudhri, E. U., H. Faruqee and D. S. Hakura (2005), “Explaining the Exchange Rate Pass-through in Different Prices,” Journal of International Economics, Vol. 65, pp. 349-374.
Gagnon, E. (2007), Price Setting during Low and High Inflation: Evidence from Mexico, International Finance Discussion Papers, No. 896, Board of Governors of the Federal Reserve System.
Garcés, D. (1999), Determinación del nivel de precios y la dinámica inflacio-naria en México, Working Paper, No. 1999-07, Banco de México.
Goldfajn, I., and S. Ribeiro da Costa (2000), The Pass-through from De-preciation to Inflation: A Panel Study, Working Ppaer Series, No. 5, Banco Central do Brasil.
González, J. A. (1998), “Regímenes comerciales y el traspaso del tipo de cambio: ¿hay un enigma mexicano?,” El Trimestre Económico, Vol. 65, pp. 49-97.
Hahn, E. (2003), Pass-through of External Shocks to Euro Area Inflation, European Central Bank Working Paper, No. 243.
Hamilton, J. D. (1994), Time Series Analysis, Princeton University Press, Princeton, 799 pages.
Hausmann, R., U. Panizza and E. Stein (2000), Why Do Countries Float the Way They Float?, Working Paper, No. 418, Research Depart-ment, Inter-American Development Bank.
Hyndman, R., R. Ahmed and G. Athanasopoulos (2007), Optimal Com-bination Forecasts for Hierarchical Time Series, Working Paper, No. 09/07, Department of Econometrics and Business Statistics, Monash University.
Kim, S., and N. Roubini (2000), “Exchange Rate Anomalies in the In-dustrial Countries: A Solution with a Structural var Approach,” Journal of Monetary Economics, Vol. 45, pp. 561-586.
Lütkepohl, H. (2006), New Introduction to Multiple Time Series Analysis, Springer, New York, 764 pages.
McCarthy, J. (2007), “Pass-through of Exchange Rates and Import Prices to Domestic Inflation in Some Industrialized Economies,” Eastern Economic Journal, Eastern Economic Association, Vol. 33, No. 4, pp. 511-537.
Peersman, G., and F. Smets (2001), The Monetary Transmission Mechanism in the Euro Area: More Evidence from var Analysis, Working Paper, No. 91, European Central Bank.
Santaella, J. (2002), “El traspaso inflacionario del tipo de cambio, la paridad del poder de compra y anexas: la experiencia mexi-cana,” Gaceta de Economía itam, La Inflación en México, Issue 2, pp. 427-464.
Sims, C. (1980), “Macroeconomics and Reality,” Econometrica, Vol. 48, pp. 1-48.

316 Monetaria, July-December, 2013
Schwartz M. J., A. Tijerina and L. Torre (2002), “Salarios, tipo de cambio y dinámica inflacionaria en México: 1995-2002,” Gaceta de Economía itam, pp. 71-101.
Stulz, J. (2007), Exchange Rate Pass-through in Switzerland: Evidence from Vector Autorregressions, Swiss National Bank Economic Studies, No. 4.
Taylor, J. (2000), “Low Inflation, Pass-through and the Pricing Power of Firms,” European Economic Review, Vol. 44.