estimating the impact of technical barriers to trade in
TRANSCRIPT

NUST JOURNAL OF SOCIAL SCIENCES AND HUMANITIES
Vol. 6 No. 2 (July-December 2020) pp. 194-218
Estimating the Impact of Technical Barriers to Trade in WTO
Regime: The Case of Pakistan
Amir Mustafa, Ihtsham Ul Haq Padda§ and Sadia Safdar‡
Abstract
Technical Barriers to Trade (TBT) forwarded by World Trade Organisation
(WTO) has obstructed world trade patterns; generally, it is conceptualized as non-tariff
barrier which impedes trade. In this study, impact of TBT on imports of Pakistan has
been estimated. This paper explores how TBT affects import of Pakistan from its trade
partner using PPML estimation method to handle zero trade flows and overdispersion
of data of Pakistan’s import, based on gravity model. The findings depict that GDP of
Pakistan and partners, exchange rate, tariff, distance, and contiguity are vital factors;
along with TBT cases initiated by Pakistan have also impacted import from WTO
members. The results suggest that Pakistan-initiated TBT and tariff have experienced
lower import volume, hence they can be used to administer its ever-increasing trade
deficit. The study also presents comparative analysis of TBT and tariff impacts on
imports from high income, upper middle, lower middle, and lower income countries as
classified by the World Bank.
Keywords: Gravity Model; Technical Barriers to Trade; PPML; Imports.
JEL Classifications: F13; F14; F41; L15
1. INTRODUCTION
Technical Barriers to Trade (TBT) is a core type of non-tariff barriers,
forwarded by WTO, and it requires all the WTO Member States to initiate
technical standards, regulations, and conformity assessments rules and
procedures. However, the members are bound not to create unnecessary barriers
and obstacles to imports specifically; rather measures should be justifiable, and
based on the scientific evidence and respective information. The TBT
agreement Article 1.3 explains that almost all the commodities shall be subject
Amir Mustafa <[email protected]> is PhD Scholar at Federal Urdu University
of Arts, Science and Technology (FUUAST), and Assistant Professor at National
University of Modern Languages, Islamabad, Pakistan. § Ihtsham Ul Haq Padda <[email protected]> is Assistant Professor at FUUAST,
Islamabad, Pakistan. ‡ Sadia Safdar <[email protected]> is Assistant Professor at FUUAST,
Islamabad, Pakistan.

195 Mustafa, Padda and Safdar to the provision of this Agreement (GATT1, 1994). The Agreement on TBT of
GATT (1994) Article 2 spotted WTO countries to confirm that technical
standards are not arranged, approved or initiated with the view or effects of
generating redundant barriers to the foreign trade. For this reason, the technical
bylaws and standards will not be trade restrictive rather they should abide by
the legitimate objectives.
The world is integrating under emerging globalisation patterns, hence
more active in initiating the TBT notifications via WTO. The TBT 24880 cases2
have been initiated by its member countries since 1995. China and EU
(European Union) have been declared the most active to initiate the cases since
1995. Committee of WTO on TBT in its 21st annual review of implementation
and operation reported that notifications decreased by 12% during the year as
per the last year (aggregate 1988 notification). However, overall pattern, led by
the developing countries, has been increasing since 2005. Developing countries
remained submitting additional notifications significantly in 2015 than the
developed countries; the number of notifications from the least developed
countries has also improved during the year. In aggregate, 86 Specific Trade
Concerns were debated in year 2015, second largest number since the inception
of WTO. A few cases were notified to the TBT Committee - 49% of the specific
trade concerns debated and had been registered below the long run average of
68% (WTO, 2016).
Typically, tariff and non-tariff barriers3 (NTBs) are levied to fetch
safeguard for the domestic market’s import-competing industrial sectors. The
tariff generates income just like taxes for the governments, whereas NTMs are
not monetary barriers that defend local economy and traders from the
international competition. As per the WTO rules, the NTBs are various official
actions obstructing foreign trade. Apart from the custom tariff, NTBs are core
policy initiatives which potentially affect import, and generate indistinct
quantitative affects. TBTs bring multiple affects through policies due to its
implicit nature.
The TBT measures obstruct import are deemed as NTBs, it could be
protectionist at the cost of exporter from other trade partners or could also be
non-protectionist, whereas in any case, it cuts off imports. TBT consists of
technical standards, lab tests, sanctions, and levies mostly expedited by the
developed world. But such NTBs can be reduced by initiating regional,
1 General Agreement on Tariffs and Trade. 2 Data source in para WTO, 2020 www.i-tip.wto.org. 3 Non-tariff measures used to restrict import are labeled as non-tariff barriers and are
considered trade restrictive measures.

Estimating the Impact of Technical Barriers 196 plurilateral, free trade agreements, and bilateral negotiations. The TBT
increases the cost of imports, hence very challenging to reduce in presence of
other conventional tariff.
Association of South East Asian Nations (ASEAN) selected following
products as priority list targeted by the TBT: products including video
apparatus, telephones, loudspeakers, inductors, motors and generators,
refrigerators, monitors and keyboards, air-conditioners, diodes, cathode ray
tubes, mounted piezo-electric crystal, switches, printed circuits, resistors,
capacitors, parts of TV and radio, and medical gloves. South Asian countries,
particularly Pakistan, has also similar list of products affected by TBT.
Multilateral trade of Pakistan with the rest of world is increasing as
globalisation is integrating the whole world. Just as the gravity model presented
by Tinbergen (1962) holds in the world largely, likewise it is determining the
trade pattern in Pakistan. Pakistan has established strong trade linkages with
EU, America, South East Asia, Gulf and Australia. Trade volume has reached
to $83.79b in 2018. Figure 1 shows the import and export of Pakistan from and
to the rest of world from 1995 to 2018 and respective trade balance (deficit).
Figure 1. Aggregate Export, Import, and Trade Deficit of Pakistan (million $)
Data source: UN Comtrade, 2020.
Pakistan’s imports are increasing in emergence of tariff and NTBs
which have often mentioned as core factors describing weak commercial
cohesion. Conversely, the preferential and regional foreign trade policies have
been expedited to implement by Pakistan after WTO’s effective ascendancy.
This research paper analyzes Pakistan’s import pattern in the wake of tariff and
NTBs under WTO regime from 1995 to 2018.
-70000
-60000
-50000
-40000
-30000
-20000
-10000
0
10000
20000
30000
Export
Import
Trade Balance

197 Mustafa, Padda and Safdar
Pakistan became member of WTO in year 1995, succeeding the GATT
and under WTO article XXIV of GATT (1994); Pakistan has signed some free
trade agreements, and joined plurilateral and multilateral agreements with
Afghanistan, China, Sri Lanka, USA, SAARC4 Malaysia, Iran, Mauritius, and
Indonesia. Apart from these agreements Pakistan is member of WTO
committees to negotiate on various contemporary issues related to foreign
trade.
Pakistan Strategic Trade Policy Framework 2015-18 has identified the
issues related to areas where Pakistan is deficient owing to low capacity. Due
to disordered standards and technologies in country, Pakistan is importing
substandard commodities. Imports are increasing day by day, hence stimulating
trade deficit ($36.5b in 2018). One of the core enablers to realize targets was to
fulfill the global standards [Ministry of Commerce, (2016)]. This study
examined the impacts of TBT on Pakistan imports. The objectives of the
research are to study import patterns and investigate empirically the application
of the Agreement on TBT initiated by Pakistan to rectify its import pattern. A
few researches have examined the impacts of the TBT initiations by Pakistan
on its imports theoretically. This research paper has addressed this pertinent
phenomenon theoretically as well as empirically with the most recent
accessible data from 1995 to 2018. The study also filled the research gap of
Pakistan’s import pattern in presence of TBT under the WTO regime. Earlier,
no study found particularly related to TBT and import in case of Pakistan, using
Poission Psuedo Maximum Likelihood (PPML) with data from 1995 to 2018.
Hence this research paper has contributed to assist policy makers, researchers,
chambers, industrialists, and other stakeholders to position TBT as a more
effective and favourable way to address trade deficit, consumer protection,
technical quality control, and other trade issues.
Does implementation of the technical regulations by Pakistan affect its
imports? In order to address this research question and the above mentioned
objectives, the research paper has been designed to analyze correlation between
the import volume and TBT regulations of Pakistan against all1 importing
partners, and also with four development groups of countries i.e. high income,
upper middle, lower middle, and lower income countries, classified by the
World Bank. The research paper is structured as follows: Section 1 explains
current prominence of WTO on TBT. It discourses various strategies to analyze
the TBT related issues in Pakistan. Section 2 presents review of relevant
literature on NTBs and TBT related to import patterns of Pakistan. Section 3
4 South Asian Association for Regional Cooperation. 5 148 countries, actively using WTO’s TBT agreement and listed on I-TIP WTO.

Estimating the Impact of Technical Barriers 198 witnesses’ various empirical strategies, and methodology; and section 4
presents the results and discussion followed by the conclusion.
2. THEORETICAL LITERATURE REVIEW
UNCTAD6 (2019) has classified the non-tariff measures into the
technical and non-technical measures, as presented in Table 1. Firstly, the
technical measures consist of standards rules of laboratory tests, product
packaging, shelf-life restriction, labeling, certification procedures, and import
testing. The non-technical measures consist of subsidies, legal measures,
bureaucratic restrictions, and intellectual property rights. The technical
measures create trade distorting affects to administer trade deals implicitly.
Earlier, Staiger (2012) divided non-tariff measures into three main categories;
first levied on imports includes import quotas, customs procedures and
administration fees, import licensing, and prohibitions, while second are
imposed on the exports including export prohibitions, export quotas, export
taxes, subsidies, and voluntary export restraints (VER). Third type of Non-tariff
measures (NTMs) is levied in the domestic markets. These NTMs comprised
of the domestic regulations and legislations covering labour, technical, internal
taxes/charges, health, commodities, environmental standards, and the home
country subsidies. The researchers highlighted the impact of TBT on import
patterns.
Various techniques and models have been used to analyse these types
of NTMs. The gravity model is relevant in emerging trade relation, first due to
its theoretical foundations, and second is due to its coverage of international
trade. In presence of these benefits of gravity model, questions arise about
proper econometric estimation techniques which will provide consistent
estimate when zero7 values are frequent in dependent variables (import of
Pakistan). This section will also discuss various estimation techniques to
address the issue.
For many decades, panel data has been used for econometric analysis
in gravity modeling [Baltagi (2008); Melitz, (2007); Rose and van Wincoop
(2001)]. Santos-Silva and Tenreyro (2006, 2011) have deployed PPML method
to address zero import values, and logarithm conversion. They reported that in
presence of the large number of zero values and logarithm transformation of
gravity model’s equation, OLS (ordinary least square) provides inconsistent
6 United Nations Conference on Trade and Development. 7 11% zero values found in the import values of Pakistan for this study.

199 Mustafa, Padda and Safdar and large bias which are eliminated as the sample size increased [Santos-Silva
and Tenreyro (2011)].
Table 1. Classification of Non-Tariff Measures by UNCTAD
Import Technical
measures
A. Sanitary & Phytosanitary Measures
B. Technical barrier to trade
C. Pre-shipment inspection & other formalities
Non-technical
measures
D. Contingent trade protective measure
E. Non-automatic import licensing, prohibitions,
quotas, quantity control measures and other
restriction not including sanitary and
phytosanitary SPS/TBT
F. Price control measure including additional tax
& charge
G. Finance measure
H. Measure affecting competition
I. Trade related investment measure
J. Distribution restriction
K. Restriction on post sale service
L. Subsidy & other form of support
M. Govt. procurement restriction
N. Intellectual property
O. Rule of origin
Export P. Export related measure
Source: UNCTAD, 2019.
Burger, et al. (2009) pointed out that the PPML model is susceptible to
because of over dispersion in the dependent variable, and larger number of zero
in it, that leads to consistent but inefficient estimates; Santos-Silva and
Tenreyro (2011) forwarded the PPML which fetched consistent coefficients,
also in the existence of over-dispersion in the explained variable (where
conditional variance is not equal to the conditional mean); large number of
zeros do not impact its existence. Soren and Bruemmer (2012) found that
PPML works efficiently in presence of over dispersion, as well as PPML is
well-behaved in bimodal distributed data. Head and Mayer (2014) claimed
Multinomial Psuedo Maximum Likelihood works in the simulation than the
PPML.

Estimating the Impact of Technical Barriers 200 2.1. Empirical Literature on Technical Barriers to Trade
TBT is used as NTB widely by the WTO member countries. Trade
liberalization promotes significantly by reducing the trade barriers that include
tariff and TBT measures in goods and services. NTBs are mostly trade
restrictive similar to applied tariff. TBT has amplifying trade effect on the
technologically advanced sector while it has a negative effect on the
agricultural sector [World Trade Report (2012)]. It was empirically measured
by Alaeibakhsh and Ardakani (2012) who quantified trade impact of the
technical regulations on export and reported a negative impact in case of Europe
Union members. But Bao and Qiu (2012) reported that TBT affect depends on
any countries’ economic development. A developed country TBT notification
decreases probability to export by the developing countries, however, it
increases their export volume. Bao and Qiu also ascertained that TBT affects
export of developing countries, but insignificantly impacts export of developed
countries; while Essaji (2008) revealed the same opinion about the technical
regulations initiated by the developed and developing countries. Earlier, Bao
and Qiu (2010) found that China has compromised its imports by initiating
TBT.
Siyakiya (2017) views that research, infrastructural development, and
human capital can be involved to improve TBT standards. It can bring positive
effects on trade since standards ensure customer products safety. Complying
with the foreign standards is costly, while it may increase market share of the
exporters. TBT has developed by the importing countries, negatively affects
exports. The most of TBT initiations are related to the human and plants
protection, whereas it is mandatory for the country to follow rest of countries’
standards. Otsuki, et al. (1999) and Wilson and Otsuki (2004) highlighted the
need for implementing TBT in the form of standard to develop the markets, and
assisting transactions, as they may enhance the requirements for the goods. In
spite of all this, the developing countries are affected the worse because of
compliance hitches. Several other studies found a negative relation between
import and TBT under WTO regime including Devadason and Govindaraju
(2016), Keiichiro, et al., 2015), Da Silva-Glasgow and Hosein (2018), and
Sanjuan, et al. (2017). TBT has trade distorting impacts, found by Kapuya
(2015), Otsuki, et al. (2000), and Moenius (2004).
Technical standards such as TBT regulations have emerged
indispensible to WTO members. A unique set of standards and regulations
based on the possible risk assessments, non-discriminatory between the WTO
members with the homogenous circumstances are permitted by the WTO on
TBT measures. Hence, it is growing consumers, clients, and public concerns

201 Mustafa, Padda and Safdar related to the technical and scientific challenges that motivate the officials to
improve safety and quality of imported products by the TBT [Peterson, et al.
(2013)]. The effect of TBT on import patterns is important and probed by
several research scholarships, i.e., Minten, et al. (2009), Maertens and Swinnen
(2009), and Disdier and Tongeren (2010); whereas, there is dearth of empirical
study on impacts of TBT on the imports in case of Pakistan.
In Pakistan, NTBs are abrupt policy tools and it appears grim to extend
focused protection to strategic industry through NTBs. The country’s technical
standard requirements are concentrated on manufactured goods and machinery.
Ministry of Commerce collaborates with some other standardization
institutions for development, testing assessments, and monitoring of TBT, the
institutions include Pakistan Standards and Quality Control Authority, Ministry
of Health, Social Welfare and Population Planning. The institutions advise to
the Government, chambers of commerce, industries, and other stakeholders on
technical standards and policies to implement TBT. These institutions are focal
points for national as well as foreign institutions such as Codex Alimentarius,
International Electro Technical Commission, ISO, and PSQCA8 which is
National Enquiry Point to deal TBT officially by Pakistan under the TBT
agreement. Domestic manufacturers also assist PSQCA and Pakistan National
Accreditation Council (PNAC) with consultation of Ministries to develop and
register technical standards to ensure adoption and response to TBT rules.
WTO has already defended its TBT regulations in GATT (1995)
Articles 3, 11, and 20 provisions for the technical regulations and standards.
GATT clarifies and permits for an anticipated trading scope. The WTO member
countries are motivated to link their technical standards with the global
standards, and also do not exploit such rights by launching rigorous measures.
Table 2 shows national enquiry points of WTO’s members and
observers which deal with TBT rules and regulations and are focal points to
deal the TBT among member states. The focal points are responsible to keep
WTO updated regarding any advancements in the respective countries.
Pakistan is required to establish strong co-operation with other members to get
benefit from them on technical standards, relevant skills, and requisite
machinery.
8 International Standards Organisations and Pakistan Standards and Quality Control
Authority.

Estimating the Impact of Technical Barriers 202
Table 2. National Enquiry Points for TBT
National Institute of Standards and
Technology, USA
British Standards Institution, United
Kingdom
Saudi Arabia Standards Organization Normattiva - Il portale della legge
vigente, Italy
National Accreditation Body, Germany Centre d'Information sur les Norme et
Règlements Technique, France
Technical Barriers and Regulations
Division, Canada
Technical Information and Consultancy
Section Standards Department, Malaysia
International Inspection and Quarantine
Standard and Technical Regulations,
China
Russian Scientific & Technical Centre
for Information on Standardization,
Metrology & Conformity Assessments
Japan TBT Enquiry Point International
Trade Division
Department of Foreign Affairs and
Trade, Australia
Source: TBT Information Management System WTO, 2020.
The effects of TBT and technical regulations on import pattern are vital
and the importance of TBT using PPML has been emphasized by various
researchers as discussed in this section. However, there is a noticeable
empirical research gap related to the impact of TBT on imports of Pakistan from
rest of the world since the establishment of WTO. There also remains a scope
to introduce a refined PPML approach to estimate TBT effects on imports of
Pakistan. Similarly, analysis of TBT impacts on import of Pakistan from
selected four income groups are also almost lacking.
3. DATA AND METHODOLOGY
3.1. Variables and Data Description
In this research, secondary data of pertinent sources is used. Import
data (aggregate nominal annual) are retrieved from United Nation Commodity
Trade Statistic Database, Department of Economic and Social Affair. GDP data
(aggregate nominal annual) are obtained from World Development Indicators,
database of the World Bank. Data on distance between the capitals of Pakistan
(importer) and trading partners (exporters) are collected from Institute for
Research on the International Economy (CEPII). Import tariff9 rates (applied,
weighted mean, all products %) are taken from WITS (World Integrated Trade
9 Effectively Applied Weighted Average (%) tariff; the average of tariffs weighted by
their corresponding trade value (WITS – UNCTAD TRAINS, World Bank, 2020).

203 Mustafa, Padda and Safdar Solutions), World Bank. TBT (one case means one standard) data are collected
from Integrated Trade Intelligence Portal (I-TIP) WTO.
Pakistan population is over 212.2 million, 5th largest in world, and
economy is 42nd largest (nominal GDP), in the world. Pakistan’s imports are
consistently increasing from the rest of the world; hence the country has to levy
tariff and NTBs to administer import for the ever increasing trade deficit.
Pakistan imports oil, textile machinery, edible oil, chemicals, iron/steel,
vehicles and others worth $60 billion in 2018 (export $23.6 billion) from the
rest of the world. The import details are given in Table 3.
Table 3. Major Import Markets of Pakistan (US$ billion)
Country Import % share
China 14.54 24.18
United Arab Emirates 8.67 14.41
Saudi Arabia 3.24 5.39
USA 2.95 4.90
Indonesia 2.50 4.16
Japan 2.27 3.78
India 1.93 3.21
Kuwait 1.41 2.34
Germany 1.30 2.16
Malaysia 1.16 1.93
Others 20.19 33.56
World 60.16 100
Data source: UN Comtrade, 2020.
Pakistan has initiated 108 TBT cases during 1995 to 2018. TBT are
mostly enforced on machinery, manufactured and non-agriculture products
imported from rest of the world. The Ministry of Commerce and Ministry of
Science and Technology are nodal responsible organizations to develop,
initiate, and implement TBT; and also bound to report to WTO. TBT are
initiated for the country to protect manufactured goods, e.g., electronic
products, computers, machinery etc. Pakistan initiated TBT which ultimately
raise the costs of foreign competitors, require product certifications, process
hurdles, and sometimes delays in import in the country. Gauging the impacts
of the TBT is mostly challenging to measure and not easy to quantify on
imports, e.g., calculation of the duplicate health certificates, technical lab
examinations, extra licensing requirements, and distribution restrictions.
Government can lessen tariff rates straightforwardly, but administering TBT

Estimating the Impact of Technical Barriers 204 requires technical capacity, consultation, and envelopment of various ministries
and stakeholders. Some certain variables determining import and used for
estimating the model are presented in Table 4.
Table 4. Description of Variables Deployed in Model
Variable Description Proxied for Data Source
Import (M) Import value (dependent
variable)
Import of Pakistan UNComtrade
TBT (tbt) Natural logarithm of
Technical Barrier to Trade
Measure of
restrictiveness
I-TIP WTO
GDPi (gdpit) Natural log of Pakistan
GDP current US dollars as
a reporter country
Size of economy
& demand side
effect
WDI
GDPj (gdpjt) Natural log of Partner
countries’ GDP current
US dollars
Trading capacity WDI
Exchange rate
(erate)
Official exchange rate
(Local Currency Unit
LCU per US$ period
average)
Competitiveness WDI World
Bank
Tariff rate (tar) Effectively Applied
Weighted Average %
Measure of
restrictiveness
WITS World
Bank
Distance (dist) Natural log of distance in
km between capitals of
Pakistan and partner
country’s capital cities
Transportation and
logistics cost
CEPII
Contiguity
(contig)
Dummy equal to unity if
two countries share a
common border
Information cost CEPII
Source: Authors’ compilation, 2020.
3.2. The Gravity Model Approach
The gravity model was introduced by Ravenstein (1885), chiefly, to
study the migration pattern in the UK. Then, the model was formally discussed
by Tinbergen (1962) to examine the bilateral trade. Trade between both
importer and exporter proxy by respective income, mostly narrated by GDPs,
and distance between partner countries was also incorporated.
Two key contributions added into the literature of gravity, first by
Anderson and van Wincoop in 2003 and 2004 on incorporating multilateral
resistance trade cost; and second related to firm heterogeneous behaviour.
Melitz (2003) and Bernard, et al. (2003) also reported about firm heterogeneity

205 Mustafa, Padda and Safdar which means that not all the firms import in any countries, but a few of them
participate in foreign trade. The reason is fixed costs which are market specific
and quite higher in import, against the domestic trade. Consequently, the import
flows will have zero entries. Standard gravity literature ignores prevalence of
zero import, whereas Helpman, Melitz and Rubinstein (2008); Chen and Novy
(2011); and Melitz and Ottaviano (2008) introduced gravity model with
theoretical interpretation. Metlitz (2003) first presented trade model with firm
heterogeneity. This research paper therefore considers appropriate estimation
technique, because injudicious estimation approaches can bring biased results.
Gravity approach is applied to quantify the effect of TBT on Pakistan’s
import during WTO regime. This is one of the standard approaches of the
gravity estimation, with the coefficient estimated used subsequently for TBT
for importing country. This analysis will contribute to the gravity literature with
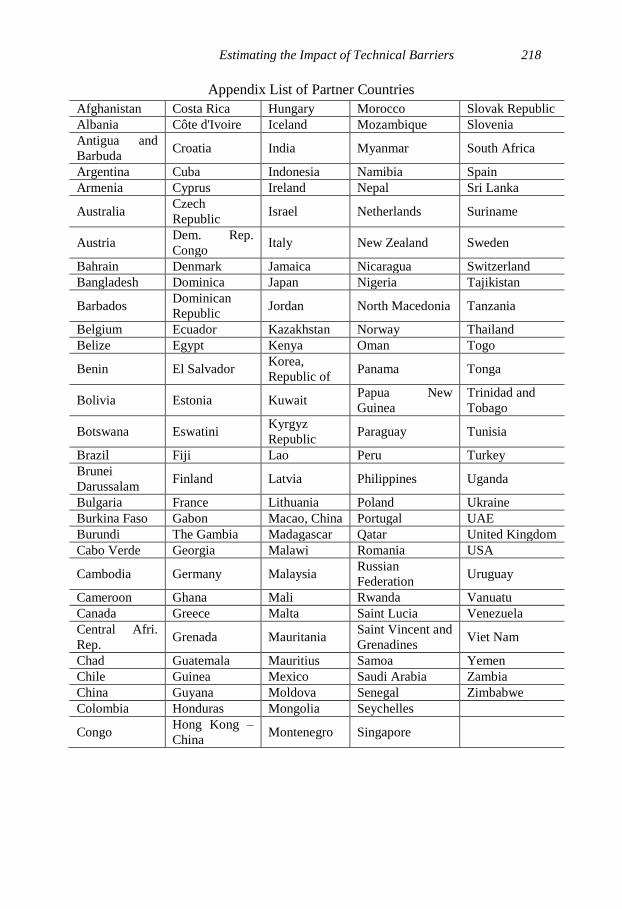
the applications of the TBT data by the WTO. Moreover, bilateral impact of
TBT is considered by taking into account import of Pakistan from selected
partner countries (cited in Appendix). Moreover, difference between SPS and
TBT measures are also made; both quality and standards related measures, but
Pakistan has initiated only TBT cases, whereas no SPS case has been initiated
and submitted to the WTO. This allows attaining insight into distinct impacts
of the TBT measure, that tends to have straight forward purpose of
accomplishing government policy targets, e.g., technical labeling, maximum
residue level etc.
Gravity model is used to examine import and exports and further
impacts of the safety regulation and technical standard. After Tinbergen (1962)
the model was revamped by Linneman (1966) to analyze various trade patterns
in the absence of biased trade impediment. This model is based on the world
famous Newton’s gravity law. It dominates with three core explanatory
variables consist of GDP of importing country (Pakistan), GDP of the exporting
country (Partner countries) and transportation cost (distance between capitals
of Pakistan i and Partners j). They used countries’ GDP as market size for
measuring potential demand and supply of trading partners [Hossain (2009)].
The elementary theoretical gravity model for trade between the countries is
formulated as:
Tij = G × YiYj
Dij
The trade equation above shows the trade flows from a country i to
partner country j, denoted by Tij, that is proportional to product of partner
countries’ GDPs (Yi and Yj) and inversely proportional to their distance Dij. For
Estimating the Impact of Technical Barriers 206 convenience in estimation process, the model is converted in a log form
(equation 1.1). Thus, the standards gravity model for import becomes:
ln𝑀𝑖𝑗𝑡 = 𝜍0 + 𝜍1𝑡𝑎𝑟𝑖𝑗𝑡 + 𝜍2ln𝑡𝑏𝑡𝑖𝑗𝑡 + 𝜍3ln𝑔𝑑𝑝𝑖𝑡 + 𝜍4ln𝑔𝑑𝑝𝑗𝑡 + 𝜍5ln𝑑𝑖𝑠𝑡𝑖𝑗 +
𝜍6𝑐𝑜𝑛𝑡𝑖𝑔𝑖𝑗 + 𝜍7𝑒𝑟𝑎𝑡𝑒𝑖𝑗𝑡 + 𝜇𝑖𝑗𝑡 … (1.1)
Along with tariff, GDP, distance, contiguity, and exchange rate, M is
assumed trade flow between Pakistan and rest of certain partner countries; 0
is a constant term and ijt is error term. Equation 1.1 carries the variables as
elucidated in Table 4. While main variable TBT is explained as bilateral cases
initiated against specific country or specific group of countries. The aggregate
TBT standards in each year can be measured by the following formula:
𝑡𝑏𝑡𝑖𝑗𝑡 = ∑ 𝑡𝑏𝑡𝑖𝑗𝑡 +
148
𝑖=0
∑ 𝑡𝑏𝑡𝑖𝑗𝑡
𝑏
𝑖=0
TBTijt represents the number of TBT measures/cases initiated. On right
side, first notation shows TBT cases initiated against all 148 countries; in
addition to all countries, the country i may initiate case against any 1 or more j
countries (not against all j =148 countries) bilaterally.
PPML is used to estimate the gravity model; the estimator also deals
with the zero values in the import flow. Furthermore, unlike Poisson approach,
the PPML does not need Poisson type data– does not require the explained
variable to be an integer. The PPML also permits identifying effect of the
challenges of time invariant factor; it is an imperative feature for the
examination, since the study aims to test dummy variable effects and a time
invariant variable distance. By deploying Poisson estimator for the fixed effect,
unlike PPML, time-invariant regressors will not be dropped, but also various
pairs of never trading partners from sample [Kareem, et al. (2016); and Santos-
Silva and Tenreyro (2006, 2011)].
PPML estimators are used in this study in order to include the entire
import information: bilateral zero import value, and ignore inconsistent
estimate derived from logarithmic linear approach [Silva and Tenreyro (2006)].
PPML estimation procedure transforms the gravity model (equation 1.1) into
following form:
Poisson: E(y|x) = E(Mijt|x) = exp (x´ ) =

207 Mustafa, Padda and Safdar
exp(𝜍0 + 𝜍1𝑡𝑎𝑟𝑖𝑗𝑡 + 𝜍2𝑡𝑏𝑡𝑖𝑗𝑡 + 𝜍3𝑔𝑑𝑝𝑖𝑡 + 𝜍4𝑔𝑑𝑝𝑗𝑡 + 𝜍5𝑑𝑖𝑠𝑡𝑖𝑗𝑡 +
𝜍6𝑐𝑜𝑛𝑡𝑖𝑔𝑖𝑗𝑡 + 𝜍7𝑒𝑟𝑎𝑡𝑒𝑖𝑗𝑡) + 𝜇𝑖𝑗𝑡 … (1.2)
where E(y|x) (expected values) is the mean of the explained variable y (import
between Pakistan and partners Mijt) conditional on explanatory variable x and
are coefficients to estimate. Sub-index i and j refers to importer country
Pakistan and partner countries (j=1…148) respectively, whereas t quoted as
years (t = 1995, 1996, 1997, …, 2018).
The TBT measures of any country come into force followed by its
initiations, but studies provide evidence of immediate impacts of TBT after
initiations of cases. Dataset of I-TIP of WTO includes TBT measures. TBT
measures are initiated and applied by each country against a selected or all
countries of WTO members.
4. EMPIRICAL RESULTS AND DISCUSSION
This section presents the estimation results and data statistics
calculated with the import of Pakistan from partner 148 countries which are
using TBT under the WTO’s uniformed rules. SPS is dropped from the
estimation and data process at the initial stage since Pakistan didn’t initiate any
SPS case. The data descriptive statistics of the explained and explanatory
variables are presented in Table 5. Comparing the number of import values
(3168) and other six variables’ values (3552), it is observed that 384 (10.81%)
values of import are missing, which postulated that Pakistan does not import
from all members during the given period i.e. 1995 to 2018.
Figure 2 shows that frequency distribution of import values strongly
deviates from normal distribution. The Kurtosis and skewness test of normality
(very low p values), Shapiro-Wilk W test, and Shapiro-Francia W’ test to check
the normality of data were applied (see Table 6). All the three tests confirmed
non-normally distributed data; a pre-requisite of PPML.

Estimating the Impact of Technical Barriers 208
Table 5. Descriptive Statistics of Model Variables – Pakistan 1995-2018
Variable Unit Obs Mean Std. Dev. Min Max
Import current US$ 3168 2.13e+08 8.14e+08 5 1.54e+10
Tariff weighted average 1935 9.728 6.572 0 96.05
TBT Value 3552 4.5 8.171 0 25
GDPi current US$ billion 3552 154.434 84.887 60.64 312.57
GDPj current US$ billion 3481 3.434 2.306 -1.71 9.93
Distance 000km 3552 7.445 4.156 0.37 16.69
Contiguity Dummy 3552 0.020 0.141 0 1
Exchange rate LCU per US$, average 3552 72.075 24.826 31.64 121.82
Source: Authors’ calculations.
Figure 2. Distribution of Trade Value (US$)
Data source: UN Comtrade, 2020.
Table 6. Skewness and Kurtosis Tests of Normality
Variable Obs Pr (Skewness) Pr (Kurtosis)
Import 3,168 0.000 0.000
Shapiro-Wilk W test of normal data
Variable Obs W V z Prob > z
Import 3,168 0.258 1335.823 18.607 0.000
Shapiro-Francia W’ test of normal data
Variable Obs W’ V’ z Prob > z
Import 3,168 0.256 1424.148 17.887 0.000
Source: Authors’ calculations.
0
1000
2000
3000
Freq
uenc
y
0 5.0e+09 1.0e+10 1.5e+10import value
Pakistan Import Values

209 Mustafa, Padda and Safdar 4.1. Estimation Results and Discussion
In this part of the paper, PPML estimation results for gravity model and
respective robust standard error are discussed in Table 7. Results are presented
into five groups; first column shows results when Pakistan imported from all
148 partners, second column shows import from high income, third upper
middle, fourth lower middle countries while the last column carries results of
lower income countries. The partner member countries are bifurcated into four
groups as per classification given by the World Bank.
Table 7. Coefficient Estimation Results of Gravity Model with PPML Method
Import All
Countries
High
Income
Upper
Middle
Income
Lower
Middle
Income
Lower
Income
Tariff -0.015
(0.021)
0.002
(0.032)
-0.044*
(0.017)
0.053
(0.055)
-0.186*
(0.045)
TBT -0.020**
(0.010)
-0.031*
(0.009)
0.006*
(0.006)
-0.056*
(0.015)
0.044**
(0.018)
GDPi 0.716*
(0.175)
0.674*
(0.244)
0.914**
(0.456)
0.660*
(0.393)
1.226**
(0.505)
GDPj 0.966*
(0.122)
0.862*
(0.188)
1.062*
(0.253)
0.236
(0.345)
0.503****
(0.328)
Distance -1.766**
(0.227)
-2.16*
(0.242)
-1.660*
(0.531)
-1.694****
(1.084)
-0.887*
(0.185)
Contiguity -0.486***
(0.588)
- - - -
Exchange
Rate
-0.830*
(0.210)
-0.707*
(0.265)
-1.277*
(0.356)
-0.784*
(0.211)
-0.915
(0.902)
Number of
observations
3107 1186 827 724 411
Number of
groups
143 53 42 33 19
Robust standard errors are shown in parentheses
Note: *, **, ***, **** witness significance at α= 1%, 5%, 10%, 15%, respectively
Source: Authors’ calculation, 2020.
With respect to the PPML and RE (random effect) import model of all
partner countries included; the coefficient on importer’s GDP is believed
generally positive. The result is supportive; elasticity of the estimated GDP of
Pakistan is statistically highly significant, and equal to around 0.716%. The
result supports that large size of Pakistan economy and demand side effects the
import positively. The estimated result shows that increase of 1% in Pakistan

Estimating the Impact of Technical Barriers 210 GDP leads to increase in the country’s import by 0.716%. This result is in line
with several researchers, such as Hermawan (2019), Kareem, et at. (2016),
Thuong (2017), and Santos-Silva and Tenreyro (2006). Similar coefficients
pattern prevails in the rest of four models of high, upper middle, lower middle,
and lower income countries, as shown in Table 7. Policy makers need to adopt
a balanced approach between GDP and import to escape from ever increasing
trade deficit.
Similarly, increase in GDP of partner countries (148 partner countries)
by 1% would increase import by 0.966%, assuming ceteris paribus. The partner
country’s GDP is considered as proxy of trading capacity. The result is also in
line with many yester research studies including Chen, et al. (2018), Ronen
(2017), Kaur and Parmjit (2011), and Devadason and Govindaraju (2016).
Diverse groups of partner countries’ GDP brought expected results; all four
coefficients are positive but with different significant levels. This confirms that
diversity in World Bank’s group classification (based on GDP) affects the
imports of Pakistan at respective levels. Hence imports from diverse groups can
be administered respectively while imposing TBT. A more concentrated effort
is required multilaterlly for each country group, and bilaterally for each major
importing partner.
Introducing a variable for transportation and logistics cost, PPML
estimate reveals that bilateral distance affects the probability of Pakistan
import, which would be derived from logistic based zero inflation equation. It
is worth mentioning that the bilateral distance increases likelihood of zeros in
import values. If consensual distance between Pakistan and its trading partners
increased by 1% the import would decline by 1.766%. It is explained as farther
the distance the larger is the cost of transportation. In general, this result is in
line with the research results derived by Fontagne, et al. (2016), Dong and Zhu
(2015), Siyakiya (2017), and Hermawan (2019). The same pattern (coefficient
signs) prevails in the rest of the four classified groups, but with different
significant levels, as shown in Table 7. Globalisation has defused distance as a
hurdle in the multilateral trading system; hence policy makers can float liberal
economic policies to avoid this hurdle in the import as well as export.
Next variable exchange rate is proxy of competitiveness of Pakistan
trade; it depicts negative sign with significance, an increase of 1% in exchange
rate would decrease import by 0.83%. The exchange rate variable is
indispensible for a country like Pakistan for determining import pattern. The
same pattern of coefficient signs prevails in rest of the four groups, i.e., high,
upper middle, lower middle, and lower income countries. Monetary authorities
should monitor exchange rate to rectify import flows and to defuse trade deficit.
211 Mustafa, Padda and Safdar
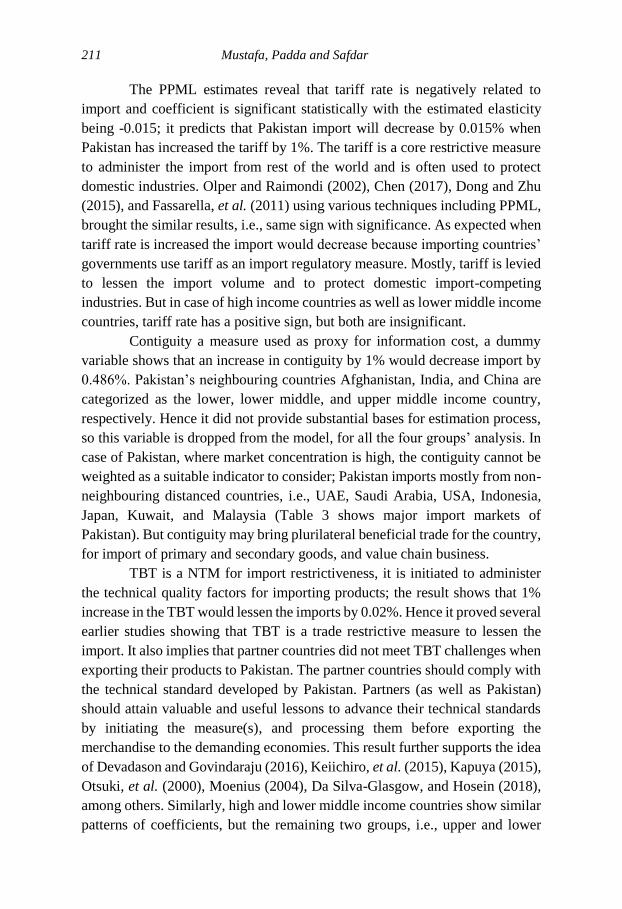
The PPML estimates reveal that tariff rate is negatively related to
import and coefficient is significant statistically with the estimated elasticity
being -0.015; it predicts that Pakistan import will decrease by 0.015% when
Pakistan has increased the tariff by 1%. The tariff is a core restrictive measure
to administer the import from rest of the world and is often used to protect
domestic industries. Olper and Raimondi (2002), Chen (2017), Dong and Zhu
(2015), and Fassarella, et al. (2011) using various techniques including PPML,
brought the similar results, i.e., same sign with significance. As expected when
tariff rate is increased the import would decrease because importing countries’
governments use tariff as an import regulatory measure. Mostly, tariff is levied
to lessen the import volume and to protect domestic import-competing
industries. But in case of high income countries as well as lower middle income
countries, tariff rate has a positive sign, but both are insignificant.
Contiguity a measure used as proxy for information cost, a dummy
variable shows that an increase in contiguity by 1% would decrease import by
0.486%. Pakistan’s neighbouring countries Afghanistan, India, and China are
categorized as the lower, lower middle, and upper middle income country,
respectively. Hence it did not provide substantial bases for estimation process,
so this variable is dropped from the model, for all the four groups’ analysis. In
case of Pakistan, where market concentration is high, the contiguity cannot be
weighted as a suitable indicator to consider; Pakistan imports mostly from non-
neighbouring distanced countries, i.e., UAE, Saudi Arabia, USA, Indonesia,
Japan, Kuwait, and Malaysia (Table 3 shows major import markets of
Pakistan). But contiguity may bring plurilateral beneficial trade for the country,
for import of primary and secondary goods, and value chain business.
TBT is a NTM for import restrictiveness, it is initiated to administer
the technical quality factors for importing products; the result shows that 1%
increase in the TBT would lessen the imports by 0.02%. Hence it proved several
earlier studies showing that TBT is a trade restrictive measure to lessen the
import. It also implies that partner countries did not meet TBT challenges when
exporting their products to Pakistan. The partner countries should comply with
the technical standard developed by Pakistan. Partners (as well as Pakistan)
should attain valuable and useful lessons to advance their technical standards
by initiating the measure(s), and processing them before exporting the
merchandise to the demanding economies. This result further supports the idea
of Devadason and Govindaraju (2016), Keiichiro, et al. (2015), Kapuya (2015),
Otsuki, et al. (2000), Moenius (2004), Da Silva-Glasgow, and Hosein (2018),
among others. Similarly, high and lower middle income countries show similar
patterns of coefficients, but the remaining two groups, i.e., upper and lower

Estimating the Impact of Technical Barriers 212 income countries, show opposite signs. Policy makers in Pakistan should
rationalize and initiate more TBT (and SPS too) to lessen trade deficit and
promote consumer protection. The country also requires capacity building of
government machinery to initiate TBT in technical and in a favourable manner.
So far, Pakistan has not initiated any cases bilaterally which means less working
on imported commodities for domestic taste and technical requirements.
The overall results cited in Table 7 also suggest that all countries and
high income countries groups pose similar pattern of variables, except tariff
rates levied by Pakistan that has positive but insignificant coefficient. This
implies that although tariff rates were raised against high income countries but
import increased; Thuong (2017) also found a similar result. This may be on
account of Pakistan importing oil, textile machinery, vehicles and chemicals
from high income countries. Pakistan has to import them from high income
countries only because these import merchandises are not obtainable from other
income groups and the same products are necessary inputs for most of the
domestic industries. In the same group, TBT has been, against tariff, proved
more effective to lessen the imports (with highly significant and negative sign).
In this sphere, policy makers may initiate more TBT for controlling the imports.
5. CONCLUSION
The objectives of research paper are to evaluate effects of the TBT on
import of Pakistan from 148 NTBs user countries under WTO regime. Pakistan
has initiated many TBT cases in multilateral trade; but neither bilateral TBT
nor SPS cases were initiated during 1995 to 2018. The empirical regression
findings indicate that the country initiating the TBT measures has a negative
impact on import volume during the analysis period. Thus, there is room for
lessening the imports (for addressing trade deficits) further when promoting the
NTMs. The findings show that increasing the tariff rate by Pakistan can lessen
its import significantly. This is also deduced that during the study period TBT
(0.02%) is more effective than tariff rate (0.015%). TBT is most effective
against lower middle income economies, followed by lower income group,
while least effective in case of the upper middle income trade partners. Tariff
has been proved most effective to decrease imports from lower income
countries.
The research also shows that increase in GDPs of both Pakistan and
partner countries have promising impact on import of Pakistan; while increase
in distance, exchange rate, and contiguity have lessened imports of Pakistan.
Partner countries as well as Pakistan should obtain valuable lessons from each
other to improve technical standards by introducing measures and processing

213 Mustafa, Padda and Safdar prior to export their merchandise. Policy makers should adopt a balanced
approach for increasing imports and GDP to reduce trade deficit. Exchange rate
also affects imports, so policy makers should also monitor exchange rate to
rationalize import pattern. Moreover, they should initiate more TBT cases to
address trade deficit and consumer protection. In the study, research was
limited to all WTO member states (initiating or facing TBTs), and four World
Bank classified groups. However, future researchers may analyze the impact of
TBT on leading manufactured products’ import from developing, or developed
countries, or individual major import market.
REFERENCES
Alaeibakhsh, S. and Z. Ardakani (2012) Quantifying The Trade Effects of SPS
and TBT Agreements On Export of Pistachios from Iran. World
Applied Sciences Journal, 16(5): 637-641.
Anderson, J. E. and E. Van Wincoop (2003) Gravity with Gravitas: A Solution
to the Border Puzzle. American Economic Review, 93, 170–192.
Anderson, J. E. and E. Van Wincoop (2004) Trade Costs. Journal of Economic
Literature, 42(3): 691-751.
Baltagi, B. H. (2008) Econometric Analysis of Panel Data. 4th edition, John
Wiley & Sons.
Bao, X. and L. D. Qiu (2010) Do Technical Barriers to Trade Promote or
Restrict Trade? Evidence from China. Asia-Pacific Journal of
Accounting & Economics, 17(3): 253-278.
Bao, X. and L. D. Qiu (2012) How Do Technical Barriers to Trade Influence
Trade? Review of International Economics, 20(4): 691-706.
Bernard, B., J. Jonathan, J. Bradford and K. Samuel (2003) Plants and
Productivity in International Trade. American Economic Review, 93,
1268-1290.
Burger M., F. van Oort and G. Linders (2009) On the Specification of the
Gravity Model of Trade: Zeros, Excess Zeros and Zero-Inflated
Estimation. Spatial Economic Analysis, 4(2): 167-90.
Chen, N. and D. Novy (2011) Gravity, Trade Integration and Heterogeneity
Across Industries. Journal of International Economics, 85(2): 206-221.
Chen, R., V. Hartarska and N. L. Wilson (2018) The Causal Impact of HACCP
on Seafood Imports in the US: An Application of Difference-In-
Differences Within the Gravity Model. Food Policy, 79, 166-178.

Estimating the Impact of Technical Barriers 214 Chen, R. and N. L. Wilson (2017) Virtual Water Trade: Do Bilateral Tariffs
Matter? Agricultural amd Applied Economics Association Annual
Meeting, Chicago, Illinois, July 30-August 1.
Da Silva-Glasgow, D. and R. Hosein (2018) Do SPS and TBT Regulations
Inhibit Guyana's Food and Agriculture Exports to CARICOM markets?
Social and Economic Studies, 67(2/3): 133-323.
Devadason, E. S. and V. Govindaraju (2016) Food Safety Legislation in
Malaysia: Implications for Imports and Harmonization of Regulations
in Southeast Asia. Available at SSRN: https://ssrn.com/abstract=2830
353 or http://dx.doi.org/10.2139/ssrn.2830353.
Disdier, A. C. and F. Van Tongeren (2010) Non-tariff Measures in Agri-Food
Trade: What Do the Data Tell Us? Evidence from A Cluster Analysis
on OECD Imports. Applied Economic Perspectives and Policy, 32(3):
436-455.
Dong, Y. and Y. Zhu (2015) Impact of SPS Measures Imposed by Developed
Countries on China’s Tea Export-A Perspective of Differences in
Standards. Applied Economics and Finance, 2(4): 160-169.
Essaji, A. (2008) Technical Regulations and Specialization in International
Trade. Journal of International Economics, 76(2): 166-176.
Fassarella, L. M., M. J. P. D. Souza and H. L. Burnquist (2011) Impact of
Sanitary and Technical Measures On Brazilian Exports of Poultry
Meat, Agricultural & Applied Economics Association’s 2011 AAEA
& NAREA Joint Annual Meeting, Pennsylvania.
Fontagné, L., C. Mitaritonna and J. Signoret (2016) Estimated Tariff
Equivalents of Services NTMs. U.S. International Trade Commission.
GATT (1994) Agreement on Technical Barrier to Trade. General Agreement
on Tariff and Trade. Switzerland: World Trade Organization.
Helpman, E., M. Melitz and Y. Rubinstein (2008) Estimating Trade Flows:
Trading Partners and Trading Volumes. Quarterly Journal of
Economics, 73, 441–486.
Herman, P. and L. Ahmed (2018) Do Canadian Wheat Grades Weight Down
Trade? A Gravity Analysis. U.S. International Trade Commission.
Hermawan, I. (2019) Measuring ASEAN Rice Non-Tariff Measures (NTMS)
and its Impact On Indonesian food (rice) Security. 3rd International
Conference on Accounting, Management and Economics 2018
(ICAME 2018), Atlantis Press.

215 Mustafa, Padda and Safdar Hossain, S. M. (2009) South Asian Free Trade Area: Implications for
Bangladesh. Munich Personal RePEc Archive.
Kapuya, T. (2015) The Trade Effects of Technical Barriers on South Africa's
Orange Exports. Agrekon, 54(1): 1-27.
Kareem, F. O., I. Martinez-Zarzoso and B. Brümmer (2016) Fitting the Gravity
Model When Zero Trade Flows Are Frequent: A Comparison of
Estimation Techniques Using Africa's trade data, Global Food
Discussion Paper, Germany.
Kaur, S. and P. Nanda (2011) An Analysis of Actual and Potential Exports of
Pakistan with SAARC Countries: A Panel Data Analysis. Pakistan
Journal of Applied Economics, 21, 69-91.
Keiichiro, H., T. Otsuki and J. S. Wilson (2015) Food Safety Standards and
International Trade: The Impact On Developing Countries’ Export
Performance. In Food Safety, Market Organization, Trade and
Development, 151-166. Springer, Cham.
Linnemann, H. (1966) An Econometric Study of International Trade Flows, 42.
North-Holland Pub. Co.
Maertens, M. and J. F. Swinnen (2009) Trade, Standards, And Poverty:
Evidence from Senegal. World Development, 37(1): 161-178.
Melitz, M. (2007) North, South and Distance in The Gravity Equation.
European Economics Review, 51, 971-991.
Melitz, M. J. (2003) The Impact of Trade On Intra-Industry Reallocations and
Aggregate Industry Productivity. Econometrica, 71, 1695-1725.
Melitz, M. and G. Ottaviano (2008) Market Size, Trade, And Productivity.
Review of Economic Studies, 75(1): 295-316.
Ministry of Commerce (2016) Strategic Trade Policy Framework 2015-18.
Pakistan: Government of Pakistan.
Minten, B., L. Randrianarison and J. F. Swinnen (2009) Global Retail Chains
and Poor Farmers: Evidence from Madagascar. World Development,
37(11): 1728-1741.
Moenius, J. (2004) Information Versus Product Adaptation: The Role of
Standards in Trade. Available at SSRN:
https://ssrn.com/abstract=608022 or http://dx.doi.org/10.2139/ssrn.60
8022.
Olper, A. and V. Raimondi (2002) Elasticity of Trade Flow to Trade Barriers:
A Comparison Among Emerging Estimation Techniques, 12th
Congress of the European Association of Agricultural Economists –
EAAE 2008.

Estimating the Impact of Technical Barriers 216 Otsuki, T., K. E. Maskus and J. S. Wilson (1999) Quantifying the Impact of
Technical Barriers to Trade: A Framework for Analysis. World Bank
Policy Research Working Paper, 2512.
Ravenstein, E. G. (1889) The laws of migration. Journal of the Royal Statistical
Society, 52(2): 241-305.
Ronen, E. (2017) The Trade-Enhancing Effects of Non-Tariff Measures On
Virgin Olive Oil. International Journal of Food and Agricultural
Economics, 5(3): 9-26.
Rose, J. and E. Van Wincoop (2001) National Money as A Barrier to
International Trade: The Real Case for Currency Union. American
Economic Review: Papers and Proceedings, 91(2): 386–390.
Sanjuan, A. I., M. L. Rau, D. Oudendag and M. Himics (2017) Analysing EU
Dairy Exports: Indicators of Non-Tariff Measures and Gravity, XV
EAAE Congress, “Towards Sustainable Agri-food Systems: Balancing
Between Markets and Society” Italy.
Santos Silva, J. M. C. and S. Tenreyro (2006) The Log of Gravity. The Review
of Economics and Statistics, 88, 641-658.
Santos-Silva, J. and S. Tenreyro (2011) Further Simulation Evidence On the
Performance of the Poisson-PML estimator. Economics Letters,
112(2): 220–222.
Siyakiya, P. (2017) The Impact of Technical Regulations On Trade: Evidence
from South Africa. Journal of Economics Library, 4:1, 64-75.
Staiger, R. (2012) Non-tariff Measures and the WTO. Staff Working Paper
ERSD-2012-01, Economic Research and Statistics Division, World
Trade Organisation.
Sören, P. and B. Bruemmer (2012) Bimodality and the Performance of PPML.
Institute for Agriceconomics Discussion paper 1202, Georg-August
Universität Göttingen, Germany.
Thuong, N. T. T. (2018) The Effect of Sanitary and Phytosanitary Measures on
Vietnam’s rice exports. EconomiA, 19(2): 251-265.
Tinbergen, J. (1962) Shaping the world economy: Suggestions for an
International Economic Policy. Twentieth Century Fund, New York.
UNCTAD (2019) International Classification of Non-Tariff Measures. USA:
United Nations Conference on Trade and Development.
Wilson, S. and T. Otsuki (2004) Standards and Technical Regulations and
Firms in Developing Countries: New Evidence from a World Bank
Technical Barriers to Trade Survey. The World Bank, Washington
D.C.
217 Mustafa, Padda and Safdar World Trade Report (2012) The Trade Effects of Non-Tariff Measures and
Services Measures. The World Bank.
WTO (2016) Twenty-First Annual Review of the Implementation of The
Operation of The TBT agreement. Switzerland: World Trade
Organization.
Estimating the Impact of Technical Barriers 218
Appendix List of Partner Countries
Afghanistan Costa Rica Hungary Morocco Slovak Republic
Albania Côte d'Ivoire Iceland Mozambique Slovenia
Antigua and
Barbuda Croatia India Myanmar South Africa
Argentina Cuba Indonesia Namibia Spain
Armenia Cyprus Ireland Nepal Sri Lanka
Australia Czech
Republic Israel Netherlands Suriname
Austria Dem. Rep.
Congo Italy New Zealand Sweden
Bahrain Denmark Jamaica Nicaragua Switzerland
Bangladesh Dominica Japan Nigeria Tajikistan
Barbados Dominican
Republic Jordan North Macedonia Tanzania
Belgium Ecuador Kazakhstan Norway Thailand
Belize Egypt Kenya Oman Togo
Benin El Salvador Korea,
Republic of Panama Tonga
Bolivia Estonia Kuwait Papua New
Guinea
Trinidad and
Tobago
Botswana Eswatini Kyrgyz
Republic Paraguay Tunisia
Brazil Fiji Lao Peru Turkey
Brunei
Darussalam Finland Latvia Philippines Uganda
Bulgaria France Lithuania Poland Ukraine
Burkina Faso Gabon Macao, China Portugal UAE
Burundi The Gambia Madagascar Qatar United Kingdom
Cabo Verde Georgia Malawi Romania USA
Cambodia Germany Malaysia Russian
Federation Uruguay
Cameroon Ghana Mali Rwanda Vanuatu
Canada Greece Malta Saint Lucia Venezuela
Central Afri.
Rep. Grenada Mauritania
Saint Vincent and
Grenadines Viet Nam
Chad Guatemala Mauritius Samoa Yemen
Chile Guinea Mexico Saudi Arabia Zambia
China Guyana Moldova Senegal Zimbabwe
Colombia Honduras Mongolia Seychelles
Congo Hong Kong –
China Montenegro Singapore