estimating the institutional costs of educating and ... · estimating the institutional costs of...
TRANSCRIPT

Estimating the Institutional Costs of Educating and Training Health Workers: Preservice Education Costing Methodology and Instruments i
Estimating the Institutional Costs of Educating and
Training Health Workers: Preservice Education Costing
Methodology and Instruments
June 2015
Sophie Faye, Abt Associates, Inc., Rebecca Bailey, IntraHealth International, and Stephen Musau, Abt Associates, Inc.

Estimating the Institutional Costs of Educating and Training Health Workers: Preservice Education Costing Methodology and Instruments ii
ACKNOWLEDGEMENTS The authors gratefully acknowledge the important contributions of Quoc Luong and Wendy Wong, formerly of Abt Associates, in developing and testing the costing study methodology and instruments. In addition, we express our sincere gratitude to the teams that piloted the costing study in South Africa and subsequently applied it through the Nursing Education Partnership Initiative (NEPI) in Ethiopia and the Democratic Republic of Congo (DRC). We are most thankful to Jehu Iputo, Bernard Bongsha and Denis Noel Fennell of Walter Sisulu University in South Africa; Sister Azeb Admasu, Yemesrach Adamu, Elias Asfaw, Abebayehu Haile, Addisalem Mihret, and Takele Yeshiwas in Ethiopia; and Gilbert Belade Kikise and Beatrice Lukeni in the DRC. Special thanks are due to the ministries of health and education in the DRC and Ethiopia for their important contributions and cooperation. Finally, we acknowledge with gratitude the support and collaboration of the President’s Emergency Plan for AIDS Relief (PEPFAR); the United States Agency for International Development (USAID); the US Department of Health and Human Services, Health Resources and Services Administration (HRSA); and ICAP, which is the NEPI implementing partner and coordinating center at Columbia University, with particular appreciation to Lyn Middleton and Jennifer Dohrn.

Estimating the Institutional Costs of Educating and Training Health Workers: Preservice Education Costing Methodology and Instruments iii
TABLE OF CONTENTS
Glossary of Terms ................................................................................................................................................................................ iv
Background ............................................................................................................................................................................................. 1
Target Audiences for this Document ............................................................................................................................................ 2
Overview of the Methodology ........................................................................................................................................................ 2
Goal and Objectives ....................................................................................................................................................................... 3
Key Assumptions and Limitations ............................................................................................................................................. 3
Study Team and Steering Committee .......................................................................................................................................... 5
Study Team ........................................................................................................................................................................................ 5
Steering Committee ....................................................................................................................................................................... 6
Objective 1: Estimating the Institutional Costs of Producing a Graduate...................................................................... 8
Data Needs and Sources .............................................................................................................................................................. 8
Data Collection ................................................................................................................................................................................. 9
Data Analysis .................................................................................................................................................................................. 11
Presentation of Results .............................................................................................................................................................. 13
Objective 2: Identifying Resource Constraints to Delivering Education ...................................................................... 15
Data Needs and Sources ........................................................................................................................................................... 15
Data Collection .............................................................................................................................................................................. 16
Data Analysis .................................................................................................................................................................................. 16
Presentation of Results .............................................................................................................................................................. 16
Objective 3: Budgeting Interventions and Simulating Post-Intervention Unit Costs ............................................. 17
Data Needs and Sources ........................................................................................................................................................... 18
Data Collection .............................................................................................................................................................................. 18
Data Analysis .................................................................................................................................................................................. 18
Presentation of Results .............................................................................................................................................................. 20
Data Collection Instruments.......................................................................................................................................................... 20
Illustrative Timeline for A Costing Study .................................................................................................................................. 21
References ............................................................................................................................................................................................ 22
Appendix A: Tentative Definition of Cost Codes by Educational Inputs ..................................................................... 23
Appendix B: Hypothetical Example of the Total Cost of the Academic Program by Input Categories and Unit Cost per Graduate (N=77).................................................................................................................................................... 25
Appendix C: Hypothetical Example on the Total Cost of the Academic Program by Courses and by Graduate (N=77) ................................................................................................................................................................................ 27

Estimating the Institutional Costs of Educating and Training Health Workers: Preservice Education Costing Methodology and Instruments iv
GLOSSARY OF TERMS Academic program A course of study that results in a certificate, diploma, degree, or
other qualification. Includes an architectural design of learning content, which is multidimensional and includes intentions, structure of content, delivery modes, academic resources, and assessment modes.
Administrator High-level staff member at an educational institution who works with faculty, staff, and students on projects related to academics, operations, and student life.
Clinical preceptor (or instructor)
A practicing clinician, such as a physician or nurse, who gives practical instruction, training, and/or supervision to a student or young clinician, especially of medicine or nursing.
Curriculum (plural curricula)
The planned experiences and interactions of students with instructional content, materials, resources, and people—including the assessment of student learning—for the purpose of achieving identified educational outcomes.
Educator Any person responsible for student learning, including clinical supervisors and preceptors working at clinical facilities.
Fixed assets/resources
Any resources entering a production process that cannot be varied in the short run or are not expected to be consumed or converted into cash any sooner than at least one accounting reporting period (for example, one year).
Health worker Any person engaged in actions whose primary intent is to enhance health.
Health workforce educational institutions
Public or private medical, dental, pharmacy, nursing, midwifery, and other health sciences faculties and schools, as well as vocational training institutes for allied health professions.
Infrastructure Buildings and utilities required to implement a curriculum, including classrooms, skills labs, computer labs, clinical facilities, libraries, canteens, and dormitories as well as water, electricity, and Internet connection.
Opportunity costs The cost of an alternative that must be forgone to pursue a certain action. In other words, the benefits that could have been received by taking an alternative action. For example, the opportunity cost of a teacher participating in training can be the resulting lost teaching time. On the one hand, the students are losing some classroom hours; on the other hand, they (and other future students) will later get a better education, thanks to their teacher’s added skills.

Estimating the Institutional Costs of Educating and Training Health Workers: Preservice Education Costing Methodology and Instruments v
Materials, equipment, and services
The materials, equipment and services needed by students, educators, and clinical preceptors to effectively implement the curriculum for the academic program being studied.
School leaders The senior management group or team. In many schools, this consists of the head of the organization and her or his direct reports. Senior leaders can include, for example, a school’s president, chancellor, provost, vice presidents, directors, deans, associate deans, department heads, and chief officers for finance, communications, and external affairs.
Stakeholders Persons, groups, or institutions that have an interest in the educational institution or its graduates.
Student direct costs Expenditures incurred directly for the benefit of students and increasing with the number of students. Examples include direct costs to recruit and support students and to place students in jobs after graduation, such as costs for advertising, interviews, registration, bursaries, and scholarships.

Estimating the Institutional Costs of Educating and Training Health Workers: Preservice Education Costing Methodology and Instruments 1
BACKGROUND Nearly every country, regardless of income level, is struggling with persistent challenges in the health workforce, including shortages, imbalanced geographical distribution, poor mix of cadres and skills, and uneven performance of health workers, which greatly hinder the provision of essential health services (World Health Organization [WHO] 2006). In 2013, the Global Health Workforce Alliance and the WHO estimated a global deficit of 7.2 million doctors, nurses, and midwives, with the greatest shortfalls in low-income countries with the highest burden of disease (Campbell et al. 2013). Sub-Saharan Africa, for example, has the highest burden of disease of any region and about 16% of the world’s population, but only 3% of the global health workforce is located in Africa, leaving it with a density of about one health worker per 1,000 people—the lowest of any region (Crisp and Chen 2014). Clearly, more health workers must be educated and trained—especially in Africa where the health needs are greatest. Unfortunately, the capacity to increase and transform the supply of health workers is constrained by the limited number of educational institutions and the scarcity of resources available to them (Frenk et al. 2010). To optimize current investments, advocate for increased funding, and create evidence-based policies and strategies for accelerated health workforce development, more information is needed on the costs and effectiveness of current approaches for health workforce education and training. In response to this need, CapacityPlus designed a costing study approach to: (1) estimate the financial costs to an educational institution and its associated clinical practice facilities of producing a graduate of a specific academic program; (2) identify the resource constraints to producing sufficient numbers of quality graduates; and (3) simulate the potential new unit cost to the educational institution and its associated clinical practice facilities if a scenario of interventions were introduced to increase the quantity and/or quality of graduates. The study applies an Excel-based costing model and data collection instruments to analyze preservice education costing data derived from information about enrollment levels, curriculum data, school expenditures, payroll, available infrastructure and equipment, and others. In 2012, CapacityPlus pilot-tested the costing study methodology at Walter Sisulu University, School of Medicine, a large, publicly-funded institution in rural South Africa. The methodology was revised based on the pilot test experience. It then was applied in the Democratic Republic of Congo (DRC) and Ethiopia within the context of the US government’s Nursing Education Partnership Initiative (NEPI) funded by the President’s Emergency Plan for AIDS Relief (PEPFAR). The two NEPI studies demonstrated that the methodology can be applied in different contexts, ranging from small, stand-alone, postsecondary training institutes with fewer than 200 graduates per year to large institutions of higher education composed of numerous faculties and schools that graduate thousands of students each year. During each of the three applications, the methodology was validated and further refined based on inputs from local stakeholders, including representatives from national ministries of health and education. All refinements made during previous applications of the approach have been incorporated into the methodology presented in this document.

Estimating the Institutional Costs of Educating and Training Health Workers: Preservice Education Costing Methodology and Instruments 2
Cost estimates produced through the studies have supported planning and management at education institutions and their associated clinical practice facilities, and at government agencies such as ministries of education, health, finance, and planning. The results also have supported advocacy for increased funding for health workforce education and training, and the development of affordable, evidence-based strategies and plans for increasing the numbers of competent and qualified graduates.
TARGET AUDIENCES FOR THIS DOCUMENT This document can be used by any individual or group that has an interest in estimating the cost of an educational program. This can include, for example:
1. School leaders in both public and private educational institutions, such as the dean of a faculty of health sciences, the director of a medical or nursing school, or the head of a department or academic program
2. Representatives of national governmental organizations such as the ministries of health or education
3. National technical agencies, regulatory bodies, or associations such as a national nongovernmental organization (NGO) focused on education or health, a national health professional council or association, or a national association of nursing or medical schools
4. International technical agencies or associations such as an international NGO, international professional council or association, or international association of nursing or medical education
5. Donors and financing agencies interested in investing in health workforce education, such as the United States Agency for International Development (USAID), the African Development Bank, national development banks, or ministries of finance.
It is important to note that an expert in economics or costing is required to lead the study. Key decisions, such as how to allocate different types of expenditures, must be made by a person with expert technical knowledge. The section below on the study team and steering committee provides more detailed information on this topic.
OVERVIEW OF THE METHODOLOGY The costing methodology uses primary source data from financial expenditure reports, course curricula, enrollment and graduation information, institution and government payroll, and key informant interviews to estimate the cost to an institution and its affiliated clinical practice facilities of producing graduates. It then identifies constraints in key resources—such as infrastructure, materials, and teaching staff—affecting the quantity of graduates produced and/or the quality of their education, and estimates the financial impact on the cost per graduate of overcoming some of those constraints. It applies a top-down, retrospective

Estimating the Institutional Costs of Educating and Training Health Workers: Preservice Education Costing Methodology and Instruments 3
approach, using data from the previous academic year to estimate the costs of all years or levels of an academic program. Total education expenditures are collected for the primary institution and clinical facilities level, regardless of the funding source, and then allocated downward to different academic programs within an institution in order to obtain the cost per graduate, per academic year and course. Rather than following a cohort of students over several years, the approach takes a snapshot of all costs incurred for all levels or years of an academic program in a single academic year, and assumes that all aspects of the academic program were offered and reflected in financial expenditure reports and other data sources for that year. Objectives The specific objectives of the costing study methodology are to:
1. Estimate the financial costs to the educational institution and its associated clinical practice facilities of producing a graduate of a specific academic program
2. Identify the resource constraints to producing sufficient numbers of quality graduates
3. Simulate the potential new unit cost to the educational institution and its associated clinical practice facilities if a scenario of interventions were introduced to increase the quantity and/or quality of graduates from the academic program.
This document describes the process recommended for achieving each of the three objectives. Key Assumptions and Limitations The study methodology includes a number of important assumptions and limitations, described in the following paragraphs. Costs incurred by students The cost estimates generated through this methodology reflect the perspective of education providers in terms of the financial costs incurred by an institution and its associated clinical practice sites to implement an academic program. The analysis excludes all costs borne by students, such as student-paid tuition, fees, housing, meals, and out-of-pocket expenses for books and supplies. To achieve a more holistic estimate of the full cost of producing a graduate, we recommend supplementing the estimates produced through this institutional costing study methodology with a study to estimate the costs incurred by students. This can be done through a survey of a sample of students (and their families or households) from different years or levels of an academic program. Other methods to estimate student costs could include focus group discussions and in-depth interviews. Value of teaching time Accounting records and/or key informant interviews are used to estimate the value of teaching time for individual courses and an academic program as a whole. If information from those sources is not sufficient, then the study assumes that the value of teaching time for individual courses and the academic program is proportional to the total faculty instruction contact hours (e.g., credit hours based on the written curriculum or program description). In addition to teaching, many faculty members also carry out research and service delivery activities. However,

Estimating the Institutional Costs of Educating and Training Health Workers: Preservice Education Costing Methodology and Instruments 4
it is assumed that the time spent on research and clinical service activities adds value to their teaching. Therefore, the estimates include the cost of supporting the educational, research, and service activities of the faculty members involved in the academic program. In-kind donations, volunteer services, and opportunity costs The cost estimates generated through this methodology are based exclusively on actual expenditures made by educational institutions and their associated clinical practice facilities. This means accounting and expenditure reports are the main sources of information for the cost estimates. If expenditures are not documented in finance and accounting systems or ledgers, then they are not included in the cost estimates. Therefore, the value of volunteer services or in-kind donations from governments, donors, or other sources, which are used by the school free of charge, are not included in the cost estimates. For example, if a teacher volunteers her or his services, or if the Ministry of Health provides a training course for teachers, the costs associated with those activities, including opportunity costs, are not included in the costing estimates. Funding sources The costing estimates are based on all financial expenditures by the educational institution and its associated clinical practice facilities to implement an academic program. The source of the funds used to implement the program has no impact on the decision to include specific costing data in the estimates, because the study is focused on estimating expenditures, regardless of their funding sources. Data time frame The costs of the academic program are estimated using institutional-level expenditures for the most recently completed fiscal/academic year and assume that all the education components during the levels or years of the program are offered in the most recently completed fiscal year. Numbers of students and graduates used to estimate unit costs A fixed number of students (the number of students enrolled in the most recently completed academic year) is used to estimate the cost of each year or level of an academic program. (The underlying assumption is that enrollment is fairly constant for the program being costed.) This means that the cost of a four-year program, for example, will be assumed to be equal to the cost of first-year students, plus the cost of second-year students, plus the cost of third-year students, plus the cost of fourth-year students, all measured for the study year. It assumes a steady number of new students enrolled in the program each year, with similar dropout or attrition rates across cohorts. In other words, the approach takes a cross-sectional snapshot of the study year expenditures for all students in all levels of the program to estimate the cost of the whole program rather than tracking the costs of a cohort of students over several years, from admission until graduation. However, the actual number of students who graduated from the program in the most recent academic year is used to estimate the unit cost per graduate. This approach allows the methodology to account for student attrition or dropouts that might occur during the life of the program. Costs to clinical practice facilities

Estimating the Institutional Costs of Educating and Training Health Workers: Preservice Education Costing Methodology and Instruments 5
Financial costs to the health facilities are measured in terms of the commodities used by students (e.g., gloves, gowns), the contact time that clinical preceptors or supervisors spend with students, and the space used in clinical facilities for clinical teaching (e.g., meeting rooms). Value of student contributions to health facilities Because students do not replace the qualified health worker who is supervising them, must work under supervision, and are not legally authorized to perform clinical tasks on their own, the costing study methodology does not consider the clinical practice rotations of students as having a monetary added value to the facility or possible cost savings implications. The nonclinical services provided by students—such as filling in patient records, moving patients, or providing health education and counseling—could constitute a benefit for the health facility, in theory, because it frees up time for qualified staff to perform more clinical tasks. These benefits would offset some of the costs that facilities incur due to students’ training. However, this approach is a costing analysis and does not take into consideration the value added from students. Cost of interventions to increase the quantity and/or quality of graduates Market prices for the study year are used to estimate the cost of different intervention scenarios that aim to overcome resource constraints in order to increase the number of graduates and/or improve the quality of their education. STUDY TEAM AND STEERING COMMITTEE To carry out a preservice education costing study, it is important to form a study team with the right expertise to implement the approach. In addition, a steering committee is needed to ensure that the approach is adapted to the country context and that the results are used to improve health workforce education and training. Study Team The study should be led by someone with economics and/or costing knowledge and experience. The full team for a costing study might include:
• A costing specialist who will coordinate the study
• A health workforce development (HWD) specialist
• A quality advisor (costing specialist with HWD knowledge)
• Representatives from the study steering committee
• The head of the institution being studied
• The head of the program being costed
• The head of finances at the institution being studied
• The clinical practice coordinator at the health facilities where clinical rotations take place.

Estimating the Institutional Costs of Educating and Training Health Workers: Preservice Education Costing Methodology and Instruments 6
Steering Committee For data ownership to be built, a steering committee of key stakeholders should be formed to guide the study and be involved in proposing, designing, implementing, and reporting on the costing study initiative. Key stakeholders are persons or groups both internal and external to the institution who can significantly inform and/or influence the study process or are important to its success. They typically include, but are not limited to, the following:
• Dean or director of the faculty, college, or school
• Director or heads of relevant departments
• School registrar
• Head of academic affairs
• School senior administrator or finance officer
• At least one representative of:
Students
Teachers
Clinical tutors/supervisors
• Managers or supervisors at associated clinical practice facilities
• Representatives of national and local health and education authorities (e.g., national ministries of health and education, municipal departments of health and education)
• Representatives of local regulatory bodies for education and health (e.g., national health professional council, national quality assurance body for higher education)
• Potential donor agencies or investors. At a minimum, the steering committee would include the dean or director of the faculty or school, the heads of the educational programs being costed, and the managers of the health facilities where students complete clinical practice rotations. Because students are personally and directly affected by any changes to an academic program, involvement of student representatives as key stakeholders will greatly enhance the accuracy, appropriateness, and effectiveness of the process. Focused yet regular involvement of key stakeholders creates access to more information, which enhances the quality of decision-making, increases support for conclusions and recommendations, and facilitates changes or improvements.

Estimating the Institutional Costs of Educating and Training Health Workers: Preservice Education Costing Methodology and Instruments 7
Example: CapacityPlus conducted costing studies of the nursing and midwifery programs at two colleges of health sciences in Ethiopia as a NEPI partner. A national steering committee was created that included representatives of the Federal Ministry of Health, Federal Ministry of Education, schools of health sciences, the National Midwives Association, USAID, the Centers for Disease Control and Prevention (CDC), Columbia University’s ICAP Nurse Capacity Initiative, and CapacityPlus. The stakeholder group contributed to a number of important decisions, such as selecting the schools for the study, providing educational standards to help identify resource constraints and the costs for overcoming them, reviewing the preliminary results of the report, providing feedback and data to strengthen the findings, and disseminating the findings to a wide group of national stakeholders, including implementing partners and donor organizations.
Ideally, institutions should hold at least three steering committee meetings during the life of a costing study:
• Orientation workshop: The overall goal of the orientation workshop is to orient participants about the costing study methodology and instruments in order to enrich the study before applying it in the particular context and agree on the way forward, including developing a list of key activities and estimating the timeline needed to implement the study.
• Validation meeting: Once the preliminary analysis, findings, and report are complete, the study team should hold a validation meeting with the steering committee and other key stakeholders to review the results and develop recommendations for finalizing the study and report and for disseminating the results of the study to stakeholders.
• Dissemination meeting: During the final dissemination meeting, the study team presents the results of the costing studies, discusses how the findings can be used to guide future investments and decision-making that aim to increase the number and quality of graduates, and agrees on a list of key activities and an estimated timeline for further dissemination of and responses to the costing study results.
In all cases where the costing study methodology has been implemented thus far, the steering committee suggested additional data collection and analysis to refine different aspects of the study. For example, in the DRC, the steering committee requested that the study team redefine the criteria for counting a student as a graduate. This new definition of a graduate led to an increase in the number of graduates, and, therefore, a decrease in the cost per graduate. It is very important to conduct this validation exercise and to revise the report before the results are more widely disseminated.

Estimating the Institutional Costs of Educating and Training Health Workers: Preservice Education Costing Methodology and Instruments 8
OBJECTIVE 1: ESTIMATING THE INSTITUTIONAL COSTS OF PRODUCING A GRADUATE Objective 1 estimates the financial costs to the educational institution and its associated clinical practice facilities of producing a graduate of the degree/diploma program being studied. Costs of the academic program are estimated based on the expenditures made by the academic and clinical practice institutions for the most recently completed fiscal year. The unit cost shows the costs of the inputs consumed to produce the graduate in four major categories: (1) faculty, educators, and administrators, (2) student direct costs, (3) infrastructure and equipment, and (4) materials and services. Categories (1), (2), and (4) are variable costs and (3) is a fixed cost. The disaggregation of the unit cost into variable and fixed costs makes it possible to identify scale-up constraints, ascertain cost efficiency, and subsequently determine post-scaled-up unit cost. In addition to breaking down the costs by inputs, the unit cost is also disaggregated by year/level (e.g., first year, third year), and by course within the academic program (e.g., anatomy, biochemistry, primary care). The estimated number of graduates in the study year is used for the unit cost per graduate analysis throughout the entire education period. It is important to remember that the methodology does not estimate costs borne by students. A separate survey of students could be implemented to capture the costs to students and also to include “in kind” costs—for example, Ministry of Health-supported trainings for teaching staff and clinical preceptors.
Data Needs and Sources Table 1 presents the data needed from the educational institution and clinical practice facilities as well as the rationale for collecting the data to estimate the unit costs of a graduate, once the program to be costed has been identified.
Table 1: Data Needed to Estimate Current Costs of Producing a Graduate
Data needed Why Source
1 General information about the academic institution and its affiliated clinical practicum facilities: historic ownership, location, organizational structure, etc.
To define the study context Academic institution and clinical practicum facilities
2 Information on students’ enrollment and graduation for the department of interest*
To calculate the cost per graduate and per enrolled student of the degree program
Academic institution
3 Expenditure reports at the institution level
To allocate the shared expenditures (such as maintenance and utilities) to individual departments, including the department of interest, and to map expenditures into the four predefined input cost categories (faculty, student direct costs, infrastructure and equipment, materials and services)
Academic institution

Estimating the Institutional Costs of Educating and Training Health Workers: Preservice Education Costing Methodology and Instruments 9
Data needed Why Source
4 Expenditure reports at the department level
To allocate the shared expenditures (such as administrative staff and infrastructure) to individual programs, including the program of interest, and to map expenditures into the four predefined input cost categories (faculty, student direct costs, infrastructure and equipment, materials and services)
Academic institution
5 Expenditure reports of the associated clinical facilities for the degree being costed (or estimation of students’ practicum expenditures obtained from the clinical facilities)
To allocate and attribute expenditures related to student clinical practice
Clinical practicum facilities
6 Information about students’ use of consumables (gloves, syringes, etc.) and any dedicated infrastructure and equipment used during their training
To add the corresponding cost/depreciation cost to the estimation of expenditures related to student clinical practice
Clinical practicum facilities
7 Curricula for all programs being offered in the department of interest
To allocate the shared costs among programs if the department offers more than one education program and to allocate costs to individual courses of the degree/diploma of interest, using credit hours as allocation criteria
Academic institution
8 Curriculum of the program being assessed, including credit hours of individual courses
To allocate the cost of that program to individual courses and hence to each academic year of the program
Academic institution
9 Information on the fixed resources available for the departments (classrooms, laboratories, etc.)
To assess their utilization rate and how they might constrain the number or quality of graduates produced
Academic institution
10 Payroll information (including number of staff) and grade of staff who teach each course
To allocate teaching and administrative staff salaries to the program being costed
Academic institution
11 Information about the number of students and faculty in each department
To serve as cost allocation criteria (when appropriate)
Academic institution
* Department offering the degree program being costed. The department might offer other degree programs in addition to the one being costed.
Data Collection This costing methodology has a template to collect all the data discussed above both at the academic institution and clinical facility levels. However, some data (such as payroll and school organizational structure) will be collected as available at the school/health facility and analyzed separately to extract the needed information. For a costing study to be successful, academic institutions and clinical facilities also must provide staff who can deliver the needed information.

Estimating the Institutional Costs of Educating and Training Health Workers: Preservice Education Costing Methodology and Instruments 10
Academic institution The study team will need staff that:
1. Have access to and can provide all expenditure reports related to the school’s departments and programs.
2. Can explain which expenditures are for which training activities in which programs. Example: The transportation expenditure under the midwifery department is for students to do clinical practice.
3. Can provide a complete list of fixed assets, their maximum capacities, their current utilization, and how those compare to official guidelines (if any).
4. Have a thorough understanding of the curriculum of the program being costed, including the details about clinical practica, and be able to explain which course consumes which resources. Example: The anatomy course in year three of the midwifery program includes 2 credit hours of anatomy lab, 3 credit hours of classroom, and 5 credit hours of clinical practice.
5. Have a solid understanding of the organization of the school, and be able to explain how overhead, assets, and faculty are shared across different programs within the school/department (if this is the case). Example: Some faculty of midwifery also teach courses in nursing. Their salary should be allocated across the two departments accordingly.
6. Define interventions to relax resource constraints in scaling up or improving the quality of training. Example: If an intervention is to construct a new anatomy laboratory, the person should be able to determine the size of the lab, which equipment should be installed, what manpower is needed to operate the lab, and the costs of acquiring the new lab as well as the annual operation costs. If an intervention is to recruit a leading professor in anatomy, the person should be able to determine the recruitment costs and the yearly expenses for the professor to work effectively at the school. Suggestion: • One person from the finance or accounting department handles tasks 1 to 3. • One educational administrator manages tasks 4 to 6. • The school may also find one person who is able to cover all tasks from 1 to 6.
Clinical facilities For each clinical practice facility, the study team will need staff that:
1. Have access to and can provide all expenditure reports related to the facility’s expenditures for students’ clinical practica.
2. Can explain which expenditures are for which student training activities. Example: Students’ expenditures incurred in January are not relevant for students from the degree program being costed, who only do their practica from May to September.

Estimating the Institutional Costs of Educating and Training Health Workers: Preservice Education Costing Methodology and Instruments 11
3. Can provide a complete list of the total number of students received for practica per year, the infrastructure being used by those students while on training, and how both compare to official guidelines (if any).
4. Can describe the details of the courses, training, and different ward assignments that the students are going through during their clinical practicum.
5. Can describe the type of staff involved in student training and can estimate the amount of time that those staff dedicate to students (outside of normal patient interaction) during clinical practica.
6. Can estimate the amount of consumables used by students while training in different departments of the health facility. Suggestion: • One person from the administrative or finance/accounting department handles tasks
1 to 3. • One clinical practice coordinator or staff member working directly with students
manages tasks 4 to 6. • The facility may also find one person who is able to cover all tasks from 1 to 6.
Data Analysis The following paragraphs describe the steps used to produce the unit cost of the programs of interest. The process is illustrated in Figure 1.
Figure 1: Cost per Graduate: Top-Down Estimation Process

Estimating the Institutional Costs of Educating and Training Health Workers: Preservice Education Costing Methodology and Instruments 12
Step 1 Allocate institution-level (academic and clinical) shared expenditures to individual departments based on their number of students or their proportion of credit/contact hours, depending on the nature of the expenditure. For example, if a department has 2% of students, 2% of the financial aid given to students would go to that department. Step 2 Calculate the cost of instructors and staff for the department using payroll data and the information about the number and type of faculty in each department. For shared cost centers such as “miscellaneous payments to faculty,” the official number of teachers in each department can be used as the allocation criterion. Step 3 Allocate the costs further to specific programs using both the number of students and the proportion of credit/contact hours as criteria when the department offers more than one program. Step 4 Calculate the financial cost of the student clinical practice (for the program being costed) using data collected at the health facilities on consumables, staff time, and infrastructure use. Step 5 Identify the resulting total expenditures for the program being costed using cost codes, and map them to the four major input categories:
1. Faculty, educators, and administrators: all costs related to faculty, staff, or clinical educators. For example: salaries of permanent faculty, wages of contract staff, permanent staff allowances, administrative staff salaries, and per diems.
2. Student direct costs: all variable costs directly related to students. For example: financial aid, clinical practice costs, food, educational supplies, and entertainment.
3. Infrastructure: all building-related costs. For example: utilities, maintenance, purchase of building equipment, communications, and insurance.
4. Materials and services: all supplies, materials, and service costs related to day-to-day training. For example: printing, fuel, office supplies, skills lab materials, uniforms and clothing, and contracted services.
These four categories were selected to facilitate the interpretation of results and identify the areas where more (or less) is spent by the corresponding programs. However, other categories can be chosen after discussion with the institutions. Step 6 Sum the input categories across the program to get the total cost and the contribution of each main input category.
Estimating the Institutional Costs of Educating and Training Health Workers: Preservice Education Costing Methodology and Instruments 13
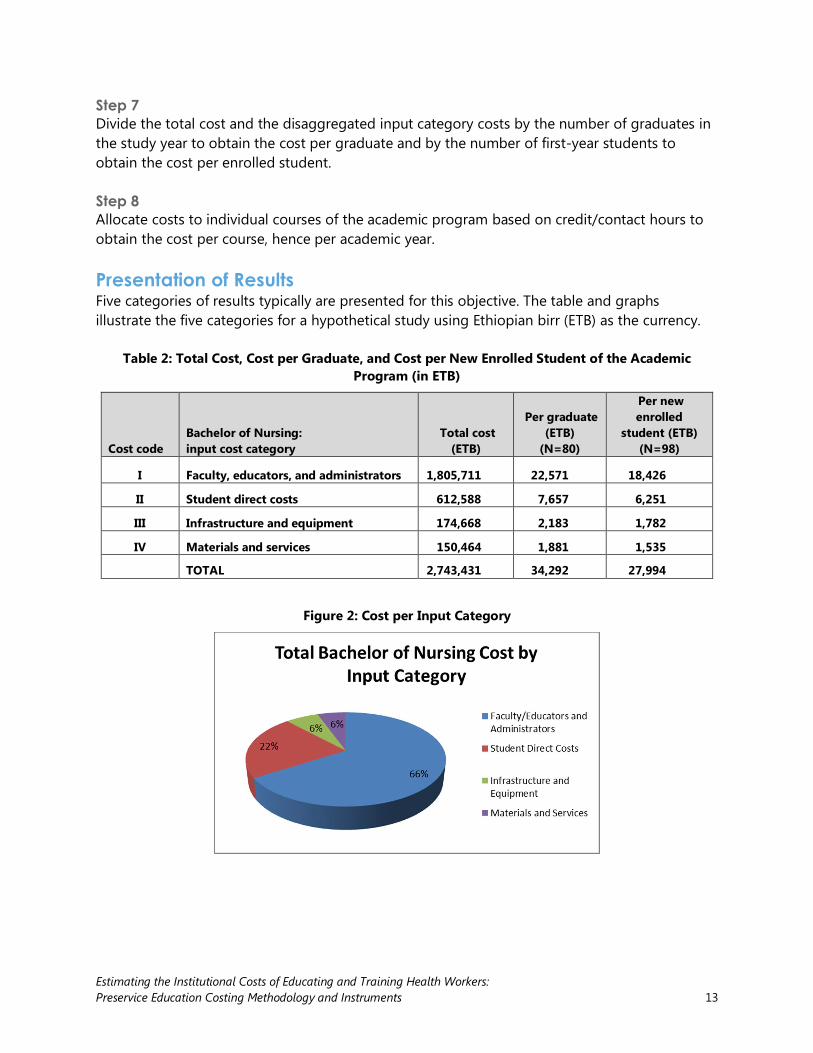
Step 7 Divide the total cost and the disaggregated input category costs by the number of graduates in the study year to obtain the cost per graduate and by the number of first-year students to obtain the cost per enrolled student. Step 8 Allocate costs to individual courses of the academic program based on credit/contact hours to obtain the cost per course, hence per academic year. Presentation of Results Five categories of results typically are presented for this objective. The table and graphs illustrate the five categories for a hypothetical study using Ethiopian birr (ETB) as the currency.
Table 2: Total Cost, Cost per Graduate, and Cost per New Enrolled Student of the Academic Program (in ETB)
Cost code Bachelor of Nursing: input cost category
Total cost (ETB)
Per graduate (ETB)
(N=80)
Per new enrolled
student (ETB) (N=98)
I Faculty, educators, and administrators 1,805,711 22,571 18,426
II Student direct costs 612,588 7,657 6,251
III Infrastructure and equipment 174,668 2,183 1,782
IV Materials and services 150,464 1,881 1,535
TOTAL 2,743,431 34,292 27,994
Figure 2: Cost per Input Category

Estimating the Institutional Costs of Educating and Training Health Workers: Preservice Education Costing Methodology and Instruments 14
Figure 3: Breakdown of Student Direct Costs Category
Figure 4: Cost per Academic Year of the Program

Estimating the Institutional Costs of Educating and Training Health Workers: Preservice Education Costing Methodology and Instruments 15
Figure 5: Cost per Course for Each Year of the Program
OBJECTIVE 2: IDENTIFYING RESOURCE CONSTRAINTS TO DELIVERING EDUCATION This objective focuses on the constraints in fixed assets and faculty to scaling up the quantity and/or improving the quality of graduates. The constraints of fixed assets will be determined by comparing the current utilization levels to the standard capacities of the fixed assets as well as to official guidelines (if available). The faculty constraints will be determined by comparing faculty-to-student ratios for different teaching types (classroom, lab sessions, and clinical practice) with school and official standards. When available, national and college-level educational standards are compared to the observed availability and use of resources and infrastructure to assess constraints to improving the quality or increasing the number of graduates and determine needed interventions to overcome them (e.g., classrooms, demonstration rooms, educational materials, teaching faculty). The cost per graduate is recalculated after accounting for a scenario of budgeted interventions designed to overcome the identified constraints. The post-intervention cost more accurately reflects the estimated cost of producing quality nursing and midwifery graduates. Data Needs and Sources To analyze the constraints of fixed resources to scaling up the quantity and/or improving the quality of graduates, we collect data on the standard capacity (space and number of students)

Estimating the Institutional Costs of Educating and Training Health Workers: Preservice Education Costing Methodology and Instruments 16
and current utilization level of each fixed asset (such as classrooms, biochemistry laboratory, skills laboratory, and computer laboratory) as well as the equipment in this fixed infrastructure. This information is collected from the academic institution. It can also be collected from the clinical facilities if they have infrastructure that is dedicated to student practica only. It is also important to collect information on the country official guidelines (if available) regarding standard capacity and the faculty-to-student ratios of those fixed assets and equipment, to be compared against the current situation. Data Collection This costing methodology has a template to collect data on standard capacity (space and number of students) and current utilization levels of all fixed assets needed for the degree program. Data Analysis The constraints of fixed assets will be determined by comparing the current utilization levels to the maximum capacity of the fixed assets. The gap between current utilization level and standard capacity shows the number of additional students the school can enroll before it has to make investments to overcome the constraints. The gap between current utilization level of fixed assets and faculty–to-student ratio, compared to official guidelines, shows the alignment (or not) of provided education with official quality standards. For example, if a class of 40 students is using a 30-square-meter classroom (with a standard maximum seating capacity of 30), then we can say that classroom space constitutes a constraint for the program and needs to be relaxed. Further, if we know that the official guidelines recommend 1.5 square meters/student for adequate seating in classrooms, then we can say that the standard maximum seating capacity of that particular classroom (30 students) is above what is recommended (20 students) and might be having an impact on the quality of education. Cost efficiencies are determined by analyzing the impact of increasing the current utilization level to the standard maximum capacity level (if not reached yet). In particular, the gap between the current unit fixed cost, estimated based on current utilization level, and an efficient unit fixed cost, estimated based on the assumption that the fixed assets are used to their standard maximum capacity, will show the possible efficiency gains. Presentation of Results Three categories of results are typically presented for this objective, comparing available infrastructure space, faculty members (by type of teaching), and skills lab materials against what is stated in the country standards in order to identify gaps or constraints. The two tables below illustrate two of these categories (space and faculty constraints), using examples from a hypothetical study.

Estimating the Institutional Costs of Educating and Training Health Workers: Preservice Education Costing Methodology and Instruments 17
Table 3: Space Constraints for Infrastructure
Program Fixed asset
Number of units for fixed asset
Current space of each unit (square meters)
Actual number of students for a lecture session
Official space guidelines (square meters per individual)
Capacity of each unit according to standards (number of individuals)
Surplus of individuals compared to standards
Shortage of space (square meters)
Bachelor in
Midwifery
Lecture room type 1
4 80 75 1.2 67 +8 -9.6
Lecture room type 2
3 60 60 1.2 50 +10 -12
Skills lab type 1
1 24 15 3 8 +7 -21
Skills lab type 2
1 64 30 3 21 +9 -27
Teachers room
3 12 8 2 6 +2 -4
Table 4: Faculty Constraints
Type of teaching School standards Midwifery (actual)
Classroom lecture 1 teacher for up to 65 students
1 teacher for 80 students
Skills lab 1 teacher for up to 30 students
1 teacher for 40 students
OBJECTIVE 3: BUDGETING INTERVENTIONS AND SIMULATING POST-INTERVENTION UNIT COSTS Objective 3 aims to budget scenarios of interventions identified from previous assessments or from the constraint analysis produced by Objective 2. The third objective then simulates the new post-intervention unit costs to the educational institution and its associated clinical practice facilities in order to achieve scale-up or quality improvement goals. Why does Objective 3 focus on budgeting rather than costing? Estimating the costs of new interventions has more to do with planning and budgeting than with costing, because it requires that one make assumptions about the quantities of resources needed in the future and use current market prices to arrive at the costs of the interventions. In comparison, Objective 1 uses actual historical expenditures as per accounting books to produce unit costs. As such, the term that carries a better understanding of the estimation process with regard to new interventions is budgeting.

Estimating the Institutional Costs of Educating and Training Health Workers: Preservice Education Costing Methodology and Instruments 18
Data Needs and Sources The first step is to identify the interventions that managers of the institution and its associated clinical practice facilities are interested in considering to improve preservice education. Interventions can be categorized into Type 1 and Type 2 interventions. Type 1 Type 1 interventions are “within-constraint interventions” that can be implemented with current resources, namely, classroom buildings, laboratory facilities, clinical facilities, libraries, and faculty. A Type 1 intervention will not require new investments since there is already adequate capacity to accommodate the intervention. An example of this type of intervention would be increasing the number of students within the standard maximum capacity for laboratory facilities or teaching faculty. Type 2 Type 2 interventions are “beyond-constraint interventions.” These interventions will require new investments to relax current capacity constraints. Examples of Type 2 interventions include increasing the number of students beyond the standard maximum capacity allowed by current infrastructure, improving the faculty-to-student ratio by hiring new faculty, or building new infrastructure such as classrooms, labs, clinics, or libraries. After identifying interventions of interest, the institution and its associated clinical practice facilities need to budget the new interventions. Budgeting includes determining:
• The acquisition cost of new interventions (for example, the one-time construction cost of building a new laboratory or the purchase of a collection of books)
• The yearly operational costs of the new interventions (for example, depreciation, utilities, and the manpower needed to operate the new laboratory for a year).
Data Collection This costing approach provides templates for budgeting. The school and clinical facilities provide the information to feed into the templates because they are in the best position to define the interventions needed. The example of a new laboratory would include determining the size of the new laboratory and the most appropriate types of equipment to be installed. The school can carry out budgeting of new interventions using any regular budgeting process with which the school is comfortable. To facilitate the process, the costing approach offers two templates that can be used if found more convenient: one for budgeting one-time acquisition costs and one for yearly operational costs. Note that for illustration purposes, the current templates are applied for a hypothetical computer lab. Data Analysis To cost Type 1 interventions, the institution and its associated clinical practice facilities must determine the scope of the intervention and the changes that will be brought about by the intervention (e.g., new curriculum, increased student enrollment, new assignments of

Estimating the Institutional Costs of Educating and Training Health Workers: Preservice Education Costing Methodology and Instruments 19
instructors). Next, the changes expected from the Type 1 interventions will be incorporated into the costing analysis from Objective 1 to produce new unit cost estimates. For Type 2 interventions, the first step in estimating the new unit costs is to budget the acquisition cost and the yearly operational cost of the new infrastructure. The new unit cost estimates are then obtained by adding those costs to the costing analysis from Objective 1. For capital costs, the annual depreciation will be added and for recurrent costs, the full cost will be added. For the acquisition of a new laboratory example, only the annual depreciation of the construction cost will be added (instead of the full cost of building that laboratory), but the full yearly operational cost of the new laboratory will be incorporated in the new unit cost estimates. The new capacity will also be added to the capacity of current assets, and the new unit cost per graduate will take into account the potential increased enrollment.
Table 5: Example of Budgeting Acquisition Cost of Computer Lab (in South African Rand)
# Inputs Quantity Unit Unit cost Total cost I Equipment
1 Computers 100 Piece 10,000 1,000,000 2 Server 1 Piece 30,000 30,000 3 Computer work station 100 Set 2,000 200,000 4 Office desks 2 Piece 3,000
II Construction 5 Lab area 300 Square meter 7,000 2,100,000
6 Office area 40 Square meter 7,000 280,000 Total construction area 1000 Square meter 500 500,000 III Other inputs TOTAL ACQUISITION COST 4,110,000
Table 6: Example of Budgeting Operational Cost of the Computer Lab (in South African Rand)
Cost code Operation costs Cost I Faculty, educators, and administrators
108 Administration and support staff 110 Salary and other benefits for full-time and part-time faculty 750,000 115 Other faculty and administrator costs
II Student direct costs 206 Materials and supplies 500,000 210 Other student costs 200,000
III Infrastructure 304 Depreciation 420,000 304 Maintenance 100,000 304 Security 50,000 304 Utilities 100,000 315 Other 50,000
IV Materials, equipment, and services 403 Materials and minor equipment 100,000 410 Other materials and equipment costs 100,000
TOTAL YEARLY OPERATION COST 2,370,000

Estimating the Institutional Costs of Educating and Training Health Workers: Preservice Education Costing Methodology and Instruments 20
Presentation of Results The results for Objective 3 show the difference between pre- and post-intervention and can follow the format of the graphs and tables shown for Objective 1. The hypothetical example below presents the total cost per input cost category of midwifery and nursing programs.
Figure 6: Midwifery and Nursing Program Costs per Input Category, Pre- and Post-Interventions
DATA COLLECTION INSTRUMENTS A set of data collection instruments is used to collect data in accordance with the methodology described above. Data collection takes place using instruments built from Microsoft Excel. The data collection instruments for the preservice education costing approach include:
• A general information instrument for the institutions
• A cost code development instrument
• A course inventory instrument
• A finance/expenditure instrument
• A fixed assets constraint instrument
• A new intervention budgeting instrument
• A clinical facility cost instrument
• A clinical facility constraint instrument.

Estimating the Institutional Costs of Educating and Training Health Workers: Preservice Education Costing Methodology and Instruments 21
ILLUSTRATIVE TIMELINE FOR A COSTING STUDY
Table 7: Estimated Activity Timeline
Activity Estimated time required*
1 Orientation of stakeholders and adaptation of the study protocol and instruments to the local context
1 week
2 Submission of study protocol and instruments to the appropriate research ethics committee
3 weeks
3 Letters sent from relevant government authority to institution to introduce the study team
1 week
2 Preparation of site visits to the educational institution: information provided about the scope of work of the site visits, the people at the institution who should be available to participate, and the proposed agenda
2 days
3 Initial data collection by the study team at the institution and plan, with timeline, developed by the study team and school representatives for the collection of remaining data
1 week
4 Data collection at the associated clinical practice facilities 2 weeks
5 Follow-up data collection at the educational institution and associated clinical practice facilities
2 weeks
6 First round of data analysis 3 weeks
7 Presentation and review of preliminary results with relevant stakeholders and representatives from the educational institution and its associated clinical practice facilities (validation workshop conducted in country)
3 days
8 Follow-up data collection, final round of data analysis, and draft report circulated for review
4-6 weeks
9 Finalization of report 3 weeks
10 Final results dissemination meeting with all stakeholders 3 days
* The tentative timeline will increase with the number of educational institutions being costed.

Estimating the Institutional Costs of Educating and Training Health Workers: Preservice Education Costing Methodology and Instruments 22
REFERENCES Campbell, Jim, Gilles Dussault, James Buchan, et al. 2013. A universal truth: No health without a workforce. Forum report, Third Global Forum on Human Resources for Health, Recife, Brazil. Geneva, Switzerland: Global Health Workforce Alliance and World Health Organization. http://www.who.int/entity/workforcealliance/knowledge/resources/GHWA-a_universal_truth_report.pdf?ua=1. Crisp, Nigel, and Lincoln Chen. 2014. “Global supply of health professionals.” New England Journal of Medicine 370: 950-957. http://www.nejm.org/doi/full/10.1056/NEJMra1111610. Frenk, J., L. Chen, Z.A. Bhutta, et al. 2010. Health professionals for a new century: Transforming education to strengthen health systems in an interdependent world. Cambridge, MA: Harvard University Press. http://www.healthprofessionals21.org/index.php/about/lancet-report. World Health Organization. 2006. The world health report 2006: Working together for health. Geneva, Switzerland: World Health Organization. http://www.who.int/whr/2006/en/.

Estimating the Institutional Costs of Educating and Training Health Workers: Preservice Education Costing Methodology and Instruments 23
APPENDIX A: TENTATIVE DEFINITION OF COST CODES BY EDUCATIONAL INPUTS
Cost codes Definition of cost codes
I Faculty, educators, and administrators
101 Curriculum development, coordination, evaluation, and revision
102 Course preparation
103 Classroom teaching and assessment of students (including supervision of student’s dissertations/research projects)
104 Clinical teaching/supervision and assessment of students, including external examinations
105 Clinical preceptors/advisors salary
106 Community engagement
107 Research
108 Administration and support staff
109 Continuous professional development
110 Salary and other benefits for full-time and part-time/visiting national and international lecturers (housing, transport, medical insurance, communications, loans)
111 Counseling, support, and orientation of students
115 Other faculty and administrator costs (costs that do not fall into 101-111)
II Student direct costs
201 Recruitment process (e.g., advertising, interviews, registration)
202 Bursaries/scholarships
203 Transportation of students to/from clinical sites
204 Food for students at clinical sites
205 Materials and supplies used by students at clinical sites
206 Materials and supplies used by students at schools
207 Job placement and tracking
208 Deposit/caution money (if required) to be paid by an institution to a health facility before sending students for clinical placements
209 Exchange programs including study tours, conferences, or seminars
210 Other student costs (costs that do not fall into 201-209)
III Infrastructure
301 Classrooms (fixed costs relating to classrooms that do not vary with number of students)*
302 Clinical facilities (clinics or hospitals run by the institution—fixed costs relating to clinical facilities that do not vary with number of students)*
303 Clinical laboratories (fixed costs relating to clinical laboratories that do not vary with number of students)*
304 Skills labs/practice rooms (fixed costs relating to skill labs/practice rooms that do not vary with number of students)*
305 Computer labs (fixed costs relating to computer labs that do not vary with number of students)*
306 Internet connection
307 Libraries (fixed costs relating to libraries that do not vary with number of students)§
308 Cafeteria/canteen (fixed costs relating to cafeteria/canteen that do not vary with number of students)ǂ
309 Student facilities (fixed costs relating to student facilities that do not vary with number of students)ǂ

Estimating the Institutional Costs of Educating and Training Health Workers: Preservice Education Costing Methodology and Instruments 24
Cost codes Definition of cost codes
310 Faculty working facilities (offices, lounges, meeting areas—fixed costs relating to faculty working facilities that do not vary with number of students)ǂ
311 Faculty housing (fixed costs relating to faculty facilities that do not vary with number of students)ǂ
312 Sports and entertainment (fixed costs relating to sport and entertainment facilities that do not vary with number of students)ǂ
315 Other infrastructure fixed costs (costs that do not fall into 301-312)
IV Materials, equipment, and services
401 Classroom teaching materials and equipment (projectors, books, journals, videos, computer programs, slides, handouts, etc.)
402 Multi-copy center(s), including printers, photocopy, scanner, binding, and accessories
403 Skills lab materials and equipment
404 Clinical laboratory materials and equipment
405 Clinical practice materials and equipment
406 Students’ uniforms, lab coats, etc.
407 Vehicles
410 Other materials, equipment, and services costs (costs that do not fall into 401-407) * Examples: Depreciation, maintenance, security, utilities paid even if there are no students (e.g., summer, winter break) § Examples: Depreciation, maintenance, security, utilities paid even if there are no readers ǂ Examples: Depreciation, maintenance, security, utilities paid even if there are no users

Estimating the Institutional Costs of Educating and Training Health Workers: Preservice Education Costing Methodology and Instruments 25
APPENDIX B: HYPOTHETICAL EXAMPLE OF THE TOTAL COST OF THE ACADEMIC PROGRAM BY INPUT CATEGORIES AND UNIT COST PER GRADUATE (N=77)
Cost code Costs of inputs
Total cost of the program (in
South African Rand) Percentage
I Faculty, educators, and administrators 86,277,646 89.7%
101 Curriculum development, coordination, evaluation, and revision 112,479 0.12%
102 Course preparation 37,604 0.04%
103 Classroom teaching and assessment of students 66,960 0.07%
104 Clinical teaching/supervision and assessment of students 629,059 0.65%
105 Clinical preceptors salary 2,418,282 2.52%
106 Community engagement 16,120 0.02%
107 Research 19,567 0.02%
108 Administration and support staff 12,984,967 13.51%
109 Continuous professional development 1,145,165 1.19%
110
Salary and other benefits for full-time and part-time/visiting national and international lecturers (housing, transport, medical insurance, communications, loans) 68,132,245 70.87%
111 Counseling, support, and orientation of students - 0.00%
115 Other faculty and administrator costs (costs that do not fall into 101-111) 715,197 0.74%
II Student direct costs 2,214,387 2.30%
201 Recruitment process (e.g., advertising, interviews, registration) 25,849 0.03%
202 Bursaries/scholarships - 0.00%
203 Transportation to/from clinical sites 146,441 0.15%
204 Food at clinical sites 128,800 0.13%
205 Materials and supplies at clinical sites 797,772 0.83%
206 Materials and supplies at schools 578,353 0.60%
207 Job placement and tracking - 0.00%
208 Deposit/caution money to be paid by a school to a health facility for clinical practice - 0.00%
209 Exchange programs including study tours, conferences, or seminars 471,990 0.49%
210 Other student costs (costs that do not fall into 201-209) 65,183 0.07%
III Infrastructure 3,484,004 3.62%
301 Classrooms 18,281 0.02%
302 Clinical facilities run by the school - 0.00%
303 Clinical laboratories 1,582 0.00%
304 Skills labs/practice rooms 155,320 0.16%

Estimating the Institutional Costs of Educating and Training Health Workers: Preservice Education Costing Methodology and Instruments 26
Cost code Costs of inputs
Total cost of the program (in
South African Rand) Percentage
305 Computer labs - 0.00%
306 Internet connection - 0.00%
307 Libraries 3,088,053 3.21%
308 Cafeteria/canteen - 0.00%
309 Student facilities 6,000 0.01%
310 Faculty working facilities 214,768 0.22%
311 Faculty housing - 0.00%
312 Sports and entertainment - 0.00%
315 Other infrastructure fixed costs (costs that do not fall into 301-312) - 0.00%
IV Materials, equipment, and services 4,162,239 4.33%
401 Classroom teaching materials and equipment (projectors, books, etc.) 2,638 0.00%
402 Multi-copy center(s), including printers, photocopy, scanner, etc. 67,692 0.07%
403 Skills lab materials and equipment 605,384 0.63%
404 Clinical laboratory materials and equipment 3,486,525 3.63%
405 Clinical practice materials and equipment - 0.00%
406 Students’ uniforms, lab coats, etc. - 0.00%
407 Vehicles - 0.00%
410 Other materials,equipment, and services costs (costs that do not fall into 401-407) - 0.00%
Total cost of the academic program (sum of I, II, III, and IV) 96,138,275 100.00%
Unit cost (total cost of the program/77 graduates) 1,248,549

Estimating the Institutional Costs of Educating and Training Health Workers: Preservice Education Costing Methodology and Instruments 27
APPENDIX C: HYPOTHETICAL EXAMPLE ON THE TOTAL COST OF THE ACADEMIC PROGRAM BY COURSES AND BY GRADUATE (N=77)
Courses
Total cost of the program (in South
African Rand)
Unit cost per graduate (total cost/77
graduates) Human Behavioral Science and Medical Ethics 33,930 441 Medical Physics 751,346 9,758 Medical Chemistry 631,450 8,201 Medical Biology 879,939 11,428 Communication and Clinical Skills 803,301 10,432 Cell Biology, Cell Metabolism 2,030,233 26,367 Nutrition, GIT, and Metabolism 3,309,369 42,979 Neuroscience, Head & Neck, Eye, Ear, Nose & Throat 2,601,254 33,783 Musculoskeletal (Parathyroid) 2,044,226 26,548 Community-Based Education and Service (COBES) 366,851 4,764 Renal, Body Fluids, Reproductive 1,884,365 24,472 Cardiorespiratory (Larynx) 2,202,083 28,598 Clinical Skills 479,583 6,228 Man, Environment, Stress Adaptation, & Disease 3,666,813 47,621 Disorders of Growth, Cardiovascular, & Respiratory 3,131,279 40,666
Disorders of Alimentary System and of Genitourinary Tract 3,131,279 40,666
Neuroendocrine, Skin, and Musculoskeletal Disorders 3,007,361 39,057 Community-Based Education and Service 3,849,150 49,989 Clinical Skills 404,152 5,249 Forensic Medicine I 239,791 3,114 Community Medicine I 159,861 2,076 Family Medicine I 911,028 11,832 Internal Medicine I 2,801,065 36,377 Obstetrics and Gynecology I 4,000,121 51,950 Psychiatry 1 4,188,354 54,394 Pediatrics I 3,117,286 40,484 General Surgery I 4,124,410 53,564 Community Medicine II 192,872 2,505 Forensic Medicine II 161,010 2,091 Surgical Specialties 2,609,728 33,893 Family Medicine II 3,528,747 45,828 Internal Medicine II 4,428,571 57,514 Obstetrics and Gynecology II 4,624,025 60,052 Pediatrics II 4,731,077 61,443 Psychiatry II 17,039,911 221,298 General Surgery II 4,072,455 52,889 Electives 0 0
Total cost 96,138,275 1,248,549
