estimating the remaining gac removal capacity for geosmin ... · estimating the remaining gac...
TRANSCRIPT

Estimating the Remaining GAC Removal Capacity
for Geosmin and MIB
by
Yi Li
A thesis submitted in conformity with the requirements
for the degree of Masters of Applied Science
Graduate Department of Civil Engineering
University of Toronto
© Copyright by Yi Li 2015

Estimating the Remaining GAC Removal Capacity for Geosmin and MIB
Yi Li
Department of Civil Engineering, University of Toronto
Degree of Masters of Applied Science
Convocation 2015
ABSTRACT
Granular activated carbon (GAC) is commonly used in drinking water treatment for the control
of seasonal taste and odour events. A challenge involving this application is the difficulty in
accurately estimating the remaining service life of an existing GAC bed. This study evaluates a
documented method that is intended to measure the removal capacity of a GAC contactor.
The method involves collecting core samples of GAC from active beds and creating “mini
columns” (10 cm lab-scale GAC columns) that are challenged with geosmin and 2-
methylisoborneol (MIB). For this study, the results of the mini column tests were compared to
those from parallel tests using pilot-scale GAC columns that were filled with core samples from
two water treatment plants. Refinements to the mini column method reported by Gillogly et al.
(1999) were examined. Overall, it was determined that mini column testing is in good agreement
with corresponding pilot-scale studies.

iii
ACKNOWLEDGMENTS
Foremost, I would like to acknowledge my supervisor, Dr. Ron Hofmann, for his inspiration and
advice on this research project, as well as on my study and life at University of Toronto. I’d also
like to thank Dr. Bob Andrews and Dr. Susan Andrews for introducing me to the Drinking Water
Research Group. It has been a great experience working with the excellent students and
professors in this research group.
My appreciation is also extended to Dr. Sarah Jane Payne, for her assistance at the initial stage of
this study; Dr. Anwar Sadmani, for his immense help in setting up the experiments; and Dr.
Gwen C. Woods, for her generous support on the GC-MS technical issues and on my thesis
writing. Thanks to Jim Wang and all my other colleagues in the DWRG for their help in the lab
and for all the technical and administrative support.
Thanks to Peel Region and Barrie city for funding this project and providing us the opportunity
to set up pilot-scale tests on site. Thanks to Dean Baker, Leo Liao, Jane Bonsteel and everyone
else at Lorne Park Water Treatment Plant and Barrie South Surface Water Treatment Plant for
their support on this research project.
My deepest gratitude is extended to my family. Thanks for their understanding, support and
encouragement while I have been studying abroad.
iv
TABLE OF CONTENTS
ABSTRACT .................................................................................................................................... i
ACKNOWLEDGMENTS ........................................................................................................... iii
TABLE .......................................................................................................................................... iv
LIST OF TABLES ...................................................................................................................... vii
LIST OF FIGURES ................................................................................................................... viii
GLOSSARY ................................................................................................................................. xi
1 INTRODUCTION AND RESEARCH OBJECTIVES ..................................................... 1
1.1 Research objectives .......................................................................................................... 2
1.2 Description of chapters..................................................................................................... 2
1.3 References ........................................................................................................................ 3
2 LITERATURE REVIEW .................................................................................................... 4
2.1 Fundamentals of geosmin and MIB ................................................................................. 4
2.1.1 Taste and odour issues in drinking water .................................................................. 4
2.1.2 Treatment technologies ............................................................................................. 5
2.2 Application of GAC contactor for taste and odour control .............................................. 5
2.2.1 Adsorption of geosmin and MIB by activated carbon .............................................. 5
2.2.2 Effect of NOM in source water ................................................................................. 7
2.2.3 Reaction between H2O2 and GAC ............................................................................ 7
2.2.4 GAC contactors with biological activity................................................................... 8
2.3 Available methods for estimating remaining GAC removal capacity ............................. 8
2.3.1 Pilot-scale evaluation ................................................................................................ 8
2.3.2 Bench-scale evaluation ............................................................................................. 9
2.3.2.1 Isotherm test ...................................................................................................... 9
2.3.2.2 Rapid small scale column test ........................................................................... 9
2.3.2.3 Mini column test .............................................................................................. 10
2.4 References ...................................................................................................................... 11
3 COMPARISON OF BENCH-SCALE AND PILOT-SCALE TESTS FOR
ESTIMATING TASTE AND ODOUR REMOVAL ............................................................... 14
3.1 Introduction .................................................................................................................... 15
3.2 Objective ........................................................................................................................ 16

v
3.3 Materials and methods ................................................................................................... 17
3.3.1 Water Source and site description........................................................................... 17
3.3.2 Chemicals and reagents........................................................................................... 18
3.3.3 Pilot-scale experiments ........................................................................................... 18
3.3.4 Bench-scale experiments ........................................................................................ 20
3.4 Results and discussion .................................................................................................... 22
3.4.1 Determining the operating time for pilot- and bench-scale column tests ............... 22
3.4.1.1 Pilot-scale column test ..................................................................................... 22
3.4.1.2 Bench-scale column test .................................................................................. 24
3.4.2 Pilot-scale study ...................................................................................................... 26
3.4.2.1 Effect of GAC age ........................................................................................... 26
3.4.2.2 Effect of exposure to H2O2 .............................................................................. 28
3.4.3 Bench-scale study ................................................................................................... 29
3.4.3.1 Effect of mini column diameter and sieve method .......................................... 29
3.4.3.2 Effect of GAC storage ..................................................................................... 33
3.4.3.3 Application of mini column tests to evaluate GAC performance ................... 35
3.4.4 Comparison of bench-scale and pilot-scale studies ................................................ 36
3.4.4.1 GAC from Lorne Park water treatment plant .................................................. 36
3.4.4.2 GAC from the Barrie water treatment plant .................................................... 38
3.5 Summary and conclusions .............................................................................................. 39
3.6 References ...................................................................................................................... 41
4 RECOMMENDATIONS FOR FUTURE WORK........................................................... 42
4.1 References ...................................................................................................................... 43
A. PRELIMINARY TESTS .................................................................................................. A-1
A.1 Determining GAC particle size distribution by dry sieve test ......................................... A-1
A.1.1 Equipment ............................................................................................................. A-1
A.1.2 Sample Preparation ............................................................................................... A-1
A.2 Determining GAC particle size distribution by wet sieve test ......................................... A-3
B. SUPPLEMENTARY DATA FOR CHAPTER 3 ........................................................... B-1
B.1 Effect of column diameter and sieving methods .......................................................... B-1
B.2 Pilot tests with different aged GAC from Lorne Park WTP ........................................ B-2

vi
B.3 Pilot and mini column tests conducted on site at Lorne Park WTP ............................. B-3
B.4 Pilot column test at Barrie SSWTP .............................................................................. B-4
C. TASTE AND ODOUR COMPOUND ANALYTICAL METHODS ........................... C-1
C.1 Principle ....................................................................................................................... C-1
C.2 Reagents ....................................................................................................................... C-2
C.3 Method outline ............................................................................................................. C-2
C.3.1 Sampling and Storage ........................................................................................... C-2
C.3.2 Geosmin and MIB solution preparation for spiking influent water (Micro-Column
Tests, Milli-Q® water based, 1mg/L) ................................................................................. C-2
C.3.3 Geosmin and MIB solution preparation for GC/MS analysis (methanol based) .. C-3
C.4 GC/MS operation ......................................................................................................... C-4
C.5 Calculations .................................................................................................................. C-5
C.6 References .................................................................................................................... C-5
D. QA/QC ............................................................................................................................... D-1
D.1 Calibration curves ........................................................................................................ D-1
D.2 Check standards............................................................................................................ D-2
D.3 Method detection limit ................................................................................................. D-3
D.4 Blank test with mini columns ....................................................................................... D-4

vii
LIST OF TABLES
Table 2.1: Chemical/physical characteristics of MIB and geosmin (Pirbazari et al. 1992) ............ 6
Table 3.1: GAC contactor parameters at LPWTP and BSSWTP ................................................. 18
Table 3.2: Conditions of the pilot scale column tests at LPWTP and BSSWTP .......................... 19
Table 3.3: Two-way ANOVA results of (a) MIB and (b) geosmin for the effect of column ID
and sieve method .......................................................................................................... 32
Table 3.4: Results of two-tailed t-test assuming unequal variance to compare the pilot-scale
test to each mini column test ........................................................................................ 32
Table C. 1: Reagents needed for MIB and geosmin analysis ..................................................... C-2
Table C. 2: GC/MS operation conditions ................................................................................... C-4
Table C. 3: Parameters of the MS scan for determining taste and odour compounds ................ C-4
Table D. 1: Calculation of method detection limit for geosmin and MIB .................................. D-4

viii
LIST OF FIGURES
Figure 3.1: Experimental setup to determine the effect of column diameter and sieving method
for mini column test ..................................................................................................... 21
Figure 3.2: Breakthrough of (a) MIB and (b) geosmin from pilot-scale trial at Lorne Park WTP
to compare three different operating modes over 25 hours .......................................... 23
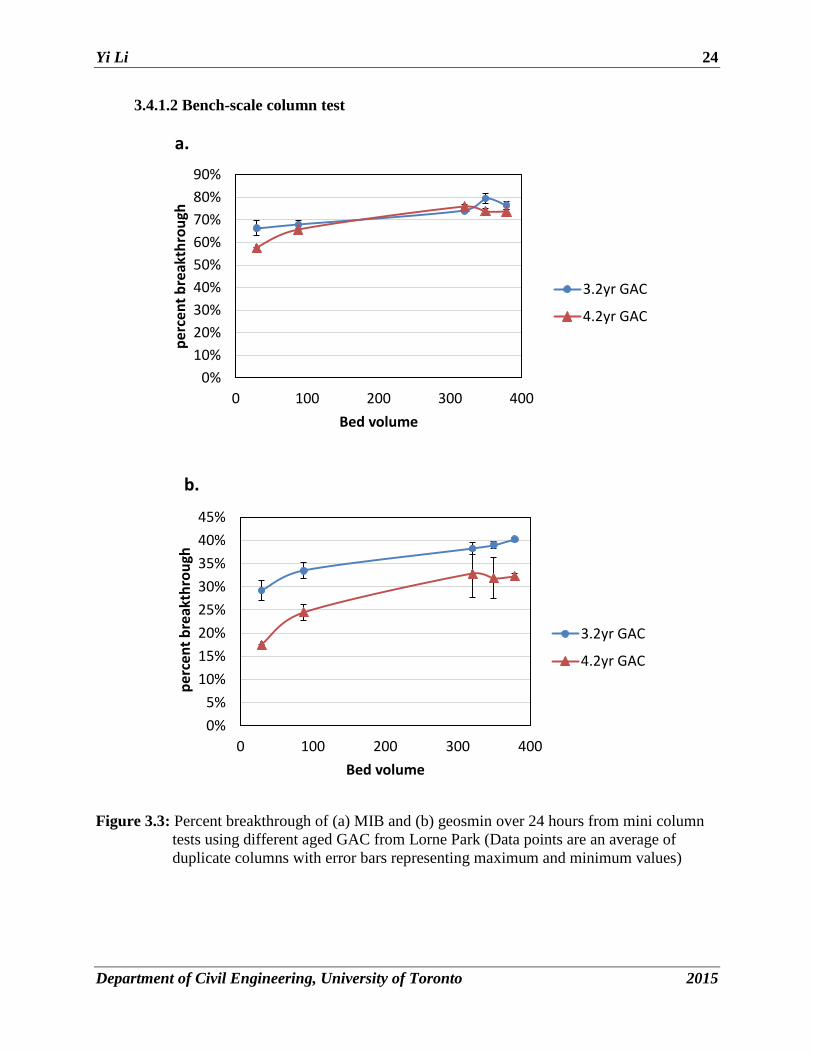
Figure 3.3: Percent breakthrough of (a) MIB and (b) geosmin over 24 hours from mini column
tests using different aged GAC from Lorne Park (Data points are an average of
duplicate columns with error bars representing maximum and minimum values) ...... 24
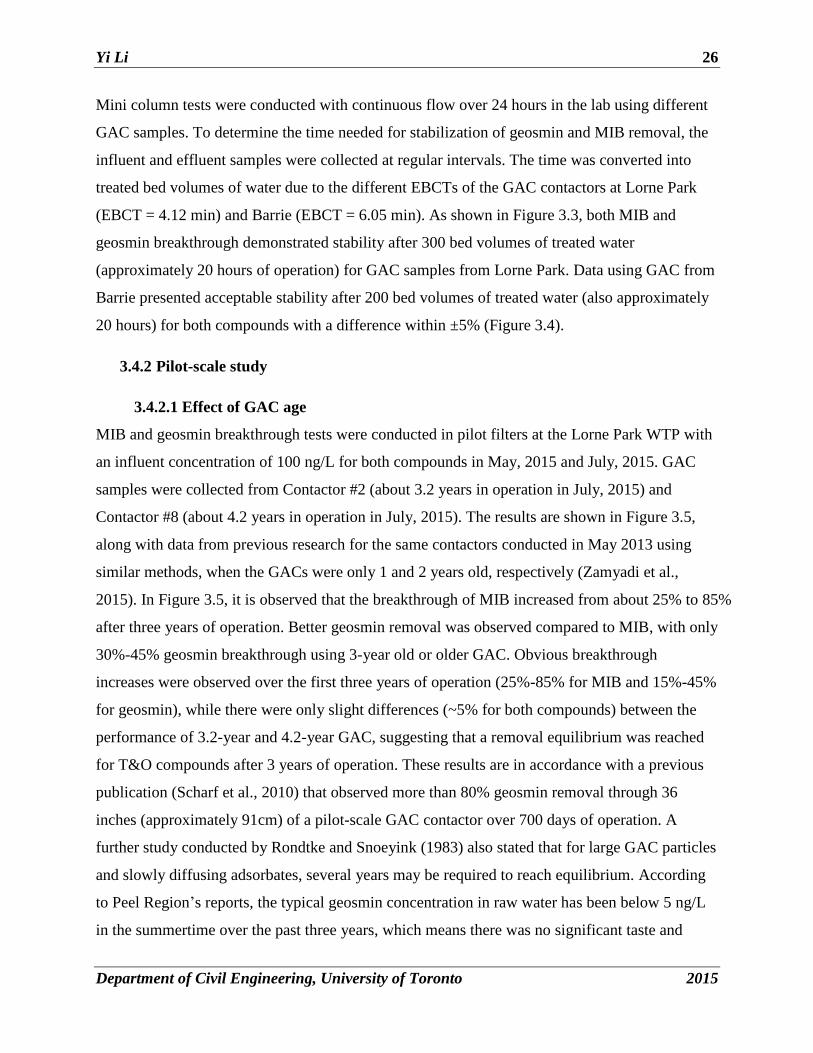
Figure 3.4: Percent breakthrough of (a) MIB and (b) geosmin over 24 hours from mini column
tests using GAC from Barrie with particle size of 2.36 mm (sieve #8) and 2 mm
(sieve #10) (Data points are an average of duplicate columns with error bars
representing maximum and minimum values) ............................................................. 25
Figure 3.5: Pilot-scale breakthrough results of MIB and geosmin at Lorne Park, using GAC
with different ages. (Error bars represent max/min values of 3 replicates collected
from one pilot-filter after 20 hours) ............................................................................. 27
Figure 3.6: Comparison of pilot-scale breakthrough of MIB and geosmin using aged GAC at
Lorne Park in 2015 (Error bars represent max/min values of 3 replicates collected
from one pilot-filter after 20 hours) ............................................................................. 29
Figure 3.7 Breakthrough of MIB and geosmin from pilot filter and mini column filters with
different internal diameters and sieve methods (Error bars on mini column filters
represent max/min values of stabilized effluent breakthrough of samples collected
after 16 hours from duplicate columns) ....................................................................... 31
Figure 3.8 Effect of storage on GAC performance for (a) MIB and (b)geosmin removal using
stored and freshly collected GAC from Lorne Park in mini column tests with
comparison to parallel pilot-scale study (Error bars represent max/min values of
stabilized breakthrough after 20 hours)........................................................................ 34
Figure 3.9: Average stabilized breakthrough of MIB and geosmin from mini column tests
using 3.2-year and 4.2-year GAC from Lorne Park WTP (Error bars represent
max/min values of stabilized replicates collected from duplicate mini columns for
each GAC age after 20 hours) ...................................................................................... 35

ix
Figure 3.10 Breakthrough of (a) MIB and (b) geosmin from pilot and mini column tests using
two differently-aged GACs from the Lorne Park WTP in July, 2015 (Error bars
represent max/min values of stabilized replicates collected from over 20 hours) ....... 37
Figure 3.11: Breakthrough of MIB and geosmin from pilot and mini column tests with 3.2
year-old GAC from the Lorne Park WTP after exposure to H2O2 in August, 2015
(Error bars represent max/min values of stabilized replicates collected from one
pilot-filer over 20 hours) .............................................................................................. 38
Figure 3.12 Average breakthrough of MIB and geosmin from pilot and mini column tests
using aged GAC from Barrie SSWTP (Error bars represent max/min values of
stabilized replicates collected at over 20 hours) .......................................................... 39
Figure A. 1: Particle size distribution of dry GAC samples from Lorne Park WTP .................. A-2
Figure A. 2: Particle size distribution of dry GAC samples from Barrie SSWTP...................... A-2
Figure A. 3: Particle size distribution of wet GAC from Lorne Park WTP................................ A-3
Figure A. 4: Particle size distribution of wet GAC from Barrie SSWTP ................................... A-4
Figure B. 1: Breakthrough of (a) MIB and (b) geosmin over time through mini columns with
varying column diameters and sieving methods (error bars represent the max/min
value of replicate samples collected from duplicate columns) .................................. B-1
Figure B. 2: Breakthrough of (a) MIB and (b) geosmin over time through pilot filters using
3.2-year and 4.2-year aged GAC at Lorne Park WTP ............................................... B-2
Figure B. 3 Breakthrough of (a) MIB and (b)geosmin over time from pilot and mini column
tests conducted at the same time at Lorne Park WTP (error bars represent the
max/min value of samples from duplicate mini columns) ......................................... B-3
Figure B. 4 Breakthrough of MIB over time through the pilot filter at Barrie (Geosmin
breakthrough from this pilot filter was under the detection limit) (Error bars
represent the max/min value of samples from duplicate pilot filters) ........................ B-4
Figure D. 1: An example of calibration curves for geosmin and MIB ....................................... D-1
Figure D. 2: Quality control chart for (a) MIB and (b) geosmin ................................................ D-3

x
Figure D. 3: Breakthrough of (a) MIB and (b) geosmin over 8 hours through blank mini
column systems packed with glass beads (error bars represent the max/min values of
samples from duplicate columns) .............................................................................. D-5

xi
GLOSSARY
C degrees Celsius
ANOVA analysis of variance
AOP advanced oxidation process
CD constant diffusivity
Cl2 chloride
ClO2 chlorine dioxide
DFPSDM dispersed flow pore surface diffusion model
EBCT empty bed contact time
GAC granular activated carbon
H2O2 hydrogen peroxide
ID Inner/internal diameter
KMnO4 potassium permanganate
MIB 2-methylisoborneol
MLD millions of liter per day
NaCl sodium chloride
NOM natural organic matter
OTC odour threshold concentration
PAC powdered activated carbon
PD proportion diffusivity
RSSCT rapid small scale column test
SPME solid phase micro extraction
SSWTP south surface water treatment plant
T&O taste and odour
TOC total organic carbon
UF ultrafiltration
UV/H2O2 ultraviolet with hydrogen peroxide
WTP water treatment plant

Yi Li 1
Department of Civil Engineering, University of Toronto 2015
1 INTRODUCTION AND RESEARCH OBJECTIVES
Taste and odour (T&O) in drinking water is a common seasonal issue for many water treatment
facilities around the world. Though the presence of taste and odour-causing compounds is often
not associated with health effects, it can decrease consumer trust and generate issues for water
utilities’ public relations. Two frequently identified compounds are geosmin (trans-1,10-
dimethyl-trans-9 decalol: C12H22O) and MIB (2-methyl isoborneol: C11H20O). The lowest
detected concentration of these two compounds by human senses ranges from about 4 to 20 ng/L
(Young et al. 1996). Since it is difficult to eliminate these compounds by conventional treatment,
more advanced technologies are frequently applied for T&O removal including powdered
activated carbon (PAC), granular activated carbon (GAC), biofiltration, and advanced oxidation
processes (AOPs). In Ontario, GAC filters are commonly used in drinking water treatment plants.
One difficulty facing water utilities with GAC contactors is the ability to accurately estimate the
remaining removal capacity of an existing GAC bed for geosmin and MIB. Pilot-scale column
tests are considered a useful proxy for simulating full-scale contactors, and have been conducted
in several previous studies (Gillogly et al. 1999, Ndiongue et al. 2006, Ho and Newcombe 2010).
The pilot-scale studies, however, are often costly and labor intensive. Laboratory-scale tests
including iodine number tests, adsorption isotherm tests and rapid small scale column tests
(RSSCT) are commonly employed to characterize GAC particles, yet they are not designed for
nor appropriate for predicting the removal efficiency for taste and odour compounds with used
GAC. Thus, there is a need to explore or verify other bench-scale approaches for the purpose of
predicting GAC performance for T&O removal.
Gillogly et al. (1999) previously developed a mini column test that was intended to predict the
remaining service life of a GAC contactor for taste and odour compounds. A later study by Ho et
al. (2010), however, reported that there were inherent limitations with this mini column method,
and it was argued that larger laboratory columns were able to more accurately simulate the pilot-
scale filters. This current study was designed to validate Gillogly and Ho’s work, and to further
explore the impacts of column diameter and sieving method on the experimental results. The
effectiveness of mini column tests for predicting the removal of taste and odour compounds from
aged GAC was assessed by comparing the results to pilot-scale experiments.

Yi Li 2
Department of Civil Engineering, University of Toronto 2015
1.1 RESEARCH OBJECTIVES
The primary objective of this study was to develop a protocol for applying mini column tests on
a routine basis to track granular activated carbon (GAC) performance. The detailed objectives
were as follows:
1. To estimate the remaining taste and odour removal efficiencies with different types of
GACs using pilot column tests
2. To optimize the design of mini column experiments, specifically column diameter and
the sieving method used
3. To investigate the feasibility of using mini column tests to simulate pilot-scale filters
4. To develop a protocol for applying mini column tests on a routine basis to track GAC
performance and to predict the remaining service life
1.2 DESCRIPTION OF CHAPTERS
Chapter 2 provides information about previous research related to this study, including a
background of taste and odour issues and the application of GAC for water treatment, and
available methods applicable for estimating the remaining removal capacity of partially spent
GAC for taste and odour compounds.
Chapter 3 evaluates different types of GAC with varied ages from two water treatment plants
using pilot-scale column tests for taste and odour compound removal, and further examines the
mini column tests as a potential option to simulate pilot filters for taste and odour compound
removal.
Chapter 4 summarizes significant findings from this study and provides recommendations for
future research.

Yi Li 3
Department of Civil Engineering, University of Toronto 2015
1.3 REFERENCES
Gillogly, T.E.T., Snoeyink, V.L., Vogel, J.C., Wilson, C.M. and Royal, E.P. (1999) Determining
GAC bed life. Journal of the American Water Works Association 91(8), 98.
Ho, L. and Newcombe, G. (2010) Granular activated carbon adsorption of 2-methylisoborneol
(MIB): pilot-and laboratory-scale evaluations. Journal of Environmental Engineering 136(9),
965-974.
Ndiongue, S., Anderson, W.B., Tadwalkar, A., Rudnickas, J., Lin, M. and Huck, P.M. (2006)
Using pilot-scale investigations to estimate the remaining geosmin and MIB removal capacity of
full-scale GAC-capped drinking water filters. Water Quality Research Journal of Canada 41(3),
296-306.
Young, W.F., Horth, H., Crane, R., Ogden, T. and Arnott, M. (1996) Taste and odour threshold
concentrations of potential potable water contaminants. Water Research 30(2), 331-340.
Yi Li 4
Department of Civil Engineering, University of Toronto 2015
2 LITERATURE REVIEW
2.1 FUNDAMENTALS OF GEOSMIN AND MIB
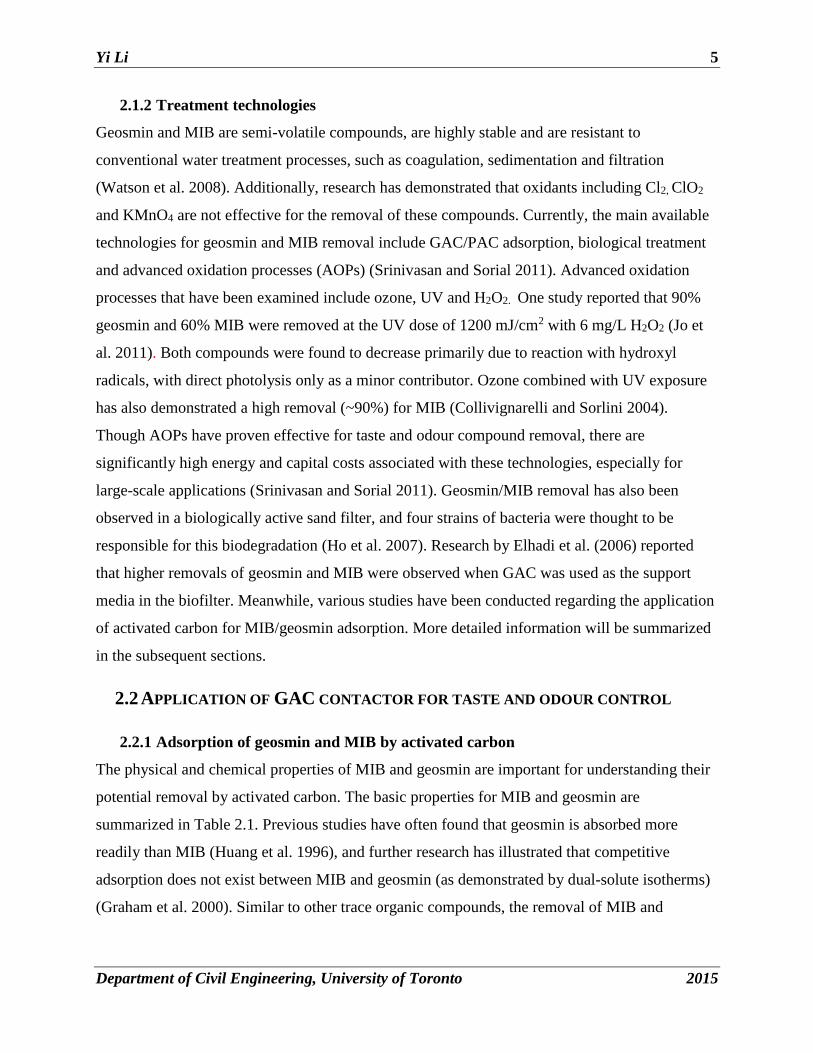
2.1.1 Taste and odour issues in drinking water
Taste and odour compounds that occur in drinking water can distort consumers’ perceptions
about the safety of their tap water. Two earthy-, muddy-smelling trace organic compounds,
geosmin and 2-methylisoborneol (MIB), are among the most prevalent taste and odour–causing
compounds in drinking water. Taste and odour episodes are widely spread throughout the Great
Lakes region, as was demonstrated by a survey of ~59 Great Lakes drinking water treatment
facilities that found that ~20% of utilities reported annual T&O outbreaks and 27% experienced
erratic episodes (Watson et al. 2008). Studies have shown that the majority of T&O outbreaks
occur during summertime or fall when biological activity is more prevalent (Rao et al. 2003).
Geosmin and MIB are synthesized by a select number of cyanobacteria, actinomycetes,
myxobacteria, fungi and other soil microbiota. Most of the MIB and geosmin are produced
during algal growth and retained within algal cells which subsequently release the odorants at
varying growth phases such as senescence, death or with changes in environmental factors
(Srinivasan and Sorial 2011, Watson et al. 2008).
Geosmin and MIB have relatively low odour threshold concentrations (OTCs), ranging from ~4-
20 ng/L (Young et al. 1996), and can cause customer complaints. Currently, no uniform standard
or guideline defines the acceptable taste and odour levels for water treatment facilities,
presumably since studies have shown that the presence of geosmin and MIB is not associated
with known health effects. In Canada, only subjective guidelines have been established for taste
and odour by various provinces. Ontario, for example, has set an aesthetic guideline which
indicates that taste and odour compounds should not be high enough to make drinking water
offensive. Such guidelines are vague, non-quantitative, and tend to rely on customer complaints
as an indication for action (Watson et al. 2008). Accordingly, utilities would greatly benefit by
better understanding the removal capacity of their GAC contactors and subsequently avoiding
significant taste and odour events (Srinivasan and Sorial 2011).
Yi Li 5
Department of Civil Engineering, University of Toronto 2015
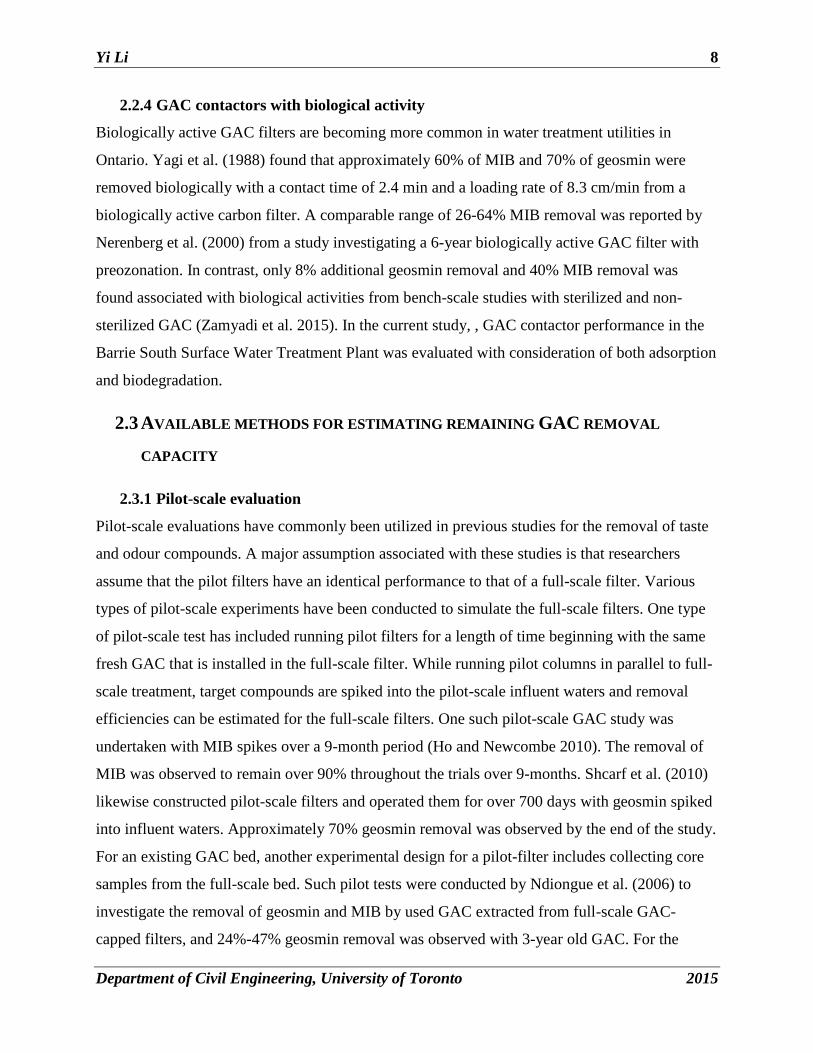
2.1.2 Treatment technologies
Geosmin and MIB are semi-volatile compounds, are highly stable and are resistant to
conventional water treatment processes, such as coagulation, sedimentation and filtration
(Watson et al. 2008). Additionally, research has demonstrated that oxidants including Cl2, ClO2
and KMnO4 are not effective for the removal of these compounds. Currently, the main available
technologies for geosmin and MIB removal include GAC/PAC adsorption, biological treatment
and advanced oxidation processes (AOPs) (Srinivasan and Sorial 2011). Advanced oxidation
processes that have been examined include ozone, UV and H2O2. One study reported that 90%
geosmin and 60% MIB were removed at the UV dose of 1200 mJ/cm2 with 6 mg/L H2O2 (Jo et
al. 2011). Both compounds were found to decrease primarily due to reaction with hydroxyl
radicals, with direct photolysis only as a minor contributor. Ozone combined with UV exposure
has also demonstrated a high removal (~90%) for MIB (Collivignarelli and Sorlini 2004).
Though AOPs have proven effective for taste and odour compound removal, there are
significantly high energy and capital costs associated with these technologies, especially for
large-scale applications (Srinivasan and Sorial 2011). Geosmin/MIB removal has also been
observed in a biologically active sand filter, and four strains of bacteria were thought to be
responsible for this biodegradation (Ho et al. 2007). Research by Elhadi et al. (2006) reported
that higher removals of geosmin and MIB were observed when GAC was used as the support
media in the biofilter. Meanwhile, various studies have been conducted regarding the application
of activated carbon for MIB/geosmin adsorption. More detailed information will be summarized
in the subsequent sections.
2.2 APPLICATION OF GAC CONTACTOR FOR TASTE AND ODOUR CONTROL
2.2.1 Adsorption of geosmin and MIB by activated carbon
The physical and chemical properties of MIB and geosmin are important for understanding their
potential removal by activated carbon. The basic properties for MIB and geosmin are
summarized in Table 2.1. Previous studies have often found that geosmin is absorbed more
readily than MIB (Huang et al. 1996), and further research has illustrated that competitive
adsorption does not exist between MIB and geosmin (as demonstrated by dual-solute isotherms)
(Graham et al. 2000). Similar to other trace organic compounds, the removal of MIB and

Yi Li 6
Department of Civil Engineering, University of Toronto 2015
geosmin in natural water is independent of their initial concentrations in the range of 50-200
ng/L (Graham et al. 2000, Summers et al. 2013).
Ridal et al. (2001) monitored the performance of a GAC-capped filter for taste and odour control
in a full-scale water treatment plant over a 2 year period (1998-1999). It was reported that an
average of 60% of MIB and 80% of geosmin was removed from the source water after 2 and 12
months of filter operation, and that reduced efficiencies were observed for both MIB (15%) and
geosmin (54%) after 24 months of operation. The authors suggested that longer contact time and
higher chlorine residuals are important factors necessary to maximize the removal efficiency for
a GAC-capped filter. In contrast, other studies have indicated that low chlorine residual is
preferable to improve the efficiency of GAC/PAC removal of MIB (Gillogly et al. 1999,
Nerenberg et al. 2000). The varying conclusions from these studies demonstrate that other
factors are likely to have an impact on GAC performance.
Table 2.1: Chemical/physical characteristics of MIB and geosmin (Pirbazari et al. 1992)
Parameter MIB Geosmin
Molecular formula C11H20O C12H22O
Molecular weight (g/mol) 168 182
Boiling point (˚C) 197 165
Aqueous solubility (mg/L) 195 150
Kow 3.13 3.70
Henry’s Law constant
(atm m3/mol) 5.76 ×10⁻⁵ 6.66×10⁻⁵
Structure

Yi Li 7
Department of Civil Engineering, University of Toronto 2015
2.2.2 Effect of NOM in source water
A major challenge associated with the removal of taste and odour compounds is the presence of
natural organic matter (NOM), which is a complex mixture of organic compounds and invariably
present in all water sources at much higher concentrations than MIB and geosmin (Srinivasan
and Sorial 2011).Various studies have examined the effect of NOM in source waters, and have
provided evidence that NOM significantly reduces the adsorption capacity for geosmin/MIB
(Newcombe et al. 2002, Cook et al. 2001, Summers et al. 2013). Newcombe et al. (2002)
investigated the removal of MIB on six different types of activated carbon in the presence of six
well-characterized NOM solutions. The authors concluded that low-molecular-weight NOM
effectively competes with MIB for adsorption sites, while larger NOM constituents reduce the
equilibrium adsorption capacity by pore blockage and/or restriction. The pore size-to-volume
ratio of GAC particles was thought to be the main characteristic impacting the simultaneous
adsorption of NOM and MIB.
2.2.3 Reaction between H2O2 and GAC
Water treatment facilities have been combining various technologies to enhance taste and odour
control in drinking water (Srinivasan and Sorial 2011). Different water treatment processes
combined with GAC can significantly affect the filter performance. The two water treatment
utilities studied in this research have treatment trains that include GAC to quench H2O2, and
GAC with very high biological activity, respectively. These two factors presumably have an
impact on the GAC performance, and as such findings from previous studies were investigated.
There are few papers evaluating the effect of H2O2 on GAC for T&O removal, yet the reaction
between H2O2 and GAC was examined in several studies (Li 2013). Li (2013) summarized that
reactions between H2O2 on GAC occur either by generating •OH radicals and •OOH radicals as
intermediates, or by transferring functional groups between GAC and H2O2 on the GAC surface
in a basic medium. •OH radicals can destroy taste and odour compounds, thus changing the GAC
performance for MIB/geosmin removal. The alteration of functional groups on GAC surface also
potentially affects the adsorption of taste and odour compounds. This current study discusses the
observed impact of H2O2 on GAC performance at the Lorne Park Water Treatment Plant.
Yi Li 8
Department of Civil Engineering, University of Toronto 2015
2.2.4 GAC contactors with biological activity
Biologically active GAC filters are becoming more common in water treatment utilities in
Ontario. Yagi et al. (1988) found that approximately 60% of MIB and 70% of geosmin were
removed biologically with a contact time of 2.4 min and a loading rate of 8.3 cm/min from a
biologically active carbon filter. A comparable range of 26-64% MIB removal was reported by
Nerenberg et al. (2000) from a study investigating a 6-year biologically active GAC filter with
preozonation. In contrast, only 8% additional geosmin removal and 40% MIB removal was
found associated with biological activities from bench-scale studies with sterilized and non-
sterilized GAC (Zamyadi et al. 2015). In the current study, , GAC contactor performance in the
Barrie South Surface Water Treatment Plant was evaluated with consideration of both adsorption
and biodegradation.
2.3 AVAILABLE METHODS FOR ESTIMATING REMAINING GAC REMOVAL
CAPACITY
2.3.1 Pilot-scale evaluation
Pilot-scale evaluations have commonly been utilized in previous studies for the removal of taste
and odour compounds. A major assumption associated with these studies is that researchers
assume that the pilot filters have an identical performance to that of a full-scale filter. Various
types of pilot-scale experiments have been conducted to simulate the full-scale filters. One type
of pilot-scale test has included running pilot filters for a length of time beginning with the same
fresh GAC that is installed in the full-scale filter. While running pilot columns in parallel to full-
scale treatment, target compounds are spiked into the pilot-scale influent waters and removal
efficiencies can be estimated for the full-scale filters. One such pilot-scale GAC study was
undertaken with MIB spikes over a 9-month period (Ho and Newcombe 2010). The removal of
MIB was observed to remain over 90% throughout the trials over 9-months. Shcarf et al. (2010)
likewise constructed pilot-scale filters and operated them for over 700 days with geosmin spiked
into influent waters. Approximately 70% geosmin removal was observed by the end of the study.
For an existing GAC bed, another experimental design for a pilot-filter includes collecting core
samples from the full-scale bed. Such pilot tests were conducted by Ndiongue et al. (2006) to
investigate the removal of geosmin and MIB by used GAC extracted from full-scale GAC-
capped filters, and 24%-47% geosmin removal was observed with 3-year old GAC. For the

Yi Li 9
Department of Civil Engineering, University of Toronto 2015
current study, similar pilot-scale breakthrough tests were conducted using the GAC core samples
collected from the full-scale filters.
2.3.2 Bench-scale evaluation
2.3.2.1 Isotherm test
In water treatment applications, the amount of adsorbate adsorbed on to a carbon is usually a
function of its concentration in the aqueous-phase, and this relationship is known as an
“isotherm”. The bottle point technique (Randtke and Snoeyink 1983) was used by previous
studies to determine the adsorption capacity of activated carbon for certain contaminant removal.
Prewighed oven dried GAC samples were added into Schott bottles with water samples spiked
with MIB/geosmin at a target concentration. Headspace-free bottles were agitated on a shaker
until equilibrium was reached (Ho and Newcombe 2010). Virgin GAC was usually crushed into
smaller particle sizes to achieve equilibrium within a short period of time. For partially spent
GAC, however, crushing could result in opening of previously blocked pores, overestimating the
adsorption capacity (Ho and Newcombe 2010). As reported by Gillogly et al. (1999) and Ho and
Newcombe (2010), preloaded GAC needs to take approximately 120 days to reach equilibrium.
Freundlich and linear isotherm models were the common adsorption models applied for
evaluating geosmin and MIB removal. Adsorption isotherm parameters were used to predict the
bed life for a GAC filter (Scharf et al. 2010), but the authors concluded that this approach was
not able to accurately predict expected performance with confidence.
2.3.2.2 Rapid small scale column test
The rapid small scale column test (RSSCT) is a commonly used bench-scale method for the
assessment of GAC performance (Summers et al., 2013). The GAC particles are crushed into
small sizes with a scaling factor to accelerate the GAC aging process. A dispersed flow pore
surface diffusion model (DFPSDM) is used to derive the design equations (Knappe et al. 1997).
Two design approaches with proportion diffusivity (PD) or constant diffusivity (CD) need to be
selected prior to the test. Dissolved organic matter has been shown to be appropriately described
by the PD design, in which the internal diffusion coefficient decreases linearly with GAC
particle size (Summers et al. 2013). In contrary, CD design was shown to better describe the
removal of trace organic compounds including geosmin, MIB and atrazine (Corwin et al. 2010,
Knappe et al. 1997). A study by Knappe et al. (1997) demonstrated that RSSCTs successfully

Yi Li 10
Department of Civil Engineering, University of Toronto 2015
simulated atrazine removal over large-scale operating time of 3.5-7 months with virgin GAC,
while the atrazine removal by preloaded GAC was significantly overestimated. The authors
suggested that RSSCTs could be most useful for predicting the initial performance of adsorbers
containing fresh GAC. However, this method is not able to evaluate the performance of the
partially spent GAC (Gillogly et al., 1999).
2.3.2.3 Mini column test
Since neither isotherm test nor RSSCT was able to evaluate the GAC performance from an
existing GAC bed, another bench-scale approach called a mini column test has been developed
by Knappe et al. (1999) and Gillogly et al. (1999), aiming at determining the kinetic parameters
to describe the rate of adsorption of atrazine and MIB, respectively. This method involved
collecting core samples of GAC from active full-scale contactors and creating “mini columns” (1
cm lab-scale GAC columns) that are challenged with the target contaminant. Gillogly et al. (1999)
further reported that the mini column test was able to yield identical MIB breakthrough as that
from a pilot-scale filter, and presumably as a full-scale contactor. However, a later study by Ho
and Newcombe (2010) reported that the mini column test could not predict MIB breakthrough in
the pilot-scale trials. In particular, the small volume of GAC used and high filtration rates
employed were identified as shortcomings, since 90% breakthrough of MIB after 6-month
operation was predicted by the mini column test, while only 30% breakthrough was observed in
pilot-study. A modified mini column test was conducted by Ho and Newcombe (2010) using
larger laboratory columns with higher GAC bed depth (15 cm GAC in columns with an internal
diameter of 25 mm), and it was reported that larger GAC columns were able to more accurately
simulate the pilot-scale filters.

Yi Li 11
Department of Civil Engineering, University of Toronto 2015
2.4 REFERENCES
Collivignarelli, C. and Sorlini, S. (2004) AOPs with ozone and UV radiation in drinking water:
contaminants removal and effects on disinfection byproducts formation. Water Science &
Technology 49(4), 51-56.
Cook, D., Newcombe, G. and Sztajnbok, P. (2001) The application of powdered activated carbon
for MIB and geosmin removal: predicting PAC doses in four raw waters. Water Research 35(5),
1325-1333.
Corwin, C.J. and Summers, R.S. (2011) Adsorption and desorption of trace organic contaminants
from granular activated carbon adsorbers after intermittent loading and throughout backwash
cycles. Water Research 45(2), 417-426.
Elhadi, S.L.N., Huck, P.M. and Slawson, R.M. (2006) Factors affecting the removal of geosmin
and MIB in drinking water biofilters. Journal of the American Water Works Association 98(8),
108-119.
Gillogly, T.E.T., Snoeyink, V.L., Vogel, J.C., Wilson, C.M. and Royal, E.P. (1999) Determining
GAC bed life. Journal of the American Water Works Association 91(8), 98.
Graham, M., Summers, R., Simpson, M. and MacLeod, B. (2000) Modeling equilibrium
adsorption of 2-methylisoborneol and geosmin in natural waters. Water Research 34(8), 2291-
2300.
Ho, L. and Newcombe, G. (2010) Granular activated carbon adsorption of 2-methylisoborneol
(MIB): pilot-and laboratory-scale evaluations. Journal of Environmental Engineering 136(9),
965-974.
Ho, L., Hoefel, D., Bock, F., Saint, C.P. and Newcombe, G. (2007) Biodegradation rates of 2-
methylisoborneol (MIB) and geosmin through sand filters and in bioreactors. Chemosphere
66(11), 2210-2218.
Huang, C., Van Benschoten, J.E. and Jensen, J.N. (1996) Adsorption kinetics of MIB and
geosmin. Journal of the American Water Works Association 88(4), 116.
Jo, C.H., Dietrich, A.M. and Tanko, J.M. (2011) Simultaneous degradation of disinfection
byproducts and earthy-musty odorants by the UV/H2O2 advanced oxidation process. Water
Research 45(8), 2507-2516.
Knappe, D.R., Snoeyink, V.L., Roche, P., Prados, M.J. and Bourbigot, M.-M. (1997) The effect
of preloading on rapid small-scale column test predictions of atrazine removal by GAC
adsorbers. Water Research 31(11), 2899-2909.

Yi Li 12
Department of Civil Engineering, University of Toronto 2015
Knappe, D.R.U., Snoeyink, V.L., Roche, P., Prados, M.J. and Marie-Marguerite, B. (1999)
Atrazine removal by preloaded GAC. Journal of the American Water Works Association 91(10),
97.
Li, J. (2013) Quenching H2O2 Residuals After UV/H2O2 Drinking Water Treatment Using
Granular Activated Carbon. MASc Thesis. University of Toronto.
Ndiongue, S., Anderson, W.B., Tadwalkar, A., Rudnickas, J., Lin, M. and Huck, P.M. (2006)
Using pilot-scale investigations to estimate the remaining geosmin and MIB removal capacity of
full-scale GAC-capped drinking water filters. Water Quality Research Journal of Canada 41(3),
296-306.
Nerenberg, R., Rittmann, B.E. and Soucie, W.J. (2000) Ozone/biofiltration for removing MIB
and geosmin. Journal of the American Water Works Association 92(12), 85-95.
Newcombe, G., Morrison, J., Hepplewhite, C. and Knappe, D. (2002) Simultaneous adsorption
of MIB and NOM onto activated carbon: II. Competitive effects. Carbon 40(12), 2147-2156.
Pirbazari, M., Borow, H., Craig, S., Ravindran, V. and McGuire, M. (1992) Physical chemical
characterization of five earthy-musty-smelling compounds. Water Science & Technology 25(2),
81-88.
Randtke, S.J. and Vernon, L.S. (1983) Evaluating GAC adsorptive capacity. Journal of the
American Water Works Association 75(8), 406-413.
Rao, Y.R., Skafel, M.G., Howell, T. and Murthy, R.C. (2003) Physical processes controlling
taste and odor episodes in Lake Ontario drinking water. Journal of Great Lakes Research 29(1),
70-78.
Ridal, J., Brownlee, B., McKenna, G. and Levac, N. (2001) Removal of taste and odour
compounds by conventional granular activated carbon filtration. Water Quality Research Journal
of Canada 36(1), 43-54.
Scharf, R.G., Johnston, R.W., Semmens, M.J. and Hozalski, R.M. (2010) Comparison of batch
sorption tests, pilot studies, and modeling for estimating GAC bed life. Water Research 44(3),
769-780.
Srinivasan, R. and Sorial, G.A. (2011) Treatment of taste and odor causing compounds 2-methyl
isoborneol and geosmin in drinking water: A critical review. Journal of Environmental Sciences
23(1), 1-13.
Summers, R.S., Kim, S.M., Shimabuku, K., Chae, S.-H. and Corwin, C.J. (2013) Granular
activated carbon adsorption of MIB in the presence of dissolved organic matter. Water Research
47(10), 3507-3513.
Yi Li 13
Department of Civil Engineering, University of Toronto 2015
Watson, S.B., Ridal, J. and Boyer, G.L. (2008) Taste and odour and cyanobacterial toxins:
impairment, prediction, and management in the Great Lakes. Canadian Journal of Fisheries and
Aquatic Sciences 65(8), 1779-1796.
Yagi, M., Nakashima, S. and Muramoto, S. (1988) Biological degradation of musty odor
compounds, 2-methylisoborneol and geosmin, in a bio-activated carbon filter. Water Science &
Technology 20(8-9), 255-260.
Young, W.F., Horth, H., Crane, R., Ogden, T. and Arnott, M. (1996) Taste and odour threshold
concentrations of potential potable water contaminants. Water Research 30(2), 331-340.
Zamyadi, A., Henderson, R., Stuetz, R., Hofmann, R., Ho, L. and Newcombe, G. (2015) Fate of
geosmin and 2-methylisoborneol in full-scale water treatment plants. Water Research 83, 171-
183.

Yi Li 14
Department of Civil Engineering, University of Toronto 2015
3 COMPARISON OF BENCH-SCALE AND PILOT-SCALE
TESTS FOR ESTIMATING TASTE AND ODOUR
REMOVAL
ABSTRACT
Granular activated carbon (GAC) is commonly used for the control of seasonal
taste and odour events. A challenge involving this application is the difficulty in
accurately estimating the remaining service life of an existing GAC bed. This
study evaluated a method reported by previous studies that was intended to
measure the removal capacity of taste and odour compounds in existing GAC
contactors by collecting a core sample of the existing bed and subjecting it to a
mini column test. In this research, pilot- and laboratory-scale column experiments
were conducted to examine the extent of 2-methylisoborneol (MIB) and geosmin
removal from two water treatment facilities. Results indicated that mini column
tests were able to simulate the pilot-scale filters to within an accuracy of typically
±10% for both geosmin and MIB removal. The impact of specific mini column
parameters was further studied: the effect of mini column diameter (11 mm vs. 25
mm) on the removal of geosmin and MIB was minimal, while the particle size
and sieving method (wet vs. dry) had an impact on the GAC performance, with
the wet sieving method being most accurate. The dry sieving methods required
baking the GAC which significantly increased the removal capacity, presumably
due to the baking process removing and/or altering NOM constituents that were
adsorbed onto GAC. The study was performed with aged GAC from different
facilities and provided evidence that GAC performance can be greatly impacted
by factors including the type of GAC, the water treatment train at a given facility,
and source water characteristics. Overall, the mini column test appears to be an
effective method at estimating the remaining removal capacity of taste and odour
compounds.

Yi Li 15
Department of Civil Engineering, University of Toronto 2015
3.1 INTRODUCTION
Taste and odour (T&O) in drinking water is often due to the presence of trace organic
compounds produced by cyanobateria and actinomycetes (Ho and Newbombe 2010). Among
these trace organics, geosmin (1,10-trans-dimethyl-trans-9-decalol: C12H22O) and MIB (2-
methylisoborneol: C11H20O) are the most frequently identified (Srinivasan and Sorial 2011). The
reported concentration of geosmin and MIB that is detectable by humans ranges from as low as 4
to 20 ng/L (Srinivasan and Sorial 2011, Scharf et al. 2010).
Granular activated carbon (GAC) contactors are commonly used in Ontario to control geosmin
and MIB. A challenge with this application is the inability to accurately estimate the remaining
removal capacity of an existing GAC bed. Pilot-scale GAC columns have been used to simulate
the full-scale GAC contactors in many studies, and it is commonly accepted, based on experience,
that a pilot GAC column can successfully represent the full-scale contactor (Gillogly et al. 1999,
Ho and Newcombe 2010, Scharf et al. 2010). Pilot-scale studies, however, are often costly and
labor intensive, and thus the primary objective of this research was to explore a laboratory-scale
approach.
Isotherm tests, involving equilibrium theory, are often conducted to measure GAC adsorption
capacity as a screening tool when selecting a preferred GAC product since carbon with higher
adsorption capacity might be expected to have a longer service life. Adsorption kinetics,
however, have a significant impact on bed life and can result in earlier breakthrough than that
expected from equilibrium theory (Gillogly et al. 1999). Another method to evaluate GAC
performance is the rapid small-scale column test (RSSCT). The RSSCT requires grinding the
GAC to a smaller particle size so it is only applicable to virgin GAC and cannot be used to
measure the remaining adsorptive capacity of GAC from an existing contactor since grinding
partially saturated GAC may lead to the formation of new adsorption sites that were previously
blocked by adsorbed compounds.
Gillogly et al. (1999) previously developed a mini column method that was intended to predict
the remaining service life of a GAC contactor for taste and odour compounds. Without grinding
the GAC, Gollogly et al. (1999) reported that the mini column test could determine whether the
GAC was currently effective and how effluent concentrations of taste and odour compounds

Yi Li 16
Department of Civil Engineering, University of Toronto 2015
would change with varying influent concentrations. Core samples were collected from active
GAC beds and a “representative” fraction of GAC was packed into mini columns (1 cm GAC in
columns with inner diameter (ID) =10 mm) that were challenged using MIB. The “representative”
GAC fraction was the sieve size that accounted for the largest fraction of the external surface
area in the filters, which was assumed to be the largest size fraction by weight. The results of the
mini column tests were compared to parallel pilot-scale tests and a good agreement between
removal capacities was observed. A homogeneous surface diffusion model (HSDM) was then
developed using the parameters derived from mini column tests to predict the remaining bed life
of a GAC contactor. Gillogly concluded that the bench-scale mini column test can be employed
to predict findings from pilot-scale studies. A later study by Ho and Newcombe (2010), however,
reported that there were inherent limitations with this mini column method. In particular, the
small volume of GAC used and high filtration rates employed were identified as shortcomings,
since 90% breakthrough of MIB after 6-month operation was predicted by the mini column test,
while only 30% breakthrough was observed in pilot-study. It was argued that the modified test
with larger laboratory columns and higher GAC bed depth (15 cm GAC in columns with ID =
25mm) was able to more accurately simulate the pilot-scale filters. Furthermore, the work by
Gillogly et al. (1999) only explored the removal of one compound (MIB), and only one type of
GAC (F300) with one source of water (filtered water from southern Lake Michigan).
To validate the work by Gillogly et al. (1999) and Ho and Newcombe (2010), and to further
explore the effects of column diameter and sieving method, mini column tests were explored in
the current study. The mini column tests were conducted using a larger column diameter and a
higher GAC bed depth than used in the previous studies. The effectiveness of mini column tests
for predicting the removal of taste and odour compounds from aged GAC was assessed by
comparing the results to pilot-scale experiments.
3.2 OBJECTIVE
The primary objective of this study was to develop a protocol for applying mini column tests on
a routine basis to track granular activated carbon (GAC) performance for the removal of geosmin
and MIB. The detailed objectives were as follows:

Yi Li 17
Department of Civil Engineering, University of Toronto 2015
1. To estimate the remaining taste and odour removal efficiencies with different types of
GACs using pilot column tests,
2. To optimize the design of mini column experiments, specifically column diameter and
the sieving method used,
3. To investigate the feasibility of using mini column tests to simulate pilot-scale filters,
4. To develop a protocol for applying mini column tests on a routine basis to track GAC
performance and to predict the remaining service life.
3.3 MATERIALS AND METHODS
3.3.1 Water Source and site description
The pilot-scale studies of GAC contactors were conducted at the Lorne Park Water Treatment
Plant and the Barrie South Surface Water Treatment Plant. The Lorne Park WTP features two
trains of water treatment processes: conventional processes and advanced processes involving
ultrafiltration (UF) membranes, H2O2 + UV disinfection and GAC contactors. The GAC
contactors were designed to quench the excess H2O2 in summertime and to work as a second
barrier for taste and odour, should an event occur. The Barrie SSWTP involves coagulation, UF
membranes, GAC filters and chlorine disinfection. Information about the GAC contactors at
Lorne Park and Barrie is listed in Table 3.1. The TOC of the treated water prior to GAC
contactors at both plants was approximately 2 mg/L and 3.6 mg/L, while the TOC of post-GAC
water was 1.7 mg/L and 3.4mg/L, respectively, demonstrating a limited adsorption GAC removal
capacity for natural NOM. Prechlorination with free chlorine of 0.3 mg/L is used at Lorne Park
from early May to October for zebra mussel control, with the chlorine residual in the pre-GAC
water being 0.15 mg/L for free chlorine and 0.25 mg/L for total chlorine. Barrie likewise
prechlorinates at their plant intake for purposes of zebra mussel control, but chlorine is not at
detectable levels at the point of introduction into the GAC contactors. Barrie does, however,
chlorinate the water used to backwash BAC filter beds, and subsequently their contactors have
some exposure to chlorine.

Yi Li 18
Department of Civil Engineering, University of Toronto 2015
Table 3.1: GAC contactor parameters at LPWTP and BSSWTP
Parameters Lorne Park Barrie
Plan area (m2) 107 45 Average flow rate (MLD) 47 .5 18.6
Media volume (m3) 136.01 127 Media depth (m) 1.27 2.81
Average EBCT (min) 4.12 6.05 Approach velocity (m/hr) 18.36 15
GAC type Centaur F300
3.3.2 Chemicals and reagents
All chemicals including MIB, geosmin, geosmin-D3, NaCl and methanol were purchased form
Sigma Aldrich. Geosmin-D3 was used as an internal standard for geosmin and MIB analysis.
Reagent grade sodium chloride was used for the extraction of the T&O compounds. Ultrapure
water from a Milli-Q system was used for stock solution preparation. Methanol was used as the
solvent for calibration stock solutions and check standards.
Stock solutions of MIB and geosmin were prepared in Milli-Q water at a concentration of 1
mg/L each. The feed water for the pilot-scale and mini column tests was collected from the full-
scale treatment plants and spiked with the stock solutions at a target concentration of 100 ng/L of
each compound.
Sodium azide solution was dosed into the water samples from the effluent of the column tests for
sample preservation (166 µL sodium azide at a concentration of 25 ug/L into 23 ml samples).
The samples were concentrated using a solid phase micro extraction (SPME) fiber and analyzed
on an Agilent 3800 gas chromatography system with a 4200 mass spectrometer. More details
about this method can be found in Appendix B. The method detection limit for geosmin and MIB
were 7 ng/L and 9 ng/L, respectively.
3.3.3 Pilot-scale experiments
The pilot study was aimed at evaluating the performance of the GAC contactors at the Lorne
Park Water Treatment Plant and Barrie South Surface Water Treatment Plant. Three types of
GAC samples were tested: 3-year and 4-year old Centaur GAC from the Lorne Park WTP, and
4-year F300 GAC from the Barrie SSWTP. Since it is logistically very difficult to do a full-scale
test to assess the remaining removal capacity of a contactor for taste and odour compounds (i.e. it

Yi Li 19
Department of Civil Engineering, University of Toronto 2015
is prohibitively expensive to spike geosmin/MIB at full-scale), it is assumed that the performance
of a pilot filter is identical to that of the full-scale contactor, as has been demonstrated in
previous studies (Gillogly et al. 1999, Ndiongue et al. 2006, Ho and Newcombe 2010).
To avoid reactions between GAC particles and the internal wall of the column, glass columns
were used. The flow through the column filter was proven to be plug flow in a previous study
using the same columns conducted by Li (2013). The GAC at Lorne Park was selected for full-
scale treatment purposes to quench H2O2 after the UV+ H2O2 process and also works as a second
barrier for adsorption of taste and odour compounds. The GAC samples were collected from
Lorne Park’s Contactor #2 and # 8 using a PVC sampler and transferred to the glass columns
with the stratification maintained the same as in the full-scale GAC beds. The core sampler was
submerged into the GAC bed when the bed was fluidized by backwash. To maintain the
stratification and simplify the procedure, the GAC core sample was divided into three parts with
the bottom third carefully packed into the bottom of the experimental pilot column and similarly
with the middle and top third of the GAC portions transferred into the glass column in sequence.
Contactor #2 and # 8 had been in service for approximately 3 years and 4 years, respectively.
A preliminary pilot-scale trial was conducted to determine variability in column performance
with continuous vs. intermittent flow over a total flow time of over 25 hours, specifically to
determine the need to run flow through the columns overnight. Influent and effluent samples
from the pilot filters were collected in 23 mL vials, preserved with sodium azide and transported
to the laboratory for further analysis.
Table 3.2: Conditions of the pilot scale column tests at LPWTP and BSSWTP
Plant location Lorne Park Barrie
GAC bed height (m) 1.28 2.56
EBCT (min) 4.1 6.1
Flowrate (ml/min) 157.4 235.4

Yi Li 20
Department of Civil Engineering, University of Toronto 2015
3.3.4 Bench-scale experiments
Mini column tests, an approach documented by Gillogly et al. (1999) and Ho et al. (2010), were
conducted to evaluate the remaining adsorption capacity of aged GAC for MIB and geosmin.
The results from the bench-scale column test were compared to those from the pilot column test,
to examine the effectiveness of the bench-scale method. Prior to this objective, experiments were
conducted to determine the effects of GAC particle size distribution and mini column diameter.
The GAC samples were collected from GAC contactors at the Lorne Park Water Treatment
Plant. A sieve test with dried GAC and wet GAC was conducted separately to determine the
particle size distribution. The sieved particles with the highest fraction of the total sample weight
were defined as the size representative particles. Results from the sieve test can be found in
Appendix A.1.
Size representative GAC samples after both dry sieving and wet sieving were packed into glass
columns with internal diameters of 11 mm and 25 mm, and a length of 30 cm (Figure 3.1). The
GAC bed depth was 10 cm, and 1 mm glass beads were used to support the GAC in the columns
and also to ensure uniform flow. The GAC samples were rinsed with Milli-Q water before being
packed into the columns. Each end of the glass column was sealed with a threaded PTFE
adaptor and a filter.
Each mini column was filled with the water collected from the plants immediately upstream of
their full-scale GAC contactors, and spiked with geosmin and MIB at a concentration of 100
ng/L. Water then was directed through the columns at the same empty bed contact time (EBCT)
of the full scale GAC contactors (4.1 minutes). The columns were run in duplicate in a
continuous up-flow mode (to prevent possible bubble-entrainment) for over 24 hours. During the
experiment, the influent and effluent samples were collected at regular intervals and analyzed for
geosmin and MIB concentration.

Yi Li 21
Department of Civil Engineering, University of Toronto 2015
Figure 3.1: Experimental setup to determine the effect of column diameter and sieving method
for mini column test
As different column diameters and sieve methods may result in different effluent MIB and
geosmin breakthrough, the optimal diameter and sieving method was selected by comparing the
mini column results to that from the pilot column test (conducted two weeks prior to the mini
column trial). The mini column test with optimal diameter and sieving method was conducted
later to evaluate the performance of GAC with different ages.
Previous studies reported that the adsorption capacity can be influenced by the procedures used
to wash, dry and store GAC (Randtke and Snoeyink, 1983). Accordingly, the effect of storage of
GAC was also investigated. Mini column tests were conducted using the freshly collected GAC
and GAC that had been stored in a refrigerator at 4˚C for two week. Both of the results were
compared to the breakthrough from the parallel pilot-scale studies, and the difference from these
two sets of experiments was examined.
Yi Li 22
Department of Civil Engineering, University of Toronto 2015
3.4 RESULTS AND DISCUSSION
3.4.1 Determining the operating time for pilot- and bench-scale column tests
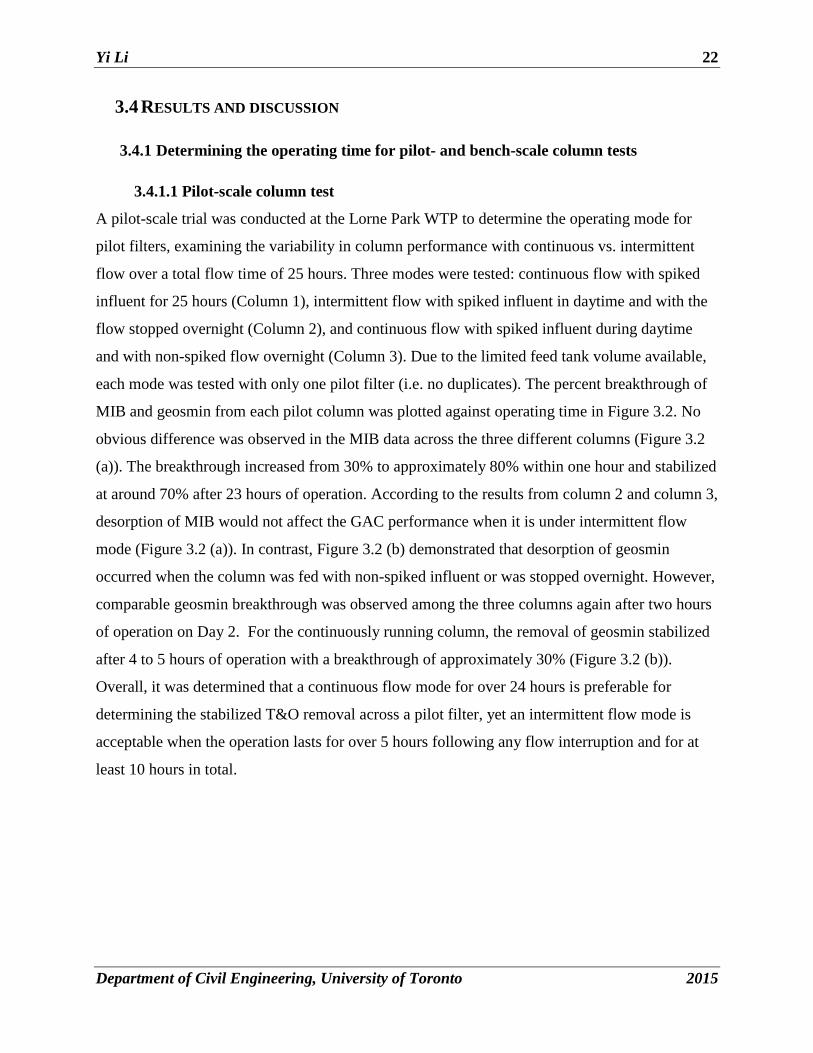
3.4.1.1 Pilot-scale column test
A pilot-scale trial was conducted at the Lorne Park WTP to determine the operating mode for
pilot filters, examining the variability in column performance with continuous vs. intermittent
flow over a total flow time of 25 hours. Three modes were tested: continuous flow with spiked
influent for 25 hours (Column 1), intermittent flow with spiked influent in daytime and with the
flow stopped overnight (Column 2), and continuous flow with spiked influent during daytime
and with non-spiked flow overnight (Column 3). Due to the limited feed tank volume available,
each mode was tested with only one pilot filter (i.e. no duplicates). The percent breakthrough of
MIB and geosmin from each pilot column was plotted against operating time in Figure 3.2. No
obvious difference was observed in the MIB data across the three different columns (Figure 3.2
(a)). The breakthrough increased from 30% to approximately 80% within one hour and stabilized
at around 70% after 23 hours of operation. According to the results from column 2 and column 3,
desorption of MIB would not affect the GAC performance when it is under intermittent flow
mode (Figure 3.2 (a)). In contrast, Figure 3.2 (b) demonstrated that desorption of geosmin
occurred when the column was fed with non-spiked influent or was stopped overnight. However,
comparable geosmin breakthrough was observed among the three columns again after two hours
of operation on Day 2. For the continuously running column, the removal of geosmin stabilized
after 4 to 5 hours of operation with a breakthrough of approximately 30% (Figure 3.2 (b)).
Overall, it was determined that a continuous flow mode for over 24 hours is preferable for
determining the stabilized T&O removal across a pilot filter, yet an intermittent flow mode is
acceptable when the operation lasts for over 5 hours following any flow interruption and for at
least 10 hours in total.

Yi Li 23
Department of Civil Engineering, University of Toronto 2015
Figure 3.2: Breakthrough of (a) MIB and (b) geosmin from pilot-scale trial at Lorne Park WTP
to compare three different operating modes over 25 hours
0%
10%
20%
30%
40%
50%
60%
70%
80%
90%
100%
0 0.5 1 2 3 4 5 D21hr(23)
D22hr(24)
D23hr(25)
Pe
rce
nt
bre
akth
rou
gh
Operating time (hr)
a.
column 1
column 2
column 3
0%
10%
20%
30%
40%
50%
60%
70%
0 0.5 1 2 3 4 5 D21hr(23)
D22hr(24)
D23hr(25)
Per
cen
t b
reak
thro
ugh
Operating time (hr)
b.
column 1
column 2
column 3
Yi Li 24
Department of Civil Engineering, University of Toronto 2015
3.4.1.2 Bench-scale column test
Figure 3.3: Percent breakthrough of (a) MIB and (b) geosmin over 24 hours from mini column
tests using different aged GAC from Lorne Park (Data points are an average of
duplicate columns with error bars representing maximum and minimum values)
0%
10%
20%
30%
40%
50%
60%
70%
80%
90%
0 100 200 300 400
per
cen
t b
reak
thro
ugh
Bed volume
a.
3.2yr GAC
4.2yr GAC
0%
5%
10%
15%
20%
25%
30%
35%
40%
45%
0 100 200 300 400
pe
rce
nt
bre
akth
rou
gh
Bed volume
b.
3.2yr GAC
4.2yr GAC

Yi Li 25
Department of Civil Engineering, University of Toronto 2015
Figure 3.4: Percent breakthrough of (a) MIB and (b) geosmin over 24 hours from mini column
tests using GAC from Barrie with particle size of 2.36 mm (sieve #8) and 2 mm
(sieve #10) (Data points are an average of duplicate columns with error bars
representing maximum and minimum values)
0%
10%
20%
30%
40%
50%
60%
0 100 200 300
Per
cen
t b
reak
thro
ugh
Bed volume
a.
particlesretained insieve #8
particlesretained insieve #10
0%
5%
10%
15%
20%
25%
0 100 200 300
Per
cen
t b
reak
thro
ugh
Bed volume
b.
particlesretained insieve #8
particlesretained insieve #10
(2.36 mm)
(2 mm)
(2.36 mm)
(2 mm)
Yi Li 26
Department of Civil Engineering, University of Toronto 2015
Mini column tests were conducted with continuous flow over 24 hours in the lab using different
GAC samples. To determine the time needed for stabilization of geosmin and MIB removal, the
influent and effluent samples were collected at regular intervals. The time was converted into
treated bed volumes of water due to the different EBCTs of the GAC contactors at Lorne Park
(EBCT = 4.12 min) and Barrie (EBCT = 6.05 min). As shown in Figure 3.3, both MIB and
geosmin breakthrough demonstrated stability after 300 bed volumes of treated water
(approximately 20 hours of operation) for GAC samples from Lorne Park. Data using GAC from
Barrie presented acceptable stability after 200 bed volumes of treated water (also approximately
20 hours) for both compounds with a difference within ±5% (Figure 3.4).
3.4.2 Pilot-scale study
3.4.2.1 Effect of GAC age
MIB and geosmin breakthrough tests were conducted in pilot filters at the Lorne Park WTP with
an influent concentration of 100 ng/L for both compounds in May, 2015 and July, 2015. GAC
samples were collected from Contactor #2 (about 3.2 years in operation in July, 2015) and
Contactor #8 (about 4.2 years in operation in July, 2015). The results are shown in Figure 3.5,
along with data from previous research for the same contactors conducted in May 2013 using
similar methods, when the GACs were only 1 and 2 years old, respectively (Zamyadi et al.,
2015). In Figure 3.5, it is observed that the breakthrough of MIB increased from about 25% to 85%
after three years of operation. Better geosmin removal was observed compared to MIB, with only
30%-45% geosmin breakthrough using 3-year old or older GAC. Obvious breakthrough
increases were observed over the first three years of operation (25%-85% for MIB and 15%-45%
for geosmin), while there were only slight differences (~5% for both compounds) between the
performance of 3.2-year and 4.2-year GAC, suggesting that a removal equilibrium was reached
for T&O compounds after 3 years of operation. These results are in accordance with a previous
publication (Scharf et al., 2010) that observed more than 80% geosmin removal through 36
inches (approximately 91cm) of a pilot-scale GAC contactor over 700 days of operation. A
further study conducted by Rondtke and Snoeyink (1983) also stated that for large GAC particles
and slowly diffusing adsorbates, several years may be required to reach equilibrium. According
to Peel Region’s reports, the typical geosmin concentration in raw water has been below 5 ng/L
in the summertime over the past three years, which means there was no significant taste and

Yi Li 27
Department of Civil Engineering, University of Toronto 2015
odour event. The increase of T&O breakthrough over operation time demonstrated that the
removal capacity of GAC for T&O compounds is greatly influenced by the amount of NOM
adsorbed on the GAC surface. This finding is in accordance with previous publications (Graham
et al. 2000, Newcombe et al. 2002) documenting that the adsorption of MIB and geosmin can be
reduced by an order of magnitude or more due to the presence of background NOM, mainly
because of the competitive adsorption between NOM with low molecular weight and T&O
compounds.
The data in Figure 3.5 show error bars representing the maximum and minimum values of
stabilized compound breakthrough from pilot-scale filters running continuously for over 24
hours. As discussed in the previous section, the removals of geosmin and MIB were stabilized
after the first 5 hours of operation. Breakthrough data were averaged and plotted in Figure 3.5
from 3 samples that were collected after 20 hours of operation for each pilot filter. The removal
of geosmin and MIB was both considered stable with the difference between samples less than
5%.
Figure 3.5: Pilot-scale breakthrough results of MIB and geosmin at Lorne Park, using GAC with
different ages. (Error bars represent max/min values of 3 replicates collected from
one pilot-filter after 20 hours)
0%
10%
20%
30%
40%
50%
60%
70%
80%
90%
100%
MIB Geosmin
Per
cen
t b
reak
thro
ugh
T&O compound
1yr
2yr
3yr
3.2yr
4.2yr

Yi Li 28
Department of Civil Engineering, University of Toronto 2015
3.4.2.2 Effect of exposure to H2O2
Hydrogen peroxide together with UV disinfection is applied at Lorne Park in summer as the first
barrier to T&O compounds. The contactors were exposed annually to H2O2 for approximately
three month periods from 2013 to 2015. In 2015, the application of H2O2 started on August 18th.
Besides the tests conducted in May and July, another set of experiments was conducted in mid-
August, 2015, when the GAC was newly exposed to H2O2 at a concentration of approximately
1.0 to 2.5 mg/L. Figure 3.6 presents the breakthrough of MIB and geosmin from pilot column
tests conducted in May, July and August. All the GAC samples were collected from similar
locations in Contactor #2. The breakthrough of MIB and geosmin increased by about 10% for
MIB and 20% for geosmin from May to July, while breakthrough of both dropped by about 40%
in August. The removal capacity increased dramatically after the application of H2O2 in the
influent, providing evidence that H2O2 has significant impact on the removal capacity of GAC.
There are few papers evaluating the effect of H2O2 on GAC for T&O removal, yet hypotheses of
reactions between H2O2 and GAC can be found in previous studies: either generating ˖OH
radicals or changing the functional group on the surface of GAC (Li 2013). A plausible
explanation is that the NOM previously adsorbed on GAC was degraded due to the reactions
between H2O2 and GAC, thus generating more sorption sites for geosmin and MIB removal.
Additionally, MIB and geosmin can be destroyed directly by the ˖OH radicals generated on the
surface of GAC, resulting in lower breakthrough of both compounds (Collivignarelli and Sorlini
2004).

Yi Li 29
Department of Civil Engineering, University of Toronto 2015
Figure 3.6: Comparison of pilot-scale breakthrough of MIB and geosmin using aged GAC at
Lorne Park in 2015 (Error bars represent max/min values of 3 replicates collected
from one pilot-filter after 20 hours)
3.4.3 Bench-scale study
3.4.3.1 Effect of mini column diameter and sieve method
Mini column experiments (column inner diameter (ID) = 1 cm, GAC bed depth = 1 cm) were
documented by Gillogly et al. (1999) to give identical MIB breakthrough as the pilot-column test
when operated at the same EBCT, regardless of column diameter and GAC bed depth. In this
previous research, a representative-size fraction was selected and packed in the laboratory
columns, whereas whether the GAC particles were sieved when they were dry or wet was not
specified. Ho and Newcombe (2010) also reported that larger laboratory-scale columns (column
ID = 2.5 cm, GAC bed depth = 15 cm) were able to remove MIB to the same extent as in a pilot-
scale GAC filter at Myponga, Australia after a 6-month operation. Prior to adopting mini column
tests or larger laboratory-scale column tests for GAC performance evaluation, experiments were
conducted to validate the lack of impact of column diameter, and to determine an appropriate
sieving method.
0%
10%
20%
30%
40%
50%
60%
70%
80%
90%
100%
MIB geosmin
Per
cen
tage
bre
akth
rou
gh
T&O compound
May 7th,2015
July 20th,2015
August 19th,2015after exposure toH2O2
August 19th,
2015 with H2O2
present

Yi Li 30
Department of Civil Engineering, University of Toronto 2015
According to preliminary sieve tests, the representative particle size based on the weight fraction
for dry GAC from Lorne Park was 1.7 mm (particles retained in sieve #12), while it was 2.0 mm
(particles retained in sieve #10) for wet GAC particles. The dry GAC samples consisted of GAC
taken from the contactor and baked at 105˚C overnight. Particles from both representative sizes
were packed into mini columns with different internal diameters (11 mm vs. 25 mm), and were
challenged using geosmin and MIB, both at a concentration of 100 ng/L. The breakthrough data
for MIB and geosmin from the four tests are presented in Figure 3.7. These bench-scale
experiments are further presented together with the results from a pilot column test for
comparison (conducted with the water and GAC collected at the same time as the bench-scale
analyses).
A two-way ANOVA was applied to statistically evaluate the impact of column ID and sieve
method for MIB and geosmin removal. As shown in Table 3.3, the effect of sieve method is
significant for both MIB and geosmin adsorption at a 95% significance level as the F values are
significantly higher than the F critical value when α = 0.05. The difference in average MIB and
geosmin breakthrough is 30% and 20%, respectively, between the dry and wet GAC (Figure 3.7).
Presumably, the baking process removed and/or altered the NOM adsorbed on GAC surface and
released more adsorption sites, resulting in higher removal capacity for geosmin and MIB.
No impact of column ID on MIB removal was observed, but the null hypothesis regarding
column ID for geosmin removal was rejected with an F value equal to 15 compared to the a
critical value of 4.75 . Though an impact on geosmin removal using different column IDs was
identified statistically, only a slight difference (~5% less breakthrough with ID=11mm) was
observed. By comparing the results to the data from the pilot study, it was found that the larger
mini column more closely corresponded to geosmin breakthrough. Column ID and sieve method,
however, were demonstrated to not have an interactive effect on taste and odour compound
removal. Overall, the data demonstrated that the sieving method used (i.e., wet vs. dry) had the
greatest impact on geosmin and MIB removal, while column ID had no impact on MIB
adsorption, and only slightly more accurate results for geosmin removal with the larger column
(25 mm).

Yi Li 31
Department of Civil Engineering, University of Toronto 2015
Figure 3.7 Breakthrough of MIB and geosmin from pilot filter and mini column filters with
different internal diameters and sieve methods (Error bars on mini column filters
represent max/min values of stabilized effluent breakthrough of samples collected
after 16 hours from duplicate columns)
Since the sieve method has a significant impact on the lab-scale column results, each column was
compared to the parallel pilot-scale test conducted in the WTP to determine the optimal
conditions for the mini column tests (Table 3.4). Statistical analysis with the student t-test was
applied to evaluate the difference between the pilot and mini column results. Results are shown
in Table 3.4. Regarding the results of both MIB and geosmin adsorption, the optimal conditions
for the mini column tests were determined to be a column with an internal diameter of 25 mm
and loaded with wet sieved GAC. This lab-scale column protocol was utilized in subsequent
experiments.
0%
10%
20%
30%
40%
50%
60%
70%
80%
MIB geosmin
Per
cen
tage
Bre
akth
oru
gh
T&O compounds
Dry GAC,ID=11mm
Dry GAC, ID=25mm
Wet GAC,ID=11mm
Wet GAC,ID=25mm
Pilot column

Yi Li 32
Department of Civil Engineering, University of Toronto 2015
Table 3.3: Two-way ANOVA results of (a) MIB and (b) geosmin for the effect of column ID
and sieve method
a. MIB
source of variance F value F critical(0.05)
Reject or accept
the null
hypothesis (0.05)
Column ID 1.26 4.75 Accept
Sieve method 304.69 4.75 Reject
Interaction 4.39 4.75 Accept
Null hypothesis H0: No difference among the groups tested
b. Geosmin
source of variance F value F critical(0.05)
Reject or accept
the null
hypothesis(0.05)
Column ID 15.49 4.75 Reject
Sieve method 549.78 4.75 Reject
Interaction 1.07 4.75 Accept
Null hypothesis H0: No difference among the groups tested.
Table 3.4: Results of two-tailed t-test assuming unequal variance to compare the pilot-scale test
to each mini column test
Compound
breakthrough
Pilot-scale
breakthrough Difference
P-value
(0.05)
Different
breakthrough
(Yes/No)
MIB
dry GAC,
11mm 37%
73%
-36% 0.00001 Y
dry GAC,
25mm 42% -31% 0.00003 Y
wet GAC,
11mm 71% -2% 0.24800 N
wet GAC,
25mm 68% -5% 0.09499 N
Geosmin
dry GAC,
11mm 6%
31%
-25% 0.00080 Y
dry GAC,
25mm 9% -22% 0.00033 Y
wet GAC,
11mm 25% -6% 0.04631 Y
wet GAC,
25mm 27% -4% 0.38649 N

Yi Li 33
Department of Civil Engineering, University of Toronto 2015
3.4.3.2 Effect of GAC storage
It was demonstrated in a previous study (Randtke and Snoeyink 1983) that adsorption capacity of
GAC can be impacted by the procedures used to store the GAC. For this research, the wet GAC
core samples were carefully collected from a contactor and stored in sealed plastic bags at 4˚C
for two weeks with the water drained to minimize the disturbance to the GAC particles. Two sets
of pilot- and bench-scale tests were conducted to investigate the impact of GAC storage. The
first set of experiments was conducted with fresh GAC packed in pilot columns at Lorne Park
and two-week old (i.e. stored) GAC loaded in mini columns in the lab. The second set of
experiments was tested with the freshly collected GAC in both pilot and mini columns at exactly
the same time at Lorne Park. All the experiments were run in duplicate columns. The bench-
scale breakthrough was compared to the data from the parallel pilot-scale studies, respectively,
and the difference from these two sets of experiments was examined (Figure 3.8). The
breakthrough of geosmin and MIB through stored GAC in mini columns was approximately 10%
lower than the pilot-scale study. However, the data from mini columns with freshly collected
GAC showed the opposite difference (ie. 10% higher). The reversed difference suggests that
GAC storage has an impact on its adsorption capacity. Presumably, the higher removal capacity
of stored GAC could be explained by desorption of T&O compounds, as well as the loss of
volatile NOM constituents on the GAC particle surface during the two weeks of storage. On the
other hand, leakage on the top of pilot column was observed during the second set of
experiments, which likely resulted in longer EBCT in pilot filters than that in the bench-scale
columns. Previous studies by Gillogly et al. (1999) and Ndiongue et al. (2006) reported that an
increase of EBCT can significantly increase the removal efficiency of GAC for T&O compounds.
In summary, the storage of GAC has a slight influence on the removal capacity of T&O
compounds. Freshly collected GAC would be a preferable option for bench-scale tests. However,
GAC samples stored for less than 2 weeks could still be used, if conditions are not suitable for
bench-scale tests with freshly collected GAC.
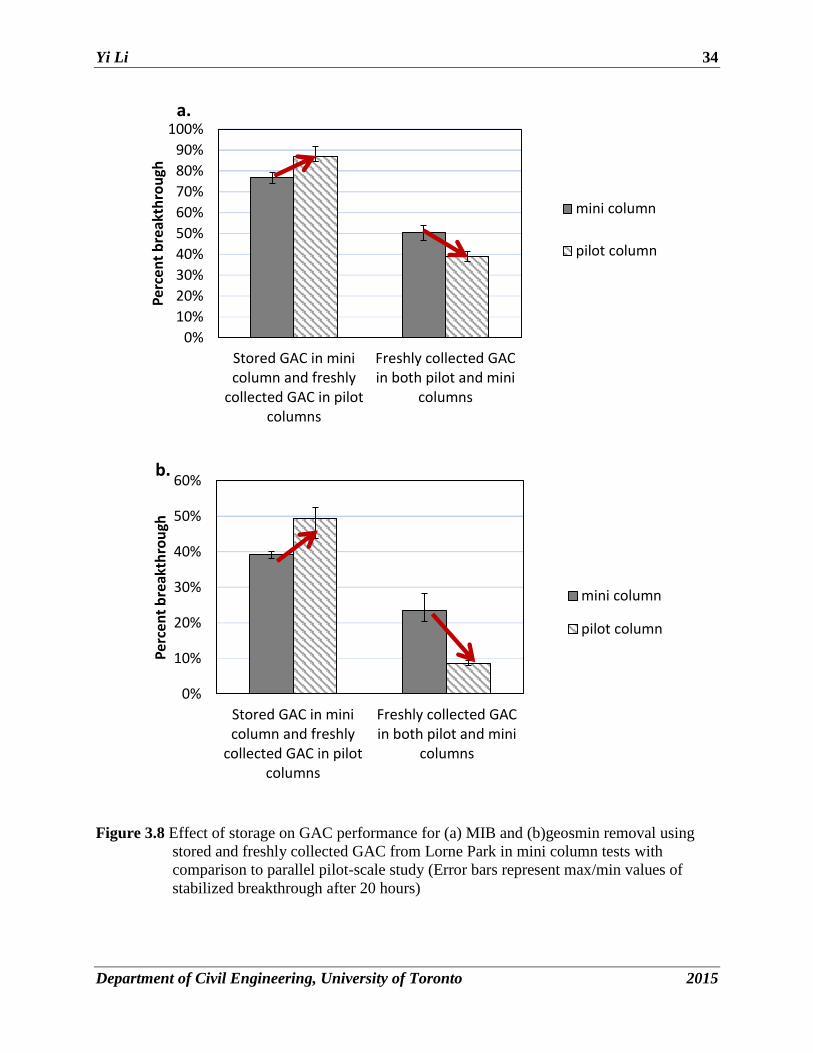
Yi Li 34
Department of Civil Engineering, University of Toronto 2015
Figure 3.8 Effect of storage on GAC performance for (a) MIB and (b)geosmin removal using
stored and freshly collected GAC from Lorne Park in mini column tests with
comparison to parallel pilot-scale study (Error bars represent max/min values of
stabilized breakthrough after 20 hours)
0%
10%
20%
30%
40%
50%
60%
70%
80%
90%
100%
Stored GAC in minicolumn and freshly
collected GAC in pilotcolumns
Freshly collected GACin both pilot and mini
columns
Pe
rce
nt
bre
akth
rou
gh
a.
mini column
pilot column
0%
10%
20%
30%
40%
50%
60%
Stored GAC in minicolumn and freshly
collected GAC in pilotcolumns
Freshly collected GACin both pilot and mini
columns
Per
cen
t b
reak
thro
ugh
b.
mini column
pilot column

Yi Li 35
Department of Civil Engineering, University of Toronto 2015
3.4.3.3 Application of mini column tests to evaluate GAC performance
The mini column test was applied to evaluate the performance of different GAC samples from
the Lorne Park WTP. Samples collected from GAC Contactor #2 (3.2 yr in operation) and GAC
Contactor #8 (4.2 yr in operation) in July, 2015 were stored at 4˚C for two weeks prior to the
experiments. The wet stored GAC samples retained in sieve #10 was packed into a glass column
with an internal diameter of 25 mm. The bench-scale columns were run for over 24 hr. As
discussed in the previous section, both MIB and geosmin breakthrough demonstrated stability
after 300 bed volumes of treated water. The stabilized breakthrough after 20 hours of both
compounds was averaged and is shown in Figure 3.9. The remaining removal capacity for MIB
was almost the same for 3.2-year and 4.2-year GAC, while 4.2-year GAC demonstrated
approximately 8% higher adsorption capacity for geosmin removal (Figure 3.9).
Figure 3.9: Average stabilized breakthrough of MIB and geosmin from mini column tests using
3.2-year and 4.2-year GAC from Lorne Park WTP (Error bars represent max/min
values of stabilized replicates collected from duplicate mini columns for each GAC
age after 20 hours)
0%
10%
20%
30%
40%
50%
60%
70%
80%
90%
MIB geosmin
Per
cen
tage
Bre
akth
rou
gh
T&O compound
3.2yr GAC
4.2yr GAC

Yi Li 36
Department of Civil Engineering, University of Toronto 2015
3.4.4 Comparison of bench-scale and pilot-scale studies
3.4.4.1 GAC from Lorne Park water treatment plant
Experiments were conducted in July, 2015 and August, 2015, before and after the H2O2
application in August at the Lorne Park WTP, respectively. The first batch of mini column tests
was conducted in the lab two weeks after the pilot column test in July. GAC samples from GAC
Contactor#2 and GAC Contactor #8 were examined in this set of experiments. Figure 3.10
presents the data of MIB and geosmin breakthrough from both pilot and mini column tests.
Comparable degrees of removal were observed for both compounds in both the 3.2 and 4.2 year
old GAC, although mini column tests presented approximately 5%-10% lower breakthrough for
both compounds than in the pilot column tests (Figure 3.10). The second batch of mini column
tests was conducted at the Lorne Park WTP at exactly the same time together with the pilot
column test in mid-August. The data from mini column tests were approximately 10% higher
than the breakthrough from the pilot column test (Figure 3.11). As has been discussed in
previous section, stored and newly collected GAC both provided comparable breakthrough to the
pilot column tests, though the stored GAC used in mini column test had a slightly increased
removal capacity.
In general, the data from pilot and mini column tests are in reasonable agreement with a ±10%
difference. In consideration of the very different conditions in operation of these two tests, this
agreement may be considered acceptable. In further regard to the amount of time and resources
required to run the bench- vs. pilot-scale tests, the bench-scale test may be a desirable option for
running future experiments.
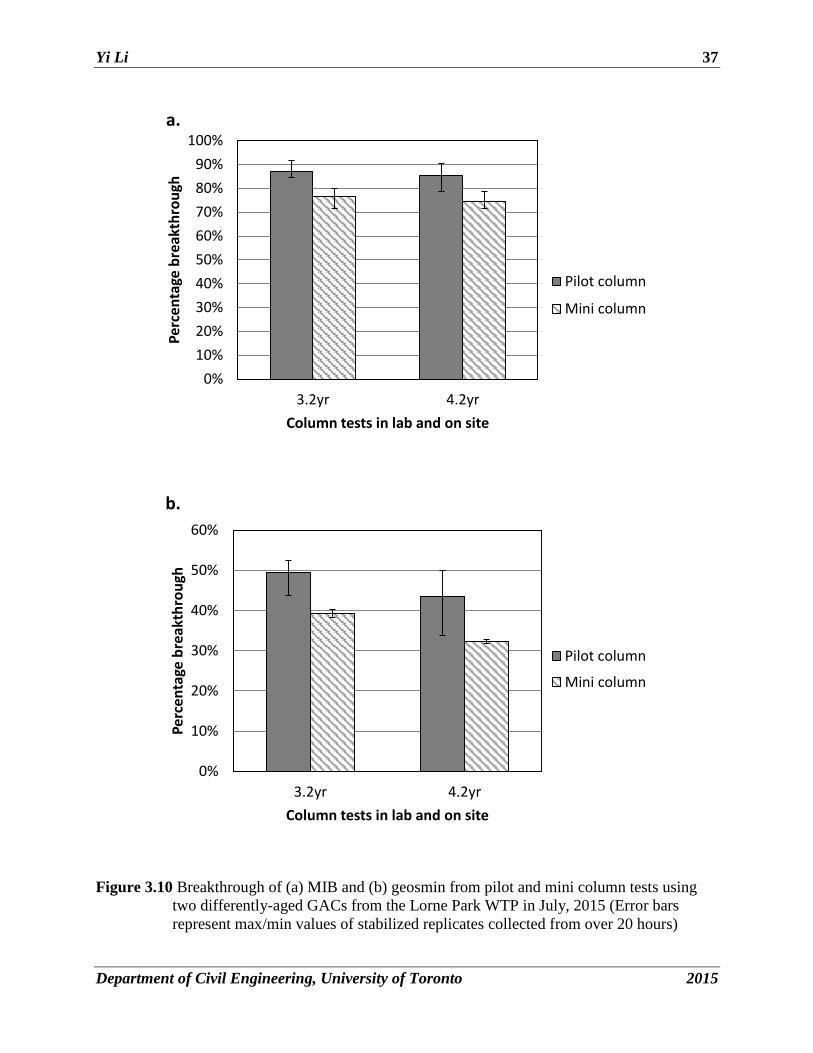
Yi Li 37
Department of Civil Engineering, University of Toronto 2015
Figure 3.10 Breakthrough of (a) MIB and (b) geosmin from pilot and mini column tests using
two differently-aged GACs from the Lorne Park WTP in July, 2015 (Error bars
represent max/min values of stabilized replicates collected from over 20 hours)
0%
10%
20%
30%
40%
50%
60%
70%
80%
90%
100%
3.2yr 4.2yr
Per
cen
tage
bre
akth
rou
gh
Column tests in lab and on site
a.
Pilot column
Mini column
0%
10%
20%
30%
40%
50%
60%
3.2yr 4.2yr
Per
cen
tage
bre
akth
rou
gh
Column tests in lab and on site
b.
Pilot column
Mini column

Yi Li 38
Department of Civil Engineering, University of Toronto 2015
Figure 3.11: Breakthrough of MIB and geosmin from pilot and mini column tests with 3.2 year-
old GAC from the Lorne Park WTP after exposure to H2O2 in August, 2015 (Error
bars represent max/min values of stabilized replicates collected from one pilot-filer
over 20 hours)
3.4.4.2 GAC from the Barrie water treatment plant
Geosmin and MIB breakthrough tests were conducted in pilot-scale columns at the Barrie
SSWTP, using two GAC columns in duplicate, at the end of July, 2015, to evaluate the
remaining removal capacity of Barrie’s GAC. Since the GAC beds at Barrie measured 2.81 m
deep, and the pilot-scale glass GAC columns were only 1.28 m long, two pilot columns were
operated in series for each duplicate to achieve the similar GAC bed depth (2.56 m) as the actual
contactors. Bench-scale column tests were conducted in the lab two weeks after the pilot study.
Wet sieve test results showed that an equal fraction (44.7%) of GAC particles were retained in
sieve #8 (2.36 mm) and sieve #10 (2 mm), so mini column tests were run in duplicate with both
particle sizes. The data from lab-scale columns with both particle sizes after 200 bed volumes of
treated water were averaged and plotted in Figure 3.13, with a comparison to the pilot-scale
breakthrough. The larger particles retained in sieve #8 (2.36 mm)gave an approximately 5%
lower removal for MIB and 10% lower removal for geosmin compared to the particles retained
in sieve #10 (2 mm) (Figure 3.13). Presumably, the difference is a result of varied surface area of
0%
10%
20%
30%
40%
50%
60%
MIB geosmin
Per
cen
tage
bre
akth
rou
gh
T&O compound
Pilot column
Mini column

Yi Li 39
Department of Civil Engineering, University of Toronto 2015
the different sized GAC particles (Corwin and Summers 2011). As shown in Figure 3.13, GAC
particles retained in sieve #10 are more representative of the pilot-scale results. The difference
between pilot and mini column tests conducted using representative GAC from Barrie SSWTP is
in good agreement with the results from the Lorne Park WTP, providing evidence that the mini
column tests are able to determine the remaining removal capacity of an existing GAC bed. In
the future, this method would benefit from further verification at more water treatment plants.
Figure 3.12 Average breakthrough of MIB and geosmin from pilot and mini column tests using
aged GAC from Barrie SSWTP (Error bars represent max/min values of stabilized
replicates collected at over 20 hours)
(Note: the data from the pilot-scale geosmin breakthrough are under the MDL)
3.5 SUMMARY AND CONCLUSIONS
The pilot-scale studies at Lorne Park demonstrated that the remaining removal capacity of a
GAC bed for T&O compounds decreased with the increase of years in operation, presumably
due to the accumulation of NOM adsorbed on the surface of GAC. There was evidence, however,
that the presence of H2O2 in the feed water to the GAC increased the removal capacity by
approximately 40%, potentially as a result of reactions between H2O2 and the GAC. As part of a
parallel project to the current study, it was discovered that Barrie’s GAC contactors have high
biological activity. The higher removal efficiencies at Barrie with the comparable-aged GAC at
0%
10%
20%
30%
40%
50%
60%
MIB geosmin
Per
cen
tage
bre
akth
rou
gh
T&O compound
pilot column
mini column withGAC retained insieve #10
mini column withGAC retained insieve #8
MDL
(2mm)
(2.36mm)

Yi Li 40
Department of Civil Engineering, University of Toronto 2015
Lorne Park, could subsequently be the product of biological activity and warrants further
research. The variation in performance of similar-aged GAC from Lorne Park and Barrie
suggests that there are factors that can significantly impact the remaining GAC service life (e.g.,
type of GAC, source water characteristics, treatment train variability, and biological activity).
Bench-scale results indicated that a glass column with an ID = 25 mm and loaded with 10 cm of
the size representative fraction of wet GAC based on weight fraction can most accurately
simulate a pilot-scale filter. The sieve methods with baked or wet GAC had a significant impact
on T&O compound breakthrough, with the baking process potentially removing and/or altering
NOM constituents that were adsorbed onto GAC, resulting in error. Due to the stickiness of wet
GAC, the wet sieving might not give a real “representative” sample as well. In order to increase
the accuracy of mini column tests, the GAC samples with the same particle size distribution as in
the full scale filter may be recommended to be tested in mini column tests in the future.
Meanwhile, different drying methods could be explored including freeze drying or air drying, in
order to minimize the loss or alteration of NOM adsorbed onto the surface of GAC.
The comparison between pilot- and bench-scale column tests at the Lorne Park WTP and the
Barrie SSWTP provided evidence that the mini column tests can determine the extent of T&O
compound adsorption in a pilot-scale (and therefore, presumably full-scale) filter with an error
within ±10%. While promising, this result is based on a study of only two locations, which
included only three types of GAC (two Centaur GACs with different ages (3.2 and 4.2 years) and
F300). In the future, this method should be verified under a wider range of conditions, including
more types of GAC and more water matrices. Other variables, such as the impact of the
temperature of the experiment (the GAC and the water) should be carefully explored, as well as
chlorine residual, H2O2 exposure to GAC and bioactivities in GAC.

Yi Li 41
Department of Civil Engineering, University of Toronto 2015
3.6 REFERENCES
Collivignarelli, C. and Sorlini, S. (2004) AOPs with ozone and UV radiation in drinking water:
contaminants removal and effects on disinfection byproducts formation. Water Science &
Technology 49(4), 51-56.
Corwin, C.J. and Summers, R.S. (2011) Adsorption and desorption of trace organic contaminants
from granular activated carbon adsorbers after intermittent loading and throughout backwash
cycles. Water Research 45(2), 417-426.
Gillogly, T.E.T., Snoeyink, V.L., Vogel, J.C., Wilson, C.M. and Royal, E.P. (1999) Determining
GAC bed life. Journal of the American Water Works Association 91(8), 98.
Graham, M., Summers, R., Simpson, M. and MacLeod, B. (2000) Modeling equilibrium
adsorption of 2-methylisoborneol and geosmin in natural waters. Water Research 34(8), 2291-
2300.
Ho, L. and Newcombe, G. (2010) Granular activated carbon adsorption of 2-methylisoborneol
(MIB): pilot-and laboratory-scale evaluations. Journal of Environmental Engineering 136(9),
965-974.
Li, J. (2013) Quenching H2O2 Residuals After UV/H2O2 Drinking Water Treatment Using
Granular Activated Carbon, MASc Thesis, University of Toronto.
Ndiongue, S., Anderson, W.B., Tadwalkar, A., Rudnickas, J., Lin, M. and Huck, P.M. (2006)
Using pilot-scale investigations to estimate the remaining geosmin and MIB removal capacity of
full-scale GAC-capped drinking water filters. Water Quality Research Journal of Canada 41(3),
296-306.
Newcombe, G., Morrison, J., Hepplewhite, C. and Knappe, D. (2002) Simultaneous adsorption
of MIB and NOM onto activated carbon: II. Competitive effects. Carbon 40(12), 2147-2156.
Randtke, S.J. and Snoeyink, V.L. (1983) Evaluating GAC adsorptive capacity. Journal of the
American Water Works Association, 406-413.
Scharf, R.G., Johnston, R.W., Semmens, M.J. and Hozalski, R.M. (2010) Comparison of batch
sorption tests, pilot studies, and modeling for estimating GAC bed life. Water Research 44(3),
769-780.
Srinivasan, R. and Sorial, G.A. (2011) Treatment of taste and odor causing compounds 2-methyl
isoborneol and geosmin in drinking water: A critical review. Journal of Environmental Sciences
23(1), 1-13.
Zamyadi, A., Henderson, R., Stuetz, R., Hofmann, R., Ho, L. and Newcombe, G. (2015) Fate of
geosmin and 2-methylisoborneol in full-scale water treatment plants. Water Research 83, 171-
183.
Yi Li 42
Department of Civil Engineering, University of Toronto 2015
4 RECOMMENDATIONS FOR FUTURE WORK
The main objective of this research was to develop a protocol for applying the mini column test
on a routine basis to track GAC performance for future studies, and the results demonstrated that,
at least under the conditions tested, it was sufficiently accurate to be useful in practice. This
method, however, can be further optimized. Additionally, this bench-scale test can be applied to
investigate other factors that might affect the GAC performance. Accordingly, several
recommendations derived from this study are listed below:
1. In order to simulate the pilot-scale filters more accurately using a short bed mini column
adsorber, different types of representative GAC particles accounting for the largest
surface area fraction should be tested. This might include utilizing air-dried GAC, freeze-
dried GAC and mixed wet GAC with the same particle size distribution as in a full-scale
contactor.
2. The results presented here provide evidence that the application of hydrogen peroxide
with GAC should be further explored. The data from Lorne Park suggested that relatively
exhausted GAC, when newly introduced to H2O2, may have a substantial increase in
adsorption or destruction of both geosmin and MIB. Such applications might prove useful
during taste and odour events. It would further be interesting to explore the mechanisms
involved in the reaction between H2O2 and aged GAC.
3. In future work, the mini column tests should be conducted using different types of GAC
in different water matrices, and with GAC from facilities utilizing very different
treatment trains. These variabilities will enable clarification as to the importance of GAC
type, water characteristics (e.g., temperature, pH, NOM, inorganics present), and the
impact of treatment plant design.
4. The effect of biological activity in a GAC contactor should also be studied using the mini
column test with sterilized GAC and non-sterilized GAC.
5. The effect of water and GAC temperature during the mini column test should be
determined.

Yi Li 43
Department of Civil Engineering, University of Toronto 2015
4.1 REFERENCES
Zamyadi, A., Henderson, R., Stuetz, R., Hofmann, R., Ho, L. and Newcombe, G. (2015) Fate of
geosmin and 2-methylisoborneol in full-scale water treatment plants. Water Research 83, 171-
183.

Yi Li
Department of Civil Engineering, University of Toronto 2015
APPENDICES

Yi Li A-1
Department of Civil Engineering, University of Toronto 2015
A. PRELIMINARY TESTS
A.1 DETERMINING GAC PARTICLE SIZE DISTRIBUTION BY DRY SIEVE TEST
A.1.1 Equipment
Sieves (#8 (2.36 mm), 10 (2 mm), 12 (1.7 mm), 14 (1.4 mm), 16 (1.18 mm), 18 (1 mm), 20
(0.841 mm), 25 (0.71 mm) and 30 (0.232 mm)), sieve shaker, balance, plastic bags, drying oven,
desiccator, drying crucibles, wire brushes, Wilson GAC core sampler (consisting of a long PVC
pipe with a tennis ball on a rope)
Prior to GAC sample collection, the core sampler was disinfected with 12% chlorine solution
and rinsed with sample water. A filter backwash was initiated to fluidize the GAC bed in order to
more easily submerge the coring device to the bottom of the contactor. With the bed was
fluidized, the core sampler was fully submerged and the rope with tennis ball was pulled to plug
the far end of the pipe. Excess water was poured off the top of the core sampler, and the GAC
sample was carefully poured out across plastic bags to enable the collection of different filter
depths (i.e., top, middle, bottom). The samples were taken at several different locations
throughout the filter bed to be representative of the entire filter. The GAC samples for mini
column experiments were stored in Ziploc bags at 4°C.
A.1.2 Sample Preparation
1. GAC samples were placed in a bucket and gently washed with sample water. Clean
samples were put into drying crucibles and baked in a drying oven for 24 hr at 105C.
2. Sieves were weighed, and arranged on the shaker in order of size (largest mesh size at the
top).
3. GAC samples were removed from the drying oven and allowed to cool to room
temperature (<30 min).
4. Five hundred grams of media was placed in the top of sieves and shaken for 3 minutes.
(Note: In absence of a shaker, this step can be done by hand).
5. After shaking was complete, each sieve was re-weighed and the weight of GAC was
determined for each. The total weight was determined to be 500g±5.0g.

Yi Li A-2
Department of Civil Engineering, University of Toronto 2015
The GAC samples from Lorne Park WTP and Barrie SSWTP were analysed for particle size
distribution and are illustrated in Figure A.1 and A.2. The most representative size fraction of dry
GAC from both Lorne Park and Barrie was determined to be the particles retained in sieve #12
(1.7mm), weighing 20% and 27%, respectively.
Figure A. 1: Particle size distribution of dry GAC samples from Lorne Park WTP
Figure A. 2: Particle size distribution of dry GAC samples from Barrie SSWTP
0%
10%
20%
30%
40%
50%
60%
70%
80%
90%
100%
0 0.5 1 1.5 2 2.5
per
cen
tage
pas
sin
g b
y w
eigh
t
sieve opening (mm)
0%
10%
20%
30%
40%
50%
60%
70%
80%
90%
100%
0 0.5 1 1.5 2 2.5
Per
cen
tage
pas
sin
g b
y w
eigh
t
Sieve opening (mm)
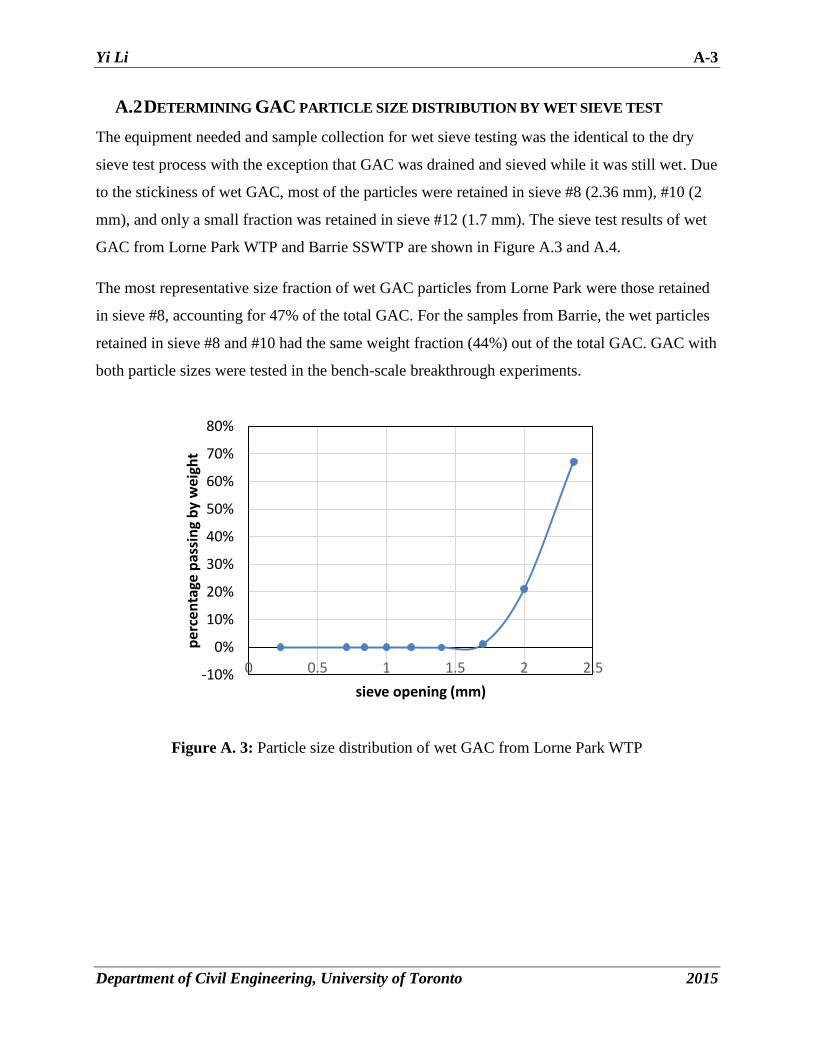
Yi Li A-3
Department of Civil Engineering, University of Toronto 2015
A.2 DETERMINING GAC PARTICLE SIZE DISTRIBUTION BY WET SIEVE TEST
The equipment needed and sample collection for wet sieve testing was the identical to the dry
sieve test process with the exception that GAC was drained and sieved while it was still wet. Due
to the stickiness of wet GAC, most of the particles were retained in sieve #8 (2.36 mm), #10 (2
mm), and only a small fraction was retained in sieve #12 (1.7 mm). The sieve test results of wet
GAC from Lorne Park WTP and Barrie SSWTP are shown in Figure A.3 and A.4.
The most representative size fraction of wet GAC particles from Lorne Park were those retained
in sieve #8, accounting for 47% of the total GAC. For the samples from Barrie, the wet particles
retained in sieve #8 and #10 had the same weight fraction (44%) out of the total GAC. GAC with
both particle sizes were tested in the bench-scale breakthrough experiments.
Figure A. 3: Particle size distribution of wet GAC from Lorne Park WTP
-10%
0%
10%
20%
30%
40%
50%
60%
70%
80%
0 0.5 1 1.5 2 2.5
per
cen
tage
pas
sin
g b
y w
eigh
t
sieve opening (mm)

Yi Li A-4
Department of Civil Engineering, University of Toronto 2015
Figure A. 4: Particle size distribution of wet GAC from Barrie SSWTP
-10%
0%
10%
20%
30%
40%
50%
60%
0 0.5 1 1.5 2 2.5
Per
cen
tage
pas
sin
g b
y w
eigh
t
Sieve opening (mm)

Yi Li B-1
Department of Civil Engineering, University of Toronto 2015
B. SUPPLEMENTARY DATA FOR CHAPTER 3
B.1 EFFECT OF COLUMN DIAMETER AND SIEVING METHODS
Figure B. 1: Breakthrough of (a) MIB and (b) geosmin over time through mini columns with
varying column diameters and sieving methods (error bars represent the max/min
value of replicate samples collected from duplicate columns)
0%
10%
20%
30%
40%
50%
60%
70%
80%
90%
0 10 20 30
Per
cen
t b
reak
thro
ugh
Operating time (hr)
a.
Dry GAC, ID=11mm
Dry GAC, ID=25mm
Wet GAC, ID=11mm
Wet GAC, ID=25mm
0%
5%
10%
15%
20%
25%
30%
35%
0 10 20 30
Per
cen
t b
reak
thro
ugh
Operating time (hr)
b.
Dry GAC, ID=11mm
Dry GAC, ID=25mm
Wet GAC, ID=11mm
Wet GAC, ID=25mm
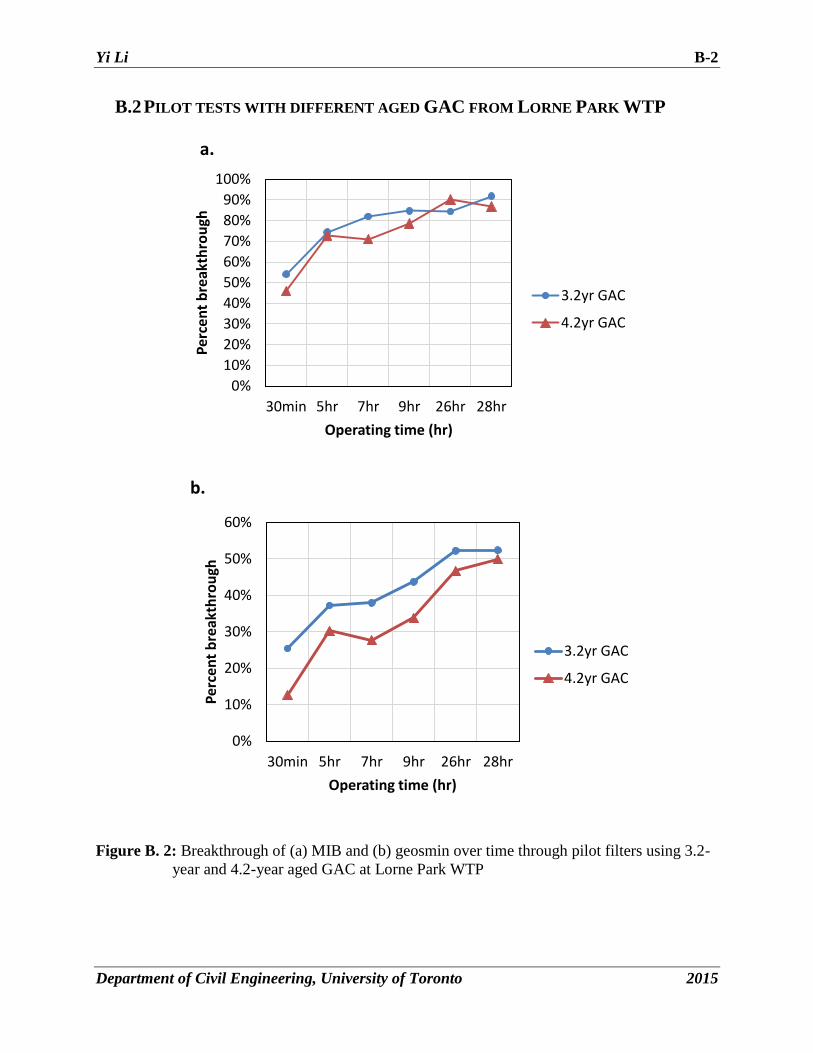
Yi Li B-2
Department of Civil Engineering, University of Toronto 2015
B.2 PILOT TESTS WITH DIFFERENT AGED GAC FROM LORNE PARK WTP
Figure B. 2: Breakthrough of (a) MIB and (b) geosmin over time through pilot filters using 3.2-
year and 4.2-year aged GAC at Lorne Park WTP
0%
10%
20%
30%
40%
50%
60%
70%
80%
90%
100%
30min 5hr 7hr 9hr 26hr 28hr
Per
cen
t b
reak
thro
ugh
Operating time (hr)
a.
3.2yr GAC
4.2yr GAC
0%
10%
20%
30%
40%
50%
60%
30min 5hr 7hr 9hr 26hr 28hr
Per
cen
t b
reak
thro
ugh
Operating time (hr)
b.
3.2yr GAC
4.2yr GAC

Yi Li B-3
Department of Civil Engineering, University of Toronto 2015
B.3 PILOT AND MINI COLUMN TESTS CONDUCTED ON SITE AT LORNE PARK
WTP
Figure B. 3 Breakthrough of (a) MIB and (b)geosmin over time from pilot and mini column tests
conducted at the same time at Lorne Park WTP (error bars represent the max/min
value of samples from duplicate mini columns)
0%
10%
20%
30%
40%
50%
60%
30min 2hr 4hr 6hr Day230min
Day 22hr
Day 24hr
Day 26hr
Per
cen
t b
reak
thro
ugh
Operating time
a.
pilot column
mini column
0%
5%
10%
15%
20%
25%
30%
30min 2hr 4hr 6hr Day230min
Day 22hr
Day 24hr
Day 26hr
Per
cen
t b
reak
thro
ugh
Operating time
b.
pilot column
mini column

Yi Li B-4
Department of Civil Engineering, University of Toronto 2015
B.4 PILOT COLUMN TEST AT BARRIE SSWTP
Figure B. 4 Breakthrough of MIB over time through the pilot filter at Barrie (Geosmin
breakthrough from this pilot filter was under the detection limit) (Error bars
represent the max/min value of samples from duplicate pilot filters)
(Note: the data from the pilot-scale geosmin breakthrough are under the MDL)
0%
5%
10%
15%
20%
25%
30%
35%
40%
45%
2hr 4hr 6hr Day22hr
Day23hr
Day24hr
Day25hr
Per
cen
t B
reak
thro
ugh
Operating time (hr)

Yi Li C-1
Department of Civil Engineering, University of Toronto 2015
C. TASTE AND ODOUR COMPOUND ANALYTICAL
METHODS
C.1 PRINCIPLE
Geosmin and 2-methylisoborneol (MIB) were extracted and concentrated from aqueous samples
by headspace solid phase micro-extraction (HS-SPME) and quantified using gas
chromatography-mass spectrometry (GC-MS). Geosmin and MIB were quantified using an
internal standard: d3-Geosmin. The internal standard was used to monitor retention time, relative
response, and quantify analytes in the sample. The analysis was carried out with a Varian® 3800
gas chromatograph with a Varian® ion-trap mass spectrometer detector, using electron impact
(EI) ionization and an autosampler.
Sample preparation involved first adding 10 mL of Milli-Q® water for calibration standards or
10 mL of the sample into a 20 mL clear vial (Supelco, Bellefonte, PA) that contained 3.5 g of
reagent grade sodium chloride (NaCl). Internal standards were then added to samples and
calibration standards by dispensing 25 μL of a solution of 10 μg/L of d3-Geosmin to achieve a 25
ng/L concentration. The vial was capped with a Teflon®-lined septum magnetic crimp cap
(Supelco, Bellefonte, PA), which is manufactured for use with the autosampler. Vials were
placed into a sample tray, where the autosampler took the sample vial and delivered it to a
spinning box that was preset to 65°C ± 1 °C at a rotation speed of 500 rev/min (rpm). Samples
were shaken for 5 minutes to dissolve the salt. The needle (23 gauge) containing a 1 cm long
SPME fiber (Supelco, Bellefonte, PA) was then inserted into the vial through the septum, and the
fiber was extended into the vial’s headspace for 30 minutes. At the end of contact time, the fiber
was retracted back into the needle, the needle injected into the GC/MS injection port, and the
GC/MS run was started. After five minutes of desorption, the sample was carried onto the GC
column and analyzed for MIB and geosmin content.

Yi Li C-2
Department of Civil Engineering, University of Toronto 2015
C.2 REAGENTS
Table C. 1: Reagents needed for MIB and geosmin analysis
Reagent [CASRN] Supplier and Purity
2-Methylisoborneol, MIB Sigma Aldrich (47523-U), 100 μg/mL in methanol
(±)-Geosmin Sigma Aldrich (47522-U), 100 μg/mL in methanol
D3-Geosmin
Methanol Sigma Aldrich (646377), ≥99.9%, Chromasolv® Plus
Acetone Sigma Aldrich (323772-2L), ≥99.5%, Reagent Plus®
Dichloromethane EMD (DX0838), HPLC grade
Sodium Azide Sigma Aldrich (S2002), ≥99.5%, Reagent Plus®
C.3 METHOD OUTLINE
C.3.1 Sampling and Storage
1. Prepared micro-column sampling glassware by adding 166 μL of 25 g/L Reagent Plus®,
≥99.5% sodium azide solution (Sigma-Aldrich, Oakville, ON). Sodium azide acts as a
preservative (Pei, 2003).
2. Collected samples in 23 mL amber vials with Teflon®-lined septa screw caps, ensuring that
the sample was headspace free.
3. Stored samples at 4°C for up to two weeks.
C.3.2 Geosmin and MIB solution preparation for spiking influent water (Micro-Column
Tests, Milli-Q® water based, 1mg/L)
1. 100 mL volumetric flasks were partially filled with Milli-Q® water.
2. A pipette was used to transfer 1 mL of geosmin (100 ppm) stock solution and 1 mL of
MIB (100 ppm) stock solution into the volumetric flask.
3. The volumetric flask to was filled to 100 mL with Milli-Q using a pasteur pipette.
4. The flask was stoppered, wrapped in aluminum foil, and mixed on a magnetic stir plate.
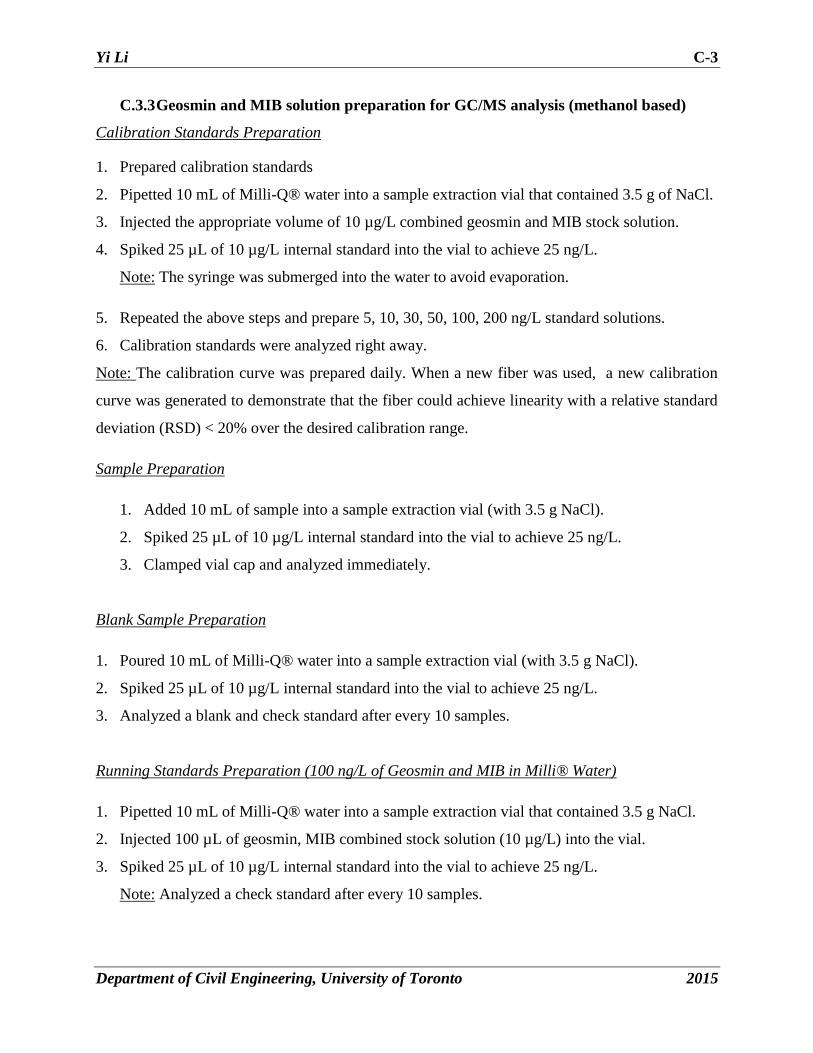
Yi Li C-3
Department of Civil Engineering, University of Toronto 2015
C.3.3 Geosmin and MIB solution preparation for GC/MS analysis (methanol based)
Calibration Standards Preparation
1. Prepared calibration standards
2. Pipetted 10 mL of Milli-Q® water into a sample extraction vial that contained 3.5 g of NaCl.
3. Injected the appropriate volume of 10 µg/L combined geosmin and MIB stock solution.
4. Spiked 25 µL of 10 µg/L internal standard into the vial to achieve 25 ng/L.
Note: The syringe was submerged into the water to avoid evaporation.
5. Repeated the above steps and prepare 5, 10, 30, 50, 100, 200 ng/L standard solutions.
6. Calibration standards were analyzed right away.
Note: The calibration curve was prepared daily. When a new fiber was used, a new calibration
curve was generated to demonstrate that the fiber could achieve linearity with a relative standard
deviation (RSD) < 20% over the desired calibration range.
Sample Preparation
1. Added 10 mL of sample into a sample extraction vial (with 3.5 g NaCl).
2. Spiked 25 µL of 10 µg/L internal standard into the vial to achieve 25 ng/L.
3. Clamped vial cap and analyzed immediately.
Blank Sample Preparation
1. Poured 10 mL of Milli-Q® water into a sample extraction vial (with 3.5 g NaCl).
2. Spiked 25 µL of 10 µg/L internal standard into the vial to achieve 25 ng/L.
3. Analyzed a blank and check standard after every 10 samples.
Running Standards Preparation (100 ng/L of Geosmin and MIB in Milli® Water)
1. Pipetted 10 mL of Milli-Q® water into a sample extraction vial that contained 3.5 g NaCl.
2. Injected 100 µL of geosmin, MIB combined stock solution (10 µg/L) into the vial.
3. Spiked 25 µL of 10 µg/L internal standard into the vial to achieve 25 ng/L.
Note: Analyzed a check standard after every 10 samples.
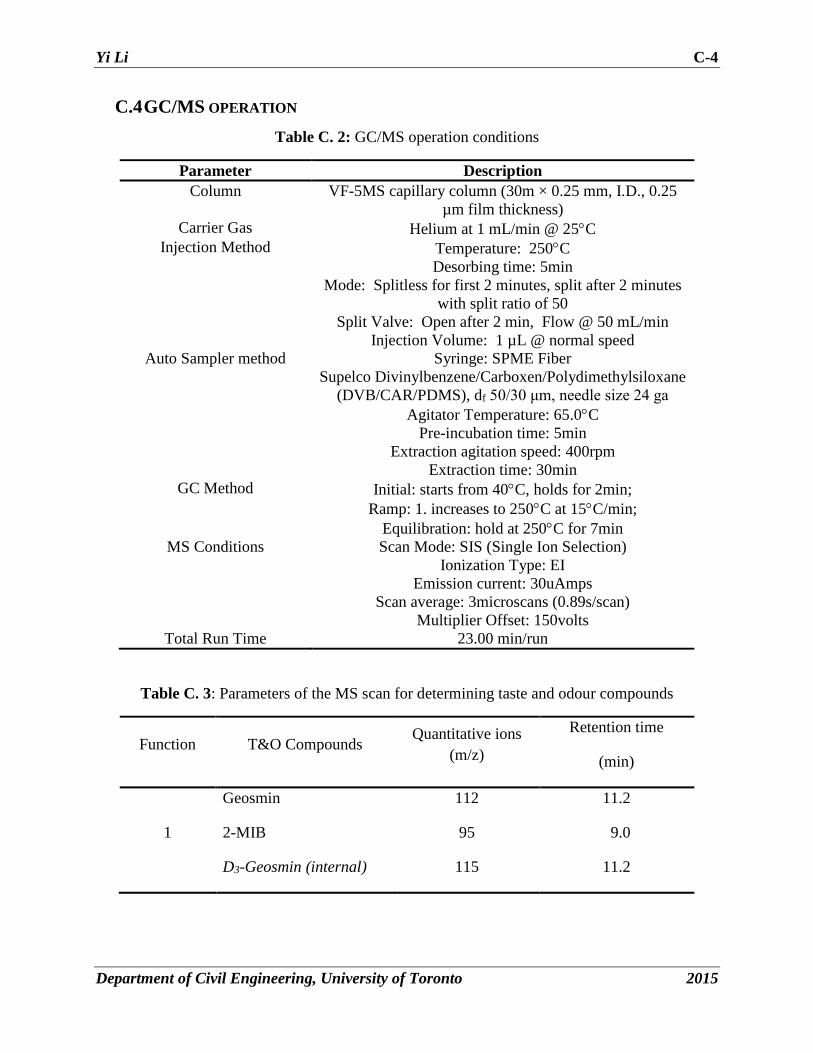
Yi Li C-4
Department of Civil Engineering, University of Toronto 2015
C.4 GC/MS OPERATION
Table C. 2: GC/MS operation conditions
Parameter Description
Column VF-5MS capillary column (30m × 0.25 mm, I.D., 0.25
µm film thickness)
Carrier Gas Helium at 1 mL/min @ 25C
Injection Method Temperature: 250C
Desorbing time: 5min
Mode: Splitless for first 2 minutes, split after 2 minutes
with split ratio of 50
Split Valve: Open after 2 min, Flow @ 50 mL/min
Injection Volume: 1 µL @ normal speed
Auto Sampler method Syringe: SPME Fiber
Supelco Divinylbenzene/Carboxen/Polydimethylsiloxane
(DVB/CAR/PDMS), df 50/30 μm, needle size 24 ga
Agitator Temperature: 65.0C
Pre-incubation time: 5min
Extraction agitation speed: 400rpm
Extraction time: 30min
GC Method Initial: starts from 40C, holds for 2min;
Ramp: 1. increases to 250C at 15C/min;
Equilibration: hold at 250C for 7min
MS Conditions Scan Mode: SIS (Single Ion Selection)
Ionization Type: EI
Emission current: 30uAmps
Scan average: 3microscans (0.89s/scan)
Multiplier Offset: 150volts
Total Run Time 23.00 min/run
Table C. 3: Parameters of the MS scan for determining taste and odour compounds
Function T&O Compounds Quantitative ions
(m/z)
Retention time
(min)
1
Geosmin
2-MIB
D3-Geosmin (internal)
112
95
115
11.2
9.0
11.2

Yi Li C-5
Department of Civil Engineering, University of Toronto 2015
C.5 CALCULATIONS
The taste and odour compound concentration was determined by correlation of the sample’s
response ratio (ratio of sample’s response to that of the internal standard) with a calibration curve
run daily. The calibration curve was determined using standards prepared with geosmin and MIB
(d3-geosmin as an internal standard) as an internal standard.
C.6 REFERENCES
Pei, Peng. (2003). Methyl isoborneol (MIB) and geosmin removal during ozone-biofiltration
treatment. Masters of Science Thesis, Arizona State University.

Yi Li D-1
Department of Civil Engineering, University of Toronto 2015
D. QA/QC
D.1 CALIBRATION CURVES
A seven-point calibration curve was prepared with each sample analysis. Additional quality
control included a blank sample at the beginning of the run, and a check standard after every 10
samples. The instrument performance drifted probably due to changes in the SPME fiber
(initially using a 2 cm fiber and switching to a 1 cm fiber), as well as changes to the instrument
(the GC column was replaced). Quality control charts were used to track the concentrations of
the running standards throughout the different runs as an indication of method performance.
Figure D. 1: An example of calibration curves for geosmin and MIB
y = 0.002x + 0.0065R² = 0.998
y = 0.0034x + 0.0155R² = 0.9998
0.00
0.10
0.20
0.30
0.40
0.50
0.60
0.70
0.80
0 50 100 150 200 250
Are
a R
atio
Concentration (ng/L)
MIB
Geosmin

Yi Li D-2
Department of Civil Engineering, University of Toronto 2015
D.2 CHECK STANDARDS
A quality control chart was maintained for the analysis of geosmin and MIB using check
standards with a concentration of 100 ng/L for both compounds. Check standards were prepared
at the same time and in the same manner as the and analyzed every 5 to 10 samples. As
demonstrated in Figure D.2 below, check standards were plotted on quality control charts.
60
70
80
90
100
110
120
130
140
1 2 3 4 5 6 7 8 9 10 11 12 13 14 15 16 17 18 19 20 21 22 23 24 25
Co
nce
ntr
atio
n (
ng/
L)
Sample no.
a.
UCL
UWL
LWL
LCL
Avg.

Yi Li D-3
Department of Civil Engineering, University of Toronto 2015
Figure D. 2: Quality control chart for (a) MIB and (b) geosmin
D.3 METHOD DETECTION LIMIT
The method detection limits (MDLs) for the analysis of geosmin and MIB were determined by
multiplying the standard deviation of 9 replicate injections by the student-t value. The average
concentration of MDL samples for MIB and geosmin was 42 ng/L and 25 ng/L, respectively.
The calculated MDL of geosmin and MIB was 8 ng/L and 9 ng/L, respectively. The results of 9
replicates are indicated in the table below.
60
70
80
90
100
110
120
1 2 3 4 5 6 7 8 9 10 11 12 13 14 15 16 17 18 19 20 21 22 23 24 25
Co
nce
ntr
atio
n (
ng/
L)
Sample no.
b.
UCL
UWL
LWL
LCL
Avg.

Yi Li D-4
Department of Civil Engineering, University of Toronto 2015
Table D. 1: Calculation of method detection limit for geosmin and MIB
Sample #
Peak Area count Peak area ratio
Calculated
concentration
(ng/L)
MIB Geosmin D3-
geosmin
MIB/
D3-
geosmin
Geosmin/
D3-
geosmin
MIB Geosmin
1 4.33E+05 4.93E+05 4.80E+06 0.09 0.10 41.70 25.47
2 4.05E+05 4.49E+05 4.36E+06 0.09 0.10 42.94 25.54
3 4.07E+05 4.75E+05 4.61E+06 0.09 0.10 40.71 25.53
4 4.14E+05 4.92E+05 4.89E+06 0.08 0.10 38.93 24.86
5 4.08E+05 4.64E+05 4.76E+06 0.09 0.10 39.40 23.95
6 4.27E+05 4.54E+05 4.08E+06 0.10 0.11 48.87 27.95
7 3.97E+05 3.54E+05 4.43E+06 0.09 0.08 41.32 18.77
8 4.10E+05 4.92E+05 4.86E+06 0.08 0.10 38.77 25.00
9 4.07E+05 4.78E+05 4.44E+06 0.09 0.11 42.45 26.94
Mean 41.68 24.89
Standard deviation 3.09 2.58
RSD 7% 10%
MDL (ng/L) 8.94 7.46
D.4 BLANK TEST WITH MINI COLUMNS
Blank tests were conducted to prove that taste and odour compounds were not lost from the mini
column systems, which could potentially include adsorption onto the surface of glass beads or in
the Teflon tubing. The spiked influent was loaded in the mini columns packed with glass beads
for more than 8 hours. Blank tests were conducted in glass columns with different internal
diameters (i.e., ID=11mm and ID=25mm) in duplicate. The effluent analysis demonstrated that
negligible adsorption occurred for both compounds in the blank mini column systems without
GAC (Figure D.3).

Yi Li D-5
Department of Civil Engineering, University of Toronto 2015
Figure D. 3: Breakthrough of (a) MIB and (b) geosmin over 8 hours through blank mini column
systems packed with glass beads (error bars represent the max/min values of samples
from duplicate columns)
0%
20%
40%
60%
80%
100%
120%
0 2 4 6 8 10
Per
cen
t b
reak
thro
ugh
Operating time (hr)
a.
Mini column ID=11mm
Mini column ID=25mm
0%
20%
40%
60%
80%
100%
120%
0 2 4 6 8 10
Per
cen
t b
reak
thro
ugh
Operating time (hr)
b.
Mini column ID=11mm
Mini column ID=25mm