estimating the size of the shadow economy: methods ... · pdf filedepartment of economics...
TRANSCRIPT

DDEEPPAARRTTMMEENNTT OOFF EECCOONNOOMMIICCSS
JJOOHHAANNNNEESS KKEEPPLLEERR UUNNIIVVEERRSSIITTYY OOFF
LLIINNZZ
Johannes Kepler University of Linz Department of Economics
Altenberger Strasse 69 A-4040 Linz - Auhof, Austria
www.econ.jku.at
Friedrich.schneider @jku.at phone: +43 732 2468 8210
Estimating the Size of the Shadow Economy: Methods, Problems and Open Questions
by
Andreas BUEHN*)
Friedrich SCHNEIDER
Working Paper No. 1322 December 2013
03.12.2013 1 of 40
December, 2013
Estimating the Size of the Shadow Econo-
my: Methods, Problems and Open Ques-
tions*
by
Friedrich Schneider**
and
Andreas Buehn***
Abstract: This paper presents the various methods to estimate the size of the shadow econo-my, their strengths and weaknesses. The purpose of the paper is twofold. Firstly, it demon-strates that no ideal method to estimate the size and development of the shadow economy ex-ists. Because of its flexibility, the MIMIC method used to get macro-estimates of the size of the shadow economy is discussed in greater detail. Secondly, the paper focuses on the definition and causal factors of the shadow economy as well as on a comparison of the size of the shad-ow economy using different estimation methods.
JEL-Classification: D78, E26, H2, H11, H26, K42, O5, O17
Keywords: shadow economy estimates, MIMIC approach, methods to estimate the shadow economy, advantages and disadvantages of the measurement methods
* A first version of this paper was presented at the workshop “Shedding light on the shadow of econ-
omy: A critical assessment of methods in tax research”, organized by Christoph Kogler, Eva Hofmann
and Erich Kirchler, all University of Vienna, Thursday, September 26, and Friday, September 27,
2013.
** Prof. Dr. Friedrich Schneider, Department of Economics, Johannes Kepler University of Linz, Al-
tenbergerstr. 69, A-4040 Linz, Austria. Phone: +43-732-2468-8210, Fax: +43-732-2468-8209. E-mail:
[email protected], http://www.econ.jku.at/schneider.
*** Dr. Andreas Buehn, Senior Research Fellow, Institute for Advanced Sustainability Stud-ies (IASS) Potsdam e.V., Platform Enabling Technologies for Sustainability (ETS), Berliner Str. 130, D-14467 Potsdam, Germany, Phone +49-331-2882-2396, Fax + 49-331-2882-2406. Email: [email protected], http://www.iass-potsdam.de.
03.12.2013 2 of 40
1. INTRODUCTION
Empirical research about the size and development of the shadow economy all over the world
has strongly increased.1) There are nowadays so many studies, which use different methods in
order to estimate the size and development of the shadow economy, that it is quite difficult to
judge the reliability of various methods. Hence, the goal of this paper is to critically review
the various methods estimating the size of the shadow economy and to discuss their strengths
and weaknesses. This shall enable an interested reader to realize what advantages and disad-
vantages the different methods have.
The paper is structured as follows: In the next section very shortly some theoretical considera-
tions are made, starting with a definition of the shadow economy and a brief discussion of its
main causes. In section 3 the various measurement methods as well as their strengths and
weaknesses are presented. This section also presents estimates of the size of the shadow
economy in Germany using different estimation methods. Finally, section 4 presents a sum-
mary and some concluding remarks.
2. THEORETICAL CONSIDERATIONS
2.1. Defining the shadow economy
Researchers attempting to measure the size of shadow economy face the question of the defi-
nition.2) One commonly used working definition is all currently unregistered economic activi-
ties that would contribute to the officially calculated (or observed) Gross National Product if
observed.3) Smith (1994, p. 18) uses the definition “market-based production of goods and
1) See e.g. Feld and Schneider (2010), Gerxhani (2003), Schneider (2011), and Schneider and Williams (2013). 2) See Frey and Pommerehne (1984), Thomas (1992), Loayza (1996), Pozo (1996), Lippert and Walker (1997), Schneider (1994a, 1994b, 1997, 1998a, 2003, 2005, 2011), Johnson, Kaufmann, and Shleifer (1997), Johnson, Kaufmann and Zoido-Lobatón (1998a), Belev (2003), Gerxhani (2003), and Pedersen (2003). For newer surveys, see Schneider and Enste (2000, 2002), Schneider and Williams (2013), Alm, et al. (2004) and Feld and Schnei-der (2010). 3)
This definition is used, for example, by Feige (1989, 1994), Schneider (1994a, 2003, 2005, 2011), and Frey and Pommerehne (1984). Do-it-yourself activities are not included. For estimates of the shadow economy and do-it-yourself activities for Germany, see Buehn, Karmann and Schneider (2009). This definition is taken from Del’Anno (2003), Del’Anno and Schneider (2004) and Feige (1989). See also Thomas (1999), Fleming, Roman and Farrell (2000).

03.12.2013 3 of 40
services, whether legal or illegal, that escapes detection in the official estimates of GDP.”
One of the broadest definitions includes “those economic activities and the income derived
from them that circumvent government regulation, taxation or observation”.4) As these defini-
tions still leave a lot of questions open, table 2.1 is helpful for developing a feeling for what
could be a reasonable consensus definition of the underground (or shadow) economy. From
table 2.1, it is clear that a broad definition of the shadow economy includes unreported in-
come from the production of legal goods and services, either from monetary or barter transac-
tions – and so includes all economic activities that would generally be taxable were they re-
ported to the tax authorities.
Table 2.1: A taxonomy of types of underground economic activities
Type of activity Monetary transactions Non-monetary transactions Illegal Activi-
ties
Trade with stolen goods; drug dealing and manufacturing; prostitution; gambling; smuggling; fraud; etc.
Barter of drugs, stolen goods, smug-gling etc. Produce or growing drugs for own use. Theft for own use.
Tax Evasion
Tax Avoidance
Tax Evasion
Tax Avoidance
Legal Activi-
ties
Unreported in-come from self-employment; Wages, salaries and assets from unreported work related to legal services and goods
Employee dis-counts, fringe benefits
Barter of legal services and goods
All do-it-yourself work and neigh-bor help
Structure of the table is taken from Lippert and Walker (1997, p. 5) with additional remarks
This paper uses the following more narrow definition of the shadow economy.5) The shadow
economy includes all market-based legal production of goods and services that are deliberate-
ly concealed from public authorities for the following reasons:
(1) to avoid payment of taxes, e.g. income taxes or value added taxes,
(2) to avoid payment of social security contributions,
(3) to avoid certain legal labor market standards, such as minimum wages,
maximum working hours, safety standards, etc., and
4) This definition is taken from Del’Anno (2003), Del’Anno and Schneider (2004) and Feige (1989). See also Thomas (1999), Fleming, Roman and Farrell (2000). 5) Compare also the excellent discussion of the definition of the shadow economy in Pedersen (2003, pp.13-19), who uses a similar definition.

03.12.2013 4 of 40
(4) to avoid complying with certain administrative procedures, such as com-
pleting statistical questionnaires or other administrative forms.
2.2. Theorizing about the Shadow Economy
A useful starting point for a theoretical discussion of the shadow economy is the paper by
Allingham and Sandmo (1972) on income tax evasion. While the shadow economy and tax
evasion are not congruent, activities in the shadow economy in most cases imply the evasion
of direct or indirect taxes, such that the factors determining tax evasion will most certainly
also affect the shadow economy. According to Allingham and Sandmo tax compliance de-
pends on its expected costs and benefits. The benefits of tax non-compliance result from the
individual marginal tax rate and the true individual income. In the case of the shadow econo-
my the individual marginal tax rate is often roughly calculated using the overall tax burden
from indirect and direct taxes including social security contributions. The expected costs of
non-compliance derive from deterrence enacted by the state, i.e., the state’s auditing activities
raising the probability of detection and the fines individuals face when they are caught. Indi-
vidual morality also plays a role for compliance and additional costs could pertain beyond the
tax administration’s pure punishment in the form of psychic costs like shame or regret, but
also additional pecuniary costs if, for example, a reputation loss results.
Individuals are rational calculators who weight the costs and benefits a legal status entails.
Their decision to partially or completely participate in the shadow economy is a choice under
uncertainty facing a trade-off between the gains if their activities are not discovered and a loss
if discovered and penalized. Shadow economic activities SE thus negatively depend on the
probability of detection p and potential fines f, and positively on the opportunity costs of re-
maining formal denoted as B. The opportunity costs are positively determined by the burden
of taxation T and high labour costs W – the individual income generated in the shadow econ-
omy is usually categorized as labor income rather than capital income – due to labour market
regulations. Hence, the higher the tax burden and labor costs, the more incentives individuals
have to avoid those costs by working in the shadow economy. The probability of detection p
itself depends on enforcement actions A taken by the tax authority and on facilitating activi-
ties F accomplished by individuals to reduce detection of shadow economic activities. This
discussion suggests the following structural equation:

03.12.2013 5 of 40
SE = SE p−
A,+
F−
; f
−;B
+T+,W
+
. (1)
Hence, shadow economic activities may be defined as those economic activities and income
earned that circumvent government regulation, taxation or observation. More narrowly, the
shadow economy includes monetary and non-monetary transaction of legal nature, hence all
productive economic activities that would generally be taxable were they reported to the state
(tax) authorities. Those activities are deliberately concealed from public authorities to avoid
payment of income, value added or other taxes and social security contributions, to avoid
compliance with certain legal labor market standards, such as minimum wages, maximum
working hours, or safety standards and administrative procedures. The shadow economy thus
focuses on productive economic activities that would normally be included in the national
accounts but which remain underground due to tax or regulatory burdens.6) Although such
legal activities would contribute to the country’s value added, they are not captured in the
national accounts because they are produced in illicit ways. Informal household economic
activities such as do-it-yourself activities and neighborly help are typically excluded in the
analysis of the shadow economy.7)
Kanniainen, Pääkönen and Schneider (2004) incorporate many of these insights in their model
of the shadow economy. They hypothesize that tax hikes unambiguously increase the shadow
economy, while the availability of public goods financed by taxes moderates participation in
the shadow economy. The latter effect however depends on the ability to access those public
goods. A shortcoming of this analysis is the neglected endogeneity of tax morale and good
governance, which is addressed by Feld and Frey (2007) who argue that tax compliance is the
result of a complicated interaction between tax morale and deterrence measures. It must be
clear to taxpayers what the rules of the game are and as deterrence measures serve as signals
for the level of tax morale a society wants to elicit (Posner, 2000), deterrence may also crowd
out the intrinsic motivation to pay taxes. Tax morale does not only increase if taxpayers per-
ceive the public goods received in exchange for their tax payments. It may also decrease if
6) Although classical crime activities such as drug dealing are independent of increasing taxes and the causal variables included in the empirical models are only imperfectly linked (or causal) to classical crime activities, the footprints used to indicate shadow economic activities such as currency in circulation also apply for the classic crime. Hence, macroeconomic shadow economy estimates do typically not distinguish legal from illegal under-ground activities; rather they represent the whole informal economy spectrum. 7) From a social perspective, may even from an economic one, soft forms of illicit employment, such as moon-lighting (e.g. construction work in private homes) and its contribution to aggregate value added may be assessed positively. For a discussion of these issues see Thomas (1992) and Buehn, Karmann and Schneider (2009).

03.12.2013 6 of 40
individuals perceive political decisions for public activities or the treatment of taxpayers by
the tax authorities to be unfair. Tax morale is thus not exogenously given but influenced by
deterrence and the quality of state institutions. Table 2.2 presents an overview of the most
important determinants influencing the shadow economy.

03.12.2013 7 of 40
Table 2.2: The main causes determining the shadow economy
Causal variable Theoretical reasoning References
Tax and Social Securi-
ty Contribution Bur-
dens
The distortion of the overall tax burden affects labor-leisure choices and may stimu-late labor supply in the shadow economy. The bigger the difference between the total labor cost in the official economy and after-tax earnings (from work), the greater is the incentive to reduce the tax wedge and to work in the shadow economy. This tax wedge depends on social security burden/payments and the overall tax burden, mak-ing them to key determinants for the existence of the shadow economy.
E.g. Thomas (1992), Johnson, Kaufmann, and Zoido-Lobatón (1998a,b), Giles (1999), Tanzi (1999), (2003, 2005), Dell’Anno (2007), Dell’Anno, Gomez-Antonio and Alanon Pardo (2007), Buehn and Schneider (2012)
Quality of Institutions
The quality of public institutions is another key factor for the development of the informal sector. Especially the efficient and discretionary application of the tax code and regulations by the government plays a crucial role in the decision to work under-ground, even more important than the actual burden of taxes and regulations. In par-ticular, a bureaucracy with highly corrupt government officials seems to be associated with larger unofficial activity, while a good rule of law by securing property rights and contract enforceability increases the benefits of being formal. A certain level of taxation, mostly spent in productive public services, characterizes efficient policies. In fact, the production in the formal sector benefits from a higher provision of pro-ductive public services and is negatively affected by taxation, while the shadow economy reacts in the opposite way. An informal sector developing as a consequence of the failure of political institutions in promoting an efficient market economy, and entrepreneurs going underground, as there is an inefficient public goods provision, may reduce if institutions can be strengthened and fiscal policy gets closer to the me-dian voter’s preferences.
E.g. Johnson et al. (1998a,b), Friedman, Johnson, Kaufmann, and Zoido-Lobaton (2000), Dreher and Schneider (2009), Dreher, Kotsogiannis and Macorriston (2009), Schneider (2010), Buehn and Schneider (2012), Teobaldelli (2011), Teobaldelli and Schneider (2012)
Regulations
Regulations, for example labor market regulations or trade barriers, are another im-portant factor that reduces the freedom (of choice) for individuals in the official economy. They lead to a substantial increase in labor costs in the official economy and thus provide another incentive to work in the shadow economy: countries that are more heavily regulated tend to have a higher share of the shadow economy in total GDP. Especially the enforcement and not the overall extent of regulation – mostly not enforced – is the key factor for the burden levied on firms and individuals, making them operate in the shadow economy.
E.g. Johnson, Kaufmann, and Shleifer (1997), Johnson, Kauf-mann, and Zoido-Lobatón (1998b), Friedman, Johnson, Kaufmann, and Zoido-Lobaton (2000), Kucera and Roncolato (2008). Compare also Williams (2005, 2007) and Williams and Renooy (2007, 2009).

03.12.2013 8 of 40
Causal variable Theoretical reasoning References
Public Sector Services
An increase of the shadow economy may lead to fewer state revenues, which in turn reduce the quality and quantity of publicly provided goods and services. Ultimately, this may lead to increasing tax rates for firms and individuals, although the deteriora-tion in the quality of the public goods (such as the public infrastructure) and of the administration continues. The consequence is an even stronger incentive to partici-pate in the shadow economy. Countries with higher tax revenues achieved by lower tax rates, fewer laws and regulations, a better rule of law and lower corruption levels, should thus have smaller shadow economies.
E.g. Johnson, Kaufmann, and Zoido-Lobatón (1998a,b)
Tax Morale
The efficiency of the public sector also has an indirect effect on the size of the shad-ow economy because it affects tax morale. Tax compliance is driven by a psychologi-cal tax contract that entails rights and obligations from taxpayers and citizens on the one hand, but also from the state and its tax authorities on the other hand. Taxpayers are more heavily inclined to pay their taxes honestly if they get valuable public ser-vices in exchange. However, taxpayers are honest even in cases when the benefit principle of taxation does not hold, i.e. for redistributive policies, if such political decisions follow fair procedures. The treatment of taxpayers by the tax authority also plays a role. If taxpayers are treated like partners in a (tax) contract instead of subor-dinates in a hierarchical relationship, taxpayers will stick to their obligations of the psychological tax contract more easily. Hence, (better) tax morale and (stronger) so-cial norms may reduce the probability of individuals to work underground.
E.g. Feld and Frey (2007), Kirch-ler (2007), Torgler and Schneider (2009), Feld and Larsen (2005, 2009)
Deterrence
Despite the strong focus on deterrence in policies fighting the shadow economy and the unambiguous insights of the traditional economic theory of tax non-compliance, surprisingly little is known about the effects of deterrence from empirical studies. This is due to the fact that data on the legal background and the frequency of audits are not available on an international basis; even for OECD countries such data is dif-ficult to collect. Either is the legal background quite complicated differentiating fines and punishment according to the severity of the offense and the true income of the non-complier, or tax authorities do not reveal how intensively auditing is taking place. The little empirical survey evidence available demonstrates that fines and pun-ishment do not exert a negative influence on the shadow economy, while the subjec-tively perceived risk of detection does. However, the results are often weak and Granger causality tests show that the size of the shadow economy can impact deter-rence instead of deterrence reducing the shadow economy.
E.g. Andreoni, Erard and Feinstein (1998), Pedersen (2003), Feld and Larsen (2005, 2009)

03.12.2013 9 of 40
3. METHODS TO ESTIMATE THE SIZE OF THE SHADOW ECON-
OMY
Estimating the size of a shadow economy is a difficult and challenging task. In this chapter
we give a short but comprehensive overview on the various procedures for estimating the size
of a shadow economy. Three different categories of methods are most widely used, and each
is briefly discussed.
3.1. Direct approaches
These are microeconomic approaches that employ either well designed surveys and samples
based on voluntary replies or tax auditing and other compliance methods. Sample surveys
designed to estimate the shadow economy are widely used in a number of countries8). The
main disadvantages of this method are the flaws of all surveys. For example, the average pre-
cision and results depend greatly on the respondent’s willingness to cooperate, it is difficult to
assess the amount of undeclared work from a direct questionnaire, most interviewers hesitate
to confess to fraudulent behavior, and responses are of uncertain reliability, which makes it
difficult to calculate a true estimate (in monetary terms) of the extend of undeclared work.
The main advantage of this method lies in the detailed information about the structure of the
shadow economy but the results from these kinds of surveys are very sensitive to the way the
questionnaire is formulated9).
Estimates of the shadow economy can also be based on the discrepancy between income de-
clared for tax purposes and that measured by selective checks. Fiscal auditing programs have
been particularly effective in this regard. Since these programs are designed to measure the
amount of undeclared taxable income, they may also be used to calculate the size of the shad-
8)
The direct method of voluntary sample surveys has been extensively used for Norway by Isachsen et al. (1982), and Isachsen and Strom (1985). For Denmark this method is used by Mogensen et. al. (1995) in which they re-port „estimates“ of the shadow economy of 2.7% of GDP for 1989, of 4.2% of GDP for 1991, of 3.0% of GDP for 1993 and of 3.1% of GDP for 1994. In Pedersen (2003) estimates of the Danish shadow economy contain the years 1995 with 3.1% up to 2001 with 3.8%. See also newer studies like Feld and Larsen (2005, 2008, 2009) which reach similar sizes of the shadow economy for Germany. 9)
The advantages and disadvantages of this method are extensively dealt by Pedersen (2003), Mogensen (1985) and Mogensen et. al (1995) in their excellent and very carefully done investigations.
03.12.2013 10 of 40
ow economy.10) However, a number of difficulties beset this approach. First, using tax com-
pliance data is equivalent to using a (possibly biased) sample of the population. In general, the
selection of taxpayers for tax audits is not random but based on properties of submitted (tax)
returns that indicate a certain likelihood of tax fraud. Consequently, such a sample is not a
random one of the whole population, and estimates of the shadow economy based upon a bi-
ased sample may not be accurate. Second, estimates based on tax audits reflect only that por-
tion of the shadow economy income authorities discover, and this is likely to be only a frac-
tion of all hidden income.
To summarize:
Survey methods are likely to underestimate the shadow economy because people are likely to
under-declare in surveys what they are trying to hide from authorities. In order to minimize
the number of respondents dishonestly replying or totally declining answers to sensitive ques-
tions, structured interviews are undertaken (usually face to face), in which respondents slowly
become accustomed to the main purpose of the survey. The first part of the questionnaire aims
at shaping respondents’ perceptions of the issue’s intended. The second part asks questions
about the respondents’ activities in the shadow economy. A third part contains the usual so-
cio-demographic questions. Nevertheless, the results of the shadow economy estimates from
survey methods are clearly lower-bound estimated compared to other approaches.
Survey results can also be inconsistent internationally. In addition to the studies by Feld and
Larsen (2005, 2008, 2009), Haigner et al. (2011), and Enste and Schneider (2006) for Germa-
ny, survey methods have been applied in the Northern countries and Great Britain (Isachsen
and Strøm (1985), Pedersen (2003)) as well as in the Netherlands (Van Eck and Kazemier
(1988), Kazemier (2006). The questionnaires underlying these studies are broadly comparable
in design; however, recent attempts by the European Union to provide survey results for all
member states have run into great difficulties of comparability (Renooy et al. (2004), Europe-
an Commission (2007)). The wording of the questionnaires becomes more and more cumber-
some, depending on the culture of different countries with respect to the underground econo-
my.
A further disadvantage of these two direct methods (surveys and tax auditing) is the point
estimate character. While they capture shadow economic activities only partially and may be
10)
In the United States, IRS (1979, 1983), Simon and Witte (1982), Witte (1987), Clotefelter (1983), and Feige (1986). For a more detailed discussion, see Dallago (1990) and Thomas (1992).
03.12.2013 11 of 40
seen as lower bound estimates, they have one considerable advantage: they provide detailed
information about shadow economy activities, the structure and composition of the activities
as well as the socio-economic characteristics and motives of those who work in the shadow
economy.
3.2. Indirect approaches
These approaches, which are also called indicator approaches, are mostly macroeconomic and
use various economic and other indicators that contain information about the development of
the shadow economy (over time). Currently there are five indicators that leave some traces of
the shadow economy.
3.2.1 The discrepancy between national expenditure and income statistics
This approach is based on discrepancies between income and expenditure statistics. In nation-
al accounting the income measure of GNP should be equal to the expenditure measure of
GNP. Thus, if an independent estimate of the expenditure site of the national accounts is
available, the gap between the expenditure measure and the income measure can be used as an
indicator of the extent of the shadow economy.11) Since national accounts statisticians are
anxious to minimize this discrepancy, the initial discrepancy or first estimate, rather than the
published discrepancy, should be employed as an estimate of the shadow economy. If all the
components of the expenditure side are measured without error, then this approach would
indeed yield a good estimate of the size of the shadow economy. Unfortunately, however, this
is not the case. Instead, the discrepancy reflects all omissions and errors everywhere in the
national accounts statistics as well as shadow economy. These estimates may therefore be
crude and of questionable reliability.12)
11)
See, e.g., Franz (1983) for Austria; MacAfee (1980) O’Higgins (1989) and Smith (1985), for Great Britain; Petersen (1982) and Del Boca (1981) for Germany; Park (1979) for the United States. For a critical survey, see Thomas (1992). 12)
A related approach is pursued by Pissarides and Weber (1988), who use micro data from household budget surveys to estimate the extent of income understatement by self-employed.
03.12.2013 12 of 40
3.2.2 The discrepancy between the official and actual labor force
A decline in participation of the labor force in the official economy can be seen as an indica-
tion of increased activity in the shadow economy. If total labor force participation is assumed
to be constant, then a decreasing official rate of participation can be seen as an indicator of an
increase of shadow economic activities, ceteris paribus.13) One weakness of this method is
that differences in the rate of participation may also have other causes. Also, people can work
in the shadow economy and have a job in the official economy. Therefore such estimates may
be viewed as weak indicators of the size and development of the shadow economy.
3.2.3 The transactions approach
This approach has been fully developed by Feige.14) It is based upon the assumption that there
is a constant relation over time between the volume of transaction and official GNP, as sum-
marized by the well-known Fisherian quantity equation, or M*V = p*T (with M money, V
velocity, p prices, and T total transactions). Assumptions also have to be made about the ve-
locity of money and about the relationships between the value of total transactions p*T and
total (official + unofficial) nominal GNP. Relating total nominal GNP to total transactions,
the GNP of the shadow economy can be calculated by subtracting the official GNP from total
nominal GNP. However, to derive figures for the shadow economy, one must also assume a
base year in which there is no shadow economy and therefore the ratio of p*T to total nominal
(official = total) GNP was “normal” and would have been constant over time if there had been
no shadow economy. To obtain reliable shadow economy estimates, precise figures of the
total volume of transactions should be available, which might be especially difficult for cash
transactions, because they depend, among other factors, on the durability of bank notes in
terms of the quality of the papers on which they are printed.15) Also, the assumption is made
that all variations in the ratio between the total value of transaction and the officially meas-
ured GNP are due to the shadow economy. This means that a considerable amount of data is
required in order to eliminate financial transactions from “pure” cross payments, which are
legal and have nothing to do with the shadow economy. In general, although this approach is
13)
Such studies have been made for Italy, see e.g., Contini (1981) and Del Boca (1981); for the United States, see O’Neill (1983), for a critical survey, see again Thomas (1992). 14)
For an extended description of this approach, see Feige (1996); for a further application for the Netherlands, Boeschoten and Fase (1984), and for Germany, Langfeldt (1984). 15)
For a detailed criticism of the transaction approach see Boeschoten and Fase (1984), Frey and Pommerehne (1984), Kirchgaessner (1984), Tanzi (1982a,b, 1986), Dallago (1990), Thomas (1986, 1992, 1999) and Giles (1999a).
03.12.2013 13 of 40
theoretically attractive, the empirical requirements necessary to obtain reliable estimates are
so difficult to fulfill that its application can lead to doubtful results.
3.2.4 The currency demand approach
The currency demand approach was first used by Cagan (1958), who considered the correla-
tion between currency demand and tax pressure (as one cause of the shadow economy) for the
United States over the period 1919 to 1955. 20 years later, Gutmann (1977) used the same
approach but without any statistical procedures. Cagan’s approach was further developed by
Tanzi (1980, 1983), who estimated a currency demand function for the United States for the
period 1929 to 1980 in order to calculate the size of the shadow economy. His approach as-
sumes that shadow (or hidden) transactions are undertaken in the form of cash payments, so
as to leave no observable traces for the authorities. An increase in the size of the shadow
economy will therefore increase the demand for currency. To isolate the resulting excess de-
mand for currency, an equation for currency demand is estimated over time. All conventional
possible factors, such as the development of income, payment habits, interest rates, credit and
other debt cards as a substitute for cash and so on, are controlled for. Additionally, such vari-
ables as the direct and indirect tax burden, government regulation, state institutions and tax
morale, which are assumed to be the major factors causing people to work in the shadow
economy, are included in the estimation equation. The basic regression equation for the cur-
rency demand, proposed by Tanzi (1983), is the following:
ln (C / M2)t = βO + β1 ln (1 + TW)t + β2 ln (WS / Y)t + β3 ln Rt + β4 ln (Y / N)t + ut,
with β1 > 0, β2 > 0, β3 < 0, β4 > 0, where ln denotes natural logarithms, C/M2 is the ratio of
cash holdings to current and deposit accounts, TW is a weighted average tax rate (to proxy
changes in the size of the shadow economy), WS/Y is a proportion of wages and salaries in
national income (to capture changing payment and money holding patterns), R is the interest
paid on savings deposits (to capture the opportunity cost of holding cash) and Y/N is the per
capita income.16) Any “excess” increase in currency, or the amount unexplained by conven-
tional or normal factors is then attributed to the rising tax burden and other reasons leading
16)
The estimation of such a currency demand equation has been criticized by Thomas (1999) but part of this criticism has been considered by the work of Giles (1999a,b) and Bhattacharyya (1999), who both use the latest econometric technics.

03.12.2013 14 of 40
people to work in the shadow economy. Figures for the size and development of the shadow
economy can be calculated in a first step by comparing the difference between the develop-
ment of currency when the direct and indirect tax burden and government regulation are held
at lowest values, and the development of currency with the current (higher) burden of taxation
and government regulation. Assuming in a second step the same income velocity for currency
used in the shadow economy as for legal M1 in the official economy, the size of the shadow
can be computed and compared to the official GDP.
This is one of the most commonly used approaches. It has been applied to many countries17)
all over the world but has nevertheless been criticized on various grounds.18) The most com-
monly raised objections to this method are:
(1) Not all transactions in the shadow economy are paid in cash. Isachsen and Strom (1985)
used the survey method to find out that in Norway, in 1980, roughly 80 percent of all
transactions in the hidden sector were paid in cash. The size of the total shadow economy
(including barter) may thus be even larger than previously estimated.
(2) Most studies consider only one particular factor, the tax burden, as a cause of the shadow
economy. But others (such as the impact of regulation, taxpayers’ attitudes toward the
state, tax morality and so on) are not considered, because for most countries reliable data
is not available. If, as seems likely, these other factors also have an impact on the extent
of the hidden economy, it might again be higher than reported in most studies.19)
(3) As discussed by Garcia (1978), Park (1979), and Feige (1996), increases in currency de-
mand deposits are largely due to a slowdown in demand deposits rather than to an in-
crease in currency caused by activities in the shadow economy, at least in the case of the
United States.
17)
See Karmann (1986, 1990), Schneider (1997, 1998a), Johnson et al. (1998a) and Williams and Windebank (1995). 18)
See Thomas (1992, 1999), Feige (1986), Pozo (1996), Pedersen (2003) and Ahumada et al. (2004). 19)
One (weak) justification for the only use of the tax variable is that this variable has by far the strongest impact on the size of the shadow economy in the studies known to the authors. The only exception is the study by Frey and Weck-Hannemann (1984) where the variable “tax immorality“ has a quantitatively larger and statistically stronger influence than the direct tax share in the model approach. In the study of Pommerehne and Schneider (1985), for the U.S., besides various tax measures, data for regulation, tax immorality, minimum wage rates are available, the tax variable has a dominating influence and contributes roughly 60-70% to the size of the shadow economy. See also Zilberfarb (1986).

03.12.2013 15 of 40
(4) Blades (1982) and Feige (1986, 1996) criticize Tanzi’s studies on the grounds that the US
dollar is used as an international currency so that Tanzi should have considered (and con-
trolled for) the presence of US dollars, which are used as an international currency and
held in cash abroad.20) Frey and Pommerehne (1984) and Thomas (1986, 1992, 1999)
claim that Tanzi’s parameter estimates are not very stable.21)
(5) Most studies assume the same velocity of money in official and shadow economies. As
argued by Hill and Kabir (1996) for Canada and by Klovland (1984) for the Scandinavian
countries, there is considerable uncertainty about the velocity of money in the official
economy, and the velocity of money in the hidden sector is even more difficult to esti-
mate. Without knowledge about the velocity of currency in the shadow economy, one has
to accept the assumption of an equal velocity of money in both sectors.
(6) Ahumada, Alvaredo, Canavese, and Canavese (2004) show that the currency approach
together with the assumption of equal income velocity of money in the reported and the
hidden transaction is only correct if the income elasticity is 1.
(7) Finally, the assumption of no shadow economy in a base year is open to criticism. Relax-
ing this assumption would again imply an upward adjustment of the size of the shadow
economy.
3.2.5 The physical input (electricity consumption) method
3.2.5.1 The Kaufmann - Kaliberda Method22)
To measure overall (official and unofficial) economic activity in an economy, Kaufmann and
Kaliberda (1996) assume that electric-power consumption is regarded as the single best phys-
20)
Another study by Tanzi (1982, esp. pp. 110-113) explicitly deals with this criticism. A very careful investiga-tion of the amount of US dollars used abroad and US currency used in the shadow economy and for "classical" crime activities has been undertaken by Rogoff (1998), who concludes that large denomination bills are major driving force for the growth of the shadow economy and classical crime activities, due largely to reduced trans-actions costs. 21)
However in studies for European countries Kirchgässner (1983, 1984) and Schneider (1986) conclude that the estimation results for Germany, Denmark, Norway and Sweden are quite robust when using the currency de-mand method. Hill and Kabir (1996) find for Canada that the rise of the shadow economy varies with respect to the tax variable used; they conclude “when the theoretically best tax rates are selected and a range of plausible velocity values is used, this method estimates underground economic growth between 1964 and 1995 at between 3% and 11% of GDP.” (p.1553). 22)
This method was used earlier by Lizzeri (1979), Del Boca and Forte (1982), and then was used much later by Portes (1996), Kaufmann and Kaliberda (1996), Johnson et al. (1997). For a critique see Lackó (1998).

03.12.2013 16 of 40
ical indicator of overall (or official plus unofficial) economic activity. Overall economic ac-
tivity and electricity consumption have been empirically observed throughout the world to
move in lockstep with an electricity to GDP elasticity usually close to one. This means that
the growth of total electricity consumption is an indicator for growth of overall (official and
unofficial) GDP. By having this proxy measurement for the overall economy and then sub-
tracting from this overall measure the estimates of official GDP, Kaufmann and Kaliberda
(1996) derive an estimate of unofficial GDP. This method is very simple and appealing. How-
ever, it can also be criticized on various grounds:
(1) Not all shadow economy activities require a considerable amount of electricity (e.g. per-
sonal services), and other energy sources can be used (gas, oil, coal, etc.). Only a part of
the shadow economy will be indicated.
(2) Over time, there has been considerable technical progress so that both the production and
use of electricity are more efficient than in the past, and this will apply in both official
and unofficial uses.
(3) There may be considerable differences or changes in the elasticity of electricity/GDP
across countries and over time.23)
3.2.5.2 The Lackó method
Lackó (1998, 1999, 2000a,b) assumes that a certain part of the shadow economy is associated
with the household consumption of electricity. This part comprises the so-called household
production, do-it-yourself activities, and other non-registered production and services. Lackó
further assumes that in countries where the portion of the shadow economy associated with
the household electricity consumption is high, the rest of the hidden economy (or the part
Lackó cannot measure) will also be high. Lackó (1996, pp.19 ff.) assumes that in each coun-
try a part of the household consumption of electricity is used in the shadow economy.
Lackó’s approach (1998, p.133) can be described by the following two equations:
ln Ei = α1 ln Ci + α2 ln PRi + α3 Gi + α4 Qi + α5 Hi + ui , with α1 > 0, α2 < 0, α3 > 0, α4
< 0, α5 > 0 and
Hi= β1 Ti + β2 (Si – Ti) + β3 Di with β1 > 0, β2 < 0, β3 > 0
23)
Johnson et al. (1997) make an attempt to adjust for changes in the elasticity of electricity/GDP.
03.12.2013 17 of 40
where i indicates the number assigned to the country,
Ei is per capita household electricity consumption in country i,
Ci is per capita real consumption of households without the consumption of electricity in
country i in US dollars (at purchasing power parity),
PRi is the real price of consumption of 1 kWh of residential electricity in US dollars (at pur-
chasing power parity),
Gi is the relative frequency of months with the need of heating in houses in country i,
Qi is the ratio of energy sources other than electricity energy to all energy sources in house-
hold energy consumption,
Hi is the per capita output of the hidden economy,
Ti is the ratio of the sum of paid personal income, corporate profit and taxes on goods and
services to GDP,
Si is the ratio of public social welfare expenditures to GDP, and
Di is the sum on number of dependants over 14 years and of inactive earners, both per 100
active earners.
In a cross country study, she estimates the first equation substituting for Hi with the second
equation. For the calculation of the actual size (value added) of the shadow economy, Lackó
further must know how much GDP is produced by one unit of electricity in the shadow econ-
omy of each country. Since these data are not known, she takes the result of one of the known
shadow economy estimates calculated for a market economy with another approach for the
early 1990s, and applies this to the other countries. Lackó used the shadow economy of the
United States as such a base (the shadow economy value of 10.5% of GDP taken from Morris
(1993)) and calculated the size of the shadow economy for other countries. Lackó's method is
also open to criticism:
(1) Not all shadow economy activities require a considerable amount of electricity and other
energy sources can be used.
(2) Shadow economy activities do not take place only in the household sector.
(3) It is doubtful whether the ratio of social welfare expenditures can be used as the explana-
tory factor for the shadow economy, especially in transition and developing countries.
(4) It is questionable, which is the most reliable base value of the shadow economy in order
to calculate the size of the shadow economy for all other countries, especially for the

03.12.2013 18 of 40
transition and developing countries.
3.2.6 The model approach24)
All methods described so far consider just one indicator that to capture all effects of the shad-
ow economy. However, shadow economy effects show up simultaneously in the production,
labor, and money markets. An even more important critique is that the causes that determine
the size of the shadow economy are taken into account only in some of the monetary approach
studies that usually consider one cause, the burden of taxation. The model approach explicitly
considers multiple causes of the existence and growth of the shadow economy25), as well as
the multiple effects of the shadow economy over time. The empirical method used is quite
different from those used so far. It is based on the statistical theory of unobserved variables,
which considers multiple causes and multiple indicators of the phenomenon to be measured.
As the size of the shadow economy is an unknown (hidden) figure, a latent estimator ap-
proach using the MIMIC (i.e. multiple indicators, multiple causes estimation) procedure is
applied. This method is based on the statistical theory of unobserved variables. The statistical
idea behind such a model is to compare a sample covariance matrix, that is, a covariance ma-
trix of observable variables, with the parametric structure imposed on this matrix by a hy-
pothesized model.26) Using covariance information among the observable variables, the unob-
servable variable is in the first step linked to observable variables in a factor analytical model
also called measurement model. Second, the relationships between the unobservable variable
and observable variables are specified through a structural model. Therefore, a MIMIC model
is the simultaneous specification of a factor and a structural model. In this sense, the MIMIC
model tests the consistency of a ‘structural’ theory through data and is thus a confirmatory,
rather than an exploratory technique. An economic theory is thus tested examining the con-
sistency of actual data with the hypothesized relationships between the unobservable (latent)
24)
See also Aigner et al. (1988, p. 303), applying this approach for the United States over time; for Germany this approach has been applied by Karmann (1986, 1990). The pioneers of this approach are Weck (1983), Frey and Weck-Hannemann (1984), who applied this approach to cross-section data from the 24 OECD countries for various years. Before turning to this approach they developed the concept of „soft modeling“ (Frey et al. (1982), Frey and Weck (1983a,b)), an approach which has been used to provide a ranking of the relative size of the shadow economy in different countries. One paper dealing extensively with the MIMIC approach, its develop-ment and its weaknesses is from Del’Anno (2003) as well as the excellent study by Giles and Tedds (2002). 25)
Thomas (1992); Schneider (2003, 2005, 2011); Pozo (1996); Johnson et al. (1998a,b); Giles (1997a,b, 1999a,b,c); Giles and Tedds (2002), Giles et al. (2002), Del’Anno (2003) and Del’Anno and Schneider (2004). 26) Estimation of a MIMIC model with a latent variable can be done by means of a computer program for the analysis of covariance structures, such as LISREL (Linear Structural Relations). A useful overview of the LIS-REL software package in an economics journal is Cziraky (2004).

03.12.2013 19 of 40
variable or factor and the observable (measurable) variables.27) In general, a confirmatory
factor analysis has two goals: (i) to estimate parameters such as coefficients and variances;
and (ii) to assess the fit of the model. For the analysis of shadow economy activities these two
goals mean (i) to estimate the relationships between a set of observable variables, divided into
causes and indicators, and the shadow economy activity (unobservable variable); and (ii) to
test if the researcher’s theory or the derived hypotheses as a whole fit the data. MIMIC mod-
els are, compared to regression models, a rarely used method by economists, which might be
due to an under-evaluation of their capabilities with respect to their potential contribution to
economic research.
The idea of the MIMIC model application is to examine the relationships between the latent
variable size of shadow economy activities and observable variables in terms of the relation-
ships among a set of observable variables by using their covariance information. The observ-
able variables are divided into causes and indicators of the latent variable (see figure 3.1). The
key benefits of the MIMIC model are that it allows modelling shadow economy activities as
an unobservable (latent) variable and that it takes into account its multiple determinants
(causes) and multiple effects (indicators). A factor- analytic approach is used to measure the
size of shadow economy activities as an unobserved variable over time. The unknown coeffi-
cients are estimated in a set of structural equations, as the ‘unobserved’ variable, that is, the
size of the shadow economy cannot be measured directly. Formally, the MIMIC model con-
sists of two parts: the structural equation model and the measurement model.
Figure 3.1: The MIMIC model
27) On the contrary, in an exploratory factor analysis a model is not specified in advance, i.e., beyond the specifi-cation of the number of latent variables (factors) and observed variables the researcher does not specify any structure of the model. This means that one assumes that all factors are correlated, all observable variables are directly influenced by all factors, and all measurement errors are uncorrelated with each other. In practice, how-ever, the distinction between a confirmatory and an exploratory factor analysis is less strong. Facing poorly fit-ting models, researchers using the MIMIC model often modify their models in an exploratory way in order to improve the fit. Thus, most applications fall between the two extreme cases of exploratory (non- specified model structure) and confirmatory (ex- ante specified model structure) factor analysis (Long 1983a, pp. 11–17).
Y1t Y2t ... Ypt
CAUSES INDICATORS
Development of the shadow
economy
Z1t Z2t ... Zkt
03.12.2013 20 of 40
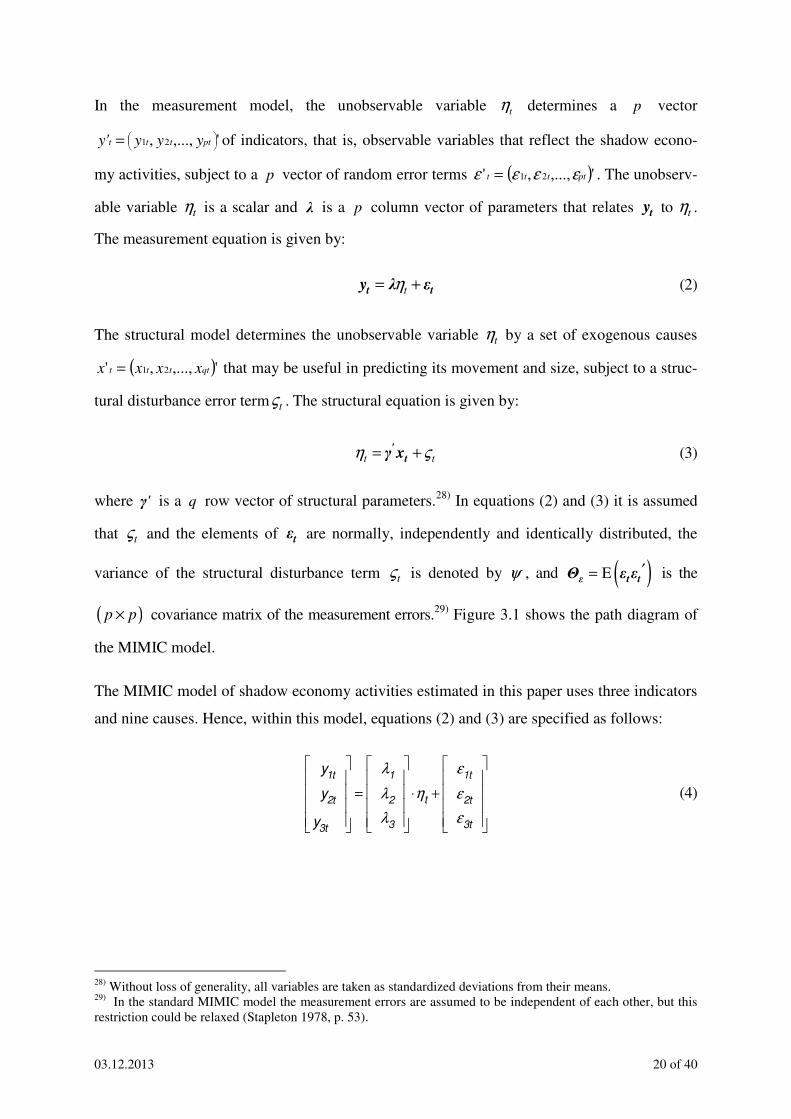
In the measurement model, the unobservable variable tη determines a p vector
',...,, 21
= ptttt yyyy' of indicators, that is, observable variables that reflect the shadow econo-
my activities, subject to a p vector of random error terms ( )',...,,' 21 ptttt εεεε = . The unobserv-
able variable tη is a scalar and λ is a p column vector of parameters that relates ty to tη .
The measurement equation is given by:
tη= +t ty λ ε (2)
The structural model determines the unobservable variable tη by a set of exogenous causes
( )',...,,' 21 qtttt xxxx = that may be useful in predicting its movement and size, subject to a struc-
tural disturbance error term tς . The structural equation is given by:
t tη ς= +'tγ x (3)
where 'γ is a q row vector of structural parameters.28) In equations (2) and (3) it is assumed
that tς and the elements of tε are normally, independently and identically distributed, the
variance of the structural disturbance term tς is denoted by ψ , and ( )E ′=ε t tΘ ε ε is the
( )p p× covariance matrix of the measurement errors.29) Figure 3.1 shows the path diagram of
the MIMIC model.
The MIMIC model of shadow economy activities estimated in this paper uses three indicators
and nine causes. Hence, within this model, equations (2) and (3) are specified as follows:
y1t
y2t
y3t
=
λ1
λ2
λ3
⋅ηt
+
ε1t
ε2t
ε3t
(4)
28) Without loss of generality, all variables are taken as standardized deviations from their means. 29) In the standard MIMIC model the measurement errors are assumed to be independent of each other, but this restriction could be relaxed (Stapleton 1978, p. 53).
03.12.2013 21 of 40
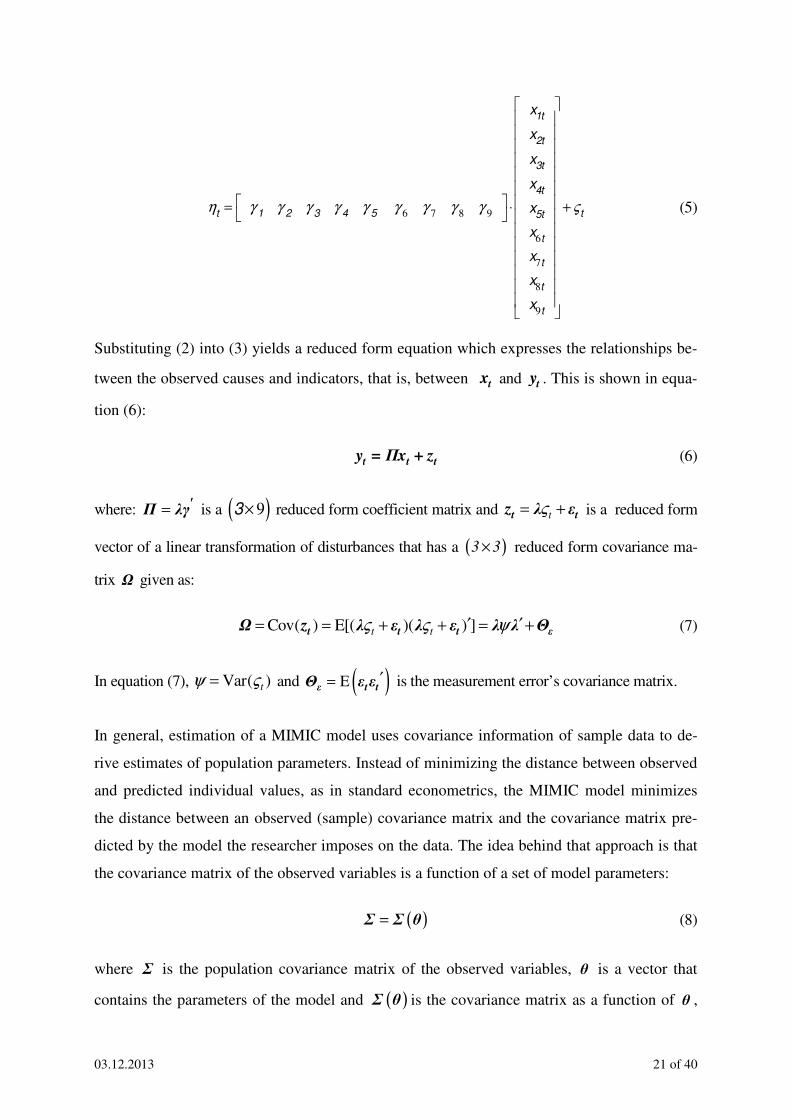
ηt
= γ1
γ2
γ3
γ4
γ5
γ 6 γ 7 γ 8 γ 9
⋅
x1t
x2t
x3t
x4t
x5t
x6t
x7t
x8t
x9t
+ ςt (5)
Substituting (2) into (3) yields a reduced form equation which expresses the relationships be-
tween the observed causes and indicators, that is, between tx and ty . This is shown in equa-
tion (6):
t t ty = Πx + z (6)
where: = 'Π λγ is a 3× 9( ) reduced form coefficient matrix and tς= +t tz λ ε is a reduced form
vector of a linear transformation of disturbances that has a ( )3 3× reduced form covariance ma-
trix Ω given as:
Cov( ) E[( )( ) ]t tς ς ψ′ ′= = + + = +t t t εΩ z λ ε λ ε λ λ Θ (7)
In equation (7), Var( )tψ ς= and ( )E ′=ε t tΘ ε ε is the measurement error’s covariance matrix.
In general, estimation of a MIMIC model uses covariance information of sample data to de-
rive estimates of population parameters. Instead of minimizing the distance between observed
and predicted individual values, as in standard econometrics, the MIMIC model minimizes
the distance between an observed (sample) covariance matrix and the covariance matrix pre-
dicted by the model the researcher imposes on the data. The idea behind that approach is that
the covariance matrix of the observed variables is a function of a set of model parameters:
( )=Σ Σ θ (8)
where Σ is the population covariance matrix of the observed variables, θ is a vector that
contains the parameters of the model and ( )Σ θ is the covariance matrix as a function of θ ,

03.12.2013 22 of 40
implying that each element of the covariance matrix is a function of one or more model pa-
rameters. If the hypothesized model is correct and the parameters are known, the population
covariance matrix would be exactly reproduced, that is, Σ will equal ( )Σ θ . In practice, how-
ever, one does not know either the population variances and covariances or the parameters,
but instead uses the sample covariance matrix and sample estimates of the unknown parame-
ters for estimation (Bollen 1989, p. 256).
Estimation is thus performed by finding values for ( )ˆ ˆ ˆˆˆ ˆ, , , ,f ψ= εθ λ γ Φ Θ producing an estimate
of the models covariance matrix Σ that most closely corresponds to the sample covariance
matrix S . During this estimation procedure, all possible matrices that meet the imposed re-
strictions are considered. If an estimate ∗Σ of Σ is close to S , one might conclude that *θ is a
reasonable estimate of the model’s parameters. Hence, estimation of a MIMIC model is re-
duced to the problem of measuring how close ∗Σ is to S and if this estimate is the most accu-
rate, that is, if it is the best estimate given the set of all possible estimates that meet the im-
posed restrictions (Long 1983b, pp. 42–5). The covariance equation of the MIMIC model can
be derived and has the following functional form:
( )ˆ ˆ ˆ ˆˆ ˆˆ ˆ ˆ ˆ
ˆˆˆ ˆˆ
ψ ′ ′ ′+ + = ′
ελ γ Φγ λ Θ λγ ΦΣ
Φγλ Φ (9)
The function measuring how close a given ∗Σ is to the sample covariance matrix S is called
the fitting function ( )*F ;S Σ . The *θ of all possible *
θ that meets the imposed constraints on λ ,
γ ,Φ , ψ , and εΘ and minimizes the fitting function, given the sample covariance matrix S , is
the sample estimate θ of the population parameters. This means that if one set of estimates *1θ
produces the matrix *1Σ and a second set *
2θ produces the matrix *2Σ and if
( ) ( )* *F ; F ;1 2<S Σ S Σ , *1Σ is then considered to be closer to S than *
2Σ (Long 1983a, p. 56).

03.12.2013 23 of 40
The most widely used fitting function is the Maximum Likelihood (ML) function.30) Under the
assumption that ( )Σ θ and S are positive definite, that is, nonsingular, and S has a Wishart
distribution, the following fitting function is minimized:
( ) ( )MLF log log ( )-1tr p q = + − − + Σ θ SΣ θ S (10)
where log is the log of the determinant of the respective matrix and ( )p q+ is the number of
observed variables. In general, no closed form or explicit solution for the structural parameters
that minimize MLF exists. Hence, the values of λ , γ ,Φ , ψ and εΘ that minimize the fitting
function are estimated applying iterative numerical procedures.31) The ML estimator is widely
used because of its desirable properties:32)
First, the ML estimator is asymptotically unbiased.
Second, the ML estimator is consistent, that is ˆplim =θ θ ( θ is the ML estimator and θ is the
population parameter).
Third, the ML estimator is asymptotically efficient, that is, among all consistent estimators no
other has a smaller asymptotic variance.
Fourth, the ML estimator is asymptotically normally distributed, meaning that the ratio of the
estimated parameter and its standard error approximate a z- distribution in large samples.
Fifth, a final important characteristic of the ML estimator is scale invariance (Swaminathan
and Algina 1978). The scale invariance property implies that changes in the measurement unit
of one or more of the observed variables do not change the value of the fitting function. This
means that λ , γ ,Φ , ψ and ˆεΘ are the same for any change of scale.
30) Other estimation procedures such as Unweighted Least Squares (ULS) and Generalized Least Squares (GLS) are also available. ULS has the advantage that it is easier to compute and leads to a consistent estimator without the assumption that the observed variables have a particular distribution. Important disadvantages of ULS are,
however, that ULS does not lead to the asymptotically most efficient estimator of θ and that ULSF is not scale
invariant. The GLS estimator has similar statistical properties like the ML estimator but the significance tests are
no longer accurate if the distribution of the observed variables has very ‘fat’ or ‘thin’ tails. Moreover, GLSF
accepts the wrong model more often than ML and parameter estimates tend to suffer when using GLSF . Thus,
ML seems to be superior (see, e.g. Bollen 1989, pp. 111–15; Ollsson et al. 1999, 2000; Jöreskog and Sörbom 2001, pp. 20–4). 31) See Appendix 4C in Bollen (1989) for details. 32) The properties are only briefly reviewed. For a detailed discussion see Bollen (1989, pp. 107–23).
03.12.2013 24 of 40
It is widely accepted by most scholars who estimate the size and development of shadow eco-
nomic activities using the MIMIC model or more general Structural Equation Models (SEMs)
with more than one unobservable variable, that such an empirical exercise is a ‘minefield’,
regardless of which method is used. For example, in evaluating the currently available shad-
ow economy estimates of different scholars, one should keep in mind that there is no best or
commonly accepted method. Each approach has its strengths and weaknesses and can provide
specific insights and results. Although SEM/MIMIC model applications in economics are
‘accompanied’ by criticisms, they are increasingly used for estimating the shadow economy
and other informal economic activities.
In comparison to other statistical methods, SEMs/MIMIC models offer several advantages for
the estimation of shadow economic activities. According to Giles and Tedds (2002), the
MIMIC approach is a wider approach than most other competing methods, since it allows one
to take multiple indicator and causal variables into consideration at the same time. Moreover,
it is quite flexible, allowing one to vary the choice of causal and indicator variables according
to the particular features of the shadow economic activity studied, the period in question, and
the availability of data. SEMs/MIMIC models lead to a formal estimation and to testing pro-
cedures, such as those based on the method of maximum likelihood. These procedures are
well known and are generally ‘optimal’, if the sample is sufficiently large (Giles and Tedds
2002). Schneider and Enste (2000) emphasize that these models lead to some progress in es-
timation techniques for the size and development of the shadow economy, because this meth-
odology allows a wide flexibility in its application. Therefore, they consider it potentially su-
perior to other estimation methods. Cassar (2001) argues that, when compared to other meth-
ods, SEMs/MIMIC models do not need restrictive assumptions to operate. Analogously,
Thomas (1992, p. 168) argues that the only real constraint of this approach is not in its con-
ceptual structure, but the choice of variables. These positive aspects of the SEM approach in
general and the MIMIC model in particular do not only apply in its application to the shadow
economy, but to all informal economic activities.
Of course this method has its disadvantages or limitations, too, which are identified in the
literature. The three most important points of criticism focus on the model’s implementations,
the sample used, and the reliability of the estimates:
(1) The most common objection estimating shadow economic activities using SEMs con-
cerns the meaning of the latent variable (e.g. Helberger and Knepel 1988; Dell’Anno
03.12.2013 25 of 40
2003). The confirmatory rather than exploratory nature of this approach means that one is
more likely to determine whether a certain model is valid than to ‘find’ a suitable model.
Therefore, it is possible that the specified model includes potential definitions or informal
economic activities other than the one studied. For example, it is difficult for a researcher
to ensure that traditional crime activities such as drug dealing are completely excluded
from the analysis of the shadow economy. This criticism, which is probably the most
common in the literature remains difficult to overcome as it goes back to the theoretical
assumptions behind the choice of variables and empirical limitations on data availability.
(2) Helberger and Knepel (1988) argue that SEM/MIMIC model estimations lead to unstable
coefficients with respect to changes of the sample size and alternative model specifica-
tions. Dell’Anno (2003) shows, however, that instability disappears asymptotically as the
sample size increases. Another issue is the application of SEMs to time series data be-
cause only simple analytical tools such as q- and stemleaf plots are available to analyse
the properties of the residuals (Dell’Anno 2003).33)
(3) Criticism is also related to the benchmarking procedure used to derive ‘real world’ fig-
ures of shadow economic activities (Breusch 2005a, 2005b). As the latent variable and its
unit of measurement are not observed, SEMs just provide a set of estimated coefficients
from which one can calculate an index that shows the dynamics of the unobservable vari-
able. Application of the so- called calibration or benchmarking procedure, regardless
which one is used, requires experimentation, and a comparison of the calibrated values in
a wide academic debate. Unfortunately, at this stage of research on the application of the
SEM/MIMIC approach in economics it is not clear which benchmarking method is the
best or the most reliable.34)
The economic literature using SEMs is well aware of these limitations. Consequently, it
acknowledges that it is not an easy task to apply this methodology to an economic dataset, but
also argues that this does not mean one should abandon the SEM approach. On the contrary,
following an interdisciplinary approach to economics, SEMs are valuable tools for economic
analysis, particularly when studying the shadow economy. However, the mentioned objec- 33) Particularly critical are the assumptions ( ) ( )E Var2
ik iς ς= for all k (homoscedasticity assumption) and
( )Cov , 0ik ilς ς = for all k l≠ no autocorrelation in the error terms). Unfortunately, corrections for autocorre-
lated and heteroscedastic error terms have not yet received sufficient attention in models with unobservable variables (Bollen 1989, p. 58). An interesting exception is Folmer and Karmann (1992). 34) See Dell’Anno and Schneider (2009) for a detailed discussion on different benchmarking procedures.

03.12.2013 26 of 40
tions should be considered as an incentive for further (economic) research in this field rather
than as a suggestion to abandon this method.
3.3. Results of the Size of the German Shadow Economy Using the Various
Estimation Methods
Finally, so that the interested reader sees how big the variance of the different estimations of
the size of the shadow economy is, the results for the case of Germany are shown. A signifi-
cant amount of empirical work has been done on the shadow economy in Germany, and this
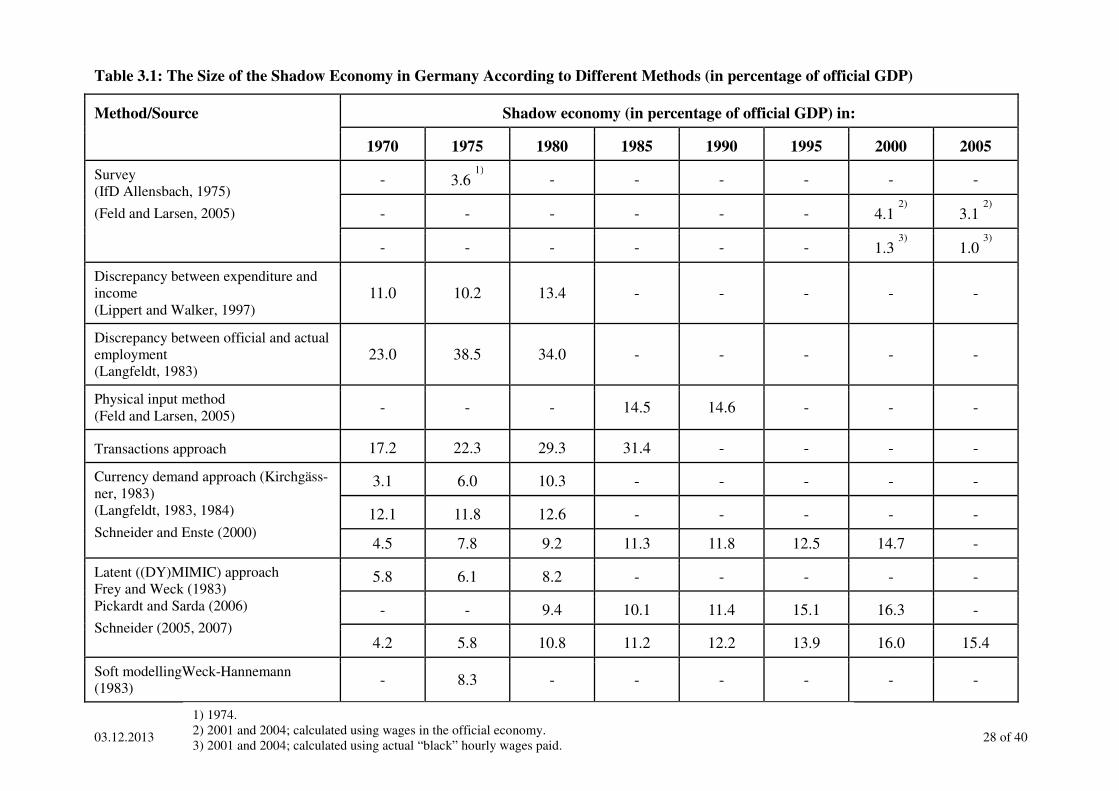
makes it an interesting case study. The results are shown in table 3.1. The oldest estimate uses
the survey method of the Institut für Demoskopie (IfD) in Allensbach (Germany) and shows
that the shadow economy was 3.6% of official GDP in 1974. In a much later study Feld and
Larsen (2005, 2009) undertook an extensive research project using the survey method to esti-
mate shadow economy activities in the years 2001 to 2006. Using the officially paid wage
rate, they concluded that the shadow economy activities reached from 4.1% in 2001, 3.1% in
2004, 3.6% in 2005 and 2.5% in 2006. Using the much lower shadow economy wage rate,
these estimates shrink, however, to 1.3% in 2001 and 1.0% in 2004, respectively.
As discussed, we know that the survey method underestimates the size of the shadow econo-
my. Using the discrepancy method and applying national income statistics, Lippert and Walk-
er (1997) estimate a size of the German shadow economy from 1970 to 1980 between 11.0%
and 13.4% of official GDP. Using the discrepancy method applying official and actual em-
ployment, Langfeldt (1983) gets much higher estimates for 1970 to 1980, ranging from 23.0%
to 34.0%. Applying the physical input method (electricity approach), Feld and Larsen (2005)
get results of 14.5% for the year 1985 and 14.6% for 1990. The monetary transaction method
developed by Feige calculates the shadow economy to be of about 30% between 1980 and
1985. These are the highest estimates for the case of Germany. Switching to the currency de-
mand approach, first used by Kirchgässner (1983, 1984), his study provides values of 3.1% in
1970 and 10.3% in 1980. Kirchgässner’s values are quite similar to those obtained by Schnei-
der and Enste (2000, 2002), who also use the currency demand approach to estimate the size
of the shadow economy, which are 4.5% in 1970 and 14.7% in 2000. Using the MIMIC esti-
mation procedure, which was first applied by Frey and Weck (1983), the results are quite sim-
03.12.2013 27 of 40
ilar to those from the currency demand approach.35) Frey and Weck (1983) calculate a shadow
economy in Germany in 1970 of 5.8% which increases to 8.2% in 1980. Pickardt and Sarda
(2006), whose sample used for the MIMIC estimations started a bit later, get a value of 9.4%
in 1980, which increases to 16.3% in the year 2000. These are quite similar values to Schnei-
der (2005, 2007). Finally, using the soft modeling variant of the MIMIC approach, Weck-
Hannemann (1983) gets a value of 8.3% of GDP in 1975.
Considering table 3.1, one can see that different estimation procedures produce different re-
sults. It is safe to say that the figures produced by the transactions and discrepancy approaches
are unrealistically large. A size of the shadow economy of almost one third of official GDP in
the mid-eighties is most likely to be an overestimate. The figures obtained using the currency
demand and the hidden (latent, MIMIC) approaches are, on the other hand, relatively close
together and much lower than those produced by the discrepancy or transactions approach.
The estimates from the MIMIC approach can be regarded as the most reasonable estimates of
the size of the shadow economy and the survey model is likely to produce too low estimates
for the reasons already discussed.
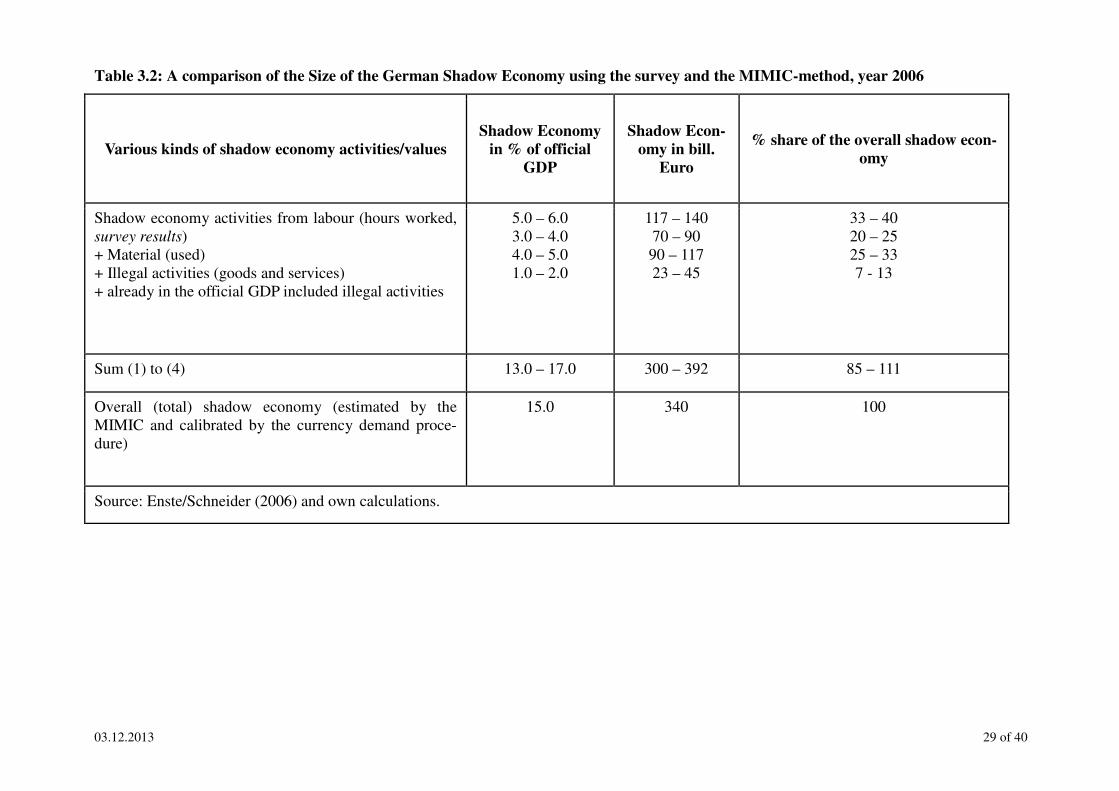
Finally, in table 3.2 a comparison of the size of the German shadow economy using the sur-
vey and the MIMIC method for the year 2006 is undertaken. As we see, the difference be-
tween the estimates of the macro-method (here the MIMIC estimation procedure) and the re-
sults from the survey method is quite large. In table 3.2 an attempt is undertaken to demon-
strate the major difference between these two estimation methods. The first line of table 3.2
clearly shows shadow economy activities from labor (hours worked, survey results). They
range from 5.0%–6.0% in the year 2006. If one adds to this used material, illegal activities
and those which are already included in the official GDP, one gets a value between 13.0% and
17.0% of GDP, which comes very close to the 15.0% of the MIMIC estimation results.
Hence, one realizes that the macro-results of course include the used materials and illegal ac-
tivities, so that it is not amazing to find much larger results.
35) This is not astonishing as quite often the calibration start-values have been used from the currency demand approach in order to transform the relative estimates of the MIMIC approach.
03.12.2013 28 of 40
Table 3.1: The Size of the Shadow Economy in Germany According to Different Methods (in percentage of official GDP)
Method/Source Shadow economy (in percentage of official GDP) in:
1970 1975 1980 1985 1990 1995 2000 2005 Survey (IfD Allensbach, 1975)
(Feld and Larsen, 2005)
- 3.6 1) - - - - - -
- - - - - - 4.1 2) 3.1
2)
- - - - - - 1.3 3) 1.0
3) Discrepancy between expenditure and income (Lippert and Walker, 1997)
11.0 10.2 13.4 - - - - -
Discrepancy between official and actual employment (Langfeldt, 1983)
23.0 38.5 34.0 - - - - -
Physical input method (Feld and Larsen, 2005)
- - - 14.5 14.6 - - -
Transactions approach 17.2 22.3 29.3 31.4 - - - - Currency demand approach (Kirchgäss-ner, 1983) (Langfeldt, 1983, 1984)
Schneider and Enste (2000)
3.1 6.0 10.3 - - - - -
12.1 11.8 12.6 - - - - - 4.5 7.8 9.2 11.3 11.8 12.5 14.7 -
Latent ((DY)MIMIC) approach Frey and Weck (1983) Pickardt and Sarda (2006)
Schneider (2005, 2007)
5.8 6.1 8.2 - - - - -
- - 9.4 10.1 11.4 15.1 16.3 -
4.2 5.8 10.8 11.2 12.2 13.9 16.0 15.4 Soft modellingWeck-Hannemann (1983)
- 8.3 - - - - - -
1) 1974. 2) 2001 and 2004; calculated using wages in the official economy. 3) 2001 and 2004; calculated using actual “black” hourly wages paid.
03.12.2013 29 of 40
Table 3.2: A comparison of the Size of the German Shadow Economy using the survey and the MIMIC-method, year 2006
Various kinds of shadow economy activities/values Shadow Economy
in % of official
GDP
Shadow Econ-
omy in bill.
Euro
% share of the overall shadow econ-
omy
Shadow economy activities from labour (hours worked, survey results) + Material (used) + Illegal activities (goods and services) + already in the official GDP included illegal activities
5.0 – 6.0 3.0 – 4.0 4.0 – 5.0 1.0 – 2.0
117 – 140 70 – 90 90 – 117 23 – 45
33 – 40 20 – 25 25 – 33 7 - 13
Sum (1) to (4) 13.0 – 17.0 300 – 392 85 – 111
Overall (total) shadow economy (estimated by the MIMIC and calibrated by the currency demand proce-dure)
15.0 340 100
Source: Enste/Schneider (2006) and own calculations.

03.12.2013 30 of 40
4. SUMMARY AND CONCLUDING REMARKS: PROBLEMS AND
OPEN QUESTIONS
If we summarize our findings about the methods to estimate the size and development of the
shadow economy, we come to the following findings:
4.1. Surveys
(i) Quite often only households are considered and firms are, at least partly, left out.
(ii) Non-responses and/or incorrect responses are given.
(iii) Results of the financial volume of “black” hours worked and not of value added
are obtained.
4.2. Estimations from the discrepancy method
(i) Quite often here a combination of “rough” estimations and unclear assumptions about
them is used.
(ii) The calculation method is often not clear.
(iii) The documentation and procedure is often not made public.
4.3. Monetary and/or electricity methods
(i) Some estimates are very high and only macro-estimates are available.
(ii) A breakdown by sector or industry is not possible.
(iii) Great differences to convert millions of KWh into a value added figure, when using the
electricity method.
4.4. MIMIC (latent) method
(i) Only relative coefficients, no absolute values, are obtained.
(ii) The estimations are quite often highly sensitive with respect to changes in the data and
specifications.
(iii) Difficulties to differentiate between the selection of causes and indicators.
03.12.2013 31 of 40
(iv) The calibration procedure and starting values which are used have a great influence on
the results.
What type of conclusions can we draw or what have we learnt during 35 years of shadow
economy research?
(1) There is no ideal or dominating method to estimate the size and development of the shad-
ow economy. All methods have serious problems and weaknesses.
(2) If possible, researchers should use several methods to come somewhat closer to the actual
value of the size and development of the shadow economy.
(3) Much more research is needed with respect to the estimation methodology and the empir-
ical results for different countries and periods.
(4) The focus should be now on micro-shadow economy research, and to undertake experi-
ments in order to reach two goals:
(i) a better micro-foundation and
(ii) a better knowledge why people work in the shadow economy, what their motivation
is and what they earn.
What questions remained open?
(1) The link between theory and empirical estimation of the shadow economy is still unsatis-
factory; in the best case theory provides us with derived signs of the causal factors, but
which are the “core” causal factors is still open and also in which indicators shadow
economy activities are reflected.
(2) A satisfactory validation of the empirical results should be developed so that it is easier to
judge the empirical results with respect to their plausibility.
(3) A common and internationally accepted definition of the shadow economy is still miss-
ing. Such a definition or convention is needed in order to make comparisons between
countries possible.

03.12.2013 32 of 40
5. REFERENCES
Aigner, D., Schneider, F. and D. Ghosh (1988), Me and my shadow: estimating the size of the US hidden economy from time series data. In: Barnett, W.A., Berndt, E.R., White, H. (Eds.), Dy-namic Econometric Modeling. Cambridge University Press, Cambridge, UK, pp. 224–243.
Ahumada, H., Facundo, A., Canavese A. and P. Canavese (2004), The demand for currency ap-proach and the size of the shadow economy: a critical assessment. Discussion Paper, Delta Ecole Normale Superieure, Paris.
Allingham, M.G. and A. Sandmo (1972), Income Tax Evasion: A Theoretical Analysis, Journal of Public Economics, 1/3, pp. 323-338.
Alm, J., Martinez-Vazquez, J. and F. Schneider (2004), Sizing the problem of the hard-to-tax, Working Paper, Georgia State University, USA.
Alm, J. and B. Torgler (2006), Culture differences and tax morale in the United States and in Eu-rope, Journal of Economic Psychology, 27(2): 224–46.
Andreoni, J., B. Erard and J. Feinstein (1998), Tax Compliance, Journal of Economic Litera-ture 36/4, pp. 818-860.
Belev, B. (2003), The informal economy in the EU Accession Countries: Size, scope, trends and challenges to the process of EU enlargement, Center for Study of Democracy, Sofia.
Bhattacharyya, D.K. (1999), On the economic rationale of estimating the hidden economy. Eco-nomic Journal 109, pp. 348–359.
Blades, D. (1982), The hidden economy and the national accounts. OECD Occasional Studies, pp. 28– 44.
Boeschoten, W.C. and M.M.G. Fase (1984), The Volume of Payments and the Informal Economy in the Netherlands 1965–1982. M. Nijhoff, Dordrecht.
Bollen, K.A. (1989), Structural Equations with Latent Variables, New York (N.Y.), Wiley Pub-lishing Company.
Breusch, T. (2005a), The Canadian underground economy: An examination of Giles and Tedds, Canadian Tax Journal, 53, pp. 367-391.
Breusch, T. (2005b), Estimating the underground economy using MIMIC models, Working Pa-per. Available under: http://econwpa.wustl.edu/eps/em/papers/0507/0507003.pdf.
Bühn, A. and F. Schneider (2011), Corruption and the shadow economy: like oil and vinegar, like water and fire?, International Tax and Public Finance, LLC: 220–41.
Buehn, A. and F. Schneider (2012), Shadow Economies Around the World: Novel Insights, Accepted Knowledge, and New Estimates, International Tax and Public Finance 19, pp. 139-171.
Bühn, A., A. Karmann and F. Schneider (2009), Shadow economy and do-it-yourself activi-ties: the German case, Journal of Institutional and Theoretical Economics, 165(4), pp.701–22.
Cagan, P. (1958), The demand for currency relative to the total money supply, Journal of Po-litical Economy, 66, pp. 302– 328.
Cassar, A. (2001), An index of the underground economy in Malta, Bank of Valletta Review, 23, pp. 44-62.
03.12.2013 33 of 40
Clotefelter, C.T. (1983), Tax evasion and tax rates: an analysis of individual returns, Review of Economic Statistics, 65, pp. 363–373.
Contini, B. (1981), Labor market segmentation and the development of the parallel economy: the Italian experience, Oxford Economic Papers 33, pp. 401–412.
Cziraky, D. (2004), LISREL 8.54: A program for structural equation modelling with latent variables, Journal of Applied Econometrics, 19, pp. 135-141.
Dallago, B. (1990), The Irregular Economy: The “Underground Economy” and the “Black Labour Market”, Dartmouth Publishing, UK.
Dell’Anno, R. (2003), Estimating the shadow economy in Italy: A structural equation ap-proach, Working Paper 2003-7, Department of Economics, University of Aarhus, Aarhus, Denkmark.
Dell’Anno R. (2007), The Shadow Economy in Portugal: An Analysis with the MIMIC Ap-proach, Journal of Applied Economics 10, pp. 253-277.
Del’Anno, R. and F. Schneider, (2004), The shadow economy of Italy and other OECD coun-tries: what do we know? Discussion Paper, Department of Economics, University of Linz, Linz, Austria.
Dell’Anno, R. and F. Schneider (2009), A complex approach to estimate shadow economy: the structural equation modelling, in M. Faggnini and T. Looks (eds), Coping with the Complexity of Economics, Berlin: Springer, pp. 110–30.
Dell’Anno R., M. Gomez-Antonio and A. Alanon Pardo (2007), Shadow Economy in three different Mediterranean Countries: France, Spain and Greece. A MIMIC Approach, Empir-ical Economics 33, pp. 51-84.
Del Boca, D. (1981), Parallel economy and allocation of time, Micros (Quarterly Journal of Microeconomics), 4, pp. 13– 18.
Del Boca, D. and F. Forte (1982), Recent empirical surveys and theoretical interpretations of the parallel economy in Italy. In: Tanzi, V. (Ed.), The Underground Economy in the United States and Abroad. Lexington Books, Lexington, MA, pp. 160–178.
Dreher, A. and F. Schneider (2009), Corruption and the Shadow Economy: An Empirical Analysis, Public Choice, 144/2, pp.215-277.
Dreher, A., C. Kotsogiannis and S. McCorriston (2009), How Do Institutions Affect Corrup-tion and the Shadow Economy?, International Tax and Public Finance, 16/4, pp.773-796.
Enste, D. and F. Schneider (2006), Umfang und Entwicklung der Schattenwirtschaft in 145 Ländern, in: F. Schneider and D. Enste (eds.), Jahrbuch Schattenwirtschaft 2006/07. Zum Spannungsfeld von Poltik und Ökonomie, LIT Verlag, Berlin, pp. 55-80.
European Commission (2007), Stepping up the fight against undeclared work, COM (2007) 628 final, Brussels: European Commission.
Feige, E.L. (1986), A re-examination of the bunderground economy in the United States, IMF Staff Papers 33, pp. 768– 781.
Feige, E.L. (ed.) (1989), The Underground Economies. Tax Evasion and Information Distor-tion, Cambridge University Press, Cambridge.
Feige, E.L. (1994), The underground economy and the currency enigma, Supplement to Pub-lic Finance/Finances Publiques, 49, pp. 119– 136.
03.12.2013 34 of 40
Feige, E.L. (1996), Overseas holdings of U.S. currency and the underground economy. In: Pozo, S. (Ed.), Exploring the Underground Economy. W.E. Upjohn Institute for Employ-ment Research, Kalamazoo, MI, pp. 5– 62.
Feld, L.P. and B.S. Frey (2007), Tax Compliance as the Result of a Psychological Tax Con-tract: The Role of Incentives and Responsive Regulation, Law and Policy, 29/1, pp. 102-120.
Feld, L. P. and C. Larsen (2005), Black Activities in Germany in 2001 and 2004: A Compari-son Based on Survey Data, Study no.12, Copenhagen: Rockwool Foundation Research Unit.
Feld, L. P. and C. Larsen (2008), “Black” activities low in Germany in 2006, News from the Rockwool Foundation Research Unit, March, pp. 1–12.
Feld, L. P. and C. Larsen (2009), Undeclared Work in Germany 2001–2007 – Impact of De-terrence, Tax Policy, and Social Norms: An Analysis Based on Survey Data, Berlin: Springer.
Feld, L. P. and F. Schneider (2010), Survey on the shadow economy and undeclared earnings in OECD countries, German Economic Review, 11(2), pp. 109–49.
Fleming, M.H., Roman, J. and G. Farrel (2000), The shadow economy, Journal of Interna-tional Affairs, 53, pp. 64– 89.
Folmer, H. and A. Karmann (1992), The permanent income hypothesis revisited – a dynamic LISREL approach, Methods of Operations Research, 64/3, pp. 355-359.
Franz, A. (1983), Wie groß ist die „schwarze“ Wirtschaft? Mitteilungsblatt der Österreichi-schen Statistischen Gesellschaft 49, pp. 1 –6.
Frey, B. S. and W. Pommerehne (1984), The hidden economy: State and prospect for meas-urement, Review of Income and Wealth, 30/1, pp. 1-23.
Frey, B.S. and H. Weck (1983a), Bureaucracy and the shadow economy: a macro-approach. In: Hanusch, H. (Ed.), Anatomy of Government Deficiencies. Springer, Berlin, pp. 89– 109.
Frey, B.S. and H. Weck (1983b), Estimating the shadow economy: a “naïve” approach. Ox-ford Economic Papers, 35, pp. 23– 44.
Frey, B.S. and H. Weck-Hannemann (1984), The hidden economy as an “unobserved” varia-ble. European Economic Review, 26, pp. 33– 53.
Frey, B.S., Weck, H. and W.W. Pommerehne (1982), Has the shadow economy grown in Germany? An exploratory study. Weltwirtschaftliches Archiv, 118, pp. 499– 524.
Friedman, E., S. Johnson, D. Kaufmann and P. Zoido-Lobatón (2000), Dodging the Grabbing Hand: The Determinants of Unofficial Activity in 69 Countries, Journal of Public Eco-nomics 76/4, pp. 459-493.
Garcia, G. (1978), The currency ratio and the subterranean economy, Financial Analysts Journal, 69, pp. 64– 66.
Gerxhani, K. (2003), The informal sector in developed and less-developed countries: A litera-ture survey, Public Choice, 114/3-4, pp. 295-318.
Giles, D.E.A. (1997a), Causality between the measured and underground economies in New Zealand, Applied Economics Letters, 4, pp. 63–67.

03.12.2013 35 of 40
Giles, D.E.A. (1997b), Testing the asymmetry in the measured and underground business cy-cles in New Zealand. Economic Record, 71, pp. 225–232.
Giles, D.E.A. (1999a), Measuring the Hidden Economy: Implications for Econometric Mod-elling, Economic Journal 109/3, pp. 370-380.
Giles, D.E.A. (1999b), Modeling the hidden economy in the tax-gap in New Zealand. Empiri-cal Economics 24, pp. 621–640.
Giles, D.E.A. (1999c), The rise and fall of the New Zealand underground economy: are the reasons symmetric? Applied Economics Letters, 6, pp. 185–189.
Giles, D.E.A. and L.M. Tedds (2002), Taxes and the Canadian underground economy, Cana-dian Tax Paper, vol. 106. Canadian Tax Foundation, Toronto.
Giles, D.E.A., Tedds, L.M. and W. Gugsa (2002), The Canadian underground and measured economies, Applied Economics, 34, pp. 2347– 2352.
Gutmann, P.M. (1977), The subterranean economy, Financial Analysts Journal, 34 (1), pp. 24– 27.
Haigner, S., S. Jenewein, F. Schneider and F. Wakolbinger (2011), Dissatisfaction, fear and annoyance: driving forces of informal labor supply and demand, Discussion paper, De-partment of Economics, University of Linz, Linz, Austria. Paper presented at the European Public Choice Meeting, Rennes, 28 April-1 May.
Helberger, C. and H. Knepel (1988), How big is the shadow economy? A re-analysis of the unobserved-variable approach of B.S. Frey and H.Weck-Hannemann, European Economic Review, 32/4, pp. 965-976.
Hill, R. and M. Kabir (1996), Tax rates, the tax mix, and the growth of the underground econ-omy in Canada: what can we infer? Canadian Tax Journal/Revue Fiscale Canadienne ,44, pp. 1552–1583.
IfD Allensbach (1975), Studie im Auftrag der Kommission für Wirtschaftlichen und Sozialen Wandel, Bodensee: Allensbach.
IRS (1979), Estimates of Income Unreported on Individual Tax Reform, Internal Revenue Service, U.S. Department of the Treasury, Washington, DC.
IRS (1983), Income Tax Compliance Research: Estimates for 1973–81, Internal Revenue Service, U.S. Department of the Treasury, Washington, DC.
Isachsen, A.J. and S. Strøm (1985), The Size and Growth of the Hidden Economy in Norway, Review of Income and Wealth 31/1, pp. 21-38.
Isachsen, A.J., Klovland, J., S. Strom (1982), The hidden economy in Norway, In: Tanzi, V. (Ed.), The Underground Economy in the United States and Abroad, DC Heath, Lexington Books, Lexington, MA, pp. 209–231.
Jöreskog, K.G. and D. Sörbom (2001), LISREL 8: User’s Reference Guide, Lincolnwood: Scientific Software International.
Johnson, S., Kaufmann, D. and A. Shleifer (1997), The unofficial economy in transition, Brookings Papers on Economic Activity, Fall, Washington D.C.
Johnson, S., Kaufmann, D. and P. Zoido-Lobatón (1998a), Regulatory discretion and the un-official economy, The American Economic Review, 88/ 2, pp. 387-392.
03.12.2013 36 of 40
Johnson, S., D. Kaufmann and P. Zoido-Lobatón (1998b), Corruption, Public Finances and the Unofficial Economy, World Bank Policy Research Working Paper Series No. 2169, The World Bank, Washington, D.C.
Kanniainen, V., J. Pääkönen and F. Schneider (2004), Fiscal and Ethical Determinants of Shadow Economy: Theorey and Evidence, Discussion Paper, Department of Economics, Johannes Kepler University of Linz, Linz, Austria.
Karmann, A. (1986), Monetäre Ansätze zur Erfassung der Schattenwirtschaft: Ein Vergleich verschiedener Messansätze. Kredit und Kapitel 19, pp. 233– 247.
Karmann, A. (1990), Schattenwirtschaft und ihre Ursachen: Eine empirische Analyse zur Schwarzwirtschaft und Selbstversorgung in der Bundesrepublik Deutschland. Zeitschrift für Wirtschafts- und Sozialwissenschaften (ZWS) 110, pp. 185– 206.
Kaufmann, D. and A. Kaliberda (1996), Integrating the unofficial economy into the dynamics of post socialist economies: a framework of analyses and evidence. In: Kaminski, B. (Ed.), Economic Transition in Russia and the New States of Eurasia. M.E. Sharpe, London, pp. 81–120.
Kazemier, B. (2006), Monitoring the underground economy: a survey of methods and esti-mates, in: F. Schneider and D. Enste (eds.), Jahrbuch Schattenwirtschaft 2006/07. Zum Spannungsfeld von Politik und Ökonomie, Berlin: LIT Verlag, pp. 11-53.
Kirchgässner, G. (1983), Size and development of the West German shadow economy, 1955–1980. Zeitschrift für die Gesamte Staatswissenschaft 139, pp. 197– 214.
Kirchgässner, G. (1984), Verfahren zur Erfassung des in der Schattenwirtschaft erarbeiteten Sozialprodukts. Allgemeines Statistisches Archiv, 68, pp. 378– 405.
Kirchler, E. (2007), The Economic Psychology of Tax Behaviour, Cambridge (UK) Universi-ty Press, Cambridge.
Klovland, J. (1984), Tax evasion and the demand for currency in Norway and Sweden: is there a hidden relationship? Scandinavian Journal of Economics, 86, pp. 423– 439.
Kucera, D. and L. Roncolato (2008), Informal Employment: Two Contested Policy Issues, International Labor Review 147/3, pp. 321-348.
Lackó, M. (1996), Hidden economy in East-European countries in international comparison. Working paper, International Institute for Applied Systems Analysis (IIASA), Laxenburg.
Lackó, M. (1998), The Hidden Economies of Visegrad Countries in International Compari-son: A Household Electricity Approach, in: Halpern, L. and Ch. Wyplosz (eds.), Hungary: Towards a Market Economy, Cambridge (Mass.), Cambridge University Press.
Lackó, M. (1999), Electricity Intensity and the Unrecorded Economy in Post-Socialist Coun-tries, in: Feige, E. and K. Ott (eds.), Underground Economies in Transition, Ashgate Pub-lishing Company.
Lackó, M. (2000a), Do Power Consumption Data Tell the Story? Electricity Intensity and Hidden Economy in Post-Socialist Countries, in: Maskin, E. and A. Simonovits (eds.), Planning, Shortage and Transformation: Essays in Honor of Janos Kornai, Cambridge (Mass.), The MIT Press.
Lackó, M. (2000b), Hidden Economy – an Unknown Quantity? Comparative Analysis of Hidden Economies in Transition Economies, 1989-95, Economics of Transition, 8/1, pp. 117-149.
03.12.2013 37 of 40
Langfeldt, E. (1984), The unobserved economy in the Federal Republic of Germany. In: Feige, E.L. (Ed.), The Unobserved Economy. Cambridge University Press, Cambridge, UK, pp. 236– 260.
Lippert, O. and M. Walker (eds.) (1997), The Underground Economy: Global Evidences of its Size and Impact, Vancouver, B.C.: The Frazer Institute.
Lizzeri, C. (1979), Mezzogiorno in Controluce. Enel, Naples.
Loayza, N. V. (1996), The economics of the informal sector: a simple model and some empir-ical evidence from Latin America. Carnegie-Rochester Conference Series on Public Policy 45, pp. 129-162.
Long, J.S. (1983a), Confirmatory Factor Analysis, Beverly Hills (CA), Sage Publishing Com-pany.
Long, J.S. (1983b), Covariance Structure Models: An Introduction to LISREL, Beverly Hills (CA), Sage Publishing Company.
MacAfee, K. (1980), A glimpse of the hidden economy in the national accounts, Economic Trends 136, pp. 81– 87.
Mogensen, G. V. (1985), Sort Arbejde i Danmark, Copenhagen: Institut for Nationalokonomi.
Mogensen, G.V., Kvist, H.K., Kfrmendi, E. and S. Pedersen (1995), The Shadow Economy in Denmark 1994: Measurement and Results. Study no. 3. The Rockwool Foundation Re-search Unit, Copenhagen.
Morris, B. (1993), Editorial statement, International Economic Insides, vol. IV. International Statistical Yearbook, Budapest.
O’Higgins, M. (1989), Assessing the underground economy in the United Kingdom. In: Feige, E.L. (Ed.), The Underground Economies: Tax Evasion and Information Distortion, Cambridge University Press, Cambridge, UK, pp. 175– 195.
O’Neill, D.M. (1983), Growth of the underground economy 1950–81: some evidence from the current population survey. Study for the Joint Economic Committee. U.S. Congress Joint Committee Print, U.S. Gov. Printing Office, Washington, DC, pp. 98–122.
Olssen, U.H., S.V. Troye, and R.D. Howell (1999), Theoretic fit and empirical fit: The per-formance of Maximum Likelihood versus Generalized Least Squares estimation in Struc-tural Equations Models, Multivariate Behavioral Research, 34/1, pp. 31-58.
Olssen, U.H., T. Foss, S.V. Troye and R.D. Howell (2000), The performance of ML, GLS, and WLS estimation in structural equation modeling under conditions of misspecification and nonnormality, Structural Equation Modeling, 7, pp. 557-595.
Park, T. (1979), Reconciliation Between Personal Income and Taxable Income. Bureau of Economic Analysis, Washington, DC, pp. 1947–1977.
Pedersen, S. (2003), The Shadow Economy in Germany, Great Britain and Scandinavia: A Measurement Based on Questionnaire Service, Study No. 10, The Rockwoll Foundation Research Unit, Copenhagen.
Petersen, H.G. (1982), Size of the public sector, economic growth and the informal economy: development trends in the Federal Republic of Germany. Review of Income and Wealth 28, pp. 191–215.
Pickhardt, M. and J. Sardà Pons (2006), Size and scope of the underground economy in Ger-many, Applied Economics, 38(4), pp. 1707-13.

03.12.2013 38 of 40
Pissarides, C. and G. Weber (1988), An expenditure–based estimate of Britain’s black econ-omy, CLE Working Papers 104 (London), 40 pp.
Pommerehne, W.W. and F. Schneider (1985), The decline of productivity growth and the rise of the shadow economy in the U.S., Working Paper 85-9, University of Aarhus.
Portes, A. (1996), The informal economy. In: Pozo, S. (Ed.), Exploring the Underground Economy. W.E. Upjohn Institute for Employment Research, Kalamazoo, pp. 147– 165.
Posner, E.A. (2000), Law and Social Norms, Harvard University Press, Cambridge.
Pozo, S. (ed.) (1996), Exploring the Underground Economy: Studies of Illegal and Unreport-ed Activity, Michigan: W.E. Upjohn, Institute for Employment Research.
Renooy, P., S. Ivarsson, O. van der Wusten-Gritsai and E. Meijer (2004), Undeclared Work in an Enlarged Union – An Analysis of Undeclared Work: An In-Depth Study of Specific Items, European Commission, Brussels.
Rogoff, K. (1998), Blessing or curse? Foreign and underground demand for euro notes. Eco-nomic Policy: The European Forum 26, pp. 261– 304.
Schneider, F. (1986), Estimating the size of the Danish shadow economy using the currency demand approach: an attempt. The Scandinavian Journal of Economics 88, pp. 643–668.
Schneider, F. (1994a), Measuring the size and development of the shadow economy. Can the causes be found and the obstacles be overcome? in: Brandstaetter, Hermann, and Güth, Werner (eds.): Essays on Economic Psychology, Berlin, Heidelberg, Springer Publishing Company, pp. 193-212.
Schneider, F. (1994b), Can the shadow economy be reduced through major tax reforms? An empirical investigation for Austria, Supplement to Public Finance/ Finances Publiques, 49, pp. 137-152.
Schneider, F. (1997), The shadow economies of Western Europe, Journal of the Institute of Economic Affairs, 17/3, pp. 42-48.
Schneider, F. (1998a), Further empirical results of the size of the shadow economy of 17 OECD-countries over time, Paper to be presented at the 54. Congress of the IIPF Cordowa, Argentina and discussion paper, Department of Economics, University of Linz, Linz, Aus-tria.
Schneider, F. (2003), The shadow economy, in: Charles K. Rowley and Friedrich Schneider (eds.), Encyclopedia of Public Choice, Kluwer Academic Publishers, Dordrecht.
Schneider, F. (2005), Shadow economies around the world: what do we really know?, Euro-pean Journal of Political Economy, 21(4), pp. 598–642.
Schneider, F. (2007), Shadow Economies and Corruption All Over the World: New Estimates for 145 Countries, Economics, 2007-9, July.
Schneider, F. (2010), The Influence of Public Institutions on the Shadow Economy: An Em-pirical Investigation for OECD Countries, European Journal of Law and Economics, 6/3, pp.441-468.
Schneider, F. (ed.) (2011), Handbook on the Shadow Economy, Cheltenham: Edward Elgar.
Schneider, F. and A. Buehn (2013), Shadow Economies in Highly Developed OECD-Countries: What are the Driving Forces?, Discussion Paper, Department of Economics, University of Linz, Linz, Austria, June 2013.

03.12.2013 39 of 40
Schneider, F. and D. Enste (2000), Shadow economies: Size, causes, and consequences, The Journal of Economic Literature, 38/1, pp. 77-114.
Schneider, F. and D. Enste (2002), The Shadow Economy: Theoretical Approaches, Empirical Studies, and Political Implications, Cambridge (UK): Cambridge University Press.
Schneider, F. and C.C. Willams (2013), The Shadow Economy, IEA, London.
Simon, C.B. and A.G. Witte (1982), Beating the System: The Underground Economy, Urban House, Boston, MA.
Smith, J.D. (1985), Market motives in the informal economy, In: Gaertner, W., Wenig, A. (Eds.), The Economics of the Shadow Economy, Springer, Heidelberg, pp. 161– 177.
Smith, P. (1994), Assessing the size of the underground economy: the Canadian statistical perspectives, Canadian Economic Observer, 11, pp. 16– 33.
Stapleton, D.C. (1978), Analyzing political participation data with a MIMIC Model, Sociolog-ical Methodology, 15/1, pp. 52-74.
Swaminathan, H. and J. Algina (1978), Scale freeness in factor analysis, Psychometrika, 43, pp. 581-583.
Tanzi, V. (1980), The underground economy in the United States: estimates and implications. Banca Nazionale del Lavoro 135, pp. 427– 453.
Tanzi, V. (Ed.) (1982a), The Underground Economy in the United States and Abroad. Lex-ington Books, Lexington, MA.
Tanzi, V. (1982b), A second (and more skeptical) look at the underground economy in the United States. In: Tanzi, V. (Ed.), The Underground Economy in the United States and Abroad. Lexington Books, Lexington, MA, pp. 38– 56.
Tanzi, V. (1983), The underground economy in the United States: annual estimates, 1930–1980. IMF Staff Papers 30, pp. 283–305.
Tanzi, V. (1986), The underground economy in the United States: reply to comments by Feige, Thomas, and Zilberfarb. IMF Staff Papers 33, pp. 799– 811.
Tanzi, V. (1999), Uses and Abuses of Estimates of the Underground Economy, Economic Journal, 109/3, pp. 338-347.
Teobaldelli, D. (2011), Federalism and the Shadow Economy, Public Choice (2011) 146/3, pp. 269-269.
Teobaldelli, D. and F. Schneider (2012), Beyond the veil of ignorance: The influence of direct democracy on the shadow economy, CESifo Working Paper MO3749, University of Mu-nich, Munich.
Thomas, J.J. (1986), The underground economy in the United States: comment on Tanzi. IMF Staff Papers 33, pp. 782–789.
Thomas, J. J. (1992): Informal Economic Activity, LSE, Handbooks in Economics, London: Harvester Wheatsheaf.
Thomas, J.J. (1999), Quantifying the Black Economy: 'Measurement Without Theory' Yet Again?, Economic Journal, 109, pp. 381-389.
Torgler, B. and F. Schneider (2009), The Impact of Tax Morale and Institutional Quality on the Shadow Economy, Journal of Economic Psychology 30/3, pp. 228-245.

03.12.2013 40 of 40
Van Eck, R. and B. Kazemier (1988), Features of the hidden economy in the Netherlands, Review of Income and Wealth, 34(3), pp. 251-73.
Weck-Hannemann, H. (1983), Schattenwirtschaft: Eine Möglichkeit zur Einschränkung der öffentlichen Verwaltung? Eine ökonomische Analyze, Bern-Frankfurt.
Williams, C. C. (2005), Small Business in the Informal Economy: Making the transition to the formal economy – the evidence base, London: Small Business Service.
Williams, C. C. (2007), Small businesses and the informal economy: evidence from the UK, International Journal of Entrepreneurial Behaviour and Research, 13(6), pp. 349–66.
Williams, C. C. and P. Renooy (2007), Tackling Undeclared Work in the European Union, Dublin: European Foundation for the Improvement of Living and Working Conditions.
Williams, C. C. and P. Renooy (2009), Measures to Combat Undeclared Work in 27 Europe-an Union Member States and Norway, Dublin: European Foundation for the Improvement of Living and Working Conditions.
Williams, C.C. and J. Windebank (1995), Black market work in the European Community: peripheral work for peripheral localities? International Journal of Urban and Regional Re-search, 19, pp. 23–39.
Witte, A.D. (1987), The nature and extend of unreported activity: a survey concentrating on a recent US research, In: Alessandrini, S., Dallago, B. (Eds.), The Unofficial Economy: Con-sequences and Perspectives in Different Economic Systems, Gower, Aldershot.
Zilberfarb, B.-Z. (1986), Estimates of the underground economy in the United States, 1930–80. IMF Staff Papers 33, pp. 790–798.