estimating tropical forest carbon stocks …awsassets.panda.org/downloads/forestal_carbon.pdf ·...
TRANSCRIPT
ESTIMATING TROPICAL FOREST CARBON STOCKS USING EXISTING INVENTORY DATA
LESSONSLEARNED

WRITTEN BY: TIM BAKER in coordination with Naikoa Aguilar-amuchastegui
EDITORIAL TEAM: WWF PERU, WWF Forest and Climate Program
COVER PHOTO: © ANDRÉ BÄRTSCHI / WWF - CANON
© Text 2013 WWF All rights reserved WWF is one of the world’s largest and most experienced independent conservation organizations, with over 5 million supporters and a global network active in more than 100 countries.
WWF’s mission is to stop the degradation of the planet’s natural environment and to build a future in which humans live in harmony with nature, by conserving the world’s biological diversity, ensuring that the use of renewable natural resources is sustainable, and promoting the reduction of pollution and wasteful consumption.
CREDITS
INDEX
INTRODUCTION 04
1. COMPILING THE DATA 05
2. CHOOSING THE CARBON POOLS TO INCLUDE 06
3. STANDARDISING DATA 07
4. ASSESSING DATA QUALITY 08
5. CALCULATING AVERAGE CARBON STOCKS 09
6. STRATIFYING BY VEGETATION TYPE 10
7. CALCULATING THE SIZE AND NUMER OF ADDITIONAL PLOTS 11
REFERENCE 13
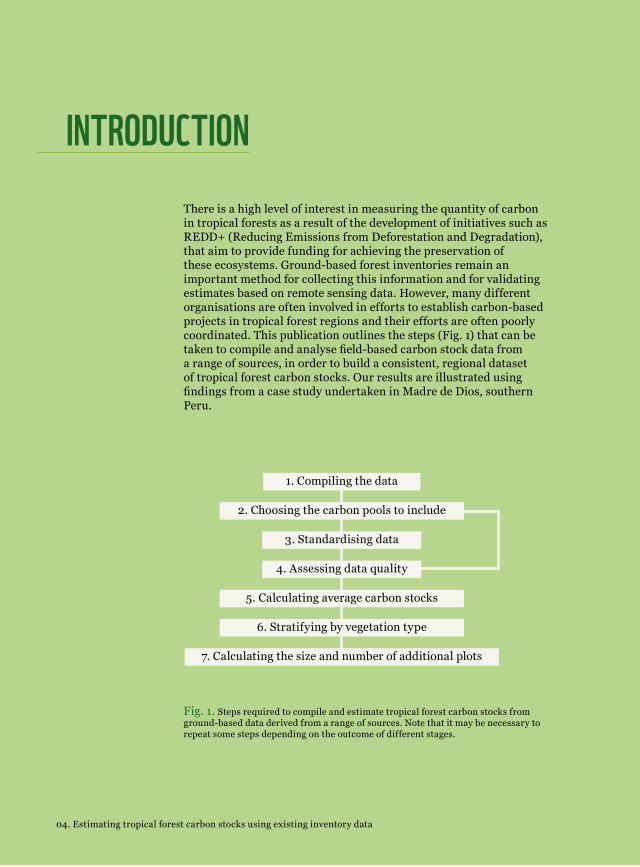
There is a high level of interest in measuring the quantity of carbon in tropical forests as a result of the development of initiatives such as REDD+ (Reducing Emissions from Deforestation and Degradation), that aim to provide funding for achieving the preservation of these ecosystems. Ground-based forest inventories remain an important method for collecting this information and for validating estimates based on remote sensing data. However, many different organisations are often involved in efforts to establish carbon-based projects in tropical forest regions and their efforts are often poorly coordinated. This publication outlines the steps (Fig. 1) that can be taken to compile and analyse field-based carbon stock data from a range of sources, in order to build a consistent, regional dataset of tropical forest carbon stocks. Our results are illustrated using findings from a case study undertaken in Madre de Dios, southern Peru.
Fig. 1. Steps required to compile and estimate tropical forest carbon stocks from ground-based data derived from a range of sources. Note that it may be necessary to repeat some steps depending on the outcome of different stages.
INTRODUCTION
1. Compiling the data
2. Choosing the carbon pools to include
3. Standardising data
4. Assessing data quality
5. Calculating average carbon stocks
6. Stratifying by vegetation type
7. Calculating the size and number of additional plots
04. Estimating tropical forest carbon stocks using existing inventory data
Forest inventory data may have been collected by a wide variety of organisations including governments, NGOs, research organisations
and logging companies for a wide variety of purposes, including biodiversity assessment, studying forest dynamics, carbon monitoring or to support sustainable logging. All of these sources of data might be useful for calculating the carbon stocks of a particular region. Using an existing institutional framework related to REDD+ may be highly beneficial to agree access to suitable datasets.
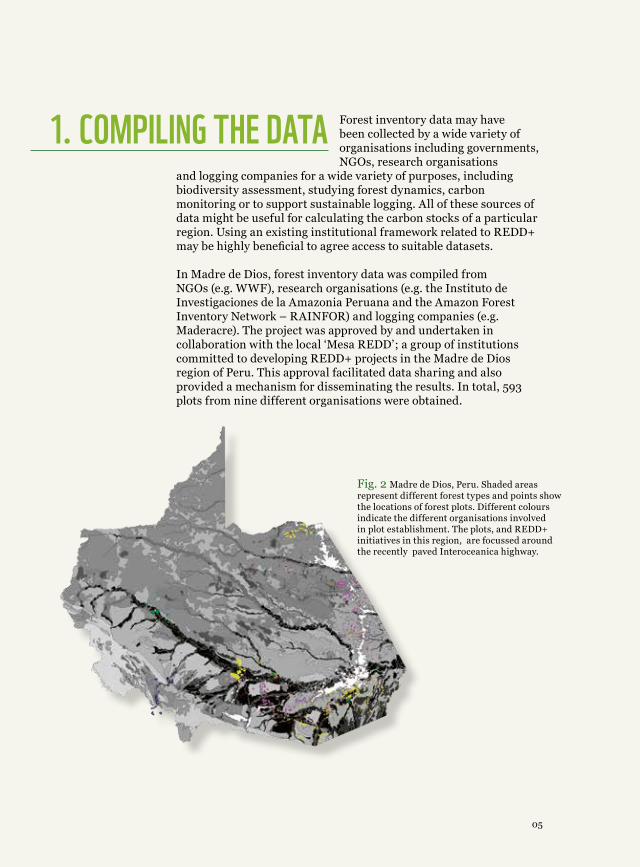
In Madre de Dios, forest inventory data was compiled from NGOs (e.g. WWF), research organisations (e.g. the Instituto de Investigaciones de la Amazonia Peruana and the Amazon Forest Inventory Network – RAINFOR) and logging companies (e.g. Maderacre). The project was approved by and undertaken in collaboration with the local ‘Mesa REDD’; a group of institutions committed to developing REDD+ projects in the Madre de Dios region of Peru. This approval facilitated data sharing and also provided a mechanism for disseminating the results. In total, 593 plots from nine different organisations were obtained.
Fig. 2 Madre de Dios, Peru. Shaded areas represent different forest types and points show the locations of forest plots. Different colours indicate the different organisations involved in plot establishment. The plots, and REDD+ initiatives in this region, are focussed around the recently paved Interoceanica highway.
1. COMPILING THE DATA
05
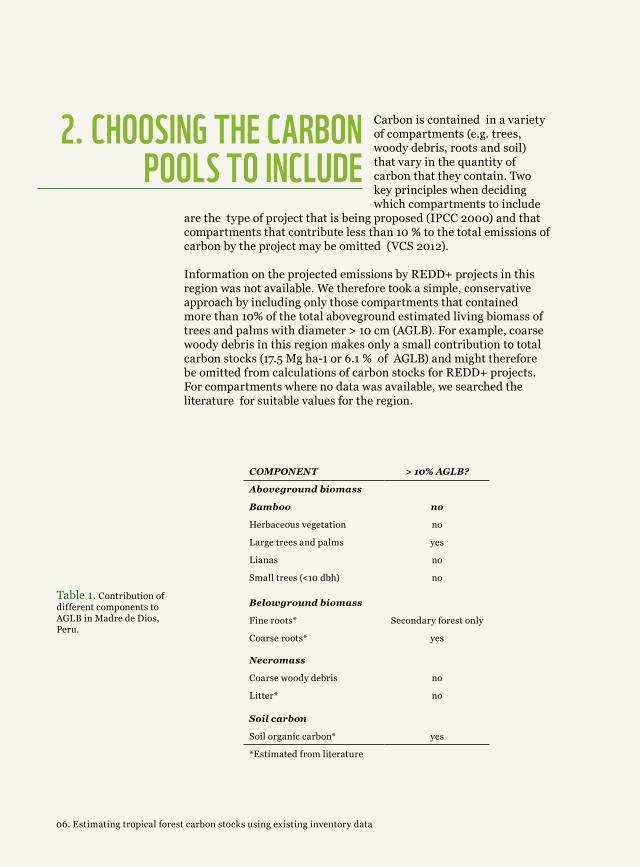
Carbon is contained in a variety of compartments (e.g. trees, woody debris, roots and soil) that vary in the quantity of carbon that they contain. Two key principles when deciding which compartments to include
are the type of project that is being proposed (IPCC 2000) and that compartments that contribute less than 10 % to the total emissions of carbon by the project may be omitted (VCS 2012).
Information on the projected emissions by REDD+ projects in this region was not available. We therefore took a simple, conservative approach by including only those compartments that contained more than 10% of the total aboveground estimated living biomass of trees and palms with diameter > 10 cm (AGLB). For example, coarse woody debris in this region makes only a small contribution to total carbon stocks (17.5 Mg ha-1 or 6.1 % of AGLB) and might therefore be omitted from calculations of carbon stocks for REDD+ projects. For compartments where no data was available, we searched the literature for suitable values for the region.
COMPONENT > 10% AGLB?
Aboveground biomass
Bamboo no
Herbaceous vegetation no
Large trees and palms yes
Lianas no
Small trees (<10 dbh) no
Belowground biomass
Fine roots* Secondary forest only
Coarse roots* yes
Necromass
Coarse woody debris no
Litter* no
Soil carbon
Soil organic carbon* yes
*Estimated from literature
Table 1. Contribution of different components to AGLB in Madre de Dios, Peru.
2. CHOOSING THE CARBON POOLS TO INCLUDE
06. Estimating tropical forest carbon stocks using existing inventory data
Often different organisations have published biomass values for their individual sites. However, it is vital to obtain the original tree-by-tree
data to calculate tree biomass using the same allometric equation for all sites. To choose the appropriate equation to use, directly weighed biomass data for a range of trees is useful to test which equation is most appropriate to use. However, in general we recommend the use of the equations presented in Feldpausch et al. (2012) to estimate tropical tree biomass. This publication presents equations based on those published by Chave et al. (2005) that incorporate regional variation in tree height.
Species names can be checked and standardised by using the Taxonomic Name Recognition Service (Boyle et al. 2013), and should be matched with wood density data from Zanne et al. (2009).
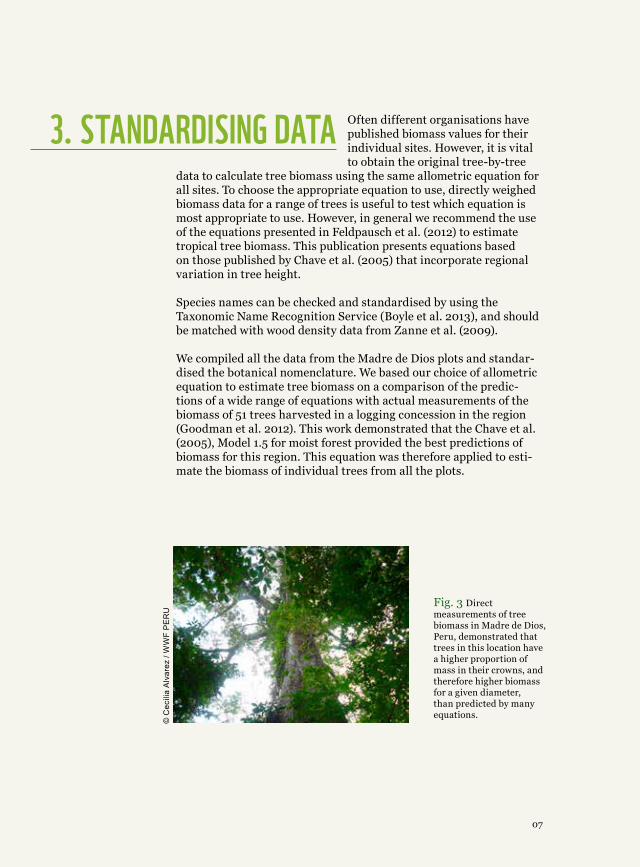
We compiled all the data from the Madre de Dios plots and standar-dised the botanical nomenclature. We based our choice of allometric equation to estimate tree biomass on a comparison of the predic-tions of a wide range of equations with actual measurements of the biomass of 51 trees harvested in a logging concession in the region (Goodman et al. 2012). This work demonstrated that the Chave et al. (2005), Model 1.5 for moist forest provided the best predictions of biomass for this region. This equation was therefore applied to esti-mate the biomass of individual trees from all the plots.
Fig. 3 Direct measurements of tree biomass in Madre de Dios, Peru, demonstrated that trees in this location have a higher proportion of mass in their crowns, and therefore higher biomass for a given diameter, than predicted by many equations.
3. STANDARDISING DATA
07
© C
ecili
a A
lvar
ez /
WW
F P
ER
U
The protocols used in the field to measure carbon stocks can vary substantially. The key issues are:
• The location of the plots: it is important that the plots have been sited using a systematic or randomized design, to avoid plots being sited in particularly ‘majestic’ patches of forest that have high values of biomass because of the presence of large trees.
• The degree of identification of the trees: a good level of ideally
species-level identification of each tree is important for matching wood density data to each stem.
• The quality of diameter measurements of the large trees: the quality of diameter measurements is important because poor measurements of large trees can greatly inflate biomass estimates.
Comparisons of the field protocols used by different organisations pro-vides a way to detect the first two problems; comparison of biomass estimates from the data obtained from different organisations, whilst controlling for other factors, such as vegetation type, provides a way to detect the third problem.
We found that reasonable attempts to avoid bias in plot location (e.g. through random or systematic sampling designs) and identify species (typically using local names) had been made. However, analysis of the carbon stock data as a function of the vegetation type and organisation that had conducted the research demonstrated that there were signifi-cant differences in the carbon stocks found by different organisations, even within similar vegetation types. On further study of the data, one group of plots was omitted from further analysis as they consistently contained a large number of very large trees (>2 m diameter), sugges-ting that measurement errors may have occurred. Other differences among the biomass estimates obtained by different organisations were the result of individual plots containing one or a few large trees of spe-cies that are know to reach large sizes in this region (e.g. Brazil nut). These plots were therefore retained in the analysis.
4. ASSESSING DATA QUALITY
08. Estimating tropical forest carbon stocks using existing inventory data
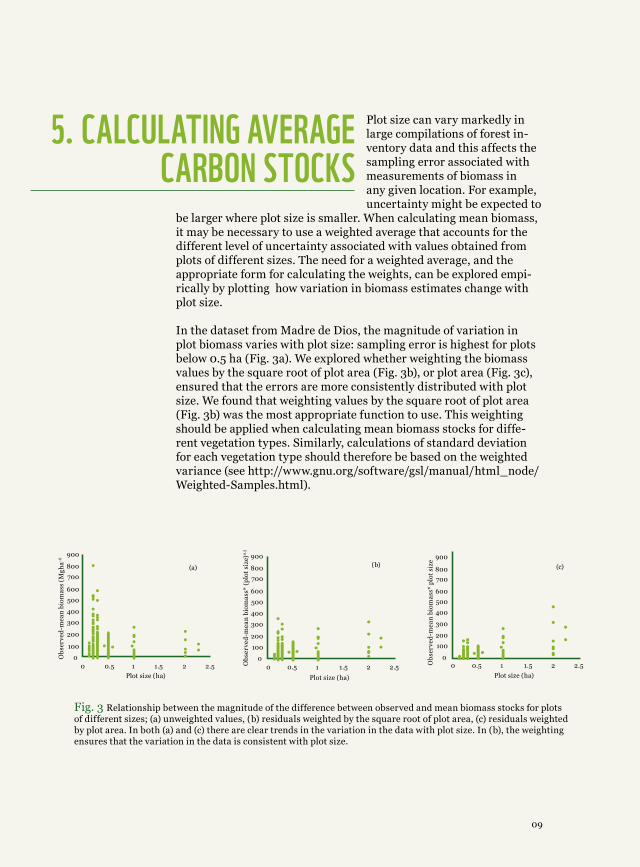
Plot size can vary markedly in large compilations of forest in-ventory data and this affects the sampling error associated with measurements of biomass in any given location. For example, uncertainty might be expected to
be larger where plot size is smaller. When calculating mean biomass, it may be necessary to use a weighted average that accounts for the different level of uncertainty associated with values obtained from plots of different sizes. The need for a weighted average, and the appropriate form for calculating the weights, can be explored empi-rically by plotting how variation in biomass estimates change with plot size.
In the dataset from Madre de Dios, the magnitude of variation in plot biomass varies with plot size: sampling error is highest for plots below 0.5 ha (Fig. 3a). We explored whether weighting the biomass values by the square root of plot area (Fig. 3b), or plot area (Fig. 3c), ensured that the errors are more consistently distributed with plot size. We found that weighting values by the square root of plot area (Fig. 3b) was the most appropriate function to use. This weighting should be applied when calculating mean biomass stocks for diffe-rent vegetation types. Similarly, calculations of standard deviation for each vegetation type should therefore be based on the weighted variance (see http://www.gnu.org/software/gsl/manual/html_node/Weighted-Samples.html).
Fig. 3 Relationship between the magnitude of the difference between observed and mean biomass stocks for plots of different sizes; (a) unweighted values, (b) residuals weighted by the square root of plot area, (c) residuals weighted by plot area. In both (a) and (c) there are clear trends in the variation in the data with plot size. In (b), the weighting ensures that the variation in the data is consistent with plot size.
00
900
800
600
500
400
300
200
100
700
1
Plot size (ha)
Ob
serv
ed-m
ean
bio
mas
s* p
lot
size
20.5 1.5 2.5
(c)
00
900
800
600
500
400
300
200
100
700
1
Plot size (ha)
Ob
serv
ed-m
ean
bio
mas
s* (
plo
t si
ze)0
.5
20.5 1.5 2.5
(b)
00
900
800
600
500
400
300
200
100
700
1
Plot size (ha)
Ob
serv
ed-m
ean
bio
mas
s (M
gha-1
)
20.5 1.5 2.5
(a)
5. CALCULATING AVERAGE CARBON STOCKS
09
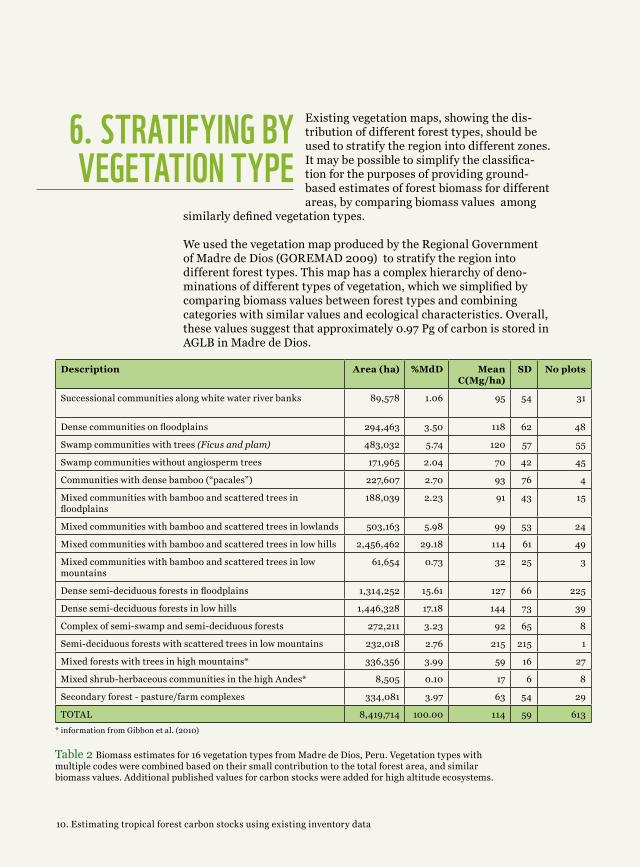
Existing vegetation maps, showing the dis-tribution of different forest types, should be used to stratify the region into different zones. It may be possible to simplify the classifica-tion for the purposes of providing ground-based estimates of forest biomass for different areas, by comparing biomass values among
similarly defined vegetation types.
We used the vegetation map produced by the Regional Government of Madre de Dios (GOREMAD 2009) to stratify the region into different forest types. This map has a complex hierarchy of deno-minations of different types of vegetation, which we simplified by comparing biomass values between forest types and combining categories with similar values and ecological characteristics. Overall, these values suggest that approximately 0.97 Pg of carbon is stored in AGLB in Madre de Dios.
Description Area (ha) %MdD Mean C(Mg/ha)
SD No plots
Successional communities along white water river banks 89,578 1.06 95 54 31
Dense communities on floodplains 294,463 3.50 118 62 48
Swamp communities with trees (Ficus and plam) 483,032 5.74 120 57 55
Swamp communities without angiosperm trees 171,965 2.04 70 42 45
Communities with dense bamboo (“pacales”) 227,607 2.70 93 76 4
Mixed communities with bamboo and scattered trees in floodplains
188,039 2.23 91 43 15
Mixed communities with bamboo and scattered trees in lowlands 503,163 5.98 99 53 24
Mixed communities with bamboo and scattered trees in low hills 2,456,462 29.18 114 61 49
Mixed communities with bamboo and scattered trees in low mountains
61,654 0.73 32 25 3
Dense semi-deciduous forests in floodplains 1,314,252 15.61 127 66 225
Dense semi-deciduous forests in low hills 1,446,328 17.18 144 73 39
Complex of semi-swamp and semi-deciduous forests 272,211 3.23 92 65 8
Semi-deciduous forests with scattered trees in low mountains 232,018 2.76 215 215 1
Mixed forests with trees in high mountains* 336,356 3.99 59 16 27
Mixed shrub-herbaceous communities in the high Andes* 8,505 0.10 17 6 8
Secondary forest - pasture/farm complexes 334,081 3.97 63 54 29
TOTAL 8,419,714 100.00 114 59 613
6. STRATIFYING BY VEGETATION TYPE
Table 2 Biomass estimates for 16 vegetation types from Madre de Dios, Peru. Vegetation types with multiple codes were combined based on their small contribution to the total forest area, and similar biomass values. Additional published values for carbon stocks were added for high altitude ecosystems.
10. Estimating tropical forest carbon stocks using existing inventory data
* information from Gibbon et al. (2010)
11
Typically, carbon projects require carbon to be estimated with a precision of +/- 10 % (VCS 2012). The number of plots requi-red to achieve this level of precision will vary depending on the level of variation of biomass stocks across the study area. The calculations required to estimate the num-ber of plots that are required are based on estimates of the mean and variation of carbon stocks in different vegetation types.
These calculations are contained within Pearson et al. (2005) and are available at http://www.winrock.org/ecosystems/tools.asp.
An appropriate size for these plots depends on the underlying hete-rogeneity of the forest which can be assessed by considering how the variability of biomass estimates changes with plot size. Plots should be large enough to capture the local structural variation in forest biomass.
Biomass values are more variable in smaller plots in the dataset from Madre de Dios (Fig. 3a). Based on this study, the minimum plot size that is required to adequately capture local variation in forest struc-ture is 0.5 hectare (Fig. 3a).
We found that a total of 13 further plots, located in the two most poorly sampled vegetation types, would be required to estimate AGLB to a precision of 10 % in Madre de Dios, Peru. The large num-ber of existing plots already provide reasonable estimates of carbon stocks in this region.
7. CALCULATING THE SIZE AND NUMBER OF
ADDITIONAL PLOTS

• Boyle, B. et al. (2013) The taxonomic name resolution service: an online tool for automated standardization of plant names, BMC Bioinformatics, 14-16. http://www.biomedcentral.com/1471-2105/14/16
• Chave J. et al. (2005) Tree allometry and improved estimation of carbon stocks and balance in tropical forests. Oecologia 145, 87-99.http://link.springer.com/article/10.1007/s00442-005-0100-x
• Feldpausch T. et al. (2012) Tree height integrated into pantropical forest biomass estimates, Biogeosciences, 9, 3381-3403. http://www.biogeosciences.net/9/3381/2012/bg-9-3381-2012.html
• Gibbon, A. et al. (2010) Ecosystem carbon storage across the grassland–forest transition in the high Andes of Manu National Park, Peru. Ecosystems ,13, 1097-1111
• Goodman, R.C. et al. (2012) Tropical forests: Tightening up on tree carbon estimates, Nature, 491, 527.http://www.nature.com/nature/journal/v491/n7425/full/491527b.html
• GOREMAD (2009) Macro Zonificación Ecológica y Económica del Departamento de Madre de Dios. Puerto Maldonado, pp 167
• IPCC (2000) Land-Use, Land-Use Change and Forestry, Watson, R.T., Noble, I.R., Bolin, B., Ravindranath, N.H., Verardo, D.J. & Dokken, D.J. (Eds.), Cambridge University Press, UK. pp 375http://www.ipcc.ch/ipccreports/sres/land_use/index.php?idp=0
• Pearson T. et al. (2005) Sourcebook for Land Use, Land-Use Change and Forestry
• Projects, Winrock International and World Bank BioCarbon Fund.http://www.winrock.org/ecosystems/files/winrock-biocarbon_fund_sourcebook-compressed.pdf
• VCS (2012) Jurisdictional and Nested REDD Initiative: Summary of Technical Recommendations – Version 2.0http://v-c-s.org/sites/v-c-s.org/files/Summary%20of%20Technical%20Recommendations%20V2%200.pdf
• Zanne, A.E., Lopez-Gonzalez, G., Coomes, D.A., Ilic, J., Jansen, S., Lewis, S.L., Miller, R.B., Swenson, N.G., Wiemann, M.C., and Chave, J. (2009) Global wood density database. Dryad. Identifier: http://hdl.handle.net/10255/dryad.235.
REFERENCES
13


ESTIMATING TROPICAL FOREST CARBON STOCKS USING EXISTING INVENTORY DATAWWFPERU.ORG
WWF PeruTrinidad Morán 853 Lince
Lima 14 – PeruTel.: +51 (1) 440 5550
To stop the degradation of the planet’s natural environment and to build a future in which humans live in harmony with nature.
Why we are here
www.wwfperu.org
This publication was printed on Cyclus Print Matt, paper made with 100% recycled fiber, chlorine free, and certified by the National Association of Paper Merchants (NAPM). This paper is also made with Bioenergy (non-polluting energy) and certified by Ecoflower and Blue Angel, which identify products made under environ-mentally appropriate and socially responsible processes.
The benefits from the use of this 100% recycled fiber paper are reflected in a lower impact on the environment, equivalent to:
27 kg of rainforest fiber not consumed461 liters of water saved17 kg of solid waste not generated3 kg of greenhouse gases prevented42 KWH of energy not consumed33 km of distance in an average car not driven
OTHER CERTIFICATIONS:
License 544.021 Nordic SwanISO 9001 Quality managementEMAS, ISO 1400 EU environmental management/certification schemeDIN 6738 Archive properties, LDK class 24-85 (> 200/g years)EN 71-3 Safety of toys, migration of certain elements
This is a joint work of WWF Peru and FCP