estimation of desired properties of self curing concrete...
TRANSCRIPT

International Journal of Engineering Technology, Management and Applied Sciences
www.ijetmas.comApril 2017, Volume 5, Issue 4, ISSN 2349-4476
581 B. Ajitha, Ghantasala Nirupama
Estimation of Desired Properties of Self Curing Concrete using
Admixture
B. Ajitha*, Ghantasala Nirupama
Department of Civil Engineering,
JNTUACE Anantapuramu, Andhra Pradesh
ABSTRACT
In the present investigation, work strength and workability characteristics of self-curing concrete are to be better found
and which can be compared with conventional concrete of related mix design. The investigational study is approved out
to examine the use of water retains by admixtures as self-curing agent. The properties of concrete are studied at
variouspercentages ofadmixtures which are additional to the concrete mix by weight of cement. The greatest size of
16mm and 10mm coarse aggregates which are available locallyand these aggregates are used in the present work. The
concrete mix is arranged by adding the different ingredients such as cement, fine aggregate, coarse aggregate and
admixture as per mix proportion. The various ingredients are weighed according to the mix proportionM60.
The specimen of cube were tested for 3, 7 and 28 days with each proportion of PVA by using Slump cone test,
Compaction test and Compression test to find their strength and workability of the concrete.
Keywords: Polyvinyl Alcohol, Self Curing agent, Water retentively
1. INTRODUCTION
Concrete curing is in goodsupport of maintaining adequate wet content in concrete for the duration of its early
stages to develop the desired properties.The plan of self-curing agents is to decline the water evaporation from
concrete and hence increases the water preservation capacity of the concrete.
The merit of self-curing admixtures is more considerable in different wasteland places anywhere water is not
sufficiently available. curative is the mainly significant progress in concrete construction.Since the hydration
of cement does take time – days, and weeks rather than hours – curing must be undertaken for a reasonable
period of time if the concrete is to achieve its potential strength and durability.
Curing may also encompass the control of temperature since this affects the rate at which cement hydrates.
The curing period may depend on the properties required of the concrete, the purpose for which it is to be
used, and the ambient conditions like temperature and relative humidity of the surrounding atmosphere.
Curing is the process which controls the rate and extent of wetness loss from concrete during cement
hydration. It may be either after it has been placed in position there by given that time for the hydration of the
cement to occur.The curing stage which can depend on the properties required of the concrete, the purpose for
which it is to be used, and the ambient conditions, i.e. the temperature and relative humidity of the
surrounding atmosphere.
2. PROPERTIES OF MATERIALS
2.1 Polyvinyl alcohol as self curing agent:
The admixture such as polyvinyl alcohol which is formed commercially from the compound of
polyvinyl acetate, regularly by a nonstop process. It isafragrance-free and flavourless, clear and white
coloured granular powder.

International Journal of Engineering Technology, Management and Applied Sciences
www.ijetmas.comApril 2017, Volume 5, Issue 4, ISSN 2349-4476
582 B. Ajitha, Ghantasala Nirupama
Figure 2.1 Sample of polyvinyl alcohol
It dissolves in water, partially soluble in ethyl alcohol, but in soluble in different Organic solvents. Classically
a 5% solution of polyvinyl alcohol exhibits a PH from the range of 5.0 to 6.5 Poly vinyl alcohol has a melting
point of 180 to 190⁰C.It has outstanding emulsifying and gumproperties.PVA is fully degradable and
dissolves quickly.
2.2 Fine aggregate (Sand):
The sand used for the experimental programme was locally available and conformed to Indian Standard
Specifications IS: 2386-2013. The sand was first sieved through 4.75 mm sieve to remove any particles
greater than 4.75 mm. Properties of the fine aggregate which is used in the experimental work are tabulated in
the below table 2.1. The fine aggregated belonged to grading zone II.
Figure 2:2 Sample of a fine aggregate
Table 2.1 Properties of fine aggregate
S.No Characteristics Value Specificationsas Per BIS
(IS 2386-2013)
1 Specific gravity 2.343 2.5-3.0
2 Fineness modulus 3.015 2.2-3.6
3 Grading zone II -
4 Bulk density 16.70 KN/m3
-
5. Bulking of sand 27.53% <40%
2.3 Cement
Ordinary Portland cement of grade 53 ACC cement was used for casting cubes, cylinders and beams for all
concrete mixes. The cement was of uniform colour i.e. grey and was free from any hard lumps. Summary of
the various tests conducted on cement are given in the below figure.

International Journal of Engineering Technology, Management and Applied Sciences
www.ijetmas.comApril 2017, Volume 5, Issue 4, ISSN 2349-4476
583 B. Ajitha, Ghantasala Nirupama
Figure 2:1 Sample of cement
Table 2.1 Properties of Cement
S.No Characteristics Values
obtained
Specifications
AS Per BIS (IS 2386-2013)
1 Specific gravity 3.24 3.0-3.15
2 Normal Consistency 26.5% -
3 Initial Setting time 39 min Not be less than 30 minutes
4 Final Setting time 185 min Not be greater than 600 minutes
5 Fineness of cement(m
2)
289 225
6 Fineness 3% Less
7 Sound ness:
LeChatelier expansion (mm) 1.0 Less than 10
2.4 Aggregates
The material which is retained on 4.5 mm sieve number IS 480 is termed as a coarse aggregate. The broken
stone is generally used as a coarse aggregate. The nature of work decides the maximum size of the coarse
aggregate. Locally available coarse aggregate having the maximum size of 16mm, 10 mm was used in this
work. The aggregates were washed to remove dust and dirt and were dried to surface dry condition. The
aggregates were tested as per Indian Standard Specifications BIS: 2386-2013 [3, 4]. The sieve shaker
apparatus used for the sieve analysis of aggregates. Crushed angular aggregates with maximum grain size of
16 mm, 10mm and downgraded were used and having following properties is shown in the below table.
Figure 2:2 Sample of granite aggregate

International Journal of Engineering Technology, Management and Applied Sciences
www.ijetmas.comApril 2017, Volume 5, Issue 4, ISSN 2349-4476
584 B. Ajitha, Ghantasala Nirupama
Table 2.2 Properties of coarse aggregates
S.NO
Particulars
Results
Specifications
AS Per BIS (IS 2386-2013)
1 Specific gravity
a)16mm
b)10mm
2.629
2.74
2.5-3.0
2 Fineness modulus 2.08 5-8
3 Flakiness index 18.96% Shall not exceed 40%
4 Elongation Index 24.64% Shall not exceed 40%
5 Crushing value 20% Shall not exceed 45%
6 Impact value 20.36% Shall not exceed 45%
7 Water Absorption 0.50% 0.1-2.0%
3. DETAILS OF SPECIMENS
3.1For Cube:
Figure 3:3 Specimen of Cube
Volume of cube =150x150x150
= 0.0033m3
The material is to be used for casting of concrete cube the quantity of material is
Cement : 425x0.0033 = 1.4025kgs
Fine aggregate : 653x0.0033 =2.1549kgs
Coarse aggregate
a) 16mm : 725x0.0033=2.3925kgs
b) 10mm : 483×0.0033=1.593kgs
Water : 148.8x0.0033=0.49104 litre
4. TESTS ARE CONDUCTED
4.1 Slump Cone Test
The concrete slump test is an empirical test that measures the workability of fresh concrete. More specifically,
it measures the consistency of the concrete in that specific batch. This test is performed to check the

International Journal of Engineering Technology, Management and Applied Sciences
www.ijetmas.comApril 2017, Volume 5, Issue 4, ISSN 2349-4476
585 B. Ajitha, Ghantasala Nirupama
consistency of freshly made concrete. Consistency is a term very closely related to workability. It is a term
which describes the state of fresh concrete.
It refers to the ease with which the concrete flows. Workability of concrete is mainly affected by consistency
i.e. wetter mixes will be more workable than drier mixes, but concrete of the same consistency may vary in
workability. It is also used to determine consistency between individual batches. The test is popular due to
the simplicity of apparatus used and simple procedure.
The apparatus for conducting the slump test essentially consists of metallic mould in the form of a
frustum of a cone having the internal dimensions which are given below. The slump cone figure has been
shown in the below figure.
Bottom Diameter :20 cm
Top Diameter : 10 cm
Height : 30 cm
Figure 4:1 Slump Cone
4.2 Compaction Factor Test
The compacting factor test is designed primary for use in the laboratory but it can also be used in the
field. It is more precise and sensitive than the slump test and is particularly useful for concrete mixes of very
low workability. Such dry concrete are insensitive to slump test. The diagram of the apparatus is shown in
figure 3.8. The compacting factor test has been developed at the road research laboratory U. K. and it is
claimed that is one of the most efficient tests for measuring the workability of concrete. This test works on the
principle of determining the degree of compaction achieved by a standard amount of work done by allowing
the concrete to fall through a standard height. The degree of compaction called the compacting factor is
measured by the density actually
achieved in the test to density of same concrete fully compacted. The top surface of the fully compacted
concrete is then carefully struck of level with the top of the cylinder and weighed to nearest 10gms. The
weight is known as “weight of fully compacted concrete”.
𝐂𝐎𝐌𝐏𝐀𝐂𝐓𝐈𝐎𝐍𝐅𝐀𝐂𝐓𝐎𝐑 =weight of partially compacted concrete
weight of fully compacted concrete
It can be realised that compacting factor test measures the inherent characteristics of the concrete which
relates very close to the workability requirements of the concrete and as such it is one of the good tests to
depict the workability of concrete.
International Journal of Engineering Technology, Management and Applied Sciences
www.ijetmas.comApril 2017, Volume 5, Issue 4, ISSN 2349-4476
586 B. Ajitha, Ghantasala Nirupama
Figure 4:2 Compacting Factor
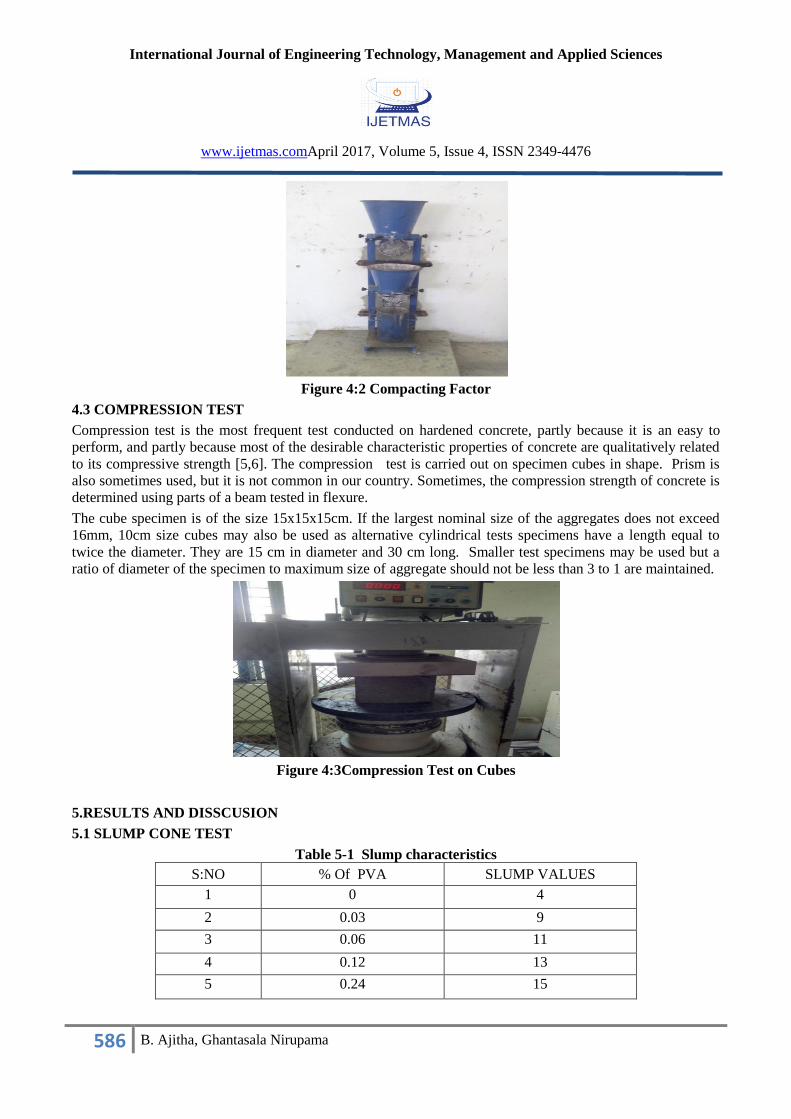
4.3 COMPRESSION TEST
Compression test is the most frequent test conducted on hardened concrete, partly because it is an easy to
perform, and partly because most of the desirable characteristic properties of concrete are qualitatively related
to its compressive strength [5,6]. The compression test is carried out on specimen cubes in shape. Prism is
also sometimes used, but it is not common in our country. Sometimes, the compression strength of concrete is
determined using parts of a beam tested in flexure.
The cube specimen is of the size 15x15x15cm. If the largest nominal size of the aggregates does not exceed
16mm, 10cm size cubes may also be used as alternative cylindrical tests specimens have a length equal to
twice the diameter. They are 15 cm in diameter and 30 cm long. Smaller test specimens may be used but a
ratio of diameter of the specimen to maximum size of aggregate should not be less than 3 to 1 are maintained.
Figure 4:3Compression Test on Cubes
5.RESULTS AND DISSCUSION
5.1 SLUMP CONE TEST
Table 5-1 Slump characteristics
S:NO % Of PVA SLUMP VALUES
1 0 4
2 0.03 9
3 0.06 11
4 0.12 13
5 0.24 15

International Journal of Engineering Technology, Management and Applied Sciences
www.ijetmas.comApril 2017, Volume 5, Issue 4, ISSN 2349-4476
587 B. Ajitha, Ghantasala Nirupama
Figure 5:1 Variation of slump values with % of PVA added to concrete
From the table and graphs shows the values of slump the concrete mix prepared by adding the 0.24%
by the PVA is having the more slump value [1,2]. It means it is more workable. If there is a need of concrete
which should have a high workability the mix with 0.24% PVA can be adopted. But through graphs we cannot
judge the exact % at which the workability is highest. Through the graph it can be said that the highest
workable mix can be get at the percentage between 0.12 and 0.24.
5.2 COMPACTING FACTOR
Table 5-2 Compaction Values
Sr. No % of PVA by the weight of
cement
COMPACTION
VALUE
1. Conventional 0.84
2. 0.03 0.91
3. 0.06 0.91
4. 0.12 0.92
5. 0.24 0.94
Figure 5:2 Variation of Compaction factor values with % of PVA added to concrete
0
2
4
6
8
10
12
14
16
0 0.03 0.06 0.`12 0.24
Slu
mp
Val
ues
% of PVA
0.8
0.82
0.84
0.86
0.88
0.9
0.92
0.94
0.96
0 0.03 0.06 0.12 0.24
Com
pac
tion v
alues
% of PVA

International Journal of Engineering Technology, Management and Applied Sciences
www.ijetmas.comApril 2017, Volume 5, Issue 4, ISSN 2349-4476
588 B. Ajitha, Ghantasala Nirupama
The compacting factor for the concrete mix gradually increased with the increase in % of PVA added up to
0.24% of weight of cement.
As the above table and graphs shows the concrete mix prepared by adding the 0.24% of PVA is
having the more compacting factor[8]. It means it is more workable. If there is a need of concrete which
should have a high workability the mix with 0.24% PVA can be adopted.
But through graphs we cannot judge the exact % at which the workability is highest. Through the graph it can
be said that the highest workable mix can be get at the percentage between 0.03 and 0.24. But through our
experiment we adopt that high compacting factor mix can be obtained by replacing 0.24% of fine aggregate
by PVA.
High compacting factor can be seen in the concretes with 0.24% of PVA added by the weight of the
cement in concretes[9].
5.3COMPRESSIVE STRENGTH
Table 5-3 Compressive Strength of all Samples
Samples % of PVA
Compressive Strength at 28
days (N/mm2)
28 days 7 days 3days
Sample (a) 0 64.93 46.25 34.47
Sample (b) 0.03 68.1 46.34 35.4
Sample (c) 0.06 61.9 44.1 32.5
Sample (d) 0.12 69.9 48.5 36.42
Sample (e) 0.24 72.0 51.2 37.8
Figure 5:1 Compressive strength of a cube at different percentages of PVA
The compressive strength for the concrete mix gradually increased with the increase
in % of PVA added up to 0.24% of PVA.As the table and graphs shows the concrete mix prepared by
replacing the 0.24%of PVA is having the more compressive strength. If there is a need of concrete with high
compressive strengths in same grade of concrete the mix with 0.24% PVA can be adopted. But through graphs
we cannot judge the exact % at which the compressive strength is highest. Through’ the graph it can be said
that the high compressive strength mix can be get at the percentage between 0.06% and 0.24%. But through
30
35
40
45
50
55
60
65
70
75
80
0 0.03 0.06 0.12 0.24
Co
mp
ress
ive
stre
ngth
N
/mm
2
% of PVA
Compressive strength of cube
3days
7days
28days

International Journal of Engineering Technology, Management and Applied Sciences
www.ijetmas.comApril 2017, Volume 5, Issue 4, ISSN 2349-4476
589 B. Ajitha, Ghantasala Nirupama
our experiment we adopt that high compressive strength mix can be obtained by replacing 0.24% of fine
aggregate by PVA[7]. High compressive strength can be seen in the concretes with 0.24% of PVA.
6. ADVANTAGES OF SELFCURING
To rise above from deficiency of external curing generated by both human and hydration.
To eliminate shrinkage (most probably autogenous shrinkage).
Provides moisture contents to keep continue hydration of cement.
Internal curing is a method to provide the water to hydrate all the cement, accomplishing what the mixing
water alone cannot do.
Increase/maintain the strength of concrete if the optimum dosage of self curing admixtures is used.
Protects by reflecting sun rays to keep the concrete surface cooler and prevent excessive heat buildup,
which can cause thermal cracking.
Furnished as a ready to use, true water based compound, produces hard, dense concrete, minimize hair
cracking, thermal cracking, dusting and other defects.
Offers a compressive strength significantly greater than improperly or uncured concrete.
Improves resistance to the abrasion and corrosive actions of salts and chemicals.
7. CONCLUSIONS
Addition of 0.24 %PVA to the concrete mix by the weight of cement gives the compressive strength same
as the conventional mix and more workable than conventional mix.
The concrete mix is more workable when 0.24% of PVA [8,9] added to concrete mix by weight of cement
as the slump values and compacting factor values are high when compared to conventional mix.
The concrete mix prepared by addition of 0.24% of PVA by weight of cement can be used where water is
scarce and unavailable.
Finally the concrete mix with 0.24% of PVA gives the best self curing concrete mix with high
compressive strength and high workability.
6. REFERENCES
1. Titford, E.M. The Golden Age of Concrete. London 1964 British Standards Institution. BS 1881: Part 2: 1970.
Testing Fresh Concrete. British Standards Institution. BS 1881: Part 102: 1983. Testing Concrete. Method of
determination of Slump
2. British Standards Institution. BS EN 12350-2: 2009. Testing Fresh Concrete – Part 2: Slump Test.
3. NageshTatobaSuryawanshi Assessment of the properties of self-cured concrete, Indapur Pune.
4. American Society of Testing Materials. C143/C143M – 10a. Test for the Slump of Hydraulic Cement Concrete.
5. Amin Noushini ,BijanSamali, Kirk Vessalas, Effect of polyvinyl alcohol (PVA) fibre on dynamic and material
properties of fibre reinforced concrete, Centre for Built Infrastructure Research (CBIR), School of Civil and
Environmental Engineering, University of Technology Sydney, AustraliaConstruction and Building Materials 49
(2013) 374–383.
6. Praveen Kumar and S. K. Kaushik (2004), “High strength concrete with ternary blend of fly ash and micro-silica”
Proceedings of ICFRC International Conference on Fiber Composites, High performance concretes and Smart
materials, 8-10 January 2004, Chennai, India, pp.883-892.
7. Krishnan (2001), “New materials and high strength concrete”, Workshop on concrete mix design, 22-24, January
2001, pp. 34-43.
8. Ansari, F. & Li, Q. (1998): “High-Strength Concrete Subjected to Tri axialCompression.”ACI Materials Journal,
Nov.-Dec., Title no. 95-M75, pp. 747-755.
9. Rao G.T and Andal T.,2002, A study of behavior of concrete with stone sand replacing river sand. National
conference on advances in construction materials, ACIM, Harmipur, H.P, Pp 196-201.