estimation of evapotranspiration in …swat.tamu.edu/media/57000/h4-2-bhatti.pdfestimation of...
TRANSCRIPT

ESTIMATION OF EVAPOTRANSPIRATION IN SARDAR SAROVAR COMMAND AREA USING WEAP
BY : RINA . CHOKSI, GOPAL H. BHATTI AND PROF. H. M. PATEL
CIVIL ENGINEERING DEPARTMENT,
FACULTY OF TECHNOLOGY AND ENGINEERING, THE M.S. UNIVERSITY OF BARODA, VADODARA

0
1000
2000
3000
4000
5000
6000
7000
8000
1911
1921
1931
1941
1951
1961
1971
1981
1991
2001
252
251
279
319
361
439
548 683 84
6 1027
7743
7771
7001
6129
5409
4446
3563
2858
2308
1902
Population(Million)
Per capita wateravailability(Cubic meters)
Source : Tata Energy Research Institute, (TERI), 1998 and Census India, 2001.
Per capita availability of fresh water estimated in 2001 in Gujarat was 1137 m3 per annum. As against national renewable fresh water standing of 2000m3. In view of this Gujarat can be identified as “Water Scarce State”.
India’s Population and Per-capita Water Availability

Available Water Resources in Gujarat State
• Total geographical area of state is 19.6 M ha.
• Cultivable area is 12.5 M ha. • Population of about 60.38 million (as per
2011 census). • States decade growth rate 19.17 %. • The state’s water resources are just 2.28%
of India’s total water resources. • Indicating the low availability per-capita
water. • Source : Gujarat State Water Policy, 2004
& GWSSB, 2005
River basins in Gujarat State
17
71 97
North & South Gujarat Saurashtra Kutch
Total 185 river basins in the state of Gujarat 17 basins are in the North and South Gujarat; 71 and 97 basins are in Saurashtra and Kutch region.
82%
15.80%
2.20%
Availability of quantum of water resources in Gujarat State
The availability of quantum of water resources in the north and south Gujarat is 82% . Total water available in Saurashtra and Kutch region is 15.80% and 2.20% respectively.

Sardar Sarovar Project Command Area
• The Sardar Sarovar Project is one of the largest irrigation projects of India.
• The GCA is 3.43 M ha, while CCA is
2.12 M ha. • Around 8215 villages and 135
towns/cities of Gujarat shall be covered under Narmada Project.
• Soil distribution ranges from loamy to
clayey. • Crops grown in the area are maize,
cotton, pulses, paddy, bajra, castor, tobacco and pulses in Kharif and wheat, maize, gram, jowar, pulses, vegetables in Rabi season
Objectives
• To estimate the actual crop evapotranspiration of maize and wheat crops in the study area.
• To carry out daily soil moisture balance in root zone.
• To evaluate two different irrigation scheduling
strategies, conventional and model based.

Methodology • Data collection related to irrigation
and crop water requirements from various agencies.
• Estimation of Reference evapotranspiration by using daily meteorological data of the year 2008-09 .
• Computing crop evapotranspiration for selected major crops.
• Estimating irrigation requirements.
• Working out strategies for irrigation. • Software usage
• Using MABIA Method in WEAP It includes modules for estimating
reference evapotranspiration and soil water capacity. For a daily simulation of transpiration, evaporation, irrigation requirements and scheduling
• The method uses dual crop coefficient where crop coefficient value is divided into a ‘basal’ crop coefficient, kcb and a separate, Ke, representing evaporation from the soil surface.
• The method is an improvement over CROPWAT, which uses single crop coefficient and hence, does not separate evaporation and transpiration.

CROP WATER REQUIREMENT
• Crop water requirement = Evaporation +Transpiration +Seepage below the Ground + Drainage.
• Major component is evaporation and transpiration combined to gather named Evapotranspiration.

Reference ETo • The rate of evapotranspiration from a
reference surface is called reference evapotranspiration.
• ETo can be computed from meteorological
data and crop data. It depends on: • Weather parameters such as radiation,
maximum and minimum temperature, humidity and wind speed;
• Crop factors such as crop type, development
stage, crop height, type of irrigation and Management and environmental conditions
• Different climatological methods are used for
estimating reference crop evapotranspiration (ETo).
• The FAO Penman-Monteith method is
recommended as the sole standard method for the definition and computation of the ETo.

Potential Evapotranspiration under Standard conditions (ETc)
• Amount of water that would be consumed by evapotranspiration if no water restrictions exists.
• The soil has extensive moisture and it is covered by fully developed vegetation.
• Crop evapotranspiration (ETc) can be calculated by multiplying the reference ETo by crop coefficient Kc (Allen et al., 1998).
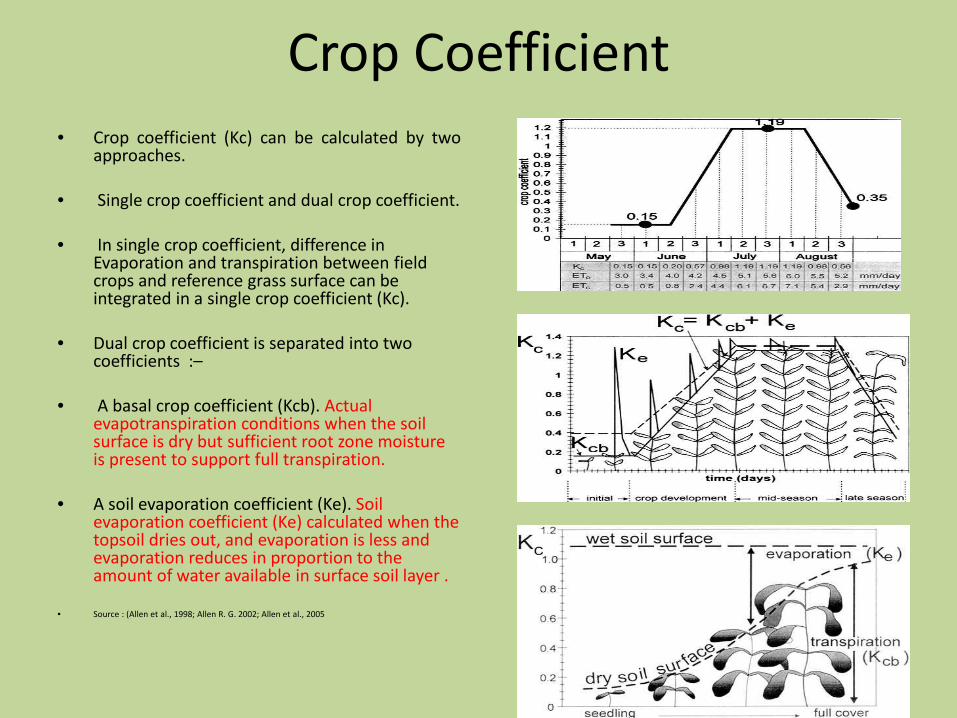
Crop Coefficient • Crop coefficient (Kc) can be calculated by two
approaches. • Single crop coefficient and dual crop coefficient. • In single crop coefficient, difference in
Evaporation and transpiration between field crops and reference grass surface can be integrated in a single crop coefficient (Kc).
• Dual crop coefficient is separated into two
coefficients :– • A basal crop coefficient (Kcb). Actual
evapotranspiration conditions when the soil surface is dry but sufficient root zone moisture is present to support full transpiration.
• A soil evaporation coefficient (Ke). Soil
evaporation coefficient (Ke) calculated when the topsoil dries out, and evaporation is less and evaporation reduces in proportion to the amount of water available in surface soil layer .
• Source : (Allen et al., 1998; Allen R. G. 2002; Allen et al., 2005

Actual Evapotranspiration under non standard conditions (ETc act)
• It is the amount of water that would be consumed by evapotranspiration in the catchment, including water supplied by irrigation also. It is also known as ET adj.
• The crop is under stress in the dry
soil when the potential energy of soil water drops below the threshold value.
• The effect of soil water stress can
be estimated by water stress coefficient (Ks) multiplied with basal crop coefficient (Kcb).

Computing crop evapotranspiration
• For Estimating irrigation requirements. • Estimating crop water requirements by calculating the
soil water balance of the root zone on daily basis. • Planning the depth and timing of irrigation • A daily water balance, expressed in terms of depletion
at the end of the day, is:
• Where = root zone depletion at the end of day i [mm] = depletion in the root zone at the end of the previous
day, i-1 [mm] = precipitation on day i [mm], limited by maximum
daily infiltration rate [mm] = surface runoff from the soil surface on day i [mm] = net irrigation depth on day i that infiltrates the soil
[mm] = capillary rise from the groundwater table on day i
[mm] = actual crop evapotranspiration on day i [mm] = water flux out of the root zone by deep percolation
on day i [mm]
Daily water balance

Reduced evaporation or transpiration due to limited moisture availability resulting from increasing soil moisture deficits:
• When soil is wet, stress coefficient (Ks) value is maximum and evapotranspiration occurs at potential rate.
• If there is precipitation or irrigation, Ks = 1. • As the soil surface dries, Ks<1 and when no
water is available for evapotranspiration in the top soil, Ks=0.
• To avoid crop water stress, irrigation needs to be applied. Ks can be calculated as follows (Allen et al., 1998; Allen R. G. 2002).
• • Where, TAW= Total Available Water (mm) RAW= Readily Available water (mm) Dr, i = root zone depletion at end of
day i (mm) p = depletion factor
Source:- Rushton et al., 2005.

Working out strategies for irrigation
ASE NO. CROP PLANTING DATE
HARVESTING DATE
IRRIGATION STRATEGY
IRRIGATION SCHEDULING
IRRIGATION AMOUNT
I raditional practices
Maize 5th July 22nd September
18th ,47th, 60th day 25 mm
Wheat 1st November
28th February
1st, 6th, 11th, 34th, 46th, 58th, 60th, 72nd, 84th day
60 mm
II Model
specified
Maize 5th July 22nd September
100% RAW
100% Depletion
Wheat 1st November
28th February
100% RAW
100% Depletion
• Irrigation to be applied before or at the moment when readily available water (RAW) is equal or greater than soil moisture depletion (SMD) to avoid crop water stress. i.e. (SMD <= RAW).
• Irrigation applied at fixed interval and fixed amount as per practices followed by localities.
• Irrigation to be applied when crop reaches at a fixed % of soil moisture depletion.
• The irrigation amount can also be determined according to fixed depth, % of deletion, % of RAW and % of TAW.
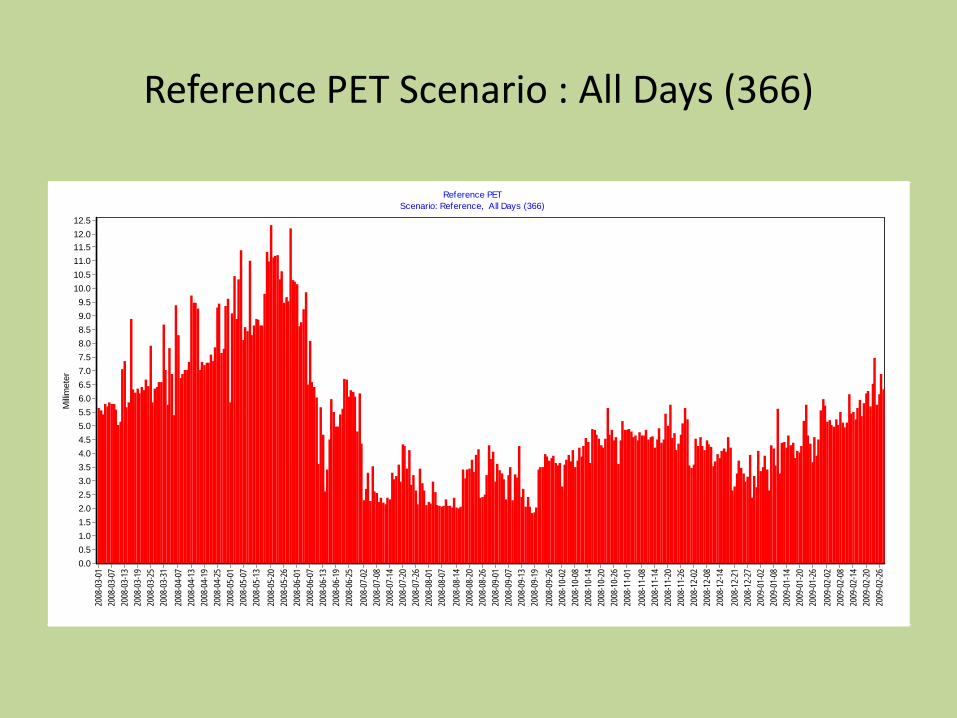
Reference PET Scenario : All Days (366)
Reference PETScenario: Reference, All Days (366)
2008
-03-
0120
08-0
3-07
2008
-03-
1320
08-0
3-19
2008
-03-
2520
08-0
3-31
2008
-04-
0720
08-0
4-13
2008
-04-
1920
08-0
4-25
2008
-05-
0120
08-0
5-07
2008
-05-
1320
08-0
5-20
2008
-05-
2620
08-0
6-01
2008
-06-
0720
08-0
6-13
2008
-06-
1920
08-0
6-25
2008
-07-
0220
08-0
7-08
2008
-07-
1420
08-0
7-20
2008
-07-
2620
08-0
8-01
2008
-08-
0720
08-0
8-14
2008
-08-
2020
08-0
8-26
2008
-09-
0120
08-0
9-07
2008
-09-
1320
08-0
9-19
2008
-09-
2620
08-1
0-02
2008
-10-
0820
08-1
0-14
2008
-10-
2020
08-1
0-26
2008
-11-
0120
08-1
1-08
2008
-11-
1420
08-1
1-20
2008
-11-
2620
08-1
2-02
2008
-12-
0820
08-1
2-14
2008
-12-
2120
08-1
2-27
2009
-01-
0220
09-0
1-08
2009
-01-
1420
09-0
1-20
2009
-01-
2620
09-0
2-02
2009
-02-
0820
09-0
2-14
2009
-02-
2020
09-0
2-26
Milli
met
er
12.512.011.511.010.510.09.59.08.58.07.57.06.56.05.55.04.54.03.53.02.52.01.51.00.50.0

Comparison of potential and actual crop coefficient for case 1
agriculture catchment
Kc PotentialScenario: Reference, All Days (366)
3/1/20
083/7
/2008
3/13/2
008
3/19/2
008
3/25/2
008
3/31/2
008
4/6/20
084/1
2/200
84/1
8/200
84/2
4/200
84/3
0/200
85/6
/2008
5/12/2
008
5/18/2
008
5/24/2
008
5/30/2
008
6/5/20
086/1
1/200
86/1
7/200
86/2
3/200
86/2
9/200
87/5
/2008
7/11/2
008
7/17/2
008
7/23/2
008
7/29/2
008
8/4/20
088/1
0/200
88/1
6/200
88/2
2/200
88/2
8/200
89/3
/2008
9/9/20
089/1
5/200
89/2
1/200
89/2
7/200
810
/3/20
0810
/9/20
0810
/15/20
0810
/21/20
0810
/27/20
0811
/2/20
0811
/8/20
0811
/14/20
0811
/20/20
0811
/26/20
0812
/2/20
0812
/8/20
0812
/14/20
0812
/20/20
0812
/26/20
081/1
/2009
1/7/20
091/1
3/200
91/1
9/200
91/2
5/200
91/3
1/200
92/6
/2009
2/12/2
009
2/18/2
009
2/24/2
009
1.351.301.251.201.151.101.051.000.950.900.850.800.750.700.650.600.550.500.450.400.350.300.250.200.150.100.050.00
Case 1 Traditional practices Kc Potential .
agriculture catchment
Kc ActualScenario: Reference, All Days (366)
3/1/20
083/7
/2008
3/13/2
008
3/19/2
008
3/25/2
008
3/31/2
008
4/6/20
084/1
2/200
84/1
8/200
84/2
4/200
84/3
0/200
85/6
/2008
5/12/2
008
5/18/2
008
5/24/2
008
5/30/2
008
6/5/20
086/1
1/200
86/1
7/200
86/2
3/200
86/2
9/200
87/5
/2008
7/11/2
008
7/17/2
008
7/23/2
008
7/29/2
008
8/4/20
088/1
0/200
88/1
6/200
88/2
2/200
88/2
8/200
89/3
/2008
9/9/20
089/1
5/200
89/2
1/200
89/2
7/200
810
/3/20
0810
/9/20
0810
/15/20
0810
/21/20
0810
/27/20
0811
/2/20
0811
/8/20
0811
/14/20
0811
/20/20
0811
/26/20
0812
/2/20
0812
/8/20
0812
/14/20
0812
/20/20
0812
/26/20
081/1
/2009
1/7/20
091/1
3/200
91/1
9/200
91/2
5/200
91/3
1/200
92/6
/2009
2/12/2
009
2/18/2
009
2/24/2
009
1.351.301.251.201.151.101.051.000.950.900.850.800.750.700.650.600.550.500.450.400.350.300.250.200.150.100.050.00
Case 1 Traditional practices Kc Actual. It is marginally lesser in initial period of wheat

Comparison of actual Crop Coefficient of both cases
agriculture catchment
Kc ActualScenario: Reference, All Days (366)
3/1/20
083/7
/2008
3/13/2
008
3/19/2
008
3/25/2
008
3/31/2
008
4/6/20
084/1
2/200
84/1
8/200
84/2
4/200
84/3
0/200
85/6
/2008
5/12/2
008
5/18/2
008
5/24/2
008
5/30/2
008
6/5/20
086/1
1/200
86/1
7/200
86/2
3/200
86/2
9/200
87/5
/2008
7/11/2
008
7/17/2
008
7/23/2
008
7/29/2
008
8/4/20
088/1
0/200
88/1
6/200
88/2
2/200
88/2
8/200
89/3
/2008
9/9/20
089/1
5/200
89/2
1/200
89/2
7/200
810
/3/20
0810
/9/20
0810
/15/20
0810
/21/20
0810
/27/20
0811
/2/20
0811
/8/20
0811
/14/20
0811
/20/20
0811
/26/20
0812
/2/20
0812
/8/20
0812
/14/20
0812
/20/20
0812
/26/20
081/1
/2009
1/7/20
091/1
3/200
91/1
9/200
91/2
5/200
91/3
1/200
92/6
/2009
2/12/2
009
2/18/2
009
2/24/2
009
1.351.301.251.201.151.101.051.000.950.900.850.800.750.700.650.600.550.500.450.400.350.300.250.200.150.100.050.00
Case 1 Traditional practices Kc actual
Case 2 Model
specified Kc actual
are marginally higher in
initial period
agriculture catchment
Kc ActualScenario: Reference, All Days (366)
3/1/20
083/7
/2008
3/13/2
008
3/19/2
008
3/25/2
008
3/31/2
008
4/6/20
084/1
2/200
84/1
8/200
84/2
4/200
84/3
0/200
85/6
/2008
5/12/2
008
5/18/2
008
5/24/2
008
5/30/2
008
6/5/20
086/1
1/200
86/1
7/200
86/2
3/200
86/2
9/200
87/5
/2008
7/11/2
008
7/17/2
008
7/23/2
008
7/29/2
008
8/4/20
088/1
0/200
88/1
6/200
88/2
2/200
88/2
8/200
89/3
/2008
9/9/20
089/1
5/200
89/2
1/200
89/2
7/200
810
/3/20
0810
/9/20
0810
/15/20
0810
/21/20
0810
/27/20
0811
/2/20
0811
/8/20
0811
/14/20
0811
/20/20
0811
/26/20
0812
/2/20
0812
/8/20
0812
/14/20
0812
/20/20
0812
/26/20
081/1
/2009
1/7/20
091/1
3/200
91/1
9/200
91/2
5/200
91/3
1/200
92/6
/2009
2/12/2
009
2/18/2
009
2/24/2
009
1.351.301.251.201.151.101.051.000.950.900.850.800.750.700.650.600.550.500.450.400.350.300.250.200.150.100.050.00

Comparison of ET actual and ET potential of both cases
CASE NO. CROP TOTAL ET actual (mm)
TOTAL ET pot
1 Maize 251.12 251.12
Wheat 478.13 479.82
2 Maize 251.39 251.39
Wheat 506.01 506.13
ET Actual ET Potential
ET Actual and PotentialScenario: Reference, All Days (366)
3/1/
2008
3/7/
2008
3/13
/200
83/
19/2
008
3/25
/200
83/
31/2
008
4/6/
2008
4/12
/200
84/
18/2
008
4/24
/200
84/
30/2
008
5/6/
2008
5/12
/200
85/
18/2
008
5/24
/200
85/
30/2
008
6/5/
2008
6/11
/200
86/
17/2
008
6/23
/200
86/
29/2
008
7/5/
2008
7/11
/200
87/
17/2
008
7/23
/200
87/
29/2
008
8/4/
2008
8/10
/200
88/
16/2
008
8/22
/200
88/
28/2
008
9/3/
2008
9/9/
2008
9/15
/200
89/
21/2
008
9/27
/200
810
/3/2
008
10/9
/200
810
/15/
2008
10/2
1/20
0810
/27/
2008
11/2
/200
811
/8/2
008
11/1
4/20
0811
/20/
2008
11/2
6/20
0812
/2/2
008
12/8
/200
812
/14/
2008
12/2
0/20
0812
/26/
2008
1/1/
2009
1/7/
2009
1/13
/200
91/
19/2
009
1/25
/200
91/
31/2
009
2/6/
2009
2/12
/200
92/
18/2
009
2/24
/200
9
Met
er
0.0080
0.0075
0.0070
0.0065
0.0060
0.0055
0.0050
0.0045
0.0040
0.0035
0.0030
0.0025
0.0020
0.0015
0.0010
0.0005
0.0000
Case 1: Traditional practices
Case 2: Model specified
ET Actual ET Potential
ET Actual and PotentialScenario: Reference, All Days (366)
2008
-03-
0120
08-0
3-07
2008
-03-
1320
08-0
3-19
2008
-03-
2520
08-0
3-31
2008
-04-
0620
08-0
4-12
2008
-04-
1820
08-0
4-24
2008
-04-
3020
08-0
5-06
2008
-05-
1220
08-0
5-18
2008
-05-
2420
08-0
5-30
2008
-06-
0520
08-0
6-11
2008
-06-
1720
08-0
6-23
2008
-06-
2920
08-0
7-05
2008
-07-
1120
08-0
7-17
2008
-07-
2320
08-0
7-29
2008
-08-
0420
08-0
8-10
2008
-08-
1620
08-0
8-22
2008
-08-
2820
08-0
9-03
2008
-09-
0920
08-0
9-15
2008
-09-
2120
08-0
9-27
2008
-10-
0320
08-1
0-09
2008
-10-
1520
08-1
0-21
2008
-10-
2720
08-1
1-02
2008
-11-
0820
08-1
1-14
2008
-11-
2020
08-1
1-26
2008
-12-
0220
08-1
2-08
2008
-12-
1420
08-1
2-20
2008
-12-
2620
09-0
1-01
2009
-01-
0720
09-0
1-13
2009
-01-
1920
09-0
1-25
2009
-01-
3120
09-0
2-06
2009
-02-
1220
09-0
2-18
2009
-02-
24
Milli
met
er
7.5
7.0
6.5
6.0
5.5
5.0
4.5
4.0
3.5
3.0
2.5
2.0
1.5
1.0
0.5
0.0
In maize crop, actual evapotranspiration is found same in Case-I and Case-II as this crop is not under water stress in both the cases. But, in case of wheat crop; the water stress condition has resulted lower value of actual evapotranspiration in Case-I
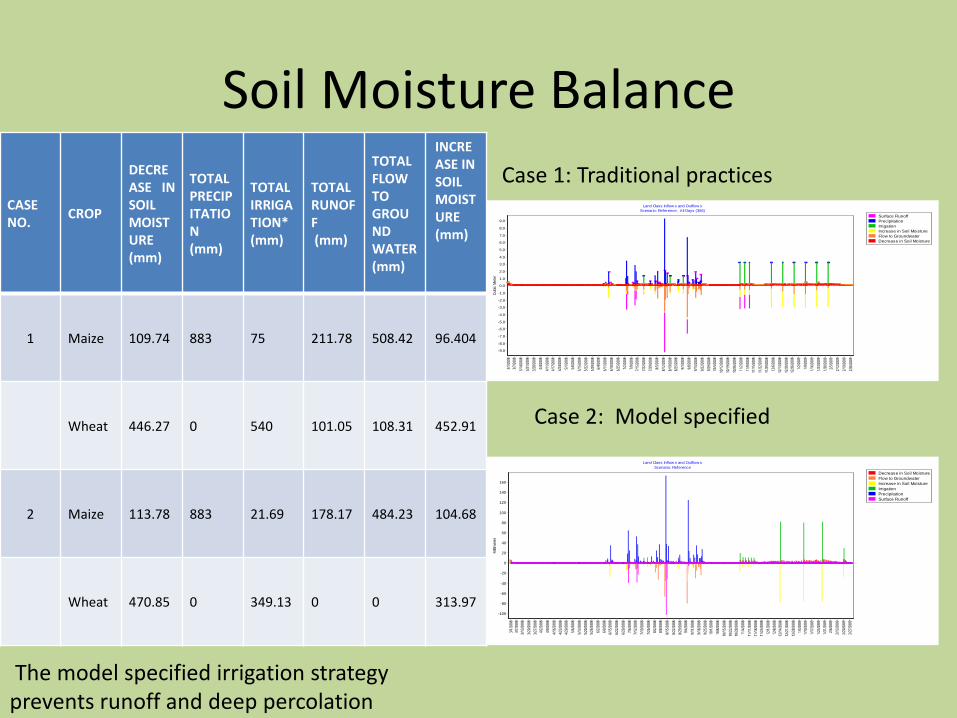
Soil Moisture Balance
CASE NO. CROP
DECREASE IN SOIL MOISTURE (mm)
TOTAL PRECIPITATION (mm)
TOTAL IRRIGATION* (mm)
TOTAL RUNOF F (mm)
TOTAL FLOW TO GROUND WATER (mm)
INCREASE IN SOIL MOISTURE (mm)
1 Maize 109.74 883 75 211.78 508.42 96.404
Wheat 446.27 0 540 101.05 108.31 452.91
2 Maize 113.78 883 21.69 178.17 484.23 104.68
Wheat 470.85 0 349.13 0 0 313.97
Surface Runoff Precipitation Irrigation Increase in Soil MoistureFlow to Groundwater Decrease in Soil Moisture
Land Class Inflow s and Outflow sScenario: Reference, All Days (366)
3/1/20
083/7
/2008
3/14/2
008
3/21/2
008
3/28/2
008
4/4/20
084/1
1/200
84/1
7/200
84/2
4/200
85/1
/2008
5/8/20
085/1
5/200
85/2
2/200
85/2
9/200
86/4
/2008
6/11/2
008
6/18/2
008
6/25/2
008
7/2/20
087/9
/2008
7/15/2
008
7/22/2
008
7/29/2
008
8/5/20
088/1
2/200
88/1
9/200
88/2
5/200
89/1
/2008
9/8/20
089/1
5/200
89/2
2/200
89/2
9/200
810
/5/20
0810
/12/20
0810
/19/20
0810
/26/20
0811
/2/20
0811
/9/20
0811
/15/20
0811
/22/20
0811
/29/20
0812
/6/20
0812
/13/20
0812
/20/20
0812
/26/20
081/2
/2009
1/9/20
091/1
6/200
91/2
3/200
91/3
0/200
92/5
/2009
2/12/2
009
2/19/2
009
2/26/2
009
Cubic
Met
er
9.0
8.0
7.0
6.0
5.0
4.0
3.0
2.0
1.0
0.0
-1.0
-2.0
-3.0
-4.0
-5.0
-6.0
-7.0
-8.0
-9.0
Decrease in Soil MoistureFlow to Groundwater Increase in Soil MoistureIrrigation Precipitation Surface Runoff
Land Class Inflow s and Outflow sScenario: Reference
3/1/20
083/7
/2008
3/13/2
008
3/20/2
008
3/27/2
008
4/2/20
084/9
/2008
4/16/2
008
4/23/2
008
4/29/2
008
5/6/20
085/1
3/200
85/2
0/200
85/2
6/200
86/2
/2008
6/9/20
086/1
5/200
86/2
2/200
86/2
9/200
87/6
/2008
7/12/2
008
7/19/2
008
7/26/2
008
8/2/20
088/8
/2008
8/15/2
008
8/22/2
008
8/29/2
008
9/4/20
089/1
1/200
89/1
8/200
89/2
5/200
810
/1/20
0810
/8/20
0810
/15/20
0810
/22/20
0810
/28/20
0811
/4/20
0811
/11/20
0811
/18/20
0811
/24/20
0812
/1/20
0812
/8/20
0812
/14/20
0812
/21/20
0812
/28/20
081/4
/2009
1/10/2
009
1/17/2
009
1/24/2
009
1/31/2
009
2/6/20
092/1
3/200
92/2
0/200
92/2
7/200
9
Milli
met
er
160
140
120
100
80
60
40
20
0
-20
-40
-60
-80
-100
Case 1: Traditional practices
Case 2: Model specified
The model specified irrigation strategy prevents runoff and deep percolation

Soil Moisture Depletion, RAW And TAW
Case-I Traditional Practices
Case-II Triggering Irrigation when Soil Moisture Depletion reaches 100% of RAW
Readily Available WaterSoil Moisture DepletionTotal Available Water
Depletion and Available WaterScenario: Reference, All Days (366)
2008
-03-01
2008
-03-07
2008
-03-13
2008
-03-19
2008
-03-25
2008
-03-31
2008
-04-07
2008
-04-13
2008
-04-19
2008
-04-25
2008
-05-01
2008
-05-07
2008
-05-13
2008
-05-20
2008
-05-26
2008
-06-01
2008
-06-07
2008
-06-13
2008
-06-19
2008
-06-25
2008
-07-02
2008
-07-08
2008
-07-14
2008
-07-20
2008
-07-26
2008
-08-01
2008
-08-07
2008
-08-14
2008
-08-20
2008
-08-26
2008
-09-01
2008
-09-07
2008
-09-13
2008
-09-19
2008
-09-26
2008
-10-02
2008
-10-08
2008
-10-14
2008
-10-20
2008
-10-26
2008
-11-01
2008
-11-08
2008
-11-14
2008
-11-20
2008
-11-26
2008
-12-02
2008
-12-08
2008
-12-14
2008
-12-21
2008
-12-27
2009
-01-02
2009
-01-08
2009
-01-14
2009
-01-20
2009
-01-26
2009
-02-02
2009
-02-08
2009
-02-14
2009
-02-20
2009
-02-26
Millim
eter
180
170
160
150
140
130
120
110
100
90
80
70
60
50
40
30
20
10
0
Readily Available WaterSoil Moisture DepletionTotal Available Water
Depletion and Available WaterScenario: Reference, All Days (366)
2008
-03-
0120
08-0
3-07
2008
-03-
1320
08-0
3-19
2008
-03-
2520
08-0
3-31
2008
-04-
0720
08-0
4-13
2008
-04-
1920
08-0
4-25
2008
-05-
0120
08-0
5-07
2008
-05-
1320
08-0
5-20
2008
-05-
2620
08-0
6-01
2008
-06-
0720
08-0
6-13
2008
-06-
1920
08-0
6-25
2008
-07-
0220
08-0
7-08
2008
-07-
1420
08-0
7-20
2008
-07-
2620
08-0
8-01
2008
-08-
0720
08-0
8-14
2008
-08-
2020
08-0
8-26
2008
-09-
0120
08-0
9-07
2008
-09-
1320
08-0
9-19
2008
-09-
2620
08-1
0-02
2008
-10-
0820
08-1
0-14
2008
-10-
2020
08-1
0-26
2008
-11-
0120
08-1
1-08
2008
-11-
1420
08-1
1-20
2008
-11-
2620
08-1
2-02
2008
-12-
0820
08-1
2-14
2008
-12-
2120
08-1
2-27
2009
-01-
0220
09-0
1-08
2009
-01-
1420
09-0
1-20
2009
-01-
2620
09-0
2-02
2009
-02-
0820
09-0
2-14
2009
-02-
2020
09-0
2-26
Milli
met
er
180
170
160
150
140
130
120
110
100
90
80
70
60
50
40
30
20
10
0

Concluding Remarks • In maize crop, actual
evapotranspiration is found same in Case-I and Case-II as this crop is not under water stress in both the cases.
• But, in case of wheat crop;
the water stress condition has resulted lower value of actual evapotranspiration in Case-I.
• The model specified irrigation
strategy also prevents runoff and deep percolation.
• Thus saving of water can be achieved by application of WEAP in determining irrigation requirements in real time condition.
• The prevention of water
stress condition by model application also improves yield of crop

References • Allen R. G., Pereira L.S., Raes D. and Smith M. 1998. Crop evapotranspiration - Guidelines for
computing crop water requirements –United Nations Food and Agriculture Organization, Irrigation and drainage paper 56 Produced by: Natural Resources Management and Environment Department
• Allen R. G. 2002. Evapotranspiration : The FAO-56 Dual Crop Coefficient Method and Accuracy of predictions for Project-wide Evapotranspiration, International meeting on Advances in Drip/Micro Irrigation
• Allen R. G. 2005. FAO-56 Dual crop coefficient Method for estimating Evaporation from soil and application Extensions. Journal of Irrigation and Drainage Engineering ASCE/January/February 2005.
• Kumar R., Vijay Shankar and Mahesh Kumar. Modeling of Crop Reference Evapotranspiration : A Review. Universal journal of Environment Research and Technology, 1(3):239-246
• Rossa R. D., Paredesa P., Rdriguesa G. C., Alvesa I. , Fernandoa R. M., Pereirra L. S. 2012. Implementing the Dual Crop Coefficient approach in interactive software. Agricultural Water Management, 103 : 8-24
• Rushton K. R., Eilers V.H.M., Carter R. C. 2005. Improved soil moisture balance methodology for recharge estimation, Journal of Hydrology 318 (2006): 379-399.
• WEAP 2011. Tutorial modules & and user guide, Sieber J., Purkey D., Stockholm Environment Institute (SEI)

Thank you


Irrigation Strategy for Maize and Wheat Crop
CASE NO. CROP PLANTING DATE
HARVESTING DATE
IRRIGATION STRATEGY
IRRIGATION SCHEDULING
IRRIGATION AMOUNT
I Maize 5th July 22nd September
18th ,47th, 60th day 25 mm
Wheat 1st November 28th February
1st, 6th, 11th, 34th, 46th, 58th, 60th, 72nd, 84th day
60 mm
II Maize 5th July 22nd September 100% RAW 100%
Depletion
Wheat 1st November 28th February 100% RAW 100% Depletion


Motivation of the study • Complexities involved in
estimation of Crop water requirement with different parameters. (Weather, Crop, Soil)
• The intricacy involved in measurement of rainfall and/or irrigation losses by surface run off, percolation beyond root zone and soil moisture use of crops.
• Uncertainties arise in estimating the moisture availability.
• Development in recording meteorological data using automated instruments on daily as well as hourly basis.
• Using this data it is also possible to precisely estimate reference evapotranspiration.
• Using advance model such as Penman Monteith it is possible to integrate all this technology related to data and model to precisely monitor the irrigation process (soil moisture balance).
• The applying the water to the
crops when it is not essential; while not applying when it is desirable.

Basal Crop and Soil Evaporation Coefficients
• Kcb represents actual evapotranspiration conditions when the soil surface is dry but sufficient root zone moisture is present to support full transpiration.
• Soil evaporation coefficient (Ke) calculated when the topsoil dries out, and evaporation is less and evaporation reduces in proportion to the amount of water available in surface soil layer (Allen et al., 1998; Allen R. G. 2002; Allen et al., 2005).


Runoff and Flow to Groundwater
during Irrigation of Maize and Wheat Crop
CASE NO. CROP TOTAL ETactual (mm)
TOTAL PRECIPITATION (mm)
TOTAL IRRIGATION* (mm)
TOTAL RUNOFF (mm)
TOTAL FLOW TO GROUND WATER (mm)
1 Maize 251.12 883 75 211.78 508.42
Wheat 478.13 0 540 101.05 108.31
2 Maize 251.39 883 21.69 178.17 484.23
Wheat 506.01 0 349.13 0 0

Land Class Inflows and Outflows Surface Runoff Precipitation Irrigation Increase in Soil MoistureFlow to Groundwater Decrease in Soil Moisture
Land Class Inflow s and Outflow sScenario: Reference, All Days (366)
3/1/20
083/7
/2008
3/14/2
008
3/21/2
008
3/28/2
008
4/4/20
084/1
1/200
84/1
7/200
84/2
4/200
85/1
/2008
5/8/20
085/1
5/200
85/2
2/200
85/2
9/200
86/4
/2008
6/11/2
008
6/18/2
008
6/25/2
008
7/2/20
087/9
/2008
7/15/2
008
7/22/2
008
7/29/2
008
8/5/20
088/1
2/200
88/1
9/200
88/2
5/200
89/1
/2008
9/8/20
089/1
5/200
89/2
2/200
89/2
9/200
810
/5/20
0810
/12/20
0810
/19/20
0810
/26/20
0811
/2/20
0811
/9/20
0811
/15/20
0811
/22/20
0811
/29/20
0812
/6/20
0812
/13/20
0812
/20/20
0812
/26/20
081/2
/2009
1/9/20
091/1
6/200
91/2
3/200
91/3
0/200
92/5
/2009
2/12/2
009
2/19/2
009
2/26/2
009
Cubic
Met
er
9.0
8.0
7.0
6.0
5.0
4.0
3.0
2.0
1.0
0.0
-1.0
-2.0
-3.0
-4.0
-5.0
-6.0
-7.0
-8.0
-9.0
Case 1
Case 2 Decrease in Soil MoistureFlow to Groundwater Increase in Soil MoistureIrrigation Precipitation Surface Runoff
Land Class Inflow s and Outflow sScenario: Reference
3/1/20
083/7
/2008
3/13/2
008
3/20/2
008
3/27/2
008
4/2/20
084/9
/2008
4/16/2
008
4/23/2
008
4/29/2
008
5/6/20
085/1
3/200
85/2
0/200
85/2
6/200
86/2
/2008
6/9/20
086/1
5/200
86/2
2/200
86/2
9/200
87/6
/2008
7/12/2
008
7/19/2
008
7/26/2
008
8/2/20
088/8
/2008
8/15/2
008
8/22/2
008
8/29/2
008
9/4/20
089/1
1/200
89/1
8/200
89/2
5/200
810
/1/20
0810
/8/20
0810
/15/20
0810
/22/20
0810
/28/20
0811
/4/20
0811
/11/20
0811
/18/20
0811
/24/20
0812
/1/20
0812
/8/20
0812
/14/20
0812
/21/20
0812
/28/20
081/4
/2009
1/10/2
009
1/17/2
009
1/24/2
009
1/31/2
009
2/6/20
092/1
3/200
92/2
0/200
92/2
7/200
9
Millim
eter
160
140
120
100
80
60
40
20
0
-20
-40
-60
-80
-100
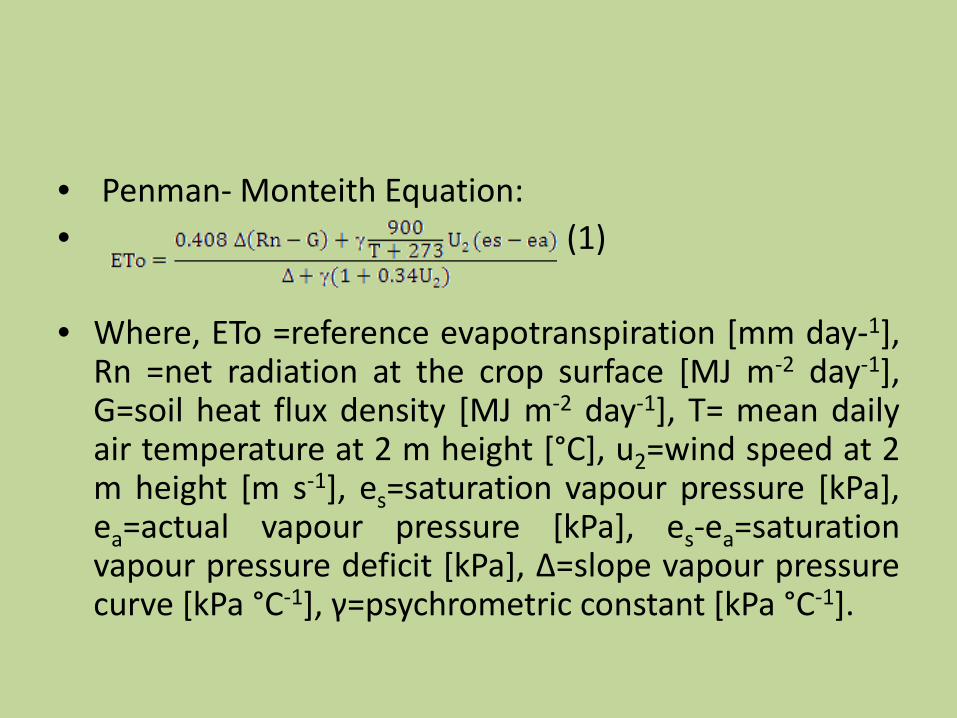
• Penman- Monteith Equation: • (1)
• Where, ETo =reference evapotranspiration [mm day-1],
Rn =net radiation at the crop surface [MJ m-2 day-1], G=soil heat flux density [MJ m-2 day-1], T= mean daily air temperature at 2 m height [°C], u2=wind speed at 2 m height [m s-1], es=saturation vapour pressure [kPa], ea=actual vapour pressure [kPa], es-ea=saturation vapour pressure deficit [kPa], ∆=slope vapour pressure curve [kPa °C-1], γ=psychrometric constant [kPa °C-1].

Working out strategies for irrigation
• Irrigation to be applied before or at the moment when readily available water (RAW) is equal or greater than soil moisture depletion (SMD) to avoid crop water stress. i.e. (SMD <= RAW).
• Irrigation applied at fixed interval and fixed amount as per practices followed by localities.
• Irrigation to be applied when crop reaches at a fixed % of soil moisture depletion.
• The irrigation amount can also be determined according to fixed depth, % of deletion, % of RAW and % of TAW.