estimation of fertility from the 2007 community … of fertility from the 2007 community survey of...
TRANSCRIPT


Estimation of fertility from the 2007 Community Survey of South Africa
Pali Lehohla Statistician-General
Report No. 03-00-04 Statistics South Africa
2010

ii
Estimation of fertility from the 2007 Community Survey of South Africa Published by Statistics South Africa, Private Bag X44, Pretoria 0001 © Statistics South Africa, 2010 Users may apply or process this data, provided Statistics South Africa (Stats SA) is acknowledged as the original source of the data; that it is specified that the application and/or analysis is the result of the user's independent processing of the data; and that neither the basic data nor any reprocessed version or application thereof may be sold or offered for sale in any form whatsoever without prior permission from Stats SA. Estimation of fertility from the 2007 Community Survey of South Africa / Statistics South Africa. Pretoria: Statistics South Africa, 2010 43 pages [Report No. 03-00-04] ISBN 978-0-621-39032-2 1. Population - Statistics 2. Fertility 3. Community Survey fertility data - South Africa 4. Births - South Africa I. Statistics South Africa (LCSH 23) A complete set of Stats SA publications is available at Stats SA Library and the following libraries:
National Library of South Africa, Pretoria Division National Library of South Africa, Cape Town Division Library of Parliament, Cape Town Bloemfontein Public Library Natal Society Library, Pietermaritzburg Johannesburg Public Library Eastern Cape Library Services, King William’s Town Central Regional Library, Polokwane Central Reference Library, Nelspruit Central Reference Collection, Kimberley Central Reference Library, Mmabatho
This report is available on the Stats SA website: www.statssa.gov.za Copies are obtainable from: Printing and Distribution, Statistics South Africa Tel: (012) 310 8044 (Free publications) Email: [email protected] Tel: (012) 310 8619 Email: [email protected] Fax: (012) 321 7381 (012) 310 2973 For technical enquiries contact: Sandile Simelane Tel: 012 310 8908 Email: [email protected]

iii
Acknowledgements The author wishes to thank professors E Udjo (University of South Africa), K Hill (Harvard University) and Drs J Kekovole and S Ubomba-Jaswa (Statistics South Africa) for their invaluable comments on the earlier drafts of this monograph.

iv
List of abbreviations and acronyms ASFR Age-specific fertility rate
CEB Number of children ever born
CDEAD Number of children dead
CS Community Survey
CSurv Number of children surviving
CSurvH Number of children surviving and staying in same household with their
mother
CSurvA Number of children surviving but staying elsewhere (not with their
mother)
DHS Demographic and Health Survey
MAC Mean age of child bearing
OHS October Household Survey
SES Socio-economic Status
Stats SA Statistics South Africa
TCEB Total number of children ever born
TFR Total fertility rate
UN United Nations

v
Contents Acknowledgements ...........................................................................................................iii List of abbreviations and acronyms...................................................................................iv List of Tables.....................................................................................................................vi List of Figures....................................................................................................................vi List of Appendices.............................................................................................................vi Preface.............................................................................................................................vii Executive summary......................................................................................................... viii 1. Introduction .................................................................................................................. 1 2. Overview of levels, trends and differentials of fertility in South Africa.......................... 1 3. Fertility data collected by the 2007 Community Survey ............................................... 3 3.1 Assessment of data........................................................................................ 4
3.1.1 Quality of age data in the CS.............................................................. 4 3.1.2 Quality of parity data........................................................................... 7 3.1.3 Quality of data on births in the last 12 months before
enumeration................................................................................. 12 3.1.4 Conclusion of the assessment of fertility data obtained
from the CS.................................................................................. 13 4. Methods that could be used to estimate fertility levels from the CS-type of
data ........................................................................................................................ 14 4.1 The P/F ratio method.................................................................................... 14 4.2 The Arriaga Method...................................................................................... 15 4.3 The Relational Gompertz Method ................................................................ 16 4.4 Methods used to estimate TFR in this study ................................................ 16 5. Results ....................................................................................................................... 17 6. Discussion and conclusion......................................................................................... 19 Appendices ..................................................................................................................... 21 References...................................................................................................................... 30

vi
List of Tables Table 1. Distribution of all persons and women aged 15–49 years by population group and type of imputation applied to age data, CS 2007 ........................... 5 Table 2. Distribution of women by quality of responses provided in the parity schedule of the CS 2007................................................................................................... 8 Table 3. Distribution of women of reproductive ages by parity and age, CS 2007………….................................................................................................................... 9 List of Figures Figure 1. Average parities by age group of woman, 1996–2007 .................................... 10 Figure 2. P/F ratios by population group and age ........................................................... 12 Figure 3. Observed relative age-specific fertility rates by population group, 2006.......... 13 Figure 4. Total fertility rate by population group, 2006.................................................... 17 Figure 5. Total fertility rate (TFR) by province, 2006....................................................... 17 Figure 6. Total fertility rate (TFR) by District Council, 2006 ............................................ 19 List of Appendices Table A 1. Percentage distribution of the population of South Africa by type of imputation applied to age data and province of residence, CS 2007.............................. 21 Table A 2. Summary table for UN age-sex accuracy scores for total population and population groups, South Africa, 2007* .................................................. 22 Table A 3. Estimates of TFR (observed and adjusted) and P/F...................................... 23 Table A 4. Age-specific P/F ratios pertaining to the period between Census 2001 and CS 2007: population group and province........................................................ 25 Figure A 1. Comparison of age distributions of women (aged 15–49 years) by type of parity data............................................................................................................ 26 Figure A 2. Distribution of women in reproductive ages by population group and type of parity data..................................................................................................... 27 Figure A 3. Comparison of provincial distributions of women by type of parity data.............. ................................................................................................................... 28 Figure A 4. Distribution of women (aged 15–49 years) by type of parity data and completed education level........................................................................................ 29

vii
Preface Statistics South Africa (Stats SA) has, in the recent past, engaged in a massive capacity-building programme for its human resources. As a result, the organisation has sent (and continues to send) a number of its staff members to several institutions within South Africa and internationally to acquire advanced training in, among others, Statistics, Demography and Economics. Through this exercise, the organisation is gradually increasing its pool of highly trained analysts, with competences and skills in diverse areas, to facilitate internal in-depth thematic analysis of the data that it collects through censuses and surveys. Among others, the in-depth analyses of Stats SA data by Stats SA staff enables the organisation to: (1) have deeper understanding of all the data it collects; (2) identify other relevant aspects of the life of the people of South Africa that need to be addressed through data collection; (3) obtain information needed to improve on the methodologies and tools currently used for data collection in the organisation; and (4) provide relevant information for national and sub-national planning purposes. The present monograph on fertility of South Africa is proof that the capacity-building exercise is beginning to bear fruits as it is part of a series of other in-depth analyses currently underway in Stats SA. Among these studies is the second volume on the Demography of South Africa which will be published in late 2010 or early 2011. The current monograph uses data from the 2007 Community Survey (CS) to provide the latest evidence on the levels, differentials and trends in fertility in the country. Its greatest contribution is that, for the first time, fertility estimates are available at the district municipality level — a clear indication that the analysis of fertility has gone beyond disaggregation by population group and province. Stats SA expects that the valuable information presented in this monograph becomes essential inputs for planning in the 52 district and metropolitan municipalities of South Africa. In addition, the organisation believes that methodology and the results presented in this study will generate further debate and research regarding the emerging trends in fertility. PJ Lehohla Statistician-General

viii
Executive summary South Africa has hitherto not achieved complete reporting of births. As a result, estimates of the level of fertility are derived from census/survey data by employing indirect demographic estimation techniques. This monograph uses CS data to examine the recent patterns in the levels, differentials and trends in fertility behaviour in the country. One of the main objectives of the monograph is estimation of fertility levels for district municipalities of South Africa using the aforementioned dataset. Being the first survey to allow for demographic estimation up to the municipality level of the geographical hierarchy of the country, and due to its design and large sample size, the CS provides the opportunity to derive these estimates. Existing studies based on the 1996 and 2001 censuses have not estimated fertility levels below the provincial level. Regrettably, this practice has been a serious handicap for effective local government and private sector planning. The monograph is organised into six sections. Section 1 provides a general introduction of the study. Section 2 provides an extensive review of existing literature on the levels, trends and differentials of fertility in South Africa. The conclusions drawn from this review are as follows: (1) fertility has been declining gradually in South Africa in the past four decades, dropping from a total fertility rate (TFR) of about 6,7 children per woman during the late 1960s to about 2,8 children per woman in 2001; (2) the level of fertility in South Africa is among the lowest in the whole of sub-Saharan Africa; (3) like in other populations, the patterns of fertility differ by socio-economic characteristics (i.e. population group, province, education level of mother, language, etc.) of the population of South Africa. Section 3 of the monograph describes how and why the CS collected fertility data the way it did. The section also examines the quality of the data, and the assessment shows that the data are generally of good quality. Section 4 discusses several indirect methods that could be used to derive estimates of fertility levels from the CS data. The study uses a combination of the Feeney (1998) variant of the P/F ratio method and the Relational Gompertz method to paint a picture about the levels and pattern of fertility in the country. The estimates presented in the results section (section 5) indicate that fertility in South Africa is still on a downward trend and is gradually approaching replacement level. However, huge differentials remain by population group, with the white (TFR = 1,8) and Indian (TFR = 2,0) groups already experiencing below the replacement level fertility, whilst coloureds (TFR = 2,5) and black Africans (TFR = 2,9) remain above the replacement level. With regards to provincial differentials in fertility, the CS data show a pattern similar to those observed in the 1996 and 2001 censuses. Fertility is lowest in the Gauteng and Western Cape provinces and highest in the predominantly rural provinces of Eastern Cape and Limpopo. This pattern also translates to fertility at district level. The data show that fertility is low in metropolitan areas and districts that contain major cities, but high in districts that encompass rural municipalities. Specifically, the estimates indicate that the district municipalities that reported the top five highest TFRs are as follows: OR Tambo district (Eastern Cape) (TFR = 4,1); Greater Sekhukhune district (Limpopo) (TFR = 3,7); Uthukela district (KwaZulu-Natal), Alfred Nzo district (Eastern Cape) and Vhembe district (Limpopo) (all with TFR = 3,6); Zululand district (KwaZulu-Natal) and Capricon district (Limpopo) (TFR = 3,4); and Umzinyathi district (KwaZulu-Natal) (TFR = 3,4). On the other hand, 16 metropolitan and district municipalities reported the lowest five TFRs. These are: Cape Town

ix
Metro (Western Cape), Umgungundlovu district (KwaZulu-Natal), and Sedibeng district (Gauteng) (all with TFR = 2,2); Overberg district (Western Cape), Tshwane and Johannesburg Metros (Gauteng) (all with TFR = 2,3); Eden district (Western Cape), Nelson Mandela Metro (Eastern Cape), and Metsweding district (Gauteng) (all with TFR = 2,4); Cacadu district (Eastern Cape), Namakwa district (Northern Cape), eThekwini Metro (KwaZulu-Natal), and Motheo district (Free State) (all with TFR = 2,5); West Coast and Cape Winelands districts (Western Cape), and Ekurhuleni district (Gauteng) (all with TFR = 2,6). Lastly, the fertility estimates presented in this monograph can be used for different purposes. They could, for example, be used as inputs when projecting the population size of the entire country, provinces and district municipalities. They could also be employed by the national, provincial and local government structures, in partnership with private agencies, to forecast needs for children (and women) such as childcare centres, schools, hospitals, amusement parks, etc. Likewise, this information can be used by private companies that manufacture maternity and baby care products as they expand and distribute their merchandise.


1
1. Introduction This monograph focuses on the analysis of fertility data collected in the 2007 Community Survey (CS) of South Africa to show the recent pattern in the levels, differentials and trends in fertility behaviour in the country. The analysis is disaggregated by population group, province and district municipality. The estimation of fertility levels for district municipalities is the unique contribution of this study into our understating of patterns of fertility in South Africa. Existing major studies (e.g. Udjo, 2005; Moultrie and Dorrington, 2004) have not provided estimates of fertility below the provincial level of the geographic hierarchy of the country, thus potentially limiting the effectiveness of planning, implementation and monitoring of local government projects and programs that are affected by fertility patterns. The report is organised into six sections. The next section (section 2) provides a brief outline of the current trend in the levels and differentials of fertility in South Africa. The third section describes how and why the CS collected fertility data the way it did. The section further examines the quality of the data. The fourth section discusses different methods that could be applied to the data to derive estimates of fertility. This discussion is immediately followed by the results section that presents the estimates of total fertility rate (TFR) by the aforementioned levels of disaggregation. The last section discusses how the estimates fit in the existing trend of fertility levels in South Africa. 2. Overview of levels, trends and differentials of fertility in South Africa The level of fertility in South African is among the lowest in the whole of sub-Saharan Africa (Moultrie & Timæus, 2001 & 2003; Anderson, 2003; Kaufman et al. 2001; Potts & Marks, 2001), and it has been so since the 1960s. Previous studies on the levels and trends of fertility in sub-Saharan Africa (e.g. Kirk & Pillet, 1998; Kalipeni, 1995; Rustein & Blanc, 1994; Thomas & Muvandi, 1994; Cohen, 1993; Freedman & Blanc, 1992; Caldwell et al, 1992; and Cross et al. 1991) heralded three countries (Botswana, Zimbabwe, and Kenya) as the pioneers of the fertility transition that is currently underway in the region. Fertility began to decline in Botswana and Zimbabwe in the 1970s1 while in Kenya the decline was first observed in the 1980s (Anderson, 2003). The TFR of Botswana decreased from 6,8 in 1970 to 3,1 in 2007 (Anderson, 2003; Population Reference Bureau 2007). Zimbabwe’s fertility level dropped from a high of 7,5 children per woman in 1970 to 5,0 in 1995–2000 and 3,8 in 2007, whereas fertility in Kenya declined from a TFR of 8,1 in 1977–1978 to a TFR of 4,4 in 2003 (Population Reference Bureau, 2003; Cross et al. 1991). However, estimates from the Population Reference Bureau (2007) suggest a reversal in the fertility level for the country to a somewhat higher 4,9 children per woman in 2007. The levels and trends of fertility in South Africa remained in obscurity for the most part, because until the mid-1990s, South Africa did not have regular collection of national demographic data. South Africa’s fertility patterns also went unnoticed because of intellectual sanctions against the apartheid policies that were in place in the country prior to the 1990s (Moultrie & Timæus, 2002 & 2001; Sibanda & Zuberi, 1 By 1990, births rates had decreased by about 15-25 percent in Botswana, Zimbabwe, and Kenya. This decrease is far greater than the 10 percent decline that according to (Caldwell et al. 1992) indicates the onset of irreversible fertility transition, which is why the three countries have been viewed as the leaders of fertility transition in sub-Saharan Africa.

2
1999; Caldwell & Caldwell, 1993; Lucas, 1992). Despite the scantiness of reliable data during the apartheid era, recent studies (Udjo, 2005; Anderson, 2003; Timæus 2003 & 2001; Caldwell & Caldwell, 2003; South Africa, Department of Health, 2002; Potts & Marks, 2001; Moultrie & Timæus, 2003 & 2001) have unanimously concluded that fertility decline started as early as the 1960s in South Africa, making the country a leader in the fertility transition observed in sub-Saharan Africa. These studies estimate that the national TFR dropped from a high of 6,7 per woman in the 1960s to about 2,9 to 3,5 per woman during the 1996 to 1998 period. Moultrie & Dorrington (2004) estimated that the country’s TFR further decreased to 2,8 in 2001. Most of the research that has been conducted on the patterns and differentials of fertility in South Africa has focused on the national level. Major explanations of the fertility transition of South Africa have been drawn from the body of literature that focused on the socio-political history of fertility behaviour in the country. The common thesis in these studies is that fertility decline in South Africa was a consequence of the Asian-type population policies that were instituted by the apartheid regime to curb the growth rates of the majority of black population (Moultrie & Timæus, 2001; Kaufman et al. 2001; Kaufman, 2000; Caldwell & Caldwell, 1993; Chimere-Dan, 1993). These population policies, led to a dramatic increase in contraceptive use among the black women of South Africa. Consequently, the decline in national fertility occurred at a rate that was unprecedented in the whole of sub-Saharan region. This happened despite stiff opposition to the population policies from the black political leaders (Kaufman, 2000; Caldwell & Caldwell, 1993; Chimere-Dan, 1993). Studies of fertility differentials in South Africa have mostly focused on racial differences (e.g. Udjo, 2005; South Africa, Department of Health, 2002; Moultrie and Timæus 2002), and regional/provincial differences (e.g. Udjo, 2005; Dorrington et al. 2004). Other studies have examined fertility differentials in the country from the perspective of marital patterns (e.g. Udjo, 2001; Garenne et al. 2000). Still other studies have examined fertility differentials in South Africa by classifying the population into salient, but often ignored, demographic characteristics such as language (e.g. Moultrie & Timæus, 2001; Mencarini, 1999) and migration status (e.g. Thomas, 2004). Studies that have examined fertility differentials in the country from the standpoint of socioeconomic status (SES) have mostly used education (e.g. South Africa, Department of Health, 2002) and urban/rural place of residence (e.g. Sibanda and Zuberi, 2005; South Africa, Department of Health, 2002) as measures of SES. The literature on racial differentials in South Africa generally shows that fertility is high among black Africans and coloureds and low for Indians/Asians and whites. This pattern dates back to the 1950s. For example, (Sibanda & Zuberi, 2005; Anderson, 2003, South Africa, Department of Health, 2002) show that respectively, black African, coloured, Indian/Asian and white women had TFRs of about 6,8; 6,5; 6,7; and 3 to 4 children per woman in 1950. Results from recent analyses show that in the 1996 population census Africans had a TFR of 3,7 children per woman (Udjo, 2005). This level further decreased in the period 1996–1998 to a TFR of 3,1 (South Africa, Department of Health, 2002). Whites had completed their fertility transition in 1998, with a below replacement TFR of 1,9. Coloured and Indian/Asian women had a TFR of 2,5 children per woman in 1998 (South Africa, Department of Health, 2002). The provinces of Limpopo, Eastern Cape and Mpumalanga have been found to have higher fertility levels in South Africa. For example, (Dorrington et al. 2004) using the 1996 population census estimated that the three provinces, respectively, had TFRs of 4,5; 4,3 and 4,0 per woman in 1985. These rates are higher than the TFRs of 2,9 and 3,1 for Gauteng and the Western Cape in the same year. Estimates from the

3
1998 OHS show that fertility was still the highest in the Limpopo province in 1998 (with a TFR of 4,1) and the lowest in the provinces of Gauteng and Western Cape where women were estimated to bear an average of 2,7 children in their lifetime (Udjo 2005). The South African Department of Health obtained similar results using the 1998 South African Demographic and Health Survey (DHS). Huge differences have been reported in fertility levels by SES in South Africa. For instance, evidence from the 1998 South African DHS shows that when SES is measured by maternal education a difference of about three children is found between the TFR of women with no education and the TFR of women with tertiary education (South Africa, Department of Health, 2002). Women with no education had a TFR of 4,5 while those with higher education had a TFR of 1,9. The difference in fertility levels, when SES is represented by the urban and non-urban place of residence was 1,6 children in 1998 with urban women reporting a TFR of 2,8 whereas the corresponding figure for non-urban women was 3,9 (South Africa, Department of Health, 2002). Other results regarding fertility differentials in South Africa indicate that the fertility of migrants (i.e. immigrants and internal migrants) is lower than that of non-migrants (Thomas, 2004) and that among black Africans, fertility is higher for women who speak Nguni languages compared to other languages (Moultrie & Timæus, 2001). In summary, it is clear that despite the discrepancies in the estimates of TFR documented by existing studies, there is an agreement among authors that fertility has been following a downward trend in South Africa since the 1960s. Furthermore, the studies were unanimous in confirming that fertility patterns in the country differ by population group, province of residence, rural/urban place of residence, and level of education. Black Africans and coloureds have comparatively higher fertility levels than their white and Indian/Asian counterparts. Additionally, the relatively poor provinces of Limpopo and Eastern Cape exhibit higher TFRs than other provinces, whilst fertility is lower among urban women compared to their non-urban counterparts. Finally, the generally established inverse relationship between fertility and maternal education is also found in South African data. As indicated earlier, the major omission in the existing studies is the much-needed information on fertility levels and trends for geographical areas that make up provinces such as districts and local municipalities. The relevance of such information as effective input in local government planning cannot be over-emphasised. The purpose of the current study is to initiate interest in small area fertility estimation using data collected from censuses and large household surveys to fill the data needs at these geographic areas. 3. Fertility data collected by the 2007 Community Survey South Africa, like other developing countries, has thus far not attained complete reporting of vital events, hence important demographic parameters such as the TFR are estimated from household surveys or census data. The estimation of fertility measures from these data sources is, however, not without challenges. Direct estimation of fertility levels from survey or census data from developing countries is often impossible because data obtained from questions on current fertility (i.e. births in the last 12 months before enumeration date) are usually fraught with problems. Generally, these data tend to yield lower age-specific fertility rates (ASFR), especially among younger women (Feeney, 1998). This consequently leads to lower estimates

4
of TFR than is the case2. The problem is addressed by employing indirect estimation techniques that involve applying some multipliers (derived from parity data), to adjust the observed ASFRs to arrive at a more reliable approximation of TFR (United Nations, 1983). Firstly, the CS collected the two pieces of information required for indirect estimation of fertility. Parity data were gathered by asking women aged 12–50 years at the time of enumeration what are commonly referred to as Brass-type questions (i.e. questions on parity/total number of children (live births) ever born (CEB), and its components, children surviving (CSurv) and children dead (CDEAD)) 3. Secondly, the CS asked the women to provide the full date (day, month, and year) of their last birth. This information can be used to derive the number of births that occurred within the last 12 months into the survey and hence facilitate the calculation of ASFRs and the TFR. In an attempt to address the problems that were encountered with parity data in the past (e.g. women reporting surviving children as total children ever born (Dorrington et al. 2004)), the CS asked detailed filtering questions for each of the components that constitute the total number of children ever born. Thus, in addition to responses to the question on the total number of live births that a woman had experienced at the time of enumeration, she was also asked to report on the total number of children that are male and those that are female. In addition, the woman was asked to report, by sex of the child, the total number of children that live with her in the household in which she was enumerated and the number living elsewhere. Finally, she was also required to give the total number of her children that had died and disaggregate the number by sex of the children.
3.1 Assessment of data The reliability of ASFRs and consequently TFR estimates obtained from Brass-type questions depends on the quality of reported parities as well as the quality of the data on births in the last 12 months before survey. However, the accuracy of these data also depends on the quality of age reporting among women of reproductive ages (Arriaga, 1994; Retherford & Mirza, 1982). In the next sub-sections, the report examines the quality of age data, parity data and the current fertility data. 3.1.1 Quality of age data in the CS The first cue to the quality of the CS age data can be found in an analysis of the editing rules applied to the raw data4. Table 1 below shows, by population group, the extent of editing by type of editing rule applied to the overall age data (for each 2 Although this is the most common problem with these data, the opposite scenario where the reports yield higher ASFRs than is the case sometimes occurs. 3 Note that the questions collect information only on children born by the woman alive excluding stillbirths, stepchildren and adopted children. Also note that the utility of parity data goes beyond the calculation of the multipliers used to adjust observed ASFRs in survey/census data. Parity data (average children ever born) provide a good picture about lifetime fertility experiences of different cohorts of women. Moreover, information on children ever born can be combined with information on children surviving and children dead to derive estimates of child mortality. 4 During the data editing stage of the CS, Stats SA established an edits specifications committee that was responsible for developing and implementing editing rules for each of the variables contained in the dataset. Five rules were established as follows: (1) No imputation (variables is left as is in the raw data); (2) logical imputation from blank; (3) logical imputation from non-blank; (4) hot deck imputation from blank; and hot deck imputation from non-blank.

5
group) and among women of reproductive ages. Overall, the table shows that the pattern of editing was similar in both the data for women of reproductive ages and in the total population. Table 1. Distribution of all persons and women aged 15–49 years by population group and type of imputation applied to age data, CS 2007 Population Total population
Women in ages (15–49) years
group Type of editing rule Frequency % Frequency % Black African
No imputation 28 676 276 75,9 7 843 284 75,4 Logical imputation from blank 0,0 0,0 0,0 0,0 Logical imputation from non-blank 8 752 707 23,2 2 456 505 23,6 Hot deck imputation from blank 80 351 0,2 21 439 0,2 Hot deck imputation from non-blank 273 742 0,7 75 307 0,7 Total 37 783 076 100,0 10 396 535 100,0Coloured No imputation 3 381 546 78,8 969 502 78,6 Logical imputation from blank 0,0 0,0 0,0 0,0 Logical imputation from non-blank 870 854 20,4 251 956 20,4 Hot deck imputation from blank 14 168 0,3 4 386 0,4 Hot deck imputation from non-blank 22 732 0,5 7 004 0,6 Total 4 289 300 100,0 1 232 848 100,0Indian/ Asian No imputation 917 392 74,5 270 893 75,3 Logical imputation from blank 0,0 0,0 0,0 0,0 Logical imputation from non-blank 302 555 24,6 84 767 23,6 Hot deck imputation from blank 3 593 0,3 1 137 0,3 Hot deck imputation from non-blank 8 637 0,7 3 042 0,9 Total 1 232 177 100,0 359 838 100,0White No imputation 3 475 983 77,7 912 558 77,6 Logical imputation from blank 0,0 0,0 0,0 0,0 Logical imputation from non-blank 972 501 21,7 256 385 21,8 Hot deck imputation from blank 13 622 0,3 4 225 0,4 Hot deck imputation from non-blank 10 685 0,2 3 414 0,3 Total 4 472 791 100,0 1 176 582 100,0South Africa No imputation 36 451 195 76,3 9 996 236 76 Logical imputation from blank 0,0 0,0 0,0 0,0 Logical imputation from non-blank 10 898 617 22,8 3 049 612 23,1 Hot deck imputation from blank 111 734 0,2 31 186 0,2 Hot deck imputation from non-blank 315 797 0,7 88 766 0,7 Total 47 777 343 100,0 13 165 801 100,0
76% of age data were not subjected to any form of editing. 23% of cases were corrected by logical imputation (correcting nonsensical entries in the raw data). The table also shows that 0,2% of the cases had age blank in the raw data and all the

6
blanks were imputed by hot decking. Table 1 further shows that there was less variation by population group in the proportion of cases for which age data were not imputed. The age data for the coloureds (79%), whites (78%), black Africans (76%) and Indians (74%) respectively, did not require any form of imputation because they appeared reasonably correct. Hot deck imputation — combining imputation from both blank and non-blank — was applied to less than one percent of the cases among all the population groups. The data (see Table A1 in the appendix) further show that there was, however, quite a difference in the degree of imputation applied to age data at both provincial and district levels. Proportionately, the largest amount of imputation was applied to data from the Gauteng province where 30% of the cases had age entries corrected by either logical edits or hot decking. The Free State on the other hand experienced the least amount of editing of age data because 84% of its cases had data that did not require any fixing. At district level, data from Kgalagadi district (Northern Cape) were subjected to the least amount of imputation (14% logical imputations from non-blank and about 1% hot deck correction). On the other hand, age data from the West Rand district (Gauteng) were subjected to proportionately more editing (with 45% of the cases corrected by logical edits and 2% by hot decking). The next step is to examine the edited CS data for age reporting errors. Various methods have been developed to assess deficiencies in age data. These include the Whipple’s index, the Myers’ blended index and the United Nation’s age-sex accuracy index. The Whipple’s and Myers’ indexes perform analysis of digit preference in reported single year age distributions whilst the UN age-sex accuracy index provides a picture about the accuracy of age data by combining analysis of age ratios and analysis of sex ratios (Shryock et al. 1976; Arriaga, 1994). This report employs the United Nations’ age-sex accuracy index (Shryock et al. 1976; Arriaga, 1994) to evaluate the quality of age data in the CS. The method was selected because it uses age data (in 5-year age groups) for both sexes and consequently provides an overall evaluation of age and sex data in a population. Although our interest is on the quality of age data for women in reproductive ages, it is an added advantage to know the overall quality of the data in the CS. The index uses sex ratios and age ratio scores (for both sexes) to assign a composite score that shows the relative ranking of the quality of a given age-sex population distribution (Shryock et al. 1976; Arriaga, 1994). The UN classifies population age-sex structures into three categories: 1) accurate – if the index score is less than 20; 2) inaccurate – if the score is between 20 and 40; and 3) highly inaccurate – if the score is above 40. The results from the UN age-sex accuracy index indicate that the CS age data are of good quality, with an index score of 18,8 (see Table A2 in the appendices). However, the quality of the data differs by population group, with Africans scoring the poorest (index score of 23,3) and the coloured population scoring the best with a score of 7, 85. It is worth noting here that the superior quality of age data for the coloured population as shown by the UN age-sex accuracy index is in line with the observation made in table 1 that age data for this group were subjected to proportionately the least amount of editing.
5 An in-depth analysis of whether or not the observed CS age-sex distribution of the population conforms to the expected pattern based on available information from the 1996 and 2001 censuses is beyond the scope of this monograph; the current paper only examines the quality of age-sex reporting.

7
3.1.2 Quality of parity data The report follows a five-step approach in evaluating the quality of the parity data collected in the CS. As in the case of age data, the report firstly examines the magnitude of editing that was applied to the raw data. Secondly, the quality of the data is ascertained by examining their internal consistency. The third approach involves checking the distribution of women by reported children ever born, looking for implausible figures in the reports. Specifically, the report checks for the reported numbers of CEB that are physiologically not possible or not consistent with what is known about fertility behaviour in South Africa. The fourth assessment of the CEB data involves an evaluation of the pattern of average parities6 by age of mother and consistency checks in the reported average parities in CS and other datasets, to determine whether cohorts of women reported consistent numbers of CEB. This type of evaluation is, however, suited for the terminal ages of the reproductive life span because less childbearing occurs in those ages. The final assessment employs the diagnostic properties of the P/F (Parity/Fertility) ratio method (Brass et al. 1968) to evaluate the accuracy of parity data in relation to current fertility data in the CS. Type of editing rules applied The editing rules outlined in Table 1 were not applied to parity data (CEB, CSurv, and CDEAD). This is because the CS edits specification team resolved that fertility data should not be subjected to hot deck imputation, instead, they should only be corrected by logical editing rules. However, the team did not apply logical edits to the data. Thus, the decision on how to correct illogical entries is left to individual researchers. Only one imputation procedure that did not necessarily correct erroneous entries was applied to the data. Specifically, the parity data were constrained to a maximum of 16 children. All entries that had values of 17 and above in either of the components of parity data were re-coded to 97 to highlight that they are highly unlikely considering that women in South Africa start childbearing at a relatively later age — for instance, the mean age at first birth is about 21 years (Sibanda & Zuberi, 2005). Moreover, parities of this magnitude are above the highest reliable record of CEB (Bongaarts & Potter, 1983). Table 2 shows that 0,2% of the women aged 15–49 had their parity data recoded to 977. Further examination of the data using the images of the questionnaires that contain these cases shows that they were mostly generated by scanner recognition problems8, e.g. 03 read as 73 or 23. Lastly, although it is a generally held belief, based on El-badry’s (1961) observation that the most common error in the collection of parity data is to misclassify women of zero-parity as women with missing parity data due to interviewer recording errors, the data obtained from imputation flags indicate that this error did not occur with the CS data. 6 Typically, average parities should increase with age (United Nations 1983). However, omission of some children in the reports of CEB may result in a pattern that differs from the expected. 7 There is no case where the entries for CEB, CSurv and CDEAD are all recoded to 97. This is because the rule was applied in a manner that only the affected entry (i.e. entry with a value above 16) was recoded to 97 and the unaffected ones were left as they are in the data. 8 Stats SA used scanners to read entries from questionnaires into an electronic data file. The scanned images of the questionnaires were stored to facilitate verification of the data.

8
Internal consistency Table 2 shows that 93,7% of the women of childbearing ages gave internally consistent9 answers for the different components of the parity data. 6,1% of the women, however, gave inconsistent responses or their information was miscoded during data processing. These are the cases that require logical editing to reconcile the information. As already indicated above, 0,2% of the women had their responses recoded to 97 mainly because the scanner misread the entries in the original questionnaires. Table 2. Distribution of women by quality of responses provided in the parity schedule of the CS 2007
Frequency
Type of responses reported/recorded Weighted Unweighted PercentageInternally consistent 12 341 967 247 137 93,7Not internally consistent 794 499 15 876 6,1Recoded to 97 29 335 582 0,2Total 13 165 801 263 595 100,0
Looking at Table 2 in the context of the objective of estimating the level of fertility in South Africa using the CS, it is prudent to ask the following question about the distribution of women by the quality of their parity data: Are the women with internally consistent responses representative of the national population of women in childbearing ages and can their data be used to derive reliable fertility estimates? The answer to this question can be drawn from an analysis of the composition of this group by age, population group, province and other socio-economic variables such as education. Figures A1–A4 in the appendix show the results of these analyses. The graphs suggest that the women with internally consistent data are representative of the total population and their data could be used to derive reliable national, provincial and racial estimates of fertility. Distribution of women by age and parity Table 3 shows the distribution, by age group and reported CEB, of all women in childbearing ages and of women with internally consistent fertility data. Overall, the table shows that the CS parity data are of good quality. For instance, as expected, the proportion of childless women decreases with age (from 89% in the youngest age group to 11% in the oldest age group). However, the table also shows evidence of dubious age-specific reporting of CEB. For instance, about 3500 (or 0,1%) of the women in the age group 15–19 reported having given birth to three children and above. Additionally, some women in the age group 20–24 reported up to ten children ever born. While the aforementioned parities are possible with multiple births, they are highly unlikely. However, the available data do not allow for tests for the validity of these figures because the CS does not have information on multiple births.
9 Consistent in this case means: Total children ever-born (TCEB) = children surviving and staying in same household with woman (CSurvH) + children surviving but living elsewhere (CSurvA) + children dead (CDEAD). This definition also takes into account congruence in the distribution of the sexes of the children.

9
Table 3. Distribution of women of reproductive ages by parity and age, CS 2007
Total children ever born: All women
Age
0 1 2 3 4 5 6 7 8 9 10 11 12 13 14 15&16 97
Total
15–19 2 177 156 278 939 28 889 2 765 1 017 320 312 185 33 158 159 83 0 16 0 0 102 2 490 134
20–24 1 242 721 839 885 253 311 43 486 7 101 1 744 316 374 325 86 127 177 0 16 0 0 147 2 389 814
25–29 587 515 716 869 474 559 164 712 44 313 9 283 1 972 628 685 145 67 0 99 0 42 0 265 2 001 153
30–34 318 049 451 377 549 697 306 140 133 391 48 940 17 454 5 964 2 241 633 160 60 60 114 0 0 644 1 834 924
35–39 192 545 251 572 467 843 349 987 203 971 100 999 45 758 21 706 10 741 3 613 1 703 445 122 166 63 119 415 1 651 766
40–44 142 816 172 030 348 586 318 204 218 705 138 924 80 669 46 507 23 976 10 483 5 849 2 146 883 578 324 170 298 1 511 149
45–49 130 987 128 864 265 405 259 507 186 487 123 445 83 736 48 636 28 484 14 838 9 151 3 973 1 730 538 541 171 370 1 286 861
Total 4 791 789 2 839 537 2 388 290 1 444 800 794 983 423 654 230 217 124 000 66 485 29 955 17 216 6 883 2 894 1 428 970 460 2 239 13 165 801
Note: parities 15 and 16 are combined to save space
Total children ever born: Women with internally consistent parity data
Age
0 1 2 3 4 5 6 7 8 9 10 11 12 13 14 15 16
Total
15–19 2 168 588 251 077 25 889 2 295 814 233 151 0 0 0 0 0 0 0 0 0 0 2 449 047
20–24 1 228 988 766 934 234 989 39 256 6 532 1 605 163 47 55 0 29 0 0 0 0 0 0 2 278 597
25–29 574 375 655 972 440 534 149 911 40 358 7 978 1 722 436 286 0 0 0 0 0 0 0 0 1 871 572
30–34 304 475 413 923 511 063 280 353 121 867 44 213 16 219 5 338 1 619 444 63 60 0 0 0 0 0 1 699 636
35–39 182 461 228 266 435 534 318 283 186 357 90 637 41 001 19 039 9 060 2 807 1 407 302 101 0 55 0 0 1 515 310
40–44 133 408 155 253 322 154 288 006 199 366 122 458 71 182 40 351 20 958 8 593 4 966 1 966 790 359 259 66 0 1 370 137
45–49 123 714 116 064 242 221 231 505 167 290 109 732 74 160 42 701 24 690 12 455 7 498 3 292 1 420 438 370 101 16 1 157 667
Total 4 716 008 2 587 489 2 212 385 1 309 609 722 585 376 856 204 599 107 912 56 668 24 300 13 963 5 620 2 311 797 684 167 16 12 341 966

10
Consistency check of average parities in CS This part of evaluation involves an assessment of consistency in the reported average parities, to ascertain whether cohorts of women reported consistent numbers of CEB over time. It requires that the CS data are compared with data from other sources and, as earlier mentioned, is suited for the terminal ages of the reproductive life span because less child bearing occurs in those ages. Figure 1 compares the average parities by age group of women in reproductive ages in the CS with corresponding average parities in the 1996 and 2001 censuses. Figure 1. Average parities by age group of woman, 1996–2007
2.95
3.20
3.23
0.0
0.5
1.0
1.5
2.0
2.5
3.0
3.5
4.0
15-19 20-24 25-29 30-34 35-39 40-44 45-49
Age group
Ave
rage
par
ity
Census 1996 Census 2001 CS 2007 Note: The average parities for the 1996 and 2001 censuses were calculated from the 30% micro data
samples of the censuses. These data are archived in the African Census Analysis Project (ACAP), University of Pennsylvania.
Overall, the graph indicates that the CS average parities are in the expected direction when evaluated in concert with what was observed in the 1996 and 2001 censuses. As expected when the data are of good quality, all three data sources show average parities that increase rapidly with age. Furthermore, the graph shows that the CS data are consistent with the two censuses when focusing on the parity of cohorts of women over time. For instance, the expected gradual increase in average parity for the women that were aged 35–39 years in 1996, from 2,95 to 3,20 in 2001 and 3,23 in 2006, respectively. Lastly, the average parities shown in Figure 1 suggest a decline in fertility between 1996 and 2007. This trend is commensurate with what is known about the current trend of fertility in South Africa. Patterns of the P/F ratios observed in the CS In addition to it being a technique for estimating TFR, the (Brass, 1968) P/F ratio method can also be employed as a diagnostic tool in the evaluation of fertility data

11
obtained in a survey or census (Chahnazarian, 1993; Rutenberg & Diamond, 1993; Hobcraft, Goldman & Chidambaram, 1982; Trussell & Hill, 1980). The method assumes that fertility has been constant in recent years, and errors in the data on current births are not correlated with the age of the mother. In the application of the method, mean parity equivalents (Fis)10 are estimated and compared with reported mean parities (Pis). The P/F ratios by age serve as indicators of the consistency and accuracy of the two sets of data. The application of the technique in the evaluation of CS data brings to light the following issues about the quality of the data:
• Except in the age range of 15–24 years, the P/F ratios increase with the ages of mothers. This pattern applies for all population groups, except among the white population, which show large fluctuations in P/F ratios (see Figure 2). The pattern also applies to all provinces and the majority of districts (data not shown). It signifies two scenarios. Firstly, it implies an error of underreporting of current fertility relative to lifetime fertility11. Secondly, the pattern suggests a declining fertility trend in South Africa in the recent past. As shown earlier in the analysis of average parities, the latter version of the interpretation of the P/F ratios gets credence in that it fits well with the trend in fertility as obtained in the 1996 and 2001 censuses.
• The P/F ratio for women aged 25–29 years falls below one, nationally and
among African women, thus suggesting more complete reporting of current fertility in this age range relative to lifetime fertility. This pattern also holds for the majority of districts and provinces.
10 The average parity equivalents are estimated by interpolation using the observed period age-specific fertility rates f(i) and cumulated fertility values Ø(i) as follows:
)1()()1()( +++−= ibfiafiiF φ (1) where a and b are multipliers developed by Coale and Trussel (1974) and their values can be obtained from (United Nations 1983). 11 Theoretically, the observed pattern could also imply over-reporting of CEB relative to current fertility due to adoption effect, especially among older women.

12
Figure 2. P/F ratios by population group and age
0.0
0.2
0.4
0.6
0.8
1.0
1.2
1.4
1.6
1.8
15-19 20-24 25-29 30-34 35-39 40-44 45-49
Age
Rat
io
Total pop. African Coloured Indian White 3.1.3 Quality of data on births in the last 12 months before enumeration Earlier it was mentioned that the CS did not directly ask women to give the number of births they had experienced during the twelve months that preceded enumeration. Instead, women were asked to provide the dates of birth of their last live births. This approach sought to address the known problem that women (especially younger ones) tend to underreport births when responding to the question on births during the 12 months prior to a survey/census. The data on dates of last births are, however, also not immune to errors. It is likely, for example, that women bias their responses by systematic timing error when reporting on the dates of their last births (Trussell & Hill, 1980). Thus, births reported as having occurred in the last year may in fact have occurred during a period much longer or much shorter than 12 months. However, it is difficult to conclude about the net direction of the errors by merely looking at the data. The monograph below briefly evaluates the CS data, focusing on the observed patterns of ASFRs. It uses the 12-month period encompassed by 15 February 2006 and 15 February 2007 as reference12. Accordingly, all births that occurred during the reference period are used to calculate ASFRs and the TFR. The observed ASFRs Overall, the patterns of the ASFRs obtained from the data on the date of the last birth look plausible and suggest that the CS could be used to derive credible fertility estimates at the national level, by province, district municipality and by population group. Figure 3 shows relative ASFRs (i.e. with total fertility rate equal to one) for the total population and the four main population groups of South Africa. With the
12 Data collection for the CS commenced in mid-February and concluded in early March 2007 (Statistics South Africa 2007).

13
exception of a probable slight underreporting of current fertility among white women in the age group of 20–24 years, the graph shows fertility schedules that are consistent with what is known about fertility behaviours of the four population groups in the country. The fertility schedules for Indians and whites imply late childbearing concentrated in a narrow age range and consequently lower fertility compared to the schedules for black Africans and coloureds. The shapes of ASFRs observed for provinces (data not shown here) also look plausible, with the Western Cape and Gauteng provinces exhibiting late and low fertility schedules whilst the North West, Limpopo and Eastern Cape provinces show schedules that are characteristic of high fertility populations. Lastly, whereas the shapes of ASFRs observed for a majority of districts follow the traditional pattern (inverted V-shape as shown in Figure 3), a few districts exhibit ASFRs that deviate from the standard shape. Figure 3. Observed relative age-specific fertility rates by population group, 2006
0.000
0.050
0.100
0.150
0.200
0.250
0.300
0.350
0.400
15-19 20-24 25-29 30-34 35-39 40-44 45-49
Age-group
Rel
ativ
e ag
e-sp
ecifi
c fe
rtili
ty ra
te
Total pop. African Coloured Indian White 3.1.4 Conclusion of the assessment of fertility data obtained from the CS In light of the preceding evaluation of the quality of different aspects of fertility data collected in the CS, including the assessment of the overall quality of age data in the survey, the following conclusions were made:
• the shape(s) of the current fertility schedule(s) obtained in the CS suggest that the data are of good quality; and

14
• the data exhibit an error of underreporting of current fertility of unknown magnitude because it occurred in the presence of an established trend of declining fertility.
4. Methods that could be used to estimate fertility levels from the CS-type of data Several techniques could be employed to indirectly estimate fertility levels from parity and current fertility data as obtained in the CS. The main techniques are discussed below: 4.1 The P/F ratio method Earlier it was mentioned that data on births in the last 12 months before a survey/census usually yield lower ASFRs, especially among younger women. This consequently leads to lower estimates of TFR than is the case. Likewise, information on children ever born is frequently distorted by omission of some children (e.g. dead children or children that left parental home), especially among older women. The P/F ratio method combines information on current fertility (which gives the pattern of child bearing) with information on lifetime fertility (which provides an indication of the level of fertility) in order to preserve the advantages of both aspects of fertility data when estimating TFR (Trussell & Hill, 1980). The thrust of the procedure is the adjustment of observed ASFRs to match the level of fertility implied by the average parities of women aged below 35 years13. In its widely publicised version (United Nations, 1973), the method uses the average of P/F ratios for women aged 20–24, 25– 29 and 30–34 years as the adjustment factor. However, this adjustment factor only applies when the observed P/F ratios in the age range of 20–29 years show a consistent pattern. If the pattern of the ratios is not consistent, thus suggesting the presence of fertility trends or errors in the data, the United Nations (1983) prescribes that a weighted average of (P2)/(F2) and (P3)/(F3) should be used as an adjustment factor, with the weights being the number of women in each age group as a proportion of the women in both age groups. The P/F ratio method is based on the following assumptions: (1) fertility has been constant in the recent past; (2) the level of underreporting of births in the year prior to the census/survey does not vary by age; (3) data on CEB for younger women (up to 35 years of age) are more completely reported than births in the previous year (Feeney, 1998; United Nations, 1983); and (4) age misreporting among women of childbearing ages is negligible. The assumptions do not quite hold in the current South African situation. For instance, the crucial assumption of constancy of fertility in the period immediately before a census/survey data collection is not true for the country’s population. Several studies (e.g. Udjo, 2005; Dorrington et al. 2004; Anderson, 2003) have shown that fertility has been declining in the country since the 1960s. This trend is corroborated by the average parities shown in Figure 1, which indicate that fertility continued to decline during the period 1996–2006. The violation of this assumption necessitates that the method should be modified before it is applied to the South African situation.
13 The reporting of parity data is assumed to be accurate among young women (aged 20–34 years)

15
Some refinements to the method have been proposed. These include: (1) the Feeney (1998) approach; and (2) the Synthetic cohort P/F ratio method.
The Feeney variant of the P/F ratio method Feeney (1998) relaxes the assumptions made by the original Brass method and prescribes that the P/F ratio corresponding with the mean age of child bearing (MAC) for a given fertility schedule should be used as an adjustment factor, regardless of whether fertility in the population represented by the schedule has been constant or not. However, the calculations of P/F ratios corresponding to MAC for different sub-population groups in the CS indicate that the method cannot be used to adjust the observed ASFRs for the total population and Africans because the ratios fall below unity for these groups. As earlier mentioned, P/F ratios below one imply that current births are more completely reported compared to lifetime fertility, thus making it pointless to use the ratios to adjust the observed ASFRs. Further assessment of the ratios suggests that the Feeney method can be used to estimate fertility for the coloured, Indian and white population groups. At provincial level, it seems the Feeney approach can be applied with confidence to data for Gauteng, Limpopo and Mpumalanga, whereas at district level it can be employed to less than a third of all districts.
The Synthetic cohort P/F ratio method The synthetic cohort approach circumvents the problems associated with the violation of the assumption of constancy in fertility trends by allowing for computation of average parities that refer to the fertility experience during a particular period and comparing those parities with cumulated average fertility rates measured during the same period (United Nations, 1983). This approach requires two surveys or censuses that are five or ten years apart. Application of the method to the period covered by Census 2001 and the CS yields ratios that imply that once the effect of fertility trend is removed for the period, recent births are more completely reported compared to lifetime fertility. This pattern is observed among all population groups and provinces (see Table A4 in appendix). This effectively means that the method cannot be used to adjust the ASFRs obtained from the CS. 4.2 The Arriaga Method Unlike the P/F ratio method, the Arriaga (1983) method does not make the assumption of constancy of fertility in the period preceding a survey/census. Based on a simulation model, Arriaga (1994) shows that under conditions of declining fertility, the number of children ever born by age of mother changes linearly for mothers under 35 years of age. This observation and the fact that parity reports for women under 35 years of age are usually of good quality, allow for linear interpolation of the data on children ever born per woman by age of mother from two or more censuses/surveys to derive estimates of children ever born for one year prior (or posterior) to the date of the census/survey (Arriaga, 1994). Thus, having information on the average number of children ever born per woman by age of mother for two consecutive years, the cohort differences between them for each single year of age of the female population represent ASFRs by single year of age.

16
The method is affected by misreporting of children in older ages. However, as with the P/F ratio method, if an age pattern of fertility is available, such a pattern can be adjusted to the fertility level implied by the fertility rates derived from the information on children ever born. The Arriaga method is not considered in this study because it requires data from at least two data sources, yet it is highly sensitive to differences in the completeness of reporting of children ever born between the data sources used. This is particularly important in the context of the present study because the application of the method in deriving fertility estimates from the CS would entail combining Census 2001 and CS data. Since survey data are frequently of better quality than census data, it is most likely that the method would yield distorted estimates and an incorrect fertility trend. Moreover, as earlier indicated, the analysis of Census 2001 data suggested that there may have been problems with the children ever born data (i.e. a large proportion of women reporting their surviving children as total children ever born (Dorrington et al. 2004)). This may possibly have an impact on estimates of TFR using the Arriaga method. 4.3 The Relational Gompertz Method The method fits a Gompertz function to data on average number of children ever born or ASFRs, by age of women. The advantage of the method is that it provides estimates of TFR based on each 5-year age group in childbearing ages, which allows for inferences about trends in the level of fertility (Arriaga, 1994). Another attractive property of the Relational Gompertz method is that it is flexible enough to fit good data well but bad data badly (Udjo 2009). The main limitations of the method include: (1) the results obtained by applying the method are highly sensitive to errors in the reported numbers of children ever born by women; (2) estimates based on data for women aged 15–19 years are not reliable because data for these ages are sensitive to information errors; (3) the method is only well suited for populations with medium to high fertility (Paget &Timæus, 1994; Booth, 1984). 4.4 Methods used to estimate TFR in this study Given the preceding discussion of the assumptions, strengths and limitations of different approaches that could be employed to estimate fertility levels from the CS data, the present study opts to use a combination of the Feeney variant of the P/F ratio method and the relational Gompertz method. The following principles are adopted :
• If the P/F ratio at MAC for a given sub-population group is above one and the unadjusted (observed) TFR is low — below replacement fertility level (2,1 children per woman) — the study applies the Feeney approach to adjust the observed ASFRs and estimate TFR.
• If the P/F ratio at MAC is below unity, the study applies the relational
Gompertz method.

17
5. Results Figure 4 shows a national TFR of 2,8 in 2006, marking a slight decline from an estimate of 2,84 obtained from the 2001 Population Census. This estimate places the fertility level for South Africa among the lowest in the whole of sub-Saharan Africa and indicates that the fertility decline that started in South Africa in the 1960s — Udjo, 2005, 2003, 1998; Moultrie & Timæus, 2002; Sibanda & Zuberi, 1999 — continues gradually to this day, and is getting close to replacement fertility level. Figure 4. Total fertility rate by population group, 2006
2.9
2.5
1.8
2.0
2.8
0
1
2
3
African Coloured White Indian National
Population group
TFR
As shown in Figure 4, the national TFR masks the diversity that exists in the country, with respect to fertility behaviour among its four main population groups. Africans (TFR = 2,9) and coloureds (TFR = 2,5) remain above the replacement fertility level whilst Indians and whites reproduce well below the replacement level. It is also worth noting from Figure 4 that the fertility rate for the black African population had fallen below 3 children per woman in 2006. In the 2001 and 1996 censuses this group reported TFRs in excess of 3 — see for example, Dorrington et al. 2005 and Udjo, 2005. The diversity in fertility behaviour also manifests geographically. Figures 5 and 6 present estimates of TFR by province and district council municipalities, respectively.
The data show that in 2006, as was the case in 1996 and 2001, the TFR was lowest in the Western Cape (2,1) and the Gauteng (2,2) provinces and highest in Limpopo (3,5). Four provinces, (i.e. Eastern Cape, Mpumalanga, North West and KwaZulu-Natal) had TFRs of 3,0 children per woman, respectively. This pattern is not unexpected. It is in line with demographic explanations that postulate low fertility with

18
higher levels of economic development. The Western Cape and Gauteng are the most economically advanced provinces in the country, whereas the Eastern Cape and Limpopo are among the most underdeveloped. Figure 5. Total fertility rate (TFR) by province, 2006
2.12.2
2.72.8
3.0 3.0 3.0 3.0
3.5
0
1
2
3
4
WesternCape
Gauteng Free State NorthernCape
KwaZulu-Natal
North West EasternCape
Mpumalanga Limpopo
Province
TFR
Figure 6 and Table A3 in the appendix show the spatial variation of fertility at the level of district municipality in South Africa in 2006. The data show that fertility was highest in OR Tambo district, Eastern Cape (TFR = 4,1) and lowest in the City of Cape Town Metro, (Western Cape) Umgungundlovu district (KwaZulu-Natal) and Sedibeng district (Gauteng) (all with TFR = 2,2). Other district municipalities that reported the top five highest TFRs include: Greater Sekhukhune district (Limpopo) (TFR = 3,7), Uthukela district (KwaZulu-Natal), Alfred Nzo district (Eastern Cape) and Vhembe district (Limpopo) (all with TFR = 3,6), Zululand district (KwaZulu-Natal) and Capricon district (Limpopo) (TFR = 3,4) and Umzinyathi district (KwaZulu-Natal) (TFR = 3,4). On the other hand, the metropolitan and district municipalities that reported the lowest five TFRs include: Overberg district (Western Cape), Tshwane and Johannesburg Metros (Gauteng) (all with TFR = 2,3), Eden district (Western Cape), Nelson Mandela Metro (Eastern Cape) and Metsweding district (Gauteng) (all with TFR = 2,4), Cacadu district (Eastern Cape) Namakwa district (Northern Cape) eThekwini Metro (KwaZulu-Natal) and Motheo district (Free State) (all with TFR = 2,5), West Coast and Cape Winelands districts (Western Cape) and Ekurhuleni district (Gauteng) (all with TFR = 2,6). The district level analysis further shows that the country was predominantly characterised by districts with TFRs below three children per woman in 2006. This pattern is in line with the estimates of fertility levels by population group and province. Quite a few districts, clustered in Eastern Cape, Limpopo, KwaZulu-Natal and parts of Northern Cape and North West, reported TFRs above 3.

19
Figure 6. Total fertility rate (TFR) by District Council, 2006
Additionally, the data presented in Figure 6 indicate that all five metropolitan municipalities of South Africa (City of Johannesburg, City of Cape Town, Nelson Mandela Bay, eThekwini and the City of Tshwane) had low fertility rates relative to the rest of the country in 2006. As mentioned earlier, this pattern fits well with the development-fertility nexus. 6. Discussion and conclusion South Africa has hitherto not achieved complete reporting of births. As a result, estimates of the level of fertility are derived from census/survey data by employing indirect demographic estimation techniques. One of the main objectives of this monograph was to estimate the level of TFR for district municipalities of South Africa using the 2007 CS. Being the first survey to allow for demographic estimation up to the municipality level of the geographical hierarchy of the country, due to its design and large sample size, the CS provides the opportunity to derive these estimates. Existing studies based on the 1996 and 2001 censuses have not estimated fertility levels below the provincial level. This practice has been a serious handicap for effective local government and private sector planning.

20
However, the estimation of fertility levels in this study was not without challenges. The main problem encountered was the fact that none of the major demographic methods for estimating fertility from CS-type of data fits the data well. The assumptions are either violated or the method is just not suitable for the stage in which South Africa is at with regards to fertility transition. Despite this deficiency the study was able to use a combination of the Feeney (1998) variant of the P/F ratio method and the Relational Gompertz method to paint a picture about the levels and pattern of fertility in the country. The estimates indicate that the level of fertility in South Africa is among the lowest in the whole of sub-Saharan Africa. Furthermore, the estimates suggest that fertility in South Africa is still on a downward trend and is gradually approaching replacement level. Although huge differentials remain by population group, with the white and Indian groups already experiencing below replacement level fertility whilst coloureds and black Africans remain above, it is worth noting that the two groups (coloureds and black Africans) have also attained fertility levels below three children per woman. Concerning provincial differentials in fertility, the CS data show a pattern similar to those observed in the 1996 and 2001 censuses. Fertility is lowest in the Gauteng and Western Cape provinces and highest in the predominantly rural provinces of Eastern Cape and Limpopo. This pattern also translates to fertility at district level. The data show that fertility is low in metropolitan areas and districts that contain major cities, but high in districts that encompass rural municipalities. Despite the fact that the CS estimates of total fertility fit with the trend observed in previous studies based on the 1996 and 2001 censuses, it is worth mentioning that the whole TFR series does not provide a complete picture about the trend in women’s reproductive choices and behaviour. It only tells us about changes in the numbers of children born, not about the timing and spacing of births throughout a woman’s reproductive career. Nevertheless, the total fertility estimates presented in this monograph can be used for different purposes. For example, they could be used as inputs in population projections. They could also be employed by the national, provincial and local government structures, in partnership with private agencies, to forecast needs for children (and women) such as for childcare centres, schools, hospitals, amusement parks, etc. Likewise, this information can be used by private companies that manufacture maternity and baby care products as they expand and market their merchandise.

21
Appendices Table A 1. Percentage distribution of the population of South Africa by type of imputation applied to age data and province of residence, CS 2007
Province No
imputation
Logical imputation from blank
Hot deck imputation from blank
Hot deck
imputation from non-
blank
Total Western Cape 78,1 21,0 0,3 0,5 100,0 Eastern Cape 76,6 22,6 0,3 0,5 100,0 Northern Cape 80,5 19,0 0.1 0,4 100,0 Free State 83,7 15,9 0,2 0,2 100,0 KwaZulu-Natal 75,1 23,5 0,2 1,2 100,0 North West 83,0 16,4 0,1 0,4 100,0 Gauteng 70,4 28,6 0,4 0,5 100,0 Mpumalanga 77,5 22,0 0,1 0,5 100,0 Limpopo 78,3 21,0 0,2 0,4 100,0

22
Table A 2. Summary table for UN age-sex accuracy scores for total population and population groups, South Africa, 2007* Population group Index score Total population Sex ratio score 4,0 Age ratio score (Male) 4,1 Age ratio score (Female) 2,9 Age-sex accuracy index 18,8African Sex ratio score 4,9 Age ratio score (Male) 5,2 Age ratio score (Female) 3,8 Age-sex accuracy index 23,3Coloured Sex ratio score 3,0 Age ratio score (Male) 3,1 Age ratio score (Female) 3,1 Age-sex accuracy index 7,8Indian Sex ratio score 8,4 Age ratio score (Male) 5,2 Age ratio score (Female) 6,5 Age-sex accuracy index 16,0White Sex ratio score 4,7 Age ratio score (Male) 6,5 Age ratio score (Female) 5,4 Age-sex accuracy index 16,4
Note: * = estimates adjusted for sample size Source: Author’s calculations from the CS

23
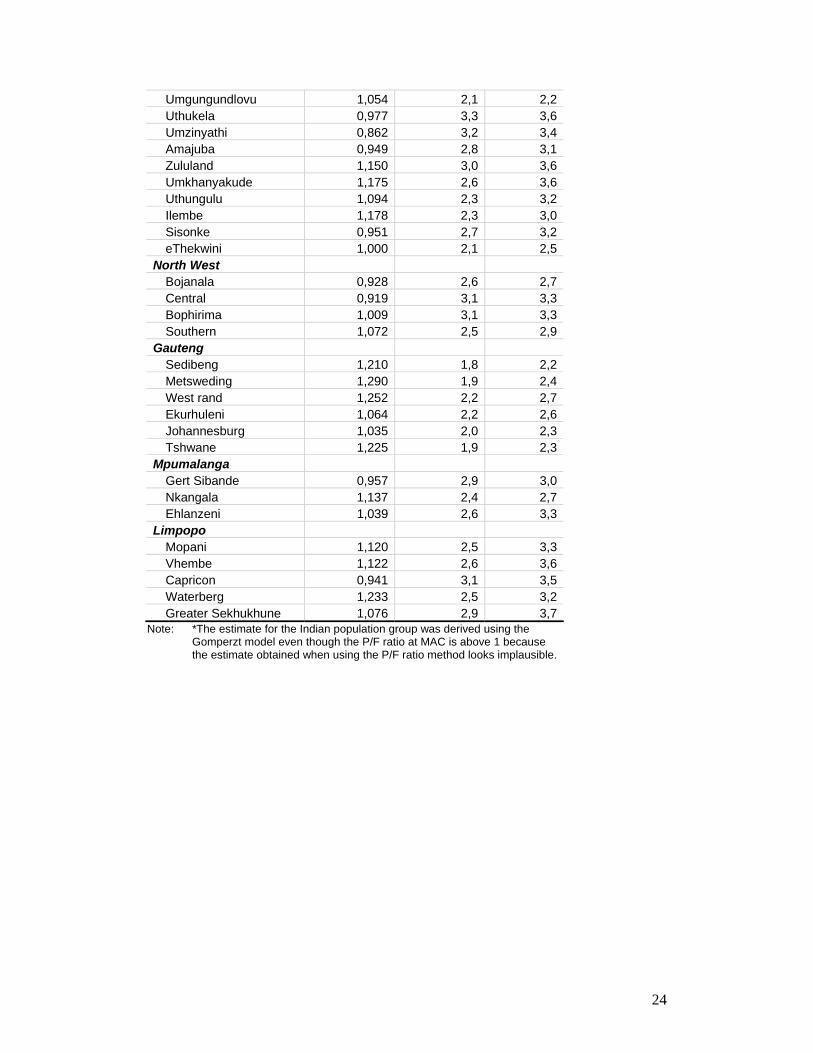
Table A 3. Estimates of TFR (observed and adjusted) and P/F ratio at mean age of child bearing (MAC) obtained from the CS: national, population group, province and district municipalities
P/F ratio at
MACObserved
TFRAdjusted
TFRNational 1,001 2,4 2,8 African 0,989 2,5 2,9 Coloured 1,063 2,3 2,5 Indian* 1,286 1,3 2,0 White 1,256 1,4 1,8Province Western Cape 1,008 2,1 2,1 Eastern Cape 1,111 2,7 3,0 Northern Cape 0,965 2,6 2,8 Free State 1,028 2,5 2,7 KwaZulu-Natal 1,020 2,4 3,0 North West 0,962 2,7 3,0 Gauteng 0,888 2,0 2,2 Mpumalanga 1,037 2,6 3,0 Limpopo 1,075 2,8 3,5District Western Cape
West Coast 1,045 2,4 2,6Cape Winelands 1,125 2,2 2,6Overberg 1,153 2,0 2,3Eden 0,750 2,4 2,4Central Karoo 1,272 2,4 2,7Cape Town 0,999 2,1 2,2
Eastern Cape Cacadu 0,826 2,3 2,5Amatole 0,846 2,4 2,7Chris Hani 0,812 3,1 3,3Ukhahlamba 0,820 2,9 2,9OR Tambo 1,001 3,4 4,1Alfred Nzo 0,914 3,2 3,6Nelson Mandela Metro 0,940 2,1 2,4
Northern Cape Namakwa 1,245 2,0 2,5Pixley ka Seme 0,881 2,8 3,0Siyanda 1,032 2,7 2,9Frances Baard 1,070 2,4 2,7Kgalagadi 1,013 3,2 3,3
Free State Xhariep 0,925 2,7 3,1Motheo 0,977 2,4 2,5Lejweleputswa 0,982 2,5 2,8Thabo Mofutsanyane 0,902 2,6 2,8Fezile Dabi 1,042 2,4 2,7
KwaZulu-Natal Ugu 1,075 2,5 2,7
24
Umgungundlovu 1,054 2,1 2,2Uthukela 0,977 3,3 3,6Umzinyathi 0,862 3,2 3,4Amajuba 0,949 2,8 3,1Zululand 1,150 3,0 3,6Umkhanyakude 1,175 2,6 3,6Uthungulu 1,094 2,3 3,2Ilembe 1,178 2,3 3,0Sisonke 0,951 2,7 3,2eThekwini 1,000 2,1 2,5
North West Bojanala 0,928 2,6 2,7Central 0,919 3,1 3,3Bophirima 1,009 3,1 3,3Southern 1,072 2,5 2,9
Gauteng Sedibeng 1,210 1,8 2,2Metsweding 1,290 1,9 2,4West rand 1,252 2,2 2,7Ekurhuleni 1,064 2,2 2,6Johannesburg 1,035 2,0 2,3Tshwane 1,225 1,9 2,3
Mpumalanga Gert Sibande 0,957 2,9 3,0Nkangala 1,137 2,4 2,7Ehlanzeni 1,039 2,6 3,3
Limpopo Mopani 1,120 2,5 3,3Vhembe 1,122 2,6 3,6Capricon 0,941 3,1 3,5Waterberg 1,233 2,5 3,2Greater Sekhukhune 1,076 2,9 3,7
Note: *The estimate for the Indian population group was derived using the Gomperzt model even though the P/F ratio at MAC is above 1 because the estimate obtained when using the P/F ratio method looks implausible.

25
Table A 4. Age-specific P/F ratios pertaining to the period between Census 2001 and CS 2007: population group and province
Age group
Population group 15-19 20-24 25-29 30-34 35-39 40-44 45-49 African 0,999 0,950 0,902 0,902 0,907 0,924 0,869 Coloured 0,819 0,786 0,752 0,731 0,692 0,678 0,549 Indian 1,165 0,832 0,822 0,976 0,918 0,751 0,621 White 0,918 1,028 0,945 0,937 0,899 0,863 0,736 Total population 0,988 0,937 0,885 0,879 0,869 0,865 0,785
Age group
Province 15-19 20-24 25-29 30-34 35-39 40-44 45-49 Western Cape 0,867 0,768 0,726 0,706 0,680 0,650 0,518 Eastern Cape 1,086 1,028 0,949 0,938 0,904 0,888 0,807 Northern Cape 0,999 0,991 0,927 0,871 0,824 0,815 0,714 Free State 0,995 0,965 0,949 0,940 0,907 0,921 0,884 KwaZulu-Natal 0,973 0,895 0,857 0,867 0,897 0,896 0,827 North West 1,099 1,077 1,014 0,985 0,990 1,013 0,954 Gauteng 1,023 1,003 0,934 0,927 0,914 0,899 0,804 Mpumalanga 0,986 0,951 0,911 0,894 0,896 0,884 0,836 Limpopo 0,917 0,893 0,879 0,890 0,879 0,928 0,883
• Table A4 shows that the P/F ratios for the period 2001–2007 are generally
below one and decrease with age. This pattern implies that once the trend effect is removed from the data, recent births appear more completely reported compared to lifetime fertility during this period and this pattern is observed among all population groups and provinces. A similar picture is observed at district level (data not presented here) where only a few (9 out of 52) districts show ratios that slightly increase with age.

26
Figure A 1. Comparison of age distributions of women (aged 15–49 years) by type of parity data
0
5
10
15
20
25
15-19 20-24 25-29 30-34 35-39 40-44 45-49
Age group
Perc
ent
llogical Internally consistent All women
• The age distribution of women with internally consistent fertility data is
approximately the same as the age distribution of women in the total population. This suggests that the women with internally consistent data are representative of the total population and their data could be used to derive reliable national estimates of fertility.
• The age distribution of women with incoherent fertility data differs appreciably from the pattern of the total population. The percent distribution of these women increases with age suggesting that erroneous reporting of parity is more pronounced among older women.

27
Figure A 2. Distribution of women in reproductive ages by population group and type of parity data
Women with illogical parity data
2% 7%
9%
82%
Indian White Coloured African
Women with internally consistent parity data
3%9%
9%
79%
Indian White Coloured African All women
3%9%
9%
79%
Indian White Coloured African
• Figure A2 shows that the percent distribution, by population group, of women with internally consistent fertility data is exactly the same as the distribution of all women in the total population. The corresponding distribution among women with inconsistent data is not far-off as well, suggesting that the problem is not randomly distributed by population group.

28
Figure A 3. Comparison of provincial distributions of women by type of parity data
0
5
10
15
20
25
30
35
Gauteng KwaZulu-Natal Eastern Cape Western Cape Limpopo North West Mpumalanga Free State Northern Cape
Perc
ent
Illogical Internally consistent All women
• With the exception of the Gauteng and the KwaZulu-Natal, the data suggest
that there is no systematic provincial pattern in the distribution of women with incoherent fertility data.
• The provincial distribution of women with internally consistent data resembles the national distribution of women in childbearing ages.

29
Figure A 4. Distribution of women (aged 15–49 years) by type of parity data and completed education level
Women with incoherent parity data
2% 7%
11%
17%
21%
42%
Unspecified None Post high Compl. matric Some primary Some high
Women with internally consistent parity data
1% 4%
12%
16%
19%
48%
Unspecified None Post high Some primary Compl. matric Some high
All women
1%
12%
16%
19%
47%
5%
Unspecified None Post high Some primary Compl. matric Some high
• As is the case with racial, provincial and age distributions, Figure A4 indicates that the distribution of women with internally consistent fertility data by education level resembles the distribution of the total population of women in the age group 15–49 years by education level.
• Women with incoherent reporting of parity data tend to be less well educated compared to the total population of women in childbearing ages. The consequence of this picture is that average parities calculated solely on the women with consistent data may potentially be biased downwards. However, since the women with inconsistent data are few, (only 6% of women aged 15– 49 years) the impact of the downward bias is assumed to be negligible.

30
References Anderson B, 2003. Fertility, Poverty and Gender. In Fertility: The Current South African Issues. HSRC Department of Social Development. Available at: www.hsrcpublishers.ac.za (accessed 30 August 2008). Arriaga EE, 1994. Population Analysis with Microcomputers. Volume I. Presentation of Techniques. New York: Bureau of the Census, UNFPA, USAID. Blanc AK and Rustein SO, 1994. The demographic transition in Southern Africa: yet another look at the evidence from Botswana and Zimbabwe. Demography, 31(2): 209–215. Bongaarts J and Potter R G, 1983. Fertility, biology, and behavior: an analysis of the proximate determinants. New York: Academic Press Booth H, 1984. Transforming Gompertz’s Function for Fertility Analysis: The Development of a Standard for the Relational Gompertz Function. Population Studies, 38(3): 495–506. Brass W, 1996. Demographic data analysis in less developed countries. Population Studies. 50(3): 451–467. Brass W, 1996. Uses of census and survey data for the estimation of vital rates. African Seminar on Vital Statistics (Addis Ababa: United Nations Economic Commission for Africa). Caldwell JC and Caldwell P, 2003. The fertility transition in sub-Saharan Africa. In Fertility: the current South African issues. HSRC Department of Social Development. Available at: www.hsrcpublishers.ac.za (accessed 30 August 2008). Caldwell JC and Caldwell P, 1993. The South African fertility decline. Population and Development Review, 19(2): 225–262. Caldwell CJ Orubuloye IO and Caldwell P, 1992. Fertility decline in Africa: a new type of transition. Population and Development Review, 18(2): 211–242. Cohen B, 1993. Fertility levels, differentials and trends. In Foote, Hill and Martin (eds), Demographic Change in sub-Saharan Africa. Washington D.C.; National Academy Press. Chahnazarian A, 1993. The recent fertility rise in Haiti: new trends in favour of marital union. Population: An English Selection, 5. 43–72. Chimere-Dan O, 1993. Population policy in South Africa. Studies in Family Planning, 24(1): 31–39. Coale AJ and Trussel TJ, 1974. Model fertility schedule variations in the age structure of childbearing in human populations. Population Index, 40(2). 185–258. Cross AR, Obungu W. and Kizito P, 1991. Evidence of a Transition to Lower Fertility in Kenya. International Family Planning Perspectives, 17(1): 4–7.

31
Dorrington R, Timæus IM, Moultrie T and Nannan N, 2004. Provincial fertility and mortality in South Africa. Southern African Journal of Demography, 9(2): 27-57. El-Badry, MA, 1961. Failure of enumerators to make entries of zero errors on recording childless cases in population censuses. Journal of the American Statistical Association, 56(296): 909–924. Feeney G, 1998. A New Interpretation of Brass’ P/F Ratio Method Applicable when Fertility is Declining. Available at: www.gfeeney.com (accessed 30 August 2008). Freedman R and Blanc AK, 1992. Fertility transition: an update. International Family Planning Perspectives, 18(2): 44–72. Garenne M, Tollman SM, and Kathleen K, 2000. Premarital fertility in rural South Africa: a challenge to existing population policy. Studies in Family Planning, 31(1): 47–54. Hobcraft, JN, Goldman N and Chidambaram VC, 1982. Advances in the P/F Ratio Method for the Analysis of Birth Histories. Population Studies, 36(2): 291–316. Kalipeni E, 1995. The Fertility Transition in Africa. Geographical Review, 85(3): 286–300. Kaufman E C, de Wet T and Stadler J. 2001. Adolescent pregnancy and parenthood in South Africa. Studies in Family Planning, 32(2): 147–160. Kirk D and Pillet B, 1998. Fertility levels, trends, and differentials in Sub-Saharan Africa in the 1980s and 1990s. Studies in Family Planning, 29(1): 1–22. Lucas D, 1992. Fertility and family planning in Southern and Central Africa. Studies in Family Planning, 23(3): 145–158. Mencarini L, 1999. An analysis of fertility and infant mortality in South Africa based on 1993 LSDS Data. Paper presented at Third African Population Conference, Durban, South Africa, 6–10 December 1999. Union for African Population Studies 1: 109–127. Moultrie TA, 2002. A Future With Fewer Children: Past and Projected Trends in the South African fertility Transition. Paper Presented at the Second Annual Conference on Labour Markets and Poverty in South Africa organised by the Development Policy Research Unit, University of Cape Town, Johannesburg, South Africa, 22–24 October 2002. Available at: http://www.commerce.uct.ac.za/Research_Units/CARE/RESEARCH/Conferencepapers.asp (accessed 30 August 2008) Moultrie TA and Dorrington R, 2004. Estimation of fertility from the 2001 South African Census data. Centre for Actuarial Research, Monograph no. 12: University of Cape Town. Moultrie TA and Timæus IM, 2003. The South African fertility decline: evidence from two Censuses and a Demographic and Health Survey. Population Studies, 57(3): 265–283.

32
Moultrie TA and Timæus IM, 2002. Trends in South African Fertility Between 1970 and 1998: An Analysis of the 1996 Census and The 1998 Demographic and Health Survey. Available at: www.mrc.ac.za/bod/trends.pdf (accessed 12 March 2004). Moultrie TA and Timæus IM, 2001. Fertility and living arrangements in South Africa. Journal of Southern African Studies, 27(2): 207–223. Paget J and Timæus IM. 1994. A Relational Gompertz Model of Male fertility: Development and Assessment. Population Studies, 48(2): 330–340. Population Reference Bureau, 2007. 2007 World Population Data Sheet. Washington D.C.: Population Reference Bureau. Population Reference Bureau, 2003. 2003 World population data sheet. Washington D.C.: Population Reference Bureau. Potts D and Marks S, 2001. Fertility in Southern Africa: the quiet revolution. Journal of Southern African Studies, 27(2): 189–205 Retherford RD and Mirza GM, 1982. Evidence of age exaggeration in demographic estimates for Pakistan. Population Studies, 36(2): 257–70. Rutenberg N and Diamond I, 1993. Fertility in Botswana: the recent decline and future prospects. Demography, 30(2): 143–157. Shryock H Siegel JS and Associates, 1976. The methods and materials in demography. San Diego: Academic Press, INC. Sibanda A and Zuberi T, 1999. Contemporary fertility levels and trends in South Africa: evidence from reconstructed birth histories. Paper Presented at the Third African Population Conference. Durban, South Africa, 6–10 December 1999. South Africa, Department of Health, 2002. South Africa Demographic and Health Survey 1998 – Full Report. Pretoria: Department of Health. Statistics South Africa, 2007. Community Survey 2007. The RDP commitment: what South Africans say. Pretoria: Statistics South Africa. Thomas KJ, 2004. The demography of migrant population in South Africa Unpublished Phd Dissertation. Philadelphia: University of Pennsylvania. Thomas D and Muvandi I, 1994. The demographic transition in Southern Africa: reviewing the evidence from Botswana and Zimbabwe. Demography, 31(2): 217-227 Trussell TJ and Hill K, 1980. Fertility and mortality estimation from the Panama Retrospective Demographic Survey, 1976. Population Studies, 34(3): 551-563. Udjo EO, 2009. Trends in the age pattern of fertility, 1995-2005, in the context of the child support grant in South Africa. Development Southern Africa, 26(2): 289-299. New York: M.E. Sharpe, Inc. Udjo EO, 2005. Fertility levels, differentials, and trends. In Zuberi, Sibanda and Udjo (eds), The Demography of South Africa. New York: M.E. Sharpe, Inc.

33
Udjo EO, 1998. Additional evidence regarding fertility and mortality trends in South Africa and implications for population projections. Pretoria: Statistics South Africa. United Nations, 1983. Manual X: indirect techniques for demographic estimation. New York: Department of International Economic and Social Affairs, United Nations.