estimation of h2o2 gradients across biomembranes
TRANSCRIPT
Estimation of H2O2 gradients across biomembranes
Fernando Antunesa;b;*, Enrique Cadenasa
aDepartment of Molecular Pharmacology and Toxicology, School of Pharmacy, University of Southern California, Los Angeles, CA 90089-9121, USAbGrupo de Bioqu|mica e Biologia Teoricas and Centro de Estudos de Bioqu|mica e Fisiologia, Instituto Bento da Rocha Cabral,
P-1250 Lisbon, Portugal
Received 15 May 2000
Edited by Barry Halliwell
Abstract When cells are exposed to an external source ofH2O2, the rapid enzymatic consumption of H2O2 inside the cellprovides the driving force for the formation of the gradient acrossthe plasma and other subcellular membranes. By using theconcepts of enzyme latency, the following gradients ^ formedafter a few seconds following the exposure to H2O2 ^ wereestimated in Jurkat T-cells : [H2O2]cytosol/[H2O2]peroxisomes = 3;[H2O2]extracellular/[H2O2]cytosol = 7. The procedure presented inthis work can easily be applied to other cell lines and provides aquantitative framework to interpret the data obtained when cellsare exposed to an external source of H2O2. ß 2000 Federationof European Biochemical Societies. Published by ElsevierScience B.V. All rights reserved.
Key words: Hydrogen peroxide; Glutathione peroxidase;Catalase; Steady state; Redox regulation; Jurkat T-cell
1. Introduction
Signal transduction, development, cell proliferation, apo-ptosis, and necrosis, among other processes, are believed tobe regulated by the redox status of the cell [1^4]. H2O2 isoften the oxidant of choice in studies of redox-regulated pro-cesses, because it is continuously produced in aerobic metab-olism and di¡uses easily across cellular compartments [5]. Inspite of the high permeability of H2O2, gradients across mem-branes are indeed formed when a membrane separates theproduction and consumption sites of H2O2. When cells areexposed to external H2O2, the fast consumption of H2O2 in-side the cells provides the driving force for setting up a gra-dient across the plasma membrane (Fig. 1). The intracellularconcentration of H2O2 is lower than the extracellular one and,thus, to establish the actual concentration of H2O2 that isimplicated in the intracellular signaling events, this gradientmust be determined.
One possible strategy to estimate gradients across biomem-branes is based on the well-known fact that enzymes en-trapped in compartments show a lower activity than enzymesfree in solution, an observation brought forward in the early1950s by De Duve and co-workers in their seminal studies onsubcellular fractionation [6]. In general, the reason for enzymelatency is the permeability barrier constituted by the compart-ment entrapping the enzyme, which limits the di¡usion of the
substrate to the enzyme, and not some other factor, such asinhibition of the enzyme when trapped in the compartment.
Cellular H2O2 consumption is largely the domain of cata-lase and glutathione peroxidase; for the former enzyme, sev-eral studies ¢rmly established that the permeability barrier isindeed the cause for the latency observed [6], while for thelatter, as far as we know, no studies on its latency have beencarried out. Under in vivo conditions, both catalase [5] andglutathione peroxidase [7] display ¢rst-order kinetics, notshowing saturation. As such, the gradient between the con-centration of H2O2 inside ([H2O2]in) and outside ([H2O2]out)the cell is independent of the concentration of H2O2 and isgiven by the equation:
�H2O2�in�H2O2�out
� R �1�
where R is the ratio of activity of the ¢rst-order process be-tween intact and disrupted cells [8]. To apply this equation,the consumption of H2O2 by intact cells and the sum of ac-tivities that consume H2O2 in disrupted cells must be deter-mined.
In this work, we revisited the concepts of enzyme latency toestimate the H2O2 gradients produced in Jurkat T-cells ^ acell line widely used in studies of redox regulation ^ uponexposure to an external source of H2O2. The procedure usedcan easily be applied to other cell types, thus constituting ageneral strategy to determine H2O2 gradients.
2. Materials and methods
2.1. Chemicals and biochemicalsCatalase (bovine liver), digitonin, and GSSG reductase (Baker's
yeast) were from Fluka (Buchs, Switzerland). Glucose oxidase andNADPH were from Boehringer (Mannheim, Germany). DTPA,GSH, H2O2, NaN3, and Triton X-100 were from Sigma ChemicalCo. (St. Louis, MO, USA). All other chemicals were of analyticalgrade.
2.2. Cell cultureJurkat cells obtained from ATCC (clone E6-1) were cultured in
complete medium (RPMI 1640 medium supplemented with 10% fetalcalf serum, L-glutamine, and antibiotics from Life Technologies(Rockville, MD, USA). Cells were incubated at 37³C in humidi¢edair with 5% CO2, and kept in logarithmic phase by routine passageevery 2 days. Before use, cells were spun down, resuspended in freshmedium at 1U106 cells/ml, and incubated for at least 1 h. Cell via-bility was determined by propidium iodide uptake.
2.3. Biochemical measurementsH2O2 was measured with an oxygen electrode following the addi-
tion of catalase, which caused a rapid conversion of H2O2 to H2O andO2, the release of the latter being monitored by the oxygen electrode.With a clean and stable electrode, H2O2 concentrations as low as
0014-5793 / 00 / $20.00 ß 2000 Federation of European Biochemical Societies. Published by Elsevier Science B.V. All rights reserved.PII: S 0 0 1 4 - 5 7 9 3 ( 0 0 ) 0 1 6 3 8 - 0
*Corresponding author. Fax: (1)-323-224 7473.E-mail: [email protected]
Abbreviations: GPx, glutathione peroxidase; GSH, glutathione;GSSG, glutathione disul¢de; Ps, permeability coe¤cient
FEBS 23763 8-6-00
FEBS 23763 FEBS Letters 475 (2000) 121^126
5 WM could be measured. A calibration curve was made with H2O2standards before each experiment. Catalase activity was measured aspreviously described [9] in 0.5 M potassium phosphate bu¡er, pH 7.0,containing 0.01% digitonin in the presence of 1U106 cells. H2O2(10 mM initial concentration) consumption was followed at 240 nmat room temperature for 2 min (O240 = 43.4 M31 cm31). Alternatively,catalase activity was measured with a cell lysate. H2O2 concentrationswere plotted on a semi-logarithmic graph against time and the ¢rst-order rate constant (catalase activity) was calculated. Titration ofcatalase activity with digitonin was carried out in a similar manner,but digitonin was added using dimethyl sulfoxide (DMSO) as a ve-hicle (corrections accounting for the slight inhibition of catalase ac-tivity by DMSO at the level added (1% v/v) were considered). Gluta-thione peroxidase (GPx) activity was measured by studying thekinetics of the enzyme in the whole cell applying a well-establishedmethod [10]. The assay mixture contained (¢nal concentrations):10U106 cells/ml, 0.05 M potassium phosphate bu¡er, pH 7.0, 1 mMDTPA, 50 WM NaN3, 1.1 U/ml glutathione reductase, 0.1 mMNADPH, 35 WM H2O2, and 1% (v/v) Triton X-100; the concentrationof GSH varied between 0.335 and 3.35 mM. Alternatively, glutathioneperoxidase activity was measured on a cell lysate without the additionof Triton X-100 to the assay mixture. All reactants, with the exceptionof H2O2, were pre-incubated at 37³C for 10 min. NADPH consump-tion was followed at 340 nm (O= 6.2U103 M31 cm31) at 37³C until allthe hydroperoxide was used, recording the absorbance every 0.1 s.For the kinetic analysis, the part of the curve corresponding to 1.6^16 WM H2O2 was used as suggested [10]. Glucose oxidase activity wasmeasured by following O2 consumption with an oxygen electrode.
3. Results and discussion
3.1. Consumption of H2O2 by intact Jurkat T-cellsThe consumption of H2O2 by intact Jurkat T-cells was
examined by two di¡erent experimental approaches: (a) ex-posure of cells to a bolus addition of H2O2 and (b) exposureof cells to a continuous £ow of H2O2. Neither approach al-tered cell viability during the experiment(s).
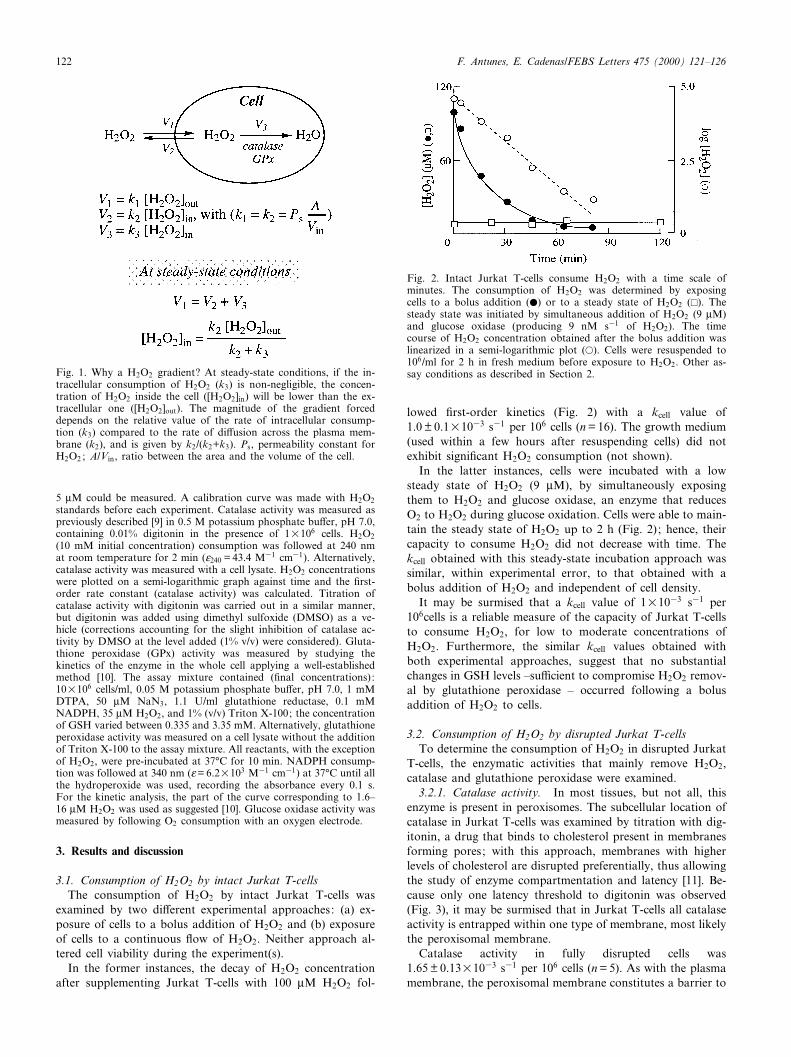
In the former instances, the decay of H2O2 concentrationafter supplementing Jurkat T-cells with 100 WM H2O2 fol-
lowed ¢rst-order kinetics (Fig. 2) with a kcell value of1.0 þ 0.1U1033 s31 per 106 cells (n = 16). The growth medium(used within a few hours after resuspending cells) did notexhibit signi¢cant H2O2 consumption (not shown).
In the latter instances, cells were incubated with a lowsteady state of H2O2 (9 WM), by simultaneously exposingthem to H2O2 and glucose oxidase, an enzyme that reducesO2 to H2O2 during glucose oxidation. Cells were able to main-tain the steady state of H2O2 up to 2 h (Fig. 2); hence, theircapacity to consume H2O2 did not decrease with time. Thekcell obtained with this steady-state incubation approach wassimilar, within experimental error, to that obtained with abolus addition of H2O2 and independent of cell density.
It may be surmised that a kcell value of 1U1033 s31 per106cells is a reliable measure of the capacity of Jurkat T-cellsto consume H2O2, for low to moderate concentrations ofH2O2. Furthermore, the similar kcell values obtained withboth experimental approaches, suggest that no substantialchanges in GSH levels ^su¤cient to compromise H2O2 remov-al by glutathione peroxidase ^ occurred following a bolusaddition of H2O2 to cells.
3.2. Consumption of H2O2 by disrupted Jurkat T-cellsTo determine the consumption of H2O2 in disrupted Jurkat
T-cells, the enzymatic activities that mainly remove H2O2,catalase and glutathione peroxidase were examined.
3.2.1. Catalase activity. In most tissues, but not all, thisenzyme is present in peroxisomes. The subcellular location ofcatalase in Jurkat T-cells was examined by titration with dig-itonin, a drug that binds to cholesterol present in membranesforming pores; with this approach, membranes with higherlevels of cholesterol are disrupted preferentially, thus allowingthe study of enzyme compartmentation and latency [11]. Be-cause only one latency threshold to digitonin was observed(Fig. 3), it may be surmised that in Jurkat T-cells all catalaseactivity is entrapped within one type of membrane, most likelythe peroxisomal membrane.
Catalase activity in fully disrupted cells was1.65 þ 0.13U1033 s31 per 106 cells (n = 5). As with the plasmamembrane, the peroxisomal membrane constitutes a barrier to
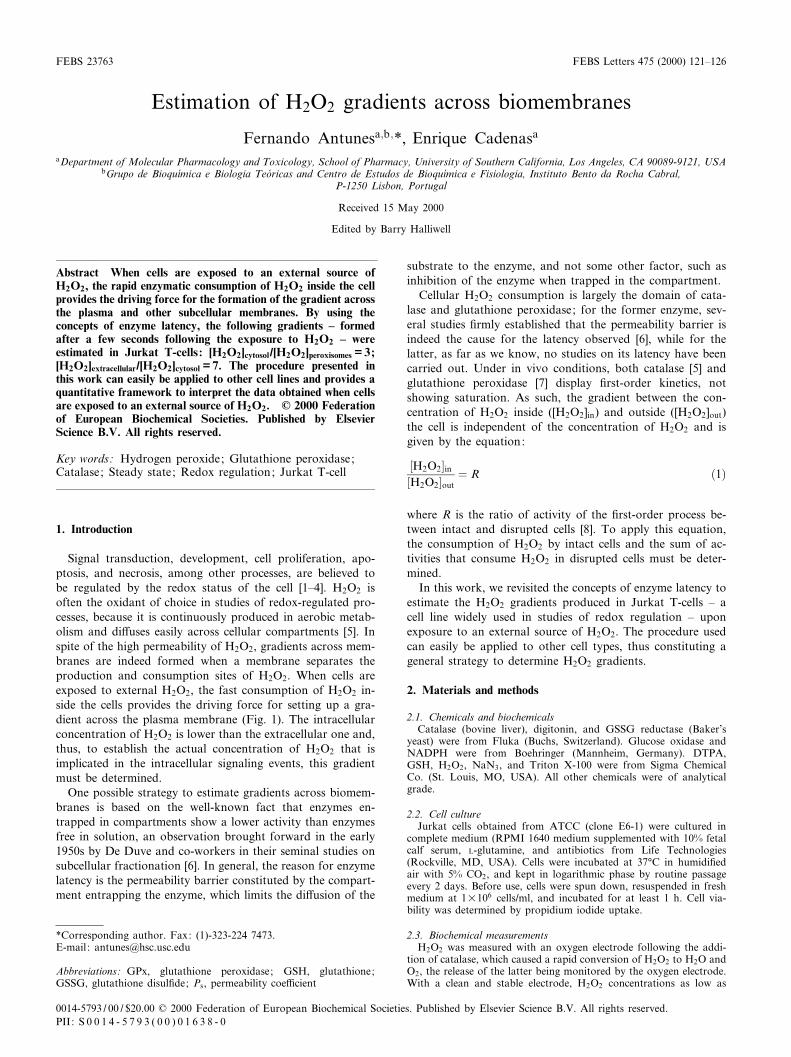
Fig. 1. Why a H2O2 gradient? At steady-state conditions, if the in-tracellular consumption of H2O2 (k3) is non-negligible, the concen-tration of H2O2 inside the cell ([H2O2]in) will be lower than the ex-tracellular one ([H2O2]out). The magnitude of the gradient forceddepends on the relative value of the rate of intracellular consump-tion (k3) compared to the rate of di¡usion across the plasma mem-brane (k2), and is given by k2/(k2+k3). Ps, permeability constant forH2O2 ; A/Vin, ratio between the area and the volume of the cell.
Fig. 2. Intact Jurkat T-cells consume H2O2 with a time scale ofminutes. The consumption of H2O2 was determined by exposingcells to a bolus addition (b) or to a steady state of H2O2 (E). Thesteady state was initiated by simultaneous addition of H2O2 (9 WM)and glucose oxidase (producing 9 nM s31 of H2O2). The timecourse of H2O2 concentration obtained after the bolus addition waslinearized in a semi-logarithmic plot (a). Cells were resuspended to106/ml for 2 h in fresh medium before exposure to H2O2. Other as-say conditions as described in Section 2.
FEBS 23763 8-6-00
F. Antunes, E. Cadenas/FEBS Letters 475 (2000) 121^126122
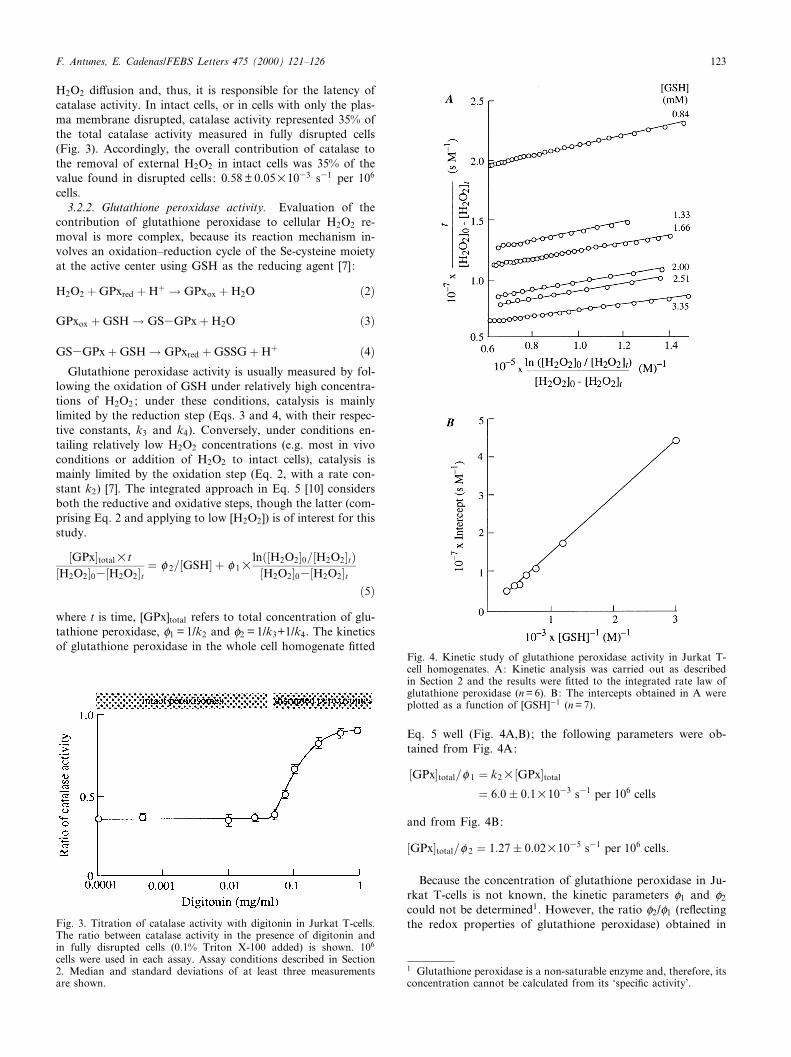
H2O2 di¡usion and, thus, it is responsible for the latency ofcatalase activity. In intact cells, or in cells with only the plas-ma membrane disrupted, catalase activity represented 35% ofthe total catalase activity measured in fully disrupted cells(Fig. 3). Accordingly, the overall contribution of catalase tothe removal of external H2O2 in intact cells was 35% of thevalue found in disrupted cells: 0.58 þ 0.05U1033 s31 per 106
cells.3.2.2. Glutathione peroxidase activity. Evaluation of the
contribution of glutathione peroxidase to cellular H2O2 re-moval is more complex, because its reaction mechanism in-volves an oxidation^reduction cycle of the Se-cysteine moietyat the active center using GSH as the reducing agent [7]:
H2O2 �GPxred �H� ! GPxox �H2O �2�
GPxox �GSH! GS3GPx�H2O �3�
GS3GPx�GSH! GPxred �GSSG�H� �4�Glutathione peroxidase activity is usually measured by fol-
lowing the oxidation of GSH under relatively high concentra-tions of H2O2 ; under these conditions, catalysis is mainlylimited by the reduction step (Eqs. 3 and 4, with their respec-tive constants, k3 and k4). Conversely, under conditions en-tailing relatively low H2O2 concentrations (e.g. most in vivoconditions or addition of H2O2 to intact cells), catalysis ismainly limited by the oxidation step (Eq. 2, with a rate con-stant k2) [7]. The integrated approach in Eq. 5 [10] considersboth the reductive and oxidative steps, though the latter (com-prising Eq. 2 and applying to low [H2O2]) is of interest for thisstudy.
�GPx�totalUt�H2O2�03�H2O2�t � P 2=�GSH� � P 1U
ln��H2O2�0=�H2O2�t��H2O2�03�H2O2�t
�5�where t is time, [GPx]total refers to total concentration of glu-tathione peroxidase, P1 = 1/k2 and P2 = 1/k3+1/k4. The kineticsof glutathione peroxidase in the whole cell homogenate ¢tted
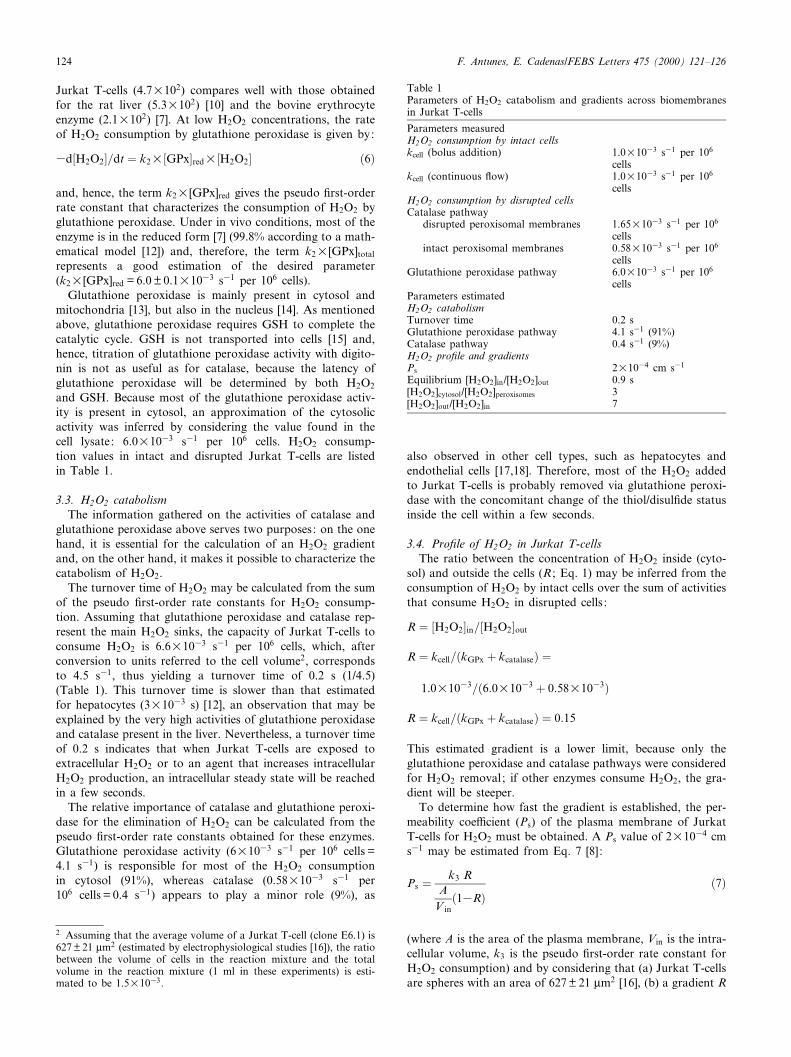
Eq. 5 well (Fig. 4A,B); the following parameters were ob-tained from Fig. 4A:
�GPx�total=P 1 � k2U�GPx�total
� 6:0� 0:1U1033 s31 per 106 cells
and from Fig. 4B:
�GPx�total=P 2 � 1:27� 0:02U1035 s31 per 106 cells:
Because the concentration of glutathione peroxidase in Ju-rkat T-cells is not known, the kinetic parameters P1 and P2
could not be determined1. However, the ratio P2/P1 (re£ectingthe redox properties of glutathione peroxidase) obtained inFig. 3. Titration of catalase activity with digitonin in Jurkat T-cells.
The ratio between catalase activity in the presence of digitonin andin fully disrupted cells (0.1% Triton X-100 added) is shown. 106
cells were used in each assay. Assay conditions described in Section2. Median and standard deviations of at least three measurementsare shown.
Fig. 4. Kinetic study of glutathione peroxidase activity in Jurkat T-cell homogenates. A: Kinetic analysis was carried out as describedin Section 2 and the results were ¢tted to the integrated rate law ofglutathione peroxidase (n = 6). B: The intercepts obtained in A wereplotted as a function of [GSH]31 (n = 7).
1 Glutathione peroxidase is a non-saturable enzyme and, therefore, itsconcentration cannot be calculated from its `speci¢c activity'.
FEBS 23763 8-6-00
F. Antunes, E. Cadenas/FEBS Letters 475 (2000) 121^126 123
Jurkat T-cells (4.7U102) compares well with those obtainedfor the rat liver (5.3U102) [10] and the bovine erythrocyteenzyme (2.1U102) [7]. At low H2O2 concentrations, the rateof H2O2 consumption by glutathione peroxidase is given by:
3d�H2O2�=dt � k2U�GPx�redU�H2O2� �6�
and, hence, the term k2U[GPx]red gives the pseudo ¢rst-orderrate constant that characterizes the consumption of H2O2 byglutathione peroxidase. Under in vivo conditions, most of theenzyme is in the reduced form [7] (99.8% according to a math-ematical model [12]) and, therefore, the term k2U[GPx]total
represents a good estimation of the desired parameter(k2U[GPx]red = 6.0 þ 0.1U1033 s31 per 106 cells).
Glutathione peroxidase is mainly present in cytosol andmitochondria [13], but also in the nucleus [14]. As mentionedabove, glutathione peroxidase requires GSH to complete thecatalytic cycle. GSH is not transported into cells [15] and,hence, titration of glutathione peroxidase activity with digito-nin is not as useful as for catalase, because the latency ofglutathione peroxidase will be determined by both H2O2
and GSH. Because most of the glutathione peroxidase activ-ity is present in cytosol, an approximation of the cytosolicactivity was inferred by considering the value found in thecell lysate: 6.0U1033 s31 per 106 cells. H2O2 consump-tion values in intact and disrupted Jurkat T-cells are listedin Table 1.
3.3. H2O2 catabolismThe information gathered on the activities of catalase and
glutathione peroxidase above serves two purposes: on the onehand, it is essential for the calculation of an H2O2 gradientand, on the other hand, it makes it possible to characterize thecatabolism of H2O2.
The turnover time of H2O2 may be calculated from the sumof the pseudo ¢rst-order rate constants for H2O2 consump-tion. Assuming that glutathione peroxidase and catalase rep-resent the main H2O2 sinks, the capacity of Jurkat T-cells toconsume H2O2 is 6.6U1033 s31 per 106 cells, which, afterconversion to units referred to the cell volume2, correspondsto 4.5 s31, thus yielding a turnover time of 0.2 s (1/4.5)(Table 1). This turnover time is slower than that estimatedfor hepatocytes (3U1033 s) [12], an observation that may beexplained by the very high activities of glutathione peroxidaseand catalase present in the liver. Nevertheless, a turnover timeof 0.2 s indicates that when Jurkat T-cells are exposed toextracellular H2O2 or to an agent that increases intracellularH2O2 production, an intracellular steady state will be reachedin a few seconds.
The relative importance of catalase and glutathione peroxi-dase for the elimination of H2O2 can be calculated from thepseudo ¢rst-order rate constants obtained for these enzymes.Glutathione peroxidase activity (6U1033 s31 per 106 cells =4.1 s31) is responsible for most of the H2O2 consumptionin cytosol (91%), whereas catalase (0.58U1033 s31 per106 cells = 0.4 s31) appears to play a minor role (9%), as
also observed in other cell types, such as hepatocytes andendothelial cells [17,18]. Therefore, most of the H2O2 addedto Jurkat T-cells is probably removed via glutathione peroxi-dase with the concomitant change of the thiol/disul¢de statusinside the cell within a few seconds.
3.4. Pro¢le of H2O2 in Jurkat T-cellsThe ratio between the concentration of H2O2 inside (cyto-
sol) and outside the cells (R ; Eq. 1) may be inferred from theconsumption of H2O2 by intact cells over the sum of activitiesthat consume H2O2 in disrupted cells :
R � �H2O2�in=�H2O2�out
R � kcell=�kGPx � kcatalase� �
1:0U1033=�6:0U1033 � 0:58U1033�
R � kcell=�kGPx � kcatalase� � 0:15
This estimated gradient is a lower limit, because only theglutathione peroxidase and catalase pathways were consideredfor H2O2 removal; if other enzymes consume H2O2, the gra-dient will be steeper.
To determine how fast the gradient is established, the per-meability coe¤cient (Ps) of the plasma membrane of JurkatT-cells for H2O2 must be obtained. A Ps value of 2U1034 cms31 may be estimated from Eq. 7 [8]:
Ps � k3 RA
V in�13R�
�7�
(where A is the area of the plasma membrane, Vin is the intra-cellular volume, k3 is the pseudo ¢rst-order rate constant forH2O2 consumption) and by considering that (a) Jurkat T-cellsare spheres with an area of 627 þ 21 Wm2 [16], (b) a gradient R
Table 1Parameters of H2O2 catabolism and gradients across biomembranesin Jurkat T-cells
Parameters measuredH2O2 consumption by intact cellskcell (bolus addition) 1.0U1033 s31 per 106
cellskcell (continuous £ow) 1.0U1033 s31 per 106
cellsH2O2 consumption by disrupted cellsCatalase pathway
disrupted peroxisomal membranes 1.65U1033 s31 per 106
cellsintact peroxisomal membranes 0.58U1033 s31 per 106
cellsGlutathione peroxidase pathway 6.0U1033 s31 per 106
cellsParameters estimatedH2O2 catabolismTurnover time 0.2 sGlutathione peroxidase pathway 4.1 s31 (91%)Catalase pathway 0.4 s31 (9%)H2O2 pro¢le and gradientsPs 2U1034 cm s31
Equilibrium [H2O2]in/[H2O2]out 0.9 s[H2O2]cytosol/[H2O2]peroxisomes 3[H2O2]out/[H2O2]in 7
2 Assuming that the average volume of a Jurkat T-cell (clone E6.1) is627 þ 21 Wm2 (estimated by electrophysiological studies [16]), the ratiobetween the volume of cells in the reaction mixture and the totalvolume in the reaction mixture (1 ml in these experiments) is esti-mated to be 1.5U1033.
FEBS 23763 8-6-00
F. Antunes, E. Cadenas/FEBS Letters 475 (2000) 121^126124
of 0.15, and (c) a k3 of 4.5 s31. This Ps is smaller than thatobtained for erythrocytes [8] (6U1034 cm s31), which is ex-pected in view of the higher water permeability of erythrocytescompared with other cell types [19] ; in particular, erythrocytesshow a Ps for water that is more than one order of magnitudehigher than those of lymphocytes [20]. For a spherule of thesize of a Jurkat T-cell, a Ps of 2U1034 cm s31 indicates thatthe time scale for the equilibration with H2O2 outside the cellis 0.9 s (Table 1). Therefore, when Jurkat T-cells are exposedto an external source of H2O2, the intracellular componentssense the presence of H2O2 within 1 s. This fast di¡usion ofH2O2 is important for the postulated signaling roles that havebeen attributed to this molecule.
In addition to the gradient across the plasma membrane, agradient is expected across the membrane of cellular organ-elles that consume signi¢cant amounts of H2O2, like peroxi-somes [5] (which contain catalase), nucleus [14], mitochondria[13], and endoplasmic reticulum [13] (all of which containglutathione peroxidase). For peroxisomes, results shown inFig. 3 allow the estimation of the gradient across the peroxi-somal membrane: in fact, the ratio measured between catalaseactivities in intact and in lysed peroxisomes was 0.35, which,according to Eq. 1, is the gradient between cytosolic and per-oxisomal H2O2 concentrations upon incubation with an ex-ternal source of H2O2. H2O2 gradients were not estimated fororganelles containing glutathione peroxidase, but upon expo-sure to an external source of H2O2, the concentration of H2O2
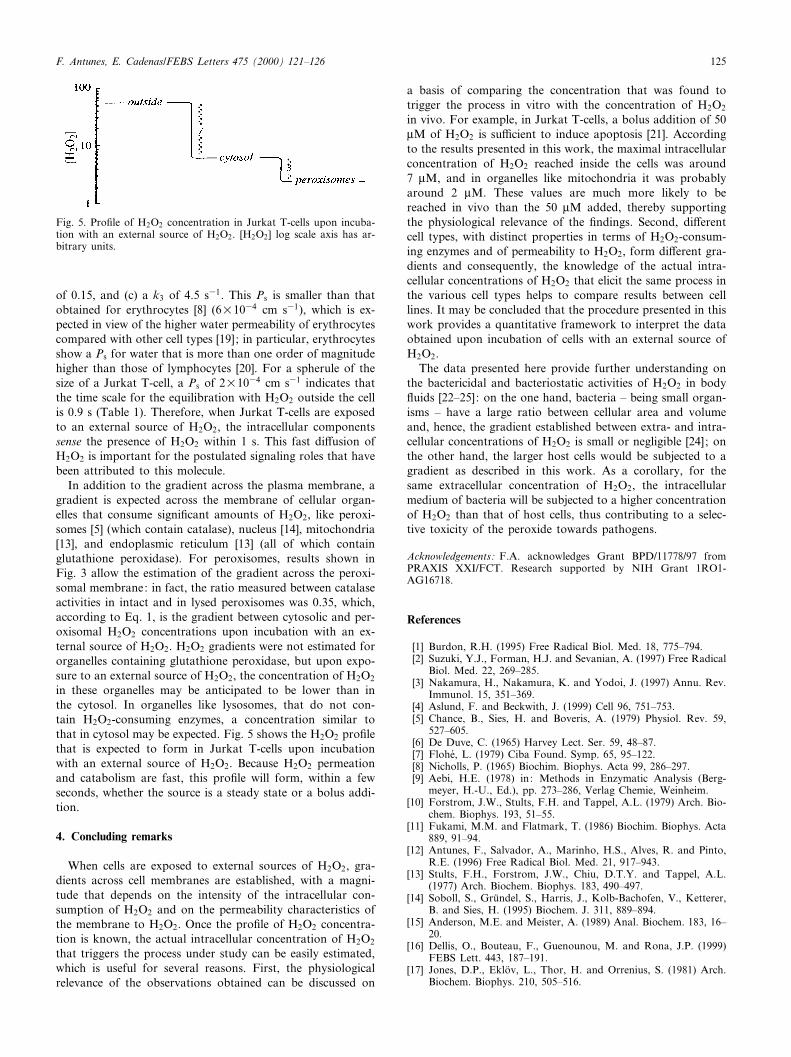
in these organelles may be anticipated to be lower than inthe cytosol. In organelles like lysosomes, that do not con-tain H2O2-consuming enzymes, a concentration similar tothat in cytosol may be expected. Fig. 5 shows the H2O2 pro¢lethat is expected to form in Jurkat T-cells upon incubationwith an external source of H2O2. Because H2O2 permeationand catabolism are fast, this pro¢le will form, within a fewseconds, whether the source is a steady state or a bolus addi-tion.
4. Concluding remarks
When cells are exposed to external sources of H2O2, gra-dients across cell membranes are established, with a magni-tude that depends on the intensity of the intracellular con-sumption of H2O2 and on the permeability characteristics ofthe membrane to H2O2. Once the pro¢le of H2O2 concentra-tion is known, the actual intracellular concentration of H2O2
that triggers the process under study can be easily estimated,which is useful for several reasons. First, the physiologicalrelevance of the observations obtained can be discussed on
a basis of comparing the concentration that was found totrigger the process in vitro with the concentration of H2O2
in vivo. For example, in Jurkat T-cells, a bolus addition of 50WM of H2O2 is su¤cient to induce apoptosis [21]. Accordingto the results presented in this work, the maximal intracellularconcentration of H2O2 reached inside the cells was around7 WM, and in organelles like mitochondria it was probablyaround 2 WM. These values are much more likely to bereached in vivo than the 50 WM added, thereby supportingthe physiological relevance of the ¢ndings. Second, di¡erentcell types, with distinct properties in terms of H2O2-consum-ing enzymes and of permeability to H2O2, form di¡erent gra-dients and consequently, the knowledge of the actual intra-cellular concentrations of H2O2 that elicit the same process inthe various cell types helps to compare results between celllines. It may be concluded that the procedure presented in thiswork provides a quantitative framework to interpret the dataobtained upon incubation of cells with an external source ofH2O2.
The data presented here provide further understanding onthe bactericidal and bacteriostatic activities of H2O2 in body£uids [22^25]: on the one hand, bacteria ^ being small organ-isms ^ have a large ratio between cellular area and volumeand, hence, the gradient established between extra- and intra-cellular concentrations of H2O2 is small or negligible [24] ; onthe other hand, the larger host cells would be subjected to agradient as described in this work. As a corollary, for thesame extracellular concentration of H2O2, the intracellularmedium of bacteria will be subjected to a higher concentrationof H2O2 than that of host cells, thus contributing to a selec-tive toxicity of the peroxide towards pathogens.
Acknowledgements: F.A. acknowledges Grant BPD/11778/97 fromPRAXIS XXI/FCT. Research supported by NIH Grant 1RO1-AG16718.
References
[1] Burdon, R.H. (1995) Free Radical Biol. Med. 18, 775^794.[2] Suzuki, Y.J., Forman, H.J. and Sevanian, A. (1997) Free Radical
Biol. Med. 22, 269^285.[3] Nakamura, H., Nakamura, K. and Yodoi, J. (1997) Annu. Rev.
Immunol. 15, 351^369.[4] Aslund, F. and Beckwith, J. (1999) Cell 96, 751^753.[5] Chance, B., Sies, H. and Boveris, A. (1979) Physiol. Rev. 59,
527^605.[6] De Duve, C. (1965) Harvey Lect. Ser. 59, 48^87.[7] Flohe, L. (1979) Ciba Found. Symp. 65, 95^122.[8] Nicholls, P. (1965) Biochim. Biophys. Acta 99, 286^297.[9] Aebi, H.E. (1978) in: Methods in Enzymatic Analysis (Berg-
meyer, H.-U., Ed.), pp. 273^286, Verlag Chemie, Weinheim.[10] Forstrom, J.W., Stults, F.H. and Tappel, A.L. (1979) Arch. Bio-
chem. Biophys. 193, 51^55.[11] Fukami, M.M. and Flatmark, T. (1986) Biochim. Biophys. Acta
889, 91^94.[12] Antunes, F., Salvador, A., Marinho, H.S., Alves, R. and Pinto,
R.E. (1996) Free Radical Biol. Med. 21, 917^943.[13] Stults, F.H., Forstrom, J.W., Chiu, D.T.Y. and Tappel, A.L.
(1977) Arch. Biochem. Biophys. 183, 490^497.[14] Soboll, S., Gru«ndel, S., Harris, J., Kolb-Bachofen, V., Ketterer,
B. and Sies, H. (1995) Biochem. J. 311, 889^894.[15] Anderson, M.E. and Meister, A. (1989) Anal. Biochem. 183, 16^
20.[16] Dellis, O., Bouteau, F., Guenounou, M. and Rona, J.P. (1999)
FEBS Lett. 443, 187^191.[17] Jones, D.P., Eklo«v, L., Thor, H. and Orrenius, S. (1981) Arch.
Biochem. Biophys. 210, 505^516.
Fig. 5. Pro¢le of H2O2 concentration in Jurkat T-cells upon incuba-tion with an external source of H2O2. [H2O2] log scale axis has ar-bitrary units.
FEBS 23763 8-6-00
F. Antunes, E. Cadenas/FEBS Letters 475 (2000) 121^126 125
[18] Verkerk, A. and Jongkind, J.F. (1992) Free Radical Res. Com-mun. 17, 121^132.
[19] Verkman, A.S. (1989) Am. J. Physiol. 257, C837^C850.[20] Dick, D.A. (1964) J. Theor. Biol. 7, 504^531.[21] Hampton, M.B. and Orrenius, S. (1997) FEBS Lett. 414, 552^
556.[22] Briheim, G., Follin, P., Sandstedt, S. and Dahlgren, C. (1989)
In£ammation 13, 455^464.
[23] Hyslop, P.A., Hinshaw, D.B., Scraufstatter, I.U., Cochrane,C.G., Kunz, S. and Vosbeck, K. (1995) Free Radical Biol.Med. 19, 31^37.
[24] Ma, M. and Eaton, J.W. (1992) Proc. Natl. Acad. Sci. USA 89,7924^7928.
[25] Long, L.H., Evans, P.J. and Halliwell, B. (1999) Biochem. Bio-phys. Res. Commun. 262, 605^609.
FEBS 23763 8-6-00
F. Antunes, E. Cadenas/FEBS Letters 475 (2000) 121^126126