estimation of population parameters in survey...
TRANSCRIPT

1
Chapter-I
Introduction
For a phenomenon that varies over a continuous (or even a large finite) spatial domain, it
is seldom feasible to observe every potential datum of some study variable associated with that
phenomenon. Thus, important parts of statistics are statistical sampling theory as well as design
of experiment where inference about the study variable may be made from a subset or sample of
the population of potential data. The theory of sampling and design of experiment has its origin
way back in the history of mankind. Spatial sampling refers to the sampling of geo-referenced of
spatially labeled phenomena. In the spatial context, interest is usually in the prediction of the
study variable at un-sampled sites. For such purpose, it is necessary to collect information
regarding the population with respect to some characteristics. For example, in agricultural
surveys, to estimate the production of food, the data are collected on some portion of land under
different crops. Most of the government and non-government bodies collect information
regularly about the total population, its geographical distribution, sex, age, age-sex etc. for future
planning. In business, information is also required for the role and character of wholesale, retail
and service traders etc. Given some predictand together with its predictor, a best sampling plan
or network refers to the choice of locations at which to sample the phenomenon in order to
achieve optimally according to a given criterion. In practice, optimal sampling plans may be
extremely difficult to achieve, but atleast good sampling plans may be obtained and designed by
constructing best sampling frame which can be formed by using appropriate technique of design
of experiments.

2
The main objective of the thesis is to construct best design of sample survey and design
of experiments for estimating the parameters of interest and testing the hypothesis under study
respectively. It has been done by developing an appropriate procedure for selecting best sample
from the population and best partially balanced incomplete block designs under the given
constraints. The best estimators and best test statistic have been constructed for estimating the
parameters and testing the hypothesis based on the sample having minimum extraneous
variation.
Design of experiments plays a vital role in statistical research. It includes planning of
experiment, obtaining pertinent information from it regarding the population under study,
making a statistical analysis of the data and drawing valid inferences from it. Proper
consideration of the statistical analysis before conducting the experiment, forces (stimulates) the
experimenter to plan more carefully the design of the experiment. The observations obtained
from a carefully planned and well designed experiment in advance having homogeneous
experimental materials give entirely valid inferences over the treatments under study without
introducing the complexity of design of experiment. But in most of the practical situations,
experimental material (sample) is not homogeneous. Therefore block designs are extensively
used to reduce the heterogeneity among the experimental material. Block designs are used in
many fields of research as these are more practicable. When block size becomes very large (large
number of treatments under study) then the purpose of blocking is defeated as it is sometimes
impracticable to get one complete replicate of units which is relatively homogeneous and as a
result the heterogeneity is introduced in the designed experiment and reduces the discriminating

3
power of the tests of significance. Hence the precision of the block design is adversely affected if
the treatments are large in number. In order to maintain the homogeneity within the blocks, the
experimenter must either cut down the number of treatments which means loss of information
over sacrificed treatments or use an incomplete block design. Therefore, in such situations
incomplete block designs are used because there is no loss of information for using them. That is
why, incomplete block designs are very popular and widely used in agriculture, animal
husbandry and some allied fields. Among the class of binary, equi-replicated, equi-block sized
designs, balanced incomplete block (BIB) designs are the most efficient class of designs. But, it
is difficult to develop BIB designs for all parametric combinations needed for various
experimental situations. So, in such situations, partially balanced incomplete block (PBIB)
designs have been generally used. PBIB designs are based on the concept of association scheme
defined on treatments. First of all, we define terminology used in the thesis.
Population : In a given region at a particular point or period of time, the collection of
identifiable and distinguishable units on which observations can be made or from which the
required statistical information can be ascertained according to a well defined procedure, is
termed as population. Mathematically, a population P is defined as
P = {U1, U2,…, UN}
Where Uj; j = 1, 2,…, N denote the distinguishable and identifiable units of the population.

4
Sample : A sample of size n, selected under some procedure from a given finite population P of
size N, is defined as a finite sequence
s = {Uj1, Uj2,…, Ujn}; j = 1, 2,…, N
of n units.
Sample Space : The collection of all possible samples is generally known as sample space
denoted by S = {s}.
Sampling Design : Let P(s) denotes the probability measure of sample s S. The duplet (S, P(s))
is known as sampling design and is denoted by ps.
Parameter : Let y denotes the real valued variable defined on each unit of the population about
which certain conclusions are to be drawn and Yj ; j = 1, 2,…, N denote the value of variable y
on the jth
unit of the population. Any function of Y1, Y2,…,YN is known as a population
parameter or simply a parameter. For example, the customary parameters of interest in survey
sampling are :
Population Total =
N
j
j YY1
Population Mean =
N
j
j YYN 1
1
Population Variance =
N
j
yj YYN 1
221
Population Coefficient of Variation = y
yC
Y
, etc.

5
Statistic and Estimator : Any function of sample values of variable y, independent of unknown
parameters, is known as statistic. A statistic used for estimating the parameter of interest is
termed as an estimator of that parameter.
Sampling Strategy : Let ts be an estimator of parameter under any sampling design ps. The
duplet (ps , ts) is known as sampling strategy for estimating . The mean square error for
sampling strategy (ps , ts) is denoted by MSE(ps , ts) or MSE(ts) and is defined as:
2, spss tEtpMSE
s
Where, spE denotes the expectation under sampling design sp .
A sampling strategy (ps, ts (1)
) for estimating is said to be better than any other
sampling strategy (ps, ts (2)
) for estimating if
21
ss tMSEtMSE
The efficiency of sampling strategy (ps , ts(1)
) over the sampling strategy (ps , ts(2)
) for
estimating is defined as
1
2
s
s
tMSE
tMSEE
6
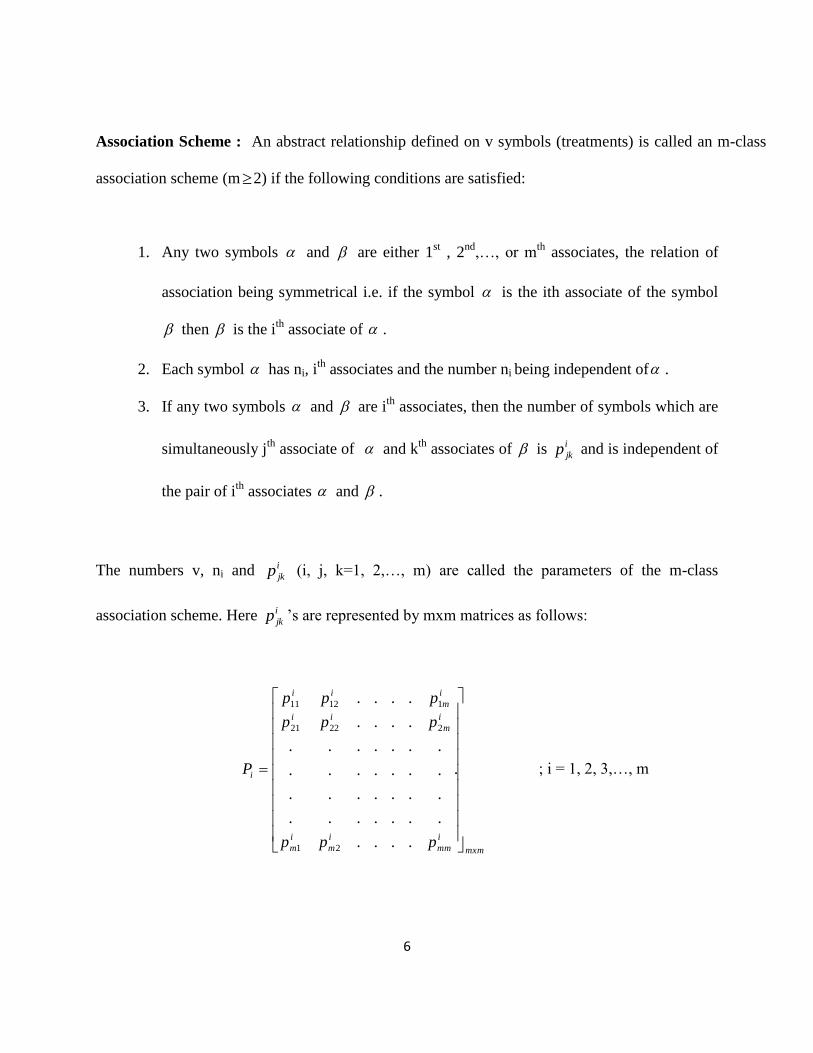
Association Scheme : An abstract relationship defined on v symbols (treatments) is called an m-class
association scheme (m2) if the following conditions are satisfied:
1. Any two symbols and are either 1st , 2
nd,…, or m
th associates, the relation of
association being symmetrical i.e. if the symbol is the ith associate of the symbol
then is the ith
associate of .
2. Each symbol has ni, ith
associates and the number ni being independent of .
3. If any two symbols and are ith
associates, then the number of symbols which are
simultaneously jth
associate of and kth
associates of is i
jkp and is independent of
the pair of ith
associates and .
The numbers v, ni and i
jkp (i, j, k=1, 2,…, m) are called the parameters of the m-class
association scheme. Here i
jkp ‟s are represented by mxm matrices as follows:
mxm
i
mm
i
m
i
m
i
m
ii
i
m
ii
i
ppp
ppp
ppp
P
.
....
.......
.......
.......
.......
....
....
21
22221
11211
; i = 1, 2, 3,…, m

7
i
kj
i
jk pp was taken a part of the definition of the association scheme till Bose and Mesner
(1959) showed that the condition was redundant. For a given association scheme for v symbols
(treatments), Bose and Mesner (1959) defined PBIB designs as follows:
If we have an association scheme with m associate classes and given parameters , then a
PBIB design with m associate classes is obtained if the v symbols (treatments) are arranged into
b sets (blocks) of size k (k<v) such that
1. Every symbol occurs at the most once in a set (block).
2. Every symbol occurs in exactly r sets (blocks).
3. If two symbols and are ith
associates, then they occur together in
i blocks or sets, the number i being independent of the particular pair of ith
associates and .
Conventionally all the numbers v, b, r, k, i (i = 1, 2,…, m) are called the parameters of
the design. If every symbol is taken as its 0th
associates, then
no = 1, ijiij np 0 , ik
i
kp 0 , o = r,
Where ij is defined as
, when i = j
, otherwise
The following relations between parameters of the association scheme and of the PBIB
designs are well known [Ch. Raghavarao (1971) p. 123-124]:
0
1ij
8
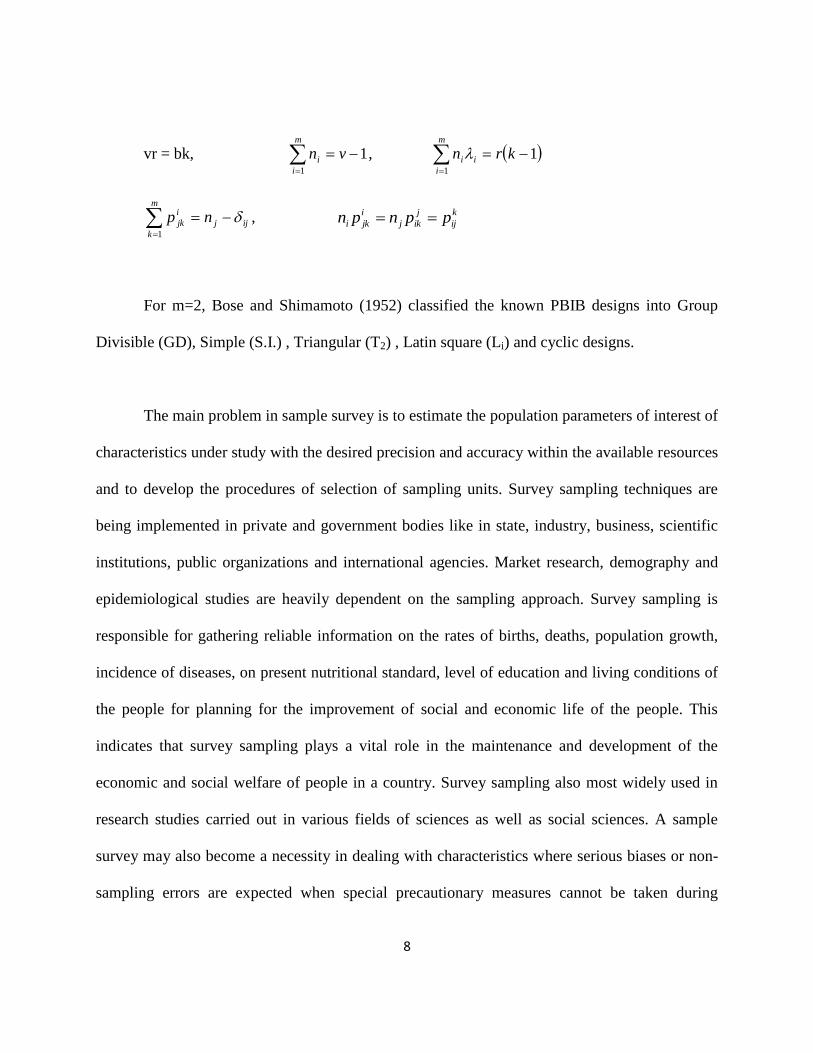
vr = bk, 11
vnm
i
i , 11
krn i
m
i
i
ijj
m
k
i
jk np 1
, k
ij
j
ikj
i
jki ppnpn
For m=2, Bose and Shimamoto (1952) classified the known PBIB designs into Group
Divisible (GD), Simple (S.I.) , Triangular (T2) , Latin square (Li) and cyclic designs.
The main problem in sample survey is to estimate the population parameters of interest of
characteristics under study with the desired precision and accuracy within the available resources
and to develop the procedures of selection of sampling units. Survey sampling techniques are
being implemented in private and government bodies like in state, industry, business, scientific
institutions, public organizations and international agencies. Market research, demography and
epidemiological studies are heavily dependent on the sampling approach. Survey sampling is
responsible for gathering reliable information on the rates of births, deaths, population growth,
incidence of diseases, on present nutritional standard, level of education and living conditions of
the people for planning for the improvement of social and economic life of the people. This
indicates that survey sampling plays a vital role in the maintenance and development of the
economic and social welfare of people in a country. Survey sampling also most widely used in
research studies carried out in various fields of sciences as well as social sciences. A sample
survey may also become a necessity in dealing with characteristics where serious biases or non-
sampling errors are expected when special precautionary measures cannot be taken during
9
collection and tabulation of data. Sampling theory plays a very important role to develop the test
statistic for testing the hypothesis.
Just as in sampling theory where the interest lies in finding out the estimators (statistic) of
interest based upon the sample selected, the main interest in design of experiment is to find out
the best possible combination of treatments under the given conditions so that we may be able to
get a group of treatments which is significantly effective as compared to any other set of
treatments over a predetermined experimental area. In 1920, Fisher introduced the concept of
design of experiment in which he was able to get a set of treatments which is significantly
effective under the condition that the experimental units are relatively homogeneous, which gave
rise to the concept of completely randomized design (CRD). The condition of homogeneity is not
usually justified except in some type of laboratory experiments. To overcome this problem, first
a randomized complete block design (RCBD) and later on, latin square designs (LSD) were
introduced. These are actually the designs in which blocking is complete in the sense that all
treatments under investigation occur in each block of RBD and in each row and column of LSD.
When the number of treatments under study is large then the size of the block/row/column
increases, as a result, variation enters among the experimental units of block/row/column.
Obviously, experimental units within a block will not remain relatively homogeneous. So, we
have already explained that partially balanced incomplete block designs are generally used in
such situations.
10
In most of the survey sampling situations, we may have information on more than one
variable defined on each unit of the population, which may be highly correlated with each other.
Suppose one of them is a variable under study y and information on other variables, termed as
auxiliary variables. The information on auxiliary variables may be available in one form or the
other or can be made available by diverting a part of the survey resources at a moderate cost. For
example, in many repetitive surveys, the value of the same variable on a previous occasion say
last census is usually taken as the values of auxiliary variable. In such situations, it is a widely
accepted phenomenon that the efficiency of usual estimators of population parameter of interest
can be increased by utilizing judiciously such information of auxiliary variables. In whatever
form of the information, on auxiliary variable(s) is available, one may always utilize it to devise
sampling strategies which are better than those in which no auxiliary information is used. In
survey sampling, as per established facts, the information on auxiliary variables may be utilized
at the following three stages:
i. At the stage of planning or designing of the survey i.e. in stratifying the population.
ii. At the stage of sample selection i.e. in selecting the units for the sample by the use of
unequal probabilities sampling with probability proportional to some measure of size
of the units based on auxiliary variables
iii. At the stage of estimation i.e. in the use of ordinary ratio, product, difference and
regression estimators etc.
11
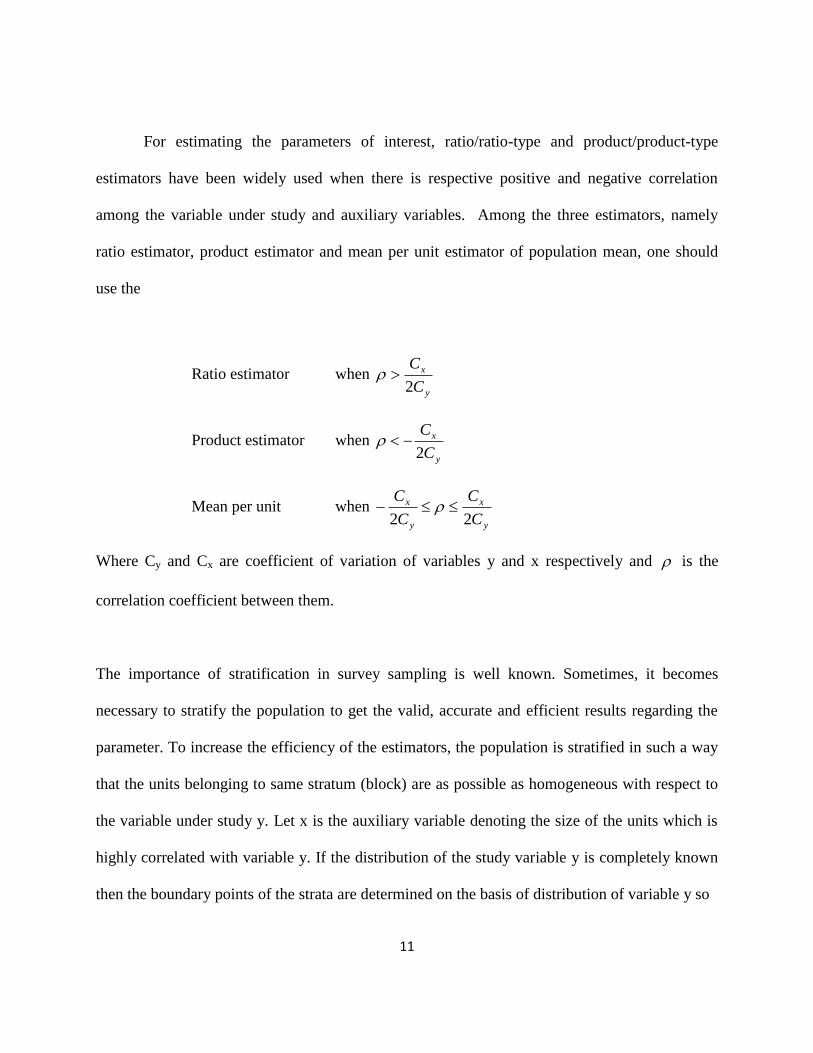
For estimating the parameters of interest, ratio/ratio-type and product/product-type
estimators have been widely used when there is respective positive and negative correlation
among the variable under study and auxiliary variables. Among the three estimators, namely
ratio estimator, product estimator and mean per unit estimator of population mean, one should
use the
Ratio estimator when y
x
C
C
2
Product estimator when y
x
C
C
2
Mean per unit when y
x
y
x
C
C
C
C
22
Where Cy and Cx are coefficient of variation of variables y and x respectively and is the
correlation coefficient between them.
The importance of stratification in survey sampling is well known. Sometimes, it becomes
necessary to stratify the population to get the valid, accurate and efficient results regarding the
parameter. To increase the efficiency of the estimators, the population is stratified in such a way
that the units belonging to same stratum (block) are as possible as homogeneous with respect to
the variable under study y. Let x is the auxiliary variable denoting the size of the units which is
highly correlated with variable y. If the distribution of the study variable y is completely known
then the boundary points of the strata are determined on the basis of distribution of variable y so

12
that the variance of the estimator becomes minimum for a given allocation. Otherwise the
knowledge about the distribution of auxiliary variable x may be used for the same purpose.
In general practice, it is expected that the bigger units in the population will contribute more than
the smaller ones. So, the selection procedure giving higher selection probability to bigger units
than to the smaller ones would be more efficient than the procedure giving equal selection
probabilities to all units. Hansen and Hurwitz (1943) were the first who discussed the selection
of units with probability proportional to some size measure based on auxiliary variable with
replacement. Later on, in 1949, they showed that the sampling with probability proportional to
the square root of the size of the unit is more efficient than the probability proportional to size
(PPS) under certain conditions. Horvitz and Thomsom (1952) discussed the theory of sampling
with probability proportional to size and without replacement. Lahri (1951) suggested a method
of selection of a sample with PPS scheme and with replacement. Later on, Rao, Hartley and
Cochran (1962) described a very simple method of selecting a sample with pps scheme and
without replacement. The sampling schemes for the selection of the units from the population
based on the inclusion probabilities of units proportional to their size (IPPS) and without
replacement has been discussed by several authors such as Goodman and Kish (1950), Narain
(1951), Midzuno (1952), Sen (1952), Yates and Grudy (1953), Godambe (1955), Hanurav
(1962), Hartley and Rao (1962), Brewer (1963), Fellegi (1963), Rao (1965b), Durbin (1967),
Hanurav (1967), Sampford (1967), Das and Mohanty (1973), Singh (1978) etc. Further, Mohanty
(1978), Prasad and Srivenkataramana (1980), suggested suitable transformation to improve the
efficiency of the Horvitz-Thompson estimator under Midzuno sampling scheme. Singh and

13
Srivastava (1980) gave two sampling schemes for selecting units with unequal probabilities
under which the usual regression estimator and some regression type estimators becomes
unbiased. Later on, Nigam et al (1984), Singh and Singal (1986), Jhajj and Srivastava (1983)
have also defined some other PPS sampling schemes based on auxiliary variables.
Mukhopadhyay (1991), Mangat and Singh (1992-93) reviewed the literature concerning the
sampling schemes with varying probability and without replacement and discussed them
critically with respect to their stability, efficiencies and simplicities. Vasantha et al (1996) have
used ranks in unequal probability sampling and examined the same for sample selection and
stratification.
The problem of improving upon the conventional unbiased estimators (based on the study
variable only) of the population parameters of interest by using the information on one or more
than one auxiliary variables have received a considerable attention of statisticians in the survey
sampling and practice. Whenever there is high positive correlation between variables y and x,
and the population mean X of variable x is known in advance then the ratio and ratio type
estimators have been widely used in practice. On the other hand for the case of negative
correlation between them the use of product estimators have been advocated by Goodman
(1960), Murthy (1964), Srivastava (1966b) etc. Watson (1937) was the first person to develop a
regression estimator for estimating the average area of leaves on a plant by taking leaf weight as
auxiliary variable. The ratio and difference estimators initially have been developed by Cochran
(1940, 1942) and Hanson et al (1953) respectively. The main drawback of the use of ratio type
and regression type estimators is that the exact expressions (in terms of the moments of bivariate

14
population) for their biases and mean square errors are not obtained. For large samples, the
contribution of the biases (being of order n-1
) of such estimators to their mean square errors is
negligible so the precision of these estimators is adjusted on the biases of their asymptotic
variances. It has also been shown that the regression estimator is always better than ratio, product
and mean per unit estimators. But, Johnson (1950) has shown that sometimes the ratio estimator
is better than the regression estimators for the case of small sample size in certain type of
populations.
Srivenkataramana and Tracy (1981) suggested a product method of estimation by using a simple
transformation on auxiliary variables when there is a positive correlation between variables y and
x which leads to the advantage that the resulting estimator has exact expression for its bias and
mean square error. Later on, a number of ratio type estimators and their generalizations for
estimating the parameters of interest such as ratio of ratios, difference of two ratios, mean, ratio
of means, variance, coefficient of variation, correlation coefficient etc. have been made by
several authors viz Kish and Hess (1959), Yates (1960), Smith (1966), Walsh (1970), Mohanty
and Das (1971), Cochran (1977), Kulkarni (1978), Rai and Sahai (1980), Srivenkataramana
(1980), Sisodia and Dwivedi (1981), Singh and Shukla (1987), Pal and Mishra (1988) Rao
(1988), Sampath and Durairajan (1988), Prasad (1989), Bisht and Sisodia (1990) etc. Jain (1987)
defined a new kind of estimator of population mean by using information on auxiliary variable
which becomes better than conventional regression estimator, ratio estimator and mean per unit
estimator for a wide range of correlation coefficient between variables y and x. Kumar and Dayal
(1998) have considered ratio and regression estimators of population mean under sampling on
15
two occasions by taking samples of sizes on both the occasions and compared them with respect
to their efficiencies.
Hartely and Ross (1954) defined an unbiased ratio type estimator and obtained an upper bound
for the ratio of the bias to its standard error. Cochran (1977) has shown that the bias may be
safely regarded as negligible with respect to the standard error when coefficient of variation of x
is less than 0.1. The general method for reduction of bias from the first order (n-1
) to the second
order (n-2
)was first developed by Quenouille (1956) and named it as Jack-knife technique. The
jack-knife technique for reducing the bias of ratio estimator to order n-2
was used by several
authors such as Durbin (1959), Goodman (1960), Rao (1965a) etc. Ratio estimator has also been
made unbiased using the procedure of selecting a sampling units with PPS by some authors such
as Midzuno (1950, 52), Lahiri (1951), Sen (1952, 53) etc. The selection and estimation
procedures, which provide unbiased ratio estimator for the case of certain general class of
population parameters were considered by Nanjamma et al (1959). Some contributions for
making existing estimators unbiased are made by Micky (1959), Murthy and Nanjamma(1959),
Goodman (1960), Pascual (1961), Beale (1962), Rao (1964), Tin (1965), Rao (1966), Shukla
(1976), Sahoo and Swain (1980) etc.
In a situation when we have information on more than one auxiliary variable highly correlated
with study variable y without any appreciable increase in cost of survey and all auxiliary
variables may themselves be correlated with each other. The theory of two phase sampling in
regression estimator using several auxiliary variables has been discussed by Ghosh (1947) and
Seal (1951, 53). Using the prior knowledge on q-auxiliary variables, all are highly positively
16
correlated with y, Olkin (1958) has generalized the usual ratio estimator. He also extended the
same estimator in the case of stratified random sampling. Gowswami and Sukhatme (1965)
extended the use of multivariate ratio estimator for multistage sampling. On using multi-
auxiliary information in different form, several estimators of parameters of interest have been
proposed by different authors such as Williams (1963), Raj (1965), Srivastava (1965, 66a, 67),
Singh (1965, 67a), Shulkla (1965, 66), Smith (1966), Rao and Mudholkar (1967), Khan and
Tripathi (1967), John (1969), Tripathi (1970, 76, 78, 87), Adhvaryu (1975), Chakrabarty (1979),
Sahai et al (1980), Agarwal (1980), Agarwal and Kumar (1980), Srivastava and Jhajj (1983a),
Kiregyera (1984), Bedi (1985), Mukerjee et al (1987), Tankou and Dharmadhikari (1989),
Kothwala and Gupta (1989), Tripathi and Behl (1991), Tuteja and Behl (1991), Tripathi and
Ahmed (1995) etc. Dharmadhikari and Tankou (1991) defined an improved ratio type estimator
of population mean using multi-auxiliary information which generalizes the results of Agarwal
(1980) and Agarwal and Kumar (1985). They have shown that the improved ratio type estimator
is as efficient as the regression estimator, upto first order of approximation.
Most of the authors in literature have attempted for generalization of the existing
estimators defined by different authors. Srivastava and Jhajj (1981) have defined a class of
estimators of Y using known information on auxiliary variable x in the form of its population
mean X and variance 2
xS as
2
2
,.~
x
x
tS
s
X
xtyy , where t(.,.) is a parametric function with
11,1 t and satisfying certain regularity conditions. They have shown that the optimum

17
estimators of class ty~ are more efficient than the linear regression estimator when there is non-
linear relationship between the two variables y and x. In the same paper, they also considered a
wider class of estimators of Y , which is defined as
2
2
,,~
x
x
wgwS
s
X
xygy such
that YYg w 1,1, , Y and parametric function gw(.,.,.) satisfies certain regularity conditions.
The most of the estimators defined by different authors so far are particular members of ty~ and
gwy~ such as estimator suggested by Chakrabarty (1968) in which he has taken a linear
combination of mean per unit estimator and ratio estimator, Walsh(1970) estimator
11
Xxxy and similar estimators have been studied by Gupta (1971, 78), Reddy (1973,
74), Shah and Shah (1978), Das and Tripathi (1980), Das (1988) , the class of estimators defined
by Srivastava (1967 & 1971) etc.
By considering the size of population units w.r.t. auxiliary variable, Jhajj and Srivastava
(1983) have defined the class of estimators of Y under PPS sampling technique. Srivastava and
Jhajj (1983a) generalized the class of estimators defined by Srivastava and Jhajj (1981) to the
case when the information on more than one auxiliary variable is available. For estimating the
population variance 2
yS using information on population mean Z and variance 2
zS , Jhajj et al
(2005) defined a class of chain estimators of 2
yS for the case of tri-variate distribution in which
variable z is correlated with x and further, x is correlated with y. Jhajj et al (2006) defined two
unbiased estimators of population mean of study variable on applying linear transformation to
auxiliary variable by using its extreme values along with mean in the population that are

18
generally available in practice. Recently, Jhajj and Walia (2012) proposed a generalized
difference-cum-ratio type estimator for estimating the population mean by using double
sampling technique. Several authors in literature viz. Fuller (2002), Van Hees (2002), Hald
(2003), Singh and Espejo (2003), Singh and Rani Rashmi (2005), Sahoo et al (2005, 2006),
Chao and Chiang (2006), Singh and Priyanka (2007) etc. have also defined sampling strategies
for estimation of parameters by the use of ratio, ratio-type, regression and regression-type
estimators.
The concept of partially balanced incomplete block designs was introduced by Bose and Nair
(1939). Partially balanced incomplete block designs are generally based on the concept of
association scheme defined on treatments. Bose and Mesner (1959) defined partially balanced
incomplete block designs by introducing the concept of association scheme and association
matrices and provided a sound mathematical footing to the concept of association scheme to
study the partially balanced incomplete block designs in a mathematical framework. They have
also obtained many interesting results concerning combinatorial properties of association
schemes. By using the properties of association matrices, Kusumoto (1967) gave the necessary
and sufficient condition under which the (m+1) symmetric matrices are the association matrices
of an association scheme with m associate classes. Several association schemes with more than
two associate classes have also been introduced by various authors in literature. Roy (1953-54)
and Raghavarao (1960) have generalized the two associate class group divisible (GD) association
scheme to an m-associate class GD scheme. Vartak (1955, 1959) defined the kronecker product
designs and three associate class partially balanced incomplete block designs based on
rectangular association scheme. Hinklemann and Kempthrone (1963) and Hinklemann (1964)

19
generalized the rectangular association scheme to the extended group divisible association
scheme.
Other well known association schemes of higher associate classes defined by authors are
three associate class extended triangular scheme of John (1966), four associate class right-
angular and generalized right-angular association scheme of Tharthare (1963, 1967) and some
higher class association scheme of Adhikary (1966, 1967) etc.. Kageyama (1972) gave necessary
and sufficient conditions for partially balanced incomplete block designs with m associate
classes constructed by the kronecker product of some balanced incomplete block designs to be
reducible to partially balanced incomplete block designs with mi associate classes, where mi < m.
Kusumoto and Surendran (1968) defined kronecker product association schemes in terms of the
kronecker product of the association matrices of two association schemes. Peter (1977)
introduced two series of semi-regular group divisible designs. The first has v = sN + s
N-1, m =
s + 1, k = v/s and second has v = 6t + 6, m = 3, k = 2t + 2. Both the series have λ1 = λ2 – 1.
The authors viz. Dey and Midha (1974), Dey et al (1974), Aggarwal (1975, 1977), Saha and
Gauri (1976), Dey (1977), Peter and John (1977), John and Turner (1977), Kageyama (1980),
Aggarwal and Singh (1981), Bhagwandas and Parihar (1980, 1982), Mohan (1983), Nair (1980),
Singla (1983), Bhagwandas et al(1985), Dey and Nigam (1985), Kageyama and Mohan (1985),
Banerjee et al (1987), Puri et al (1987), Banerjee and Kageyama (1988), Kageyama et al (1989),
Mitra et al (2002), Sinha et al (2002a), Sinha et al (2002b), Kageyama and Sinha (2003), Bagchi
(2004), Garg (2005, 2008), Sinha and Kageyama (2006), Garg and Gurinder Pal (2011) etc.
constructed different designs under different situations. Aggarwal (1975) gave a Modified Latin
Square (MLS) type partially balanced incomplete block designs using new association scheme

20
with three associate classes by slightly modifying the definition of Li(S) association scheme
given by Bose and Shimamoto (1952) for s2 treatments. Banerjee et al (1987) constructed two
associate class PBIB designs having group divisible or L2 type association scheme by using
patterned matrices and methods of taking unions of sets of blocks. Sinha et al (2002a) gave some
methods of construction of group divisible and nested group divisible and defined resolvable
rectangular designs. Sinha et al (2002b) constructed rectangular designs, some of which were E-
optimal designs. A series of E-optimal designs, two series of group divisible designs and a new
cyclic solution of a group divisible design were also obtained by them. Kageyama and Sinha
(2003) described some new patterned methods of constructions of rectangular designs and nested
balanced incomplete block designs. Bagchi (2004) presented a general procedure for
construction of group divisible designs and rectangular designs by utilizing resolvable and
“almost resolvable” balanced incomplete block designs. As a special case, he obtained E-optimal
group divisible designs with λ3 = λ2 – 1 = λ1 + 1. Garg (2005) obtained new partially balanced
incomplete block designs with two (group divisible designs) and three (rectangular designs)
associate classes following certain patterns for their block structures by using the incidence
matrices of certain balanced incomplete block designs. Garg (2008) introduced a new
association scheme with three associate classes for v = m2 treatments by newly modifying the
Modified Latin Square association scheme of Aggarwal (1975). Further, Garg (2010) defined a
new association scheme named Pseudo New Modified Latin Square type.
So far, large number of such designs has been defined by various authors. However, there can
still be a situation in which an experimenter will find no design from the designs already defined

21
that will serve his purpose. This may happen because such lists may not include a design with the
particular parametric combination that may suit him or an available design may provide an
undesirable large number of accuracies with which the individual contrasts are estimated.

22
The present thesis have been divided into seven chapters
First Chapter is introductory in which importance of topic, definitions, terminology used and
literature relating to the topic has been given in detail.
In the second chapter, for estimating the population mean Y of the variable under study y, two
ratio type estimators have been proposed by making the linear transformation on auxiliary
variable x which are unbiased upto first order of approximation. The expressions for the biases
and variances of the proposed estimators have been obtained upto second order of
approximation. It has been found that upto first order of approximation; proposed estimators are
unbiased as well as equally efficient with the existing ones. The comparison of proposed
estimators with the existing ones has also been made upto second order of approximation w.r.t.
their mean square errors. The results have also been illustrated numerically which show that the
proposed estimators are almost unbiased and decrease in efficiency is negligible as compare to
the existing ones.
In the third chapter, following the same idea of chapter II, an almost unbiased estimator of
population mean has been proposed when the relationship between the variable under study and
auxiliary variable is completely linear. The expressions for the bias and mean square error of the
proposed estimator has been obtained upto second order of approximation and it has been shown
that proposed estimator is unbiased as well as equally efficient with the regression estimator upto
first order of approximation. The comparison of proposed estimator with the regression estimator

23
has also been made upto second order of approximation w.r.t. their biases and mean square
errors. The results have also been illustrated numerically.
In the fourth chapter, starting from the association matrices of a group divisible partially
balanced incomplete block design with two associate classes, we obtain some new PBIB designs
with two, three and four associate classes following certain juxtaposition patterns by using some
association matrices and some other types of well known matrices. For the purpose of
completeness, association scheme of GD design and one new association scheme have been
discussed. Methods of construction of regular group divisible (RGD), singular group divisible,
designs with three and four associate classes following new association scheme have also been
discussed which are supported by illustrations. The efficiencies of various treatment contrasts
and average efficiency factor have been calculated for the purpose of comparison.
Lastly, it has been shown that new designs constructed as well as listed are desirable and of
much statistical interest because some of them are more efficient than the existing ones.
In the fifth chapter, following the work done by Ramakrishnan (1956) and R.N. Mohan (1983),
some new series of triangular and four associate class PBIB designs with two replications have
been constructed by using dualization technique. The efficiencies of the constructed designs have
been calculated for the purpose of comparison. The effort has also been made to illustrate the
results numerically.

24
In the sixth chapter, application of Design of Experiment in Sampling has been discussed. For
estimating the population mean, efficient sampling strategy has been proposed under controlled
sampling design. Balanced incomplete block design which is a special case of partially balanced
incomplete block design, is used for preparing the sampling frame which gives quite high
probability of selection of preferred samples as compared to non-preferred sample. The
expressions for bias and variance of proposed sampling strategy have been obtained. It has been
shown that efficiency of the estimator under the given design remains the same as in the case of
simple random sampling design but the probability of selection of non-preferred samples
becomes less in the proposed sampling design as compared to the conventional simple random
sampling design.
In the seventh chapter, a study of the primary hypertension among the euglycemic patients of
ischemic heart disease has been done. The work is related to the prediction of the hypertension.
So, two separate multiple linear regression models have been used by taking systolic blood
pressure & diastolic blood pressure as dependent variables and body mass index, tri-glyceride,
low density lipoprotein- cholesterol and high density lipoprotein-cholesterol as independent
variables (independent risk factors) to study the essential hypertension among the euglycemic
patients of ischemic heart disease. Adequacy of the models has been verified using analysis of
variance (F-test), histogram, Q-Q plot and box whiskers plot. In this chapter, an effort has been
made to analyze the data and interpret it with the help of statistical software package SPSS 14.0.