estimation of postmortem interval based on cell death ... · estimation of postmortem interval...
TRANSCRIPT

Estimation of Postmortem Interval Based on Cell Death Progression in Biological Fluids
Author: Mónica Cristina Francisco Tomé
Dissertation submitted to the Faculty of Medicine of University of Porto for the Master degree in Forensic Sciences
Supervisor: Prof. Doutor Agostinho Almiro de Almeida (Faculty of Pharmacy, University of Porto)
Co-supervisors: Prof. Doutor Agostinho José Carvalho dos Santos
(Faculty of Medicine, University of Porto)
Doutora Daniela Sofia Almeida Ribeiro (Faculty of Pharmacy, University of Porto)
Porto, September 2017

i
Acknowledgments
My special acknowledgments to:
My supervisor Professor Agostinho Almeida that accepted to work with me and provided
me the indispensable help to finish my master degree.
My co-supervisor Professor Agostinho Santos, without him I would not be doing my
dissertation, he opened my eyes and I am glad that he did.
My co-supervisor Doctor Daniela Ribeiro that welcomed me with open arms and was
always with me.
Doctor Rui Almeida who is a very professional person and who was always ready to help
me in whatever it takes!
To Professor Eduarda Fernandes who was always present during the development of this
study and was always trying to find solutions to the problems.
To all of my friends, especially to Cátia Pereira, Margarida Pereira, Miguel Pinto and Sofia
Salsinha, that provided me the emotional strength to continue to fight and get my
motivation.
To my parents and brother, that always listened to me and gave me the emotional support
while I was far away from home.
I have to thank also to all of those who were present during this period of my life and
never let me give up.
I appreciate the collaboration with the Institute of Legal Medicine and Forensic Sciences,
North Branch (Porto).

ii
Abstract
One of the main challenges in forensic medicine is to estimate the postmortem interval
(PMI). Several studies regarding postmortem alterations over time in several biological
matrices such as vitreous humor and cerebrospinal fluid, among others, have addressed
this major question. However, the obtained results from currently available approaches
are still unsatisfactory once they have shown no noteworthy changes of the content (e.g.
electrolytes, cells, etc.) over time after death (low sensitivity), not granting to estimate the
postmortem interval with high accuracy.
The goal of this study is to evaluate the cellular viability, apoptosis state or necrosis state,
based on flow cytometry analysis of cells in vitreous humor (VH) and cerebrospinal fluid
(CSF) collected from human corpses, in order to correlate it with the postmortem interval.
To this qualitative and quantitative evaluation the probes Annexin V labelled with
fluorescein and propidium iodide were associated with the trypan blue exclusion test.
In general, CSF presented much higher cellular counts than VH. Therefore, it seems a
much more appropriate biological matrix for the intended purpose. Cellular density (cell
counts) showed a tendency to increased values with the increasing of PMI only for CSF
samples. Also for CSF, a tendency to increased values (from 5.78% to 88.04%) with
increasing PMI was observed for viable cells. The other tests parameters (“cells of
interest”, “cellular debris”, percentage of cells in apoptosis or necrosis showed conflicting
results with each other).
In conclusion, this preliminary study proved that the study of cellular death progression
present in VH and CSF can be an important strategy to estimate the PMI. However, more
studies are necessary to definitely prove its value.
Keywords: Cell death; cerebrospinal fluid; flow cytometry; postmortem interval; vitreous
humor

iii
Table of Contents
Acknowledgments ............................................................................................................... i
Abstract ............................................................................................................................. ii
Keywords ........................................................................................................................... ii
Table of contents .............................................................................................................. iii
Index of Figures ................................................................................................................. v
Index of Tables ................................................................................................................. vi
Index of Appendixes ........................................................................................................ vii
List of Abbreviations ........................................................................................................viii
1. Introduction ................................................................................................................... .1
1.1. Forensic Medicine .................................................................................................. 1
1.2. Postmortem interval ............................................................................................... 1
1.3. Biological matrices ................................................................................................. 5
1.3.1. Vitreous humor ............................................................................................. 6
1.3.2. Cerebrospinal fluid ........................................................................................ 7
1.4. Cell death ............................................................................................................... 8
2. Objectives .................................................................................................................... 11
3. Materials and methods ................................................................................................. 12
3.1. Reagents .............................................................................................................. 12
3.2. Samples ............................................................................................................... 12
3.3. Cell counting with Neubauer chamber .................................................................. 15
3.3.1. Total cell count ........................................................................................... 15
3.3.2. Trypan blue exclusion assay ....................................................................... 15
3.3.2.1. Basis of the method ............................................................................ 15
3.3.2.2. Experimental procedure ...................................................................... 16
3.4. Flow cytometry ..................................................................................................... 16
3.4.1. A5-FITC and PI binding assay .................................................................... 17
3.4.1.1. Basis of the method ............................................................................ 17
3.4.1.2. Experimental procedure ...................................................................... 18
3.5. Statistical analysis ................................................................................................ 20
4. Results ......................................................................................................................... 21
4.1. Protocol optimization ............................................................................................ 21
4.1.1. Cellular density ........................................................................................... 21
4.1.2. Cellular viability ........................................................................................... 23

iv
4.2. Samples analysis ................................................................................................. 24
i) Cellular density .................................................................................................. 24
ii) Cells of interest and cellular debris ................................................................... 24
iii) Cellular viability ................................................................................................ 26
iv) Apoptosis and necrosis .................................................................................... 27
5. Discussion and Conclusions ....................................................................................... .29
6. References .................................................................................................................. 32
Appendixes ...................................................................................................................... 34

v
Index of Figures
Figure 1 – Anatomic location of VH in the eye ................................................................... 6
Figure 2 – Organization of the ventricular system of the brain ............................................ 8
Figure 3 – Characteristics of necrosis, apoptosis, and autophagic cell death ..................... 9
Figure 4 – Intrinsic and extrinsic routes of caspases activation ....................................... 10
Figure 5 – Counting grid of NC and four of the total nine squares marked in red ............. 15
Figure 6 – Diagram showing probes for detection of healthy, apoptotic and necrotic cells18
Figure 7 – Cellular density (U/mL) for VH-R, VH-L and CSF as determined by NC and FC
procedures ....................................................................................................................... 22
Figure 8 – Cellular viability (%) in VH-R, VH-L and CSF as determined by NC and FC
procedures ....................................................................................................................... 24
Figure 9 – Relationship between cellular density (U/mL) and PMI for both VH and CSF
samples ........................................................................................................................... 24
Figure 10 – Representative FC dot plots of SSC (Y-axis) and FSC (X-axis) parameters for
a VH (a) and a CSF (b) samples ...................................................................................... 25
Figure 11 – Relationship between the parameter %P1 (cells of interest), %P2 (cellular
debris) and PMI for VH samples ...................................................................................... 25
Figure 12 – Relationship between the parameter %P1 (cells of interest), %P2 (cellular
debris) and PMI for CSF samples .................................................................................... 26
Figure 13 – Cellular viability (%) in VH and CSF samples as a function of PMI ................ 27
Figure 14 – Representative FC dot plots of FL3 (PI staining) and FL1 (A5–FITC staining)
channel signal displaying the percentage of apoptosis (LR quadrants) and necrosis (UR
quadrants) for both matrices: VH (a) and CSF (b) ............................................................ 27
Figure 15 – Percentage of apoptotic cells in VH and CSF samples as a function of PMI . 28
Figure 16 – Percentage of necrotic cells in VH and CSF samples as a function of PMI ... 28

vi
Index of Tables
Table 1 – Summary of the sample’s information: sample number, gender, age, last time
seen alive (date & hour), death verification and autopsy (date & hour), cause of death and
associated pathologies, when known ............................................................................... 13
Table 2 – Cellular density (U/mL) in the tested samples (VH-R, VH-L and CSF) as
determined with NC and FC ............................................................................................. 21
Table 3 – Cellular viability (%) for VH-R, VH-L and CSF as determined by TB assay and
FC .................................................................................................................................... 23

vii
Index of Appendixes
Appendix 1 – Responsibility term assigned to ask collaboration of INMLCF, I.P. ............. 36
Appendix 2 – Authorization of INMLCF of Porto to collaborate in the study. ..................... 37
viii
List of Abbreviations
A5-FITC – Annexin-V labelled with fluorescein isothiocyanate
CSF – Cerebrospinal Fluid
DNA – Deoxyribonucleic Acid
FC – Flow Cytometry
FSC – Forward Scattering
HA – Hyaluronic Acid
NC – Neubauer Chamber
PI – Propidium Iodine
PMI – Postmortem Interval
PS – Phosphatidylserine
RNA – Ribonucleic Acid
SSC – Side Scattering
TB – Trypan Blue
VH – Vitreous Humor
VH-R – Vitreous Humor from right eyeball
VH-L – Vitreous Humor from left eyeball

1
1. Introduction
1.1. Forensic Medicine
The definition of “Forensic Medicine” has been the subject of some discussion. There has
been some differentiation between the terms “Forensic Medicine” and “Legal Medicine”,
since for some authors both mean medical knowledge applied to justice, but for others the
two terms represent different sciences and roles. According to Beran (2010), Legal
Medicine is more comprehensive than Forensic Medicine, focused on solving legal
problems in the civil law. Forensic Medicine is the application of biomedical knowledge to
the resolution of problems in criminal law. Assuming this perspective, this study is related
with the Forensic Medicine concept.
In a criminal investigation of a death there are three major questions to answer: 1) what
was the cause of death?; 2) who was involved?; and 3) how long ago did death occur?
The answer to the third question may lead to some clues for the other two, such as the
possibility of inclusion/exclusion of suspects at the time of death, exclusion of alibis,
among others (Hayman and Oxenham, 2016; Mathur and Agrawal, 2011). Thus, the
combination of the subjective evidence, such as witnesses reports, with scientific data can
help to clarify many situations (Mathur and Agrawal, 2011).
1.2. Postmortem interval
Postmortem interval (PMI) is defined as the time elapsed since the person died until the
body is discovered and analyzed. It is the answer to question 3): “how long ago did death
occur?”. As such, one of the main tasks of Forensic Medicine is the determination of this
period of time (Lee Goff, 2009; Sachdeva et al., 2011).
After death occurs, several changes begin to happen in the body, not only at a
macroscopic level, but also at cellular and molecular levels, being autolysis an example
(Hayman and Oxenham, 2016). The evaluation of these changes help in the
determination of the time elapsed after the person’s death, i.e., the PMI. Due to physical,
physicochemical, metabolic and biochemical changes in the human body there are
several phases that can be analyzed in medical-legal autopsies. These phases
correspond to a progressive degradation of the body's components, influenced by abiotic
2
(non-living) factors, such as temperature and humidity, along with biotic factors, such as
the activity of microorganisms (Forbes, 2008; Mathur and Agrawal, 2011).
After the stop of heart beating and circulatory activity there is a period that can last up to
100-120 minutes (“supravital period”) in which the tissues still respond to stimuli, such as
the phenomenon of algor mortis, rigor mortis and livor mortis, which allow the estimation
of a PMI (Hayman and Oxenham, 2016; Mathur and Agrawal, 2011):
Algor mortis consists in the gradual decrease of the corpse body temperature over
time. After death, the body ceases to produce heat and the body temperature tends to
be the same as the surrounding environment (Madea and Kernbach-Wighton, 2013;
Mathur and Agrawal, 2011). This postmortem phenomenon is used to estimate PMI up
to 24 hours after death.
Rigor mortis is a physical and chemical phenomenon that consists in the contraction
of the body muscles, and begins in the first 2-6h after death, reaching the maximum
stiffness between 6h and 12h after death. It can remain up to 72 hours, followed by
muscle relaxation until sagging (Gill-King, 1997; Mathur and Agrawal, 2011). This
state of contraction is achieved because the body ceases to produce adenosine
triphosphate (ATP) and reaches an energy level less than 85%, and consequently the
physiologic calcium flux decreases too (Bate-Smith and Bendall, 1947; Madea and
Kernbach-Wighton, 2013).
Livor mortis consists in the deposition of blood in different parts of the body due to
the gravitational force. These zones acquire a characteristic purple coloration. Despite
the variability in appearance, it is observed that it can start to occur 15 minutes
afterdeath, since it happens as soon as the blood circulation stops, but it becomes
more evident 2 hours after. The livors are well developed after 3h-4h and are fixed 8h-
12h after death (Clark et al., 1997; Mathur and Agrawal, 2011).
According to Vanezis and Trujillo (1996), rigor mortis and livor mortis, like algor mortis,
must be studied together with other parameters in order to estimate PMI more accurately
(Madea and Kernbach-Wighton, 2013). The usefulness of this body reactions on the
estimation of PMI is valid only on the first hours after death and they are not useful when
the body suffered from burns, for example (Mathur and Agrawal, 2011). Other variables
can influence the PMI estimation such as climate conditions, body surface, the presence

3
of antemortem pathologies and the age of the individual, among others. Thus, they
represent rather unspecific parameters in the estimation of PMI because they are
influenced by many abiotic factors (Hayman and Oxenham, 2016; Kobayashi et al., 2001;
Krompecher, 1981; Mathur and Agrawal, 2011).
Another parameter useful to estimate PMI is cadaveric putrefaction, which consists in the
degradation of the soft tissues of the corpse by the action of bacteria and endogenous
enzymes (autolysis). As a result of the body decomposition, different gases, liquids and
salts are produced. Cadaveric putrefaction phases can be divided according to the
postmortem time appearance (Mathur and Agrawal, 2011):
1) Chromatic phase: a green spot appears in the right iliac fossa (abdominal spot), with
consequent enlargement to the entire abdominal and thoracic wall. At this stage a network
of superficial veins in the skin can be observed. This stain is propagated through the
corpse and becomes a blue-greenish hue until it becomes a dark spot (Mathur and
Agrawal, 2011). This phase appears approximately between 24h and 72h after death,
depending on the climate conditions;
2) Emphysematous phase: this is the phase where gases already produced by
putrefaction are released and consequently swell the whole body (Mathur and Agrawal,
2011). This phase begins between 2 days to 1 week after death;
3) Tissue reduction phase and liquefaction: at this stage there is softening and
disintegration of the tissues, accumulating putrefied fluids (transudate). Epidermal
detachment may also occur (Madea and Kernbach-Wighton, 2013; Saukko and Knigth,
2004). This phase occurs 2-3 weeks after death;
4) Skeletonization phase: in this phase the balance between putrefaction and dehydration
transforms the transudates into powder (Ubelaker and Zarenko, 2011). This is one of the
phases that presents more difficulties in the estimation of PMI because of the preservation
of tissues and the consequent delay in decomposition (Hayman and Oxenham, 2016).
The time of appearance and duration of this phase depends on the temperature, the
condition of the corpse (whether buried or not, for instance) and the presence or absence
of decomposition by microorganisms (Madea and Kernbach-Wighton, 2013).

4
These macroscopic alterations are commonly observed during medical-legal autopsies
and are helpful in PMI estimation; however, they are not precise and are difficult to
interpret due to the numerous factors that can influence them. As an example, in the
different cadaveric putrefaction phases, the autolysis strongly depends on the climatic
conditions and consequently it can start in an interval between 48h and 72h after death
(Perper, 2006).
The most important factors that increase the rate of decomposition are: temperature (main
factor), humidity, the presence of insects and carnivorous animals. On the contrary,
submersion in water decreases the rate of decomposition (Prieto et al., 2004).
Besides these parameters, there are also cellular and molecular changes that occur in the
cadaver over time that can help in the determination of PMI. (Hayman and Oxenham,
2016) described numerous studies that have been carried out based on these changes:
Biochemical studies: they are based on the analysis of chemical elements/substances
that are released after death and which accumulate in the body. The main studies
already performed within this category were based on the evaluation of sodium,
potassium, hypoxanthine and oxalic acid levels in different biological specimens, such
as VH and synovial fluid. However, the cited studies presented some limitations, as
estimation of PMI only 24h after dead, and all of them generally present contradictory
results;
Studies of markers in bone marrow and other organs: studies based on the alteration
of cells or proteins over time. The main studies were performed with cells from bone
marrow, blood and organs such as heart, and the progression of degradation and
morphology alteration over time was evaluated. The studies also presented several
limitations, as inaccuracy in the PMI estimated, the fact that the variability of cellular
morphology and velocity of changes be too fast to establish a correlation between the
studied parameter and the PMI, and the influence of abiotic factors;
Immunohistochemical studies: studies related to the time of response of certain
components to antigens / antibodies in tissue. These studies are based on the
biological fluids that contain organic compounds and electrolytes. The main biological
matrices used for such studies are VH and CSF. However, the studies presented
some flaws such as the process of autolysis to be too fast in cerebrospinal fluid to
5
study components such as creatinine, insulin, among others and the influence of
abiotic factors in the results;
DNA/RNA studies: studies based of an evaluation of the degradation of nucleic acids
after death. The main biological specimens used are the spleen cells and organs such
as heart, brain, among others. There are so far no DNA/RNA studies that can be
applied in the estimation of PMI in routine forensic practice, due to the high
imprecision, the influence of abiotic factors, the high intra-individual variability, the
possibility of PMI estimation only after 24 hours after death and the inexistence of
correlation between the data and the PMI;
Entomological studies: those involving the study of insects that colonize the body. This
type of studies needs an in-depth knowledge because the correct identification of
species and their cycle of reproduction are essential to estimate the PMI, and there is
a strong influence of abiotic factors. Besides that, this estimation becomes possible
only 3 to 5 days after death because the colonization starts in this period. However,
this study is useful for PMIs that are extended to months;
Studies of bone remains: based on root rings, tendons, ligaments and bones study.
Both indirect and direct methods exist. The indirect methods involves palynological
and botanical studies, for example the study of root growth rings around the cadaver,
but usually results in PMI determinations with high uncertainty. The direct methods
consist in the morphological examination of the tendons and ligaments that are still
connected at an early stage of skeletonization. These studies are subjective and
strongly depend on the investigator experience and knowledge (Hayman and
Oxenham, 2016).
1.3. Biological matrices
As previously referred, there are several biological matrices that can be studied in order to
estimate the PMI, for instance, blood, bone marrow, different organs, cerebrospinal fluid,
vitreous humor and cerebrospinal fluid, among others.
The present study was directed to two biological matrices: vitreous humor (VH) and
cerebrospinal fluid (CSF) collected from human corpses. Herein these two matrices will be

6
described with regard to their anatomical location, cellular composition and main
functions.
1.3.1. Vitreous humor
VH is a fluid of gelatinous consistency, representing about 80% of the volume of the eye.
It is present between the lens and the retina (Figure 1) (Bévalot et al., 2016; Remington,
2011). The total volume of VH in both eyes may reach 4 mL (Angi et al., 2012; Bévalot et
al., 2016).
Figure 1 – Anatomic location of VH in the eye (Purves et al., 2001).
Regarding its composition, VH consists essentially of water, dissolved salts, soluble
proteins, collagen, hyaluronic acid (HA) and tiny cells – hyalocytes and macrophages
(Bévalot et al., 2016; Remington, 2011). Hyalocytes represent the major type of VH cells
(Remington, 2011).

7
The main function of VH is the support and maintenance of the spherical shape of the
eye. This fluid functions also as a reservoir of metabolites and thus allows the movement
of these metabolites within the eye (Bévalot et al., 2016; Remington, 2011).
1.3.2. Cerebrospinal fluid
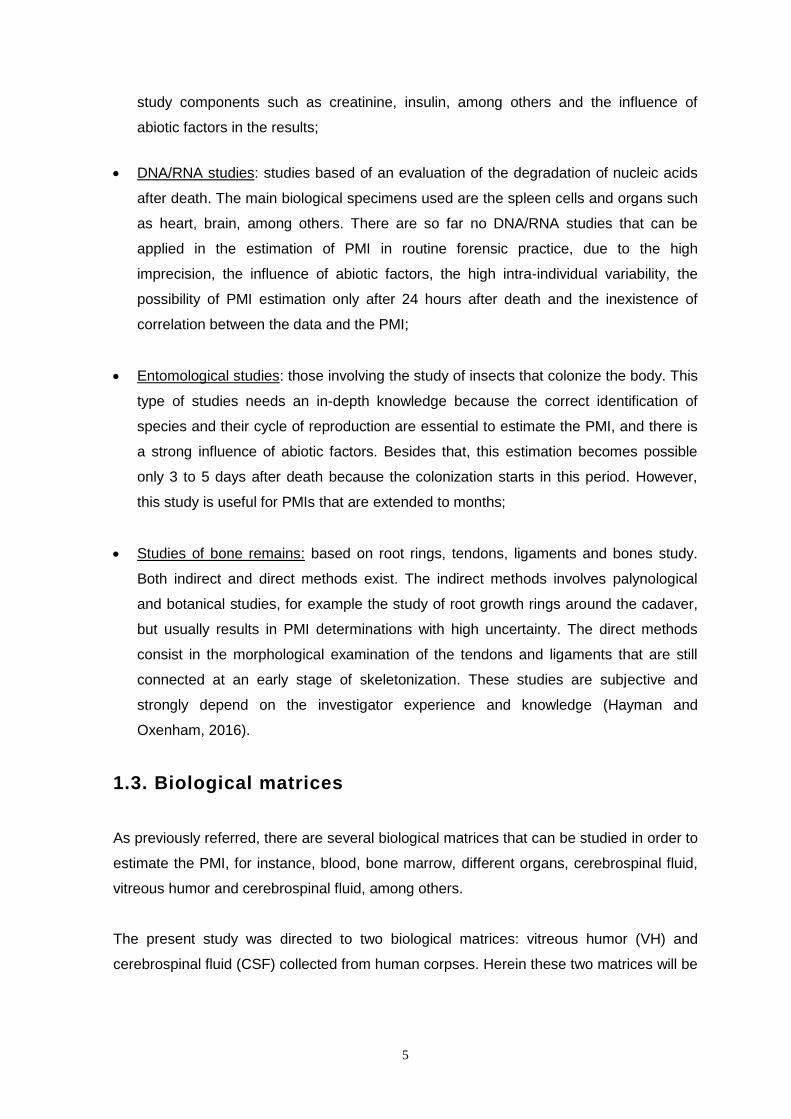
CSF is found in the subarachnoid space in the brain (Stratchko et al., 2016). CSF is
formed by the choroid plexus of the two lateral ventricles, the 3rd and 4th ventricles. Lateral
ventricle fluid converges in the 3rd ventricle through the foramen of Monro and reaches the
4th ventricle via the aquaeductus cerebri (Sylvius). The CSF exits from the 4th ventricle
through the foramina of Magendie and Luschka to the outer surface of the central nervous
system (CNS) (Damkier et al., 2013) (Figure 2).
The CSF total volume in the body reaches about 90 to 150 mL, distributed in ventricles
(about 20%), in the subarachnoid space (about 15%) and in spinal cord (Puntis et al.,
2016; Spector et al., 2015; Stratchko et al., 2016).
CSF is composed by epidermal cells, neutrophils, monocytes and lymphocytes (Bardale,
2009; Johanson et al., 2011; Spector et al., 2015).
8
Figure 2 – Organization of the ventricular system of the brain. The brain parenchyma is shown in
gray, the ventricles and aquaeductus are in yellow, and the choroid plexus are marked in red
(Damkier et al., 2013).
Homeostasis in CNS is achieved because there are physical barriers that protect it: the
blood-spinal cord barrier; the CSF barrier and the blood-brain barrier. These barriers are
responsible for exchanges between blood and CNS while protecting the parenchyma from
toxins, invading pathogens and/or cells (Tenreiro et al., 2016).
1.4. Cell death
Historically, cell death study was focused on one form only: the regulated form –
apoptosis. However, over time other forms of cell death have emerged and have been
clarified. Currently, cell death can be divided in three different types: apoptosis,
autophagic cell death and necrosis (Green, 2017), as seen in Figure 3.

9
Figure 3 – Characteristics of the necrosis, apoptosis, and autophagic cell death. Each type of cell
death has its own morphological and biochemical properties (Escobar-Sánchez et al., 2015).
Apoptosis is an active process that starts when a cell is “marked” for elimination, and this
pathway is dependent on effector caspases that are hydrolytic enzymes which have the
role of cleaving substrates, consequently activating apoptosis process (Green, 2017).
The pathway in which apoptosis occurs can be divided in extrinsic, here dead receptors
are “turned on”, and intrinsic or mitochondrial pathway, in which the mitochondrial
membrane is permeabilized, releasing proteins that signalize the activation of the
caspases (Green, 2017), represented in Figure 4.
Cellular alterations include cell wrinkling, organelle damage, coalescence and chromatin
displacement to the nucleus margins. The structural alterations are divided in two phases:
the first comprises nuclear and cytoplasmic condensation and the breakage of the cell in
several conserved fragments that stay next to the plasma membrane, called apoptotic
bodies; the second comprises phagocytosis of these bodies, which are drawn from the
epithelial surface or are ingested by other cells, where autolysis occurs within the
phagosomes and where there is degradation by lysozymes (Kerr et al., 1972).

10
Figure 4 – Intrinsic and extrinsic routes of activation of caspases. Mitochondrial activation involves
the cytochrome-C delivering from the mitochondria to form a complex composed by the caspase-9
and the Apaf-1, which in turn will activate the executer caspases -3, -6, or -7. Extrinsic route implies
the activation of a death receptor in the cytoplasmic membrane by means of a ligand; this process
will activate the initiator caspase-8, which in turn will activate the executer caspase-3, -6, or -7. The
activation of the executer caspases provokes the morphological changes related to the apoptotic
process (Escobar-Sánchez et al., 2015).
Autophagic cell death can result from either apoptosis or necrosis and is a term applied to
invertebrate systems (e.g. Drosophila) and to a lesser extent in mammalian cell cultures
(Green, 2017).
Necrosis is a term used by pathologists to refer the presence of dead tissues or cells. It
represents the changes occurring in the cell after it has already reached equilibrium with
the surrounding contents (Majno and Joris, 1995), and involves inflammatory
consequences.
Unlike apoptosis, necrosis is seen as a passive and accidental process resulting from
environmental disturbances with uncontrolled release of inflammatory cellular contents. It
has also been associated with coagulation that is probably the result of an irreversible
disturbance of the homeostatic mechanisms of the cell (Fink and Cookson, 2005).

11
2. Objectives
This study aimed to find a method to estimate the PMI through the analysis of cellular
death (apoptosis vs. necrosis) progression of the cells present in two biological matrices
with different biochemical composition: vitreous humor (of right and left eyeballs) and
cerebrospinal fluid (from subarachnoid space).
To achieve this goal, this work was divided in two steps:
a) Firstly, cell death evaluation in NC with a vital dye was performed and the FC
protocol was optimized;
b) Secondly, with all FC parameters duly optimized, the protocol was applied to a set
of VH and CSF samples collected from human corpses at different times ranging
from 1h30min to approximately 110h after death in order to look for an eventual
correlation between PMI and cell death.

12
3. Materials and Methods
3.1. Reagents
The A5-FITC Apoptosis Detection Kit (cat no. 11858777001) and the Trypan blue 0.4%
solution (cat no. 23850) were purchased from Sigma-Aldrich (St. Louis, USA).
3.2. Samples
Samples were collected in compliance with protocol standards of the National Institute of
Legal Medicine and Forensic Sciences (INMLCF) - North Branch (Porto), after completing
all legal formalities, including the signature of a Term of Responsibility by the study author
(Appendix 1), and obtaining the necessary authorizations (Appendix 2).
After verification of death, the corpses were transported to INMLCF where they were kept
under refrigeration until autopsy. All sample’s information is presented in Table 1.
Samples of vitreous humor from both right (VH-R) and left (VH-L) eyeballs were collected
during autopsy with hypodermic puncture needles of 26G 1" 0.45x25 mm and sterile 5 mL
Luer-Lock™ syringes (BD Medical, Switzerland).
In the first phase of the work the VH from right and left eyeballs were separately collected
to sterile plastic microtubes. In the second phase of the work, VH from both eyeballs were
collected to the same sterile Falcon™ tube (BD Biosciences, USA).
Samples of CSF were collected from subarachnoid space with hypodermic puncture
needles of 22G ½" 0.7x40 mm and sterile 5 mL Luer-Lock™ syringes to sterile plastic
microtubes.
Samples were immediately placed on ice and transported to the laboratory protected from
light.

13
Table 1 – Summary of the sample’s information: sample number, gender, age, last time seen alive (date & hour), death verification and
autopsy (date and hour), cause of death and associated pathologies, when known. Source: INMLCF, I.P.
1 M 82 11/06/17 | 22h30 12/06/17 | 01h05 13/06/17 | 12h00 Unk Cardiac
2 F 22 18/06/17 | 20h00 19/06/17 | 14h05 20/06/17 | 16h30 Found hanged Unk
3 F 41 18/06/17 | 20h00 19/06/17 | 10h40 20/06/17 | 18h00 Found hanged Unk
4 M 50 25/06/17 | 00h05 25/06/17 | 00h05 26/06/17 | 11h10 Burned Unk
5 M 58 30/06/17 | 22h50
* 30/06/17 | 22h50 03/07/17 | 11h00
Liver cirrhosis and consumption of toxic substances; found in
CRA
Unk
6 F 82 07/07/17 | 11h10
* 07/07/17 | 11h10 10/07/17 | 11h10 Unk Unk
7 F 50 30/06/17 | 15h00 30/06/17 | 20h00 03/07/17 | 11h00 Voluntary drug intake Unk 8 F 46 03/07/17 | 00h45 03/07/17 | 1h45 03/07/17 | 16h30 CRA Unk 9 M 65 01/07/17 | 16h30 01/07/17 | 17h45 03/07/17 | 15h40 Suicide by hanging Unk
10 M 79 10/07/17 | 00h20
* 10/07/17 | 00h20 10/07/17 | 15h15 Drug intake and CRA Unk
11 M 62 12/08/17 | 17h25
* 12/08/17 | 17h25 16/08/17 | 11h00 CRA Unk
12 M 51 12/08/17 | 22h40
* 12/08/17 | 22h40 16/08/17 | 12h00 CRA Unk
13 M 66 15/08/17 | 21h00 15/08/17 | 21h35 16/08/17 | 16h00 Unk Diabetes
14 M 66 14/08/17 | 18h00 14/08/17 | 19h00 16/08/17 | 16h30 Unk Arterial hypertension
15 M 79 15/08/17 | In the
morning,36h before 7h29
16/08/17 | 19h29 17/08/17 | 16h00 Tried suicide before Unk
16 M 55 17/08/17 | 19h 17/08/17 | 19h00 18/08/17 | 16h00 CRA Epilepsy / dementia
17 F 79 19/08/17 | 08h47
* 19/08/17 | 08h47 21/08/17 | 11h30 CRA
Knees surgery and respiratory dysfunction
CRA – Cardio-respiratory arrest; F – Female; M – Male; Unk – Unknown; * Death at the hospital (so, time of death verification = real time of death).
Sample nº
Gender Age
(years) Last time seen alive
(estimation: day | hour)
Death Verification (day | hour)
Autopsy (day | hour)
Cause of death Associated pathologies

14
Table 1 – Summary of the sample’s information (cont.). Source: INMLCF, I.P.
CRA – Cardio-respiratory arrest; F – Female; M – Male; Unk – Unknown; * Death at the hospital (so, time of death verification = real time of death).
Sample nº
Gender Age
(years) Last time seen alive
(estimation: day | hour)
Death Verification (day | hour)
Autopsy (day | hour)
Cause of death Associated pathologies
18 F 80 19/08/17 at night
(considered at 20h) 20/08/17 | 10h20 21/08/17 | 15h30 Unk Unk
19 M 43 19/08/17 at night
(considered at 20h) 20/08/17 | 10h55 21/08/17 | 15h30 Unk Psychiatric and alcoholic
20 F 48 20/08/17 | 22h55 20/08/17 | 23h55 21/08/17 | 15h30 Liver cirrhosis and
alcoholism Unk
21 M 85 22/08/17 | 10h06
* 22/08/17 | 10h06 23/08/17 | 11h00 Unk
Arterial hypertension, Obesity, sleep apnoea, auricular fibrillation and
hypertensive heart disease
22 M 54 Custody death
22h20 21/08/17 | 22h20 23/08/17 | 11h30 Metastatic neoplasm Unk
23 F 83 23/08/17 | 10h00 23/08/17 | 11h00 24/08/17 | 10h00 Hepatic neoplasm Unk 24 M 63 23/08/17 | 09h26 23/08/17 | 16h26 24/08/17 | 15h30 Hanging Psychiatric
25 F 28
23/08/17 (considered at 12h59
because death occurred at lunch, ca. 3h before)
23/08/17 | 14h59 24/08/17 | 15h30 Hanging Unk
26 M 68 23/08/17 | 15h10
* 23/08/17 | 15h10 25/08/17 | 9h30 Unk Psychiatric
27 M 74 24/08/17 | 14h50 24/08/17 | 15h50 25/08/17 | 15h00 Unk Cardiac
28 M 50 24/08/17 | 17h00 24/08/17 | 17h45 25/08/17 | 15h00 Unk Psychiatric
29 M 67 28/08/17 | 08h00 28/08/17 | 09h36 29/08/17 | 10h30 Hanging Unk
30 M 44 28/08/17 | 20h30 29/08/17 | 14h30 29/08/17 | 16h00 Unk Psychiatric
31 M 77 28/08/17 | End of the day
(assumed at 18h) 30/08/17 | 08h40 31/08/17 | 15h20 Unk Unk

15
3.3. Cell counting with Neubauer chamber
3.3.1. Total cell count
Total cell counting was performed with Neubauer Chamber (hemocytometer) in an optical
microscope under the 40x objective. Total cell count included all the viable and nonviable
cells counted in 4 big squares (Figure 5) of the chamber, each one with a volume of 0,1
µL.
To calculate the cellular density the total cell count were divided by total volume (4 x 0,1
µL), resulting in the following equation:
𝐶𝑒𝑙𝑙𝑢𝑙𝑎𝑟 𝐷𝑒𝑛𝑠𝑖𝑡𝑦 (𝑈/𝑚𝑙) =(𝑁º 𝑜𝑓 𝑐𝑒𝑙𝑙 𝑐𝑜𝑢𝑛𝑡/4) 𝑥 2 (𝑑𝑖𝑙𝑢𝑡𝑖𝑜𝑛 𝑓𝑎𝑐𝑡𝑜𝑟)
10000
Figure 5 – Counting grid of NC and four of the total nine squares marked in red
(Ansari et al., 2013).
3.3.2. Trypan Blue exclusion assay
3.3.2.1. Basis of the method
The dye exclusion test is based on the assumption that viable cells have an intact
membrane and consequently dyes cannot pass through it (Strober, 2001). Trypan blue
(TB) is a vital stain that gives a blue color to nonviable cells when observed under a
microscope, while viable cells appear unstained because nonviable cells does not have
the intact membrane and consequently, they are not able to control the entry of
macromolecule, letting trypan blue to pass through the cell (Stoddart, 2011).

16
3.3.2.2. Experimental procedure
Cell viability was determined by the TB exclusion assay. Briefly, 20 μL of sample (VH-R,
VH-L and CSF) were mixed 1:1 with trypan blue 0.4% in a microtube and gently mixed.
Then, 20 μL of the mixture were loaded into the hemocytometer chamber and the cells
observed and counted in an optical microscope under the 40x objective, according to the
manual counting procedure described by Stoddart (2011). This procedure was used for
subjects no. 1 to 10 (Table 2).
To calculate the percentage of cellular viability, the number of viable cells was divided by
the total number of cells and multiplied by 100.
𝐶𝑒𝑙𝑙𝑢𝑙𝑎𝑟 𝑣𝑖𝑎𝑏𝑖𝑙𝑖𝑡𝑦 (%) =𝑁º 𝑜𝑓 𝑣𝑖𝑎𝑏𝑙𝑒 𝑐𝑒𝑙𝑙 𝑐𝑜𝑢𝑛𝑡
𝑁º 𝑜𝑓 𝑡𝑜𝑡𝑎𝑙 𝑐𝑒𝑙𝑙 𝑐𝑜𝑢𝑛𝑡
To calculate the percentage of cellular death, the number of dead cells was divided by the
total number of cells count and multiplied by 100.
𝐶𝑒𝑙𝑙𝑢𝑙𝑎𝑟 𝑑𝑒𝑎𝑡ℎ (%) =𝑁º 𝑜𝑓 𝑑𝑒𝑎𝑑 𝑐𝑒𝑙𝑙 𝑐𝑜𝑢𝑛𝑡
𝑁º 𝑜𝑓 𝑡𝑜𝑡𝑎𝑙 𝑐𝑒𝑙𝑙 𝑐𝑜𝑢𝑛𝑡
3.4. Flow Cytometry
Flow cytometry (FC) methodology allows to count, examine and classify cells of any type
(including non-nucleated) in suspension and, since it allows to evaluate these parameters
simultaneously, it is currently designated by parametric flow cytometry. This technique has
a five element system: the radiation source, the flow chamber, the optical wavelength filter
units, the photomultipliers for sensitive detection and signal processing (allowing the
distinguishing of probes colors used to stain cells) and the data processing unit collecting
(Brown and Wittwer, 2000; Vermes et al., 2000).
In terms of operation it is based on the source of excitation radiation (in general laser) that
will intercept the suspended particle in the chamber and this particle undergoes forward
scattering (FSC) and in the lateral direction [side scattering (SSC)]. This frontal dispersion
is detected by the photomultipliers and the lateral dispersion is deflected 90° by optical
17
filters and focused on photomultipliers. Frontal dispersion is related to cell size and lateral
dispersion with internal complexity (e.g., granularity).
Probes emit radiation too, which associated with a certain internal complexity (SSC)
provides relevant information as the physiological state of the cell, among others (Brown
and Wittwer, 2000; Vermes et al., 2000).
3.4.1. A5-FITC and PI binding assay
3.4.1.1. Basis of the method
During the early phase of apoptosis, the intensity of the FSC signal decreases due to cell
dehydration, and consequent wrinkling. On the contrary, the SSC signal tends to increase
because the dehydrated cell further reflects and refracts the light. In more advanced
states of apoptosis the FSC decreases, like SSC, because the cells become smaller, and
also the ability to reflect and refract light decreases and there are apoptotic bodies being
formed (Hingorani et al., 2011; Wlodkowic et al., 2011).
Regarding the necrosis state, in the initial phase the primary necrotic cells have the same
behavior as cells in an advanced phase of apoptosis and apoptotic bodies, and they
cannot be distinguished from apoptotic cells only by taking into account these two
parameters (FSC and SSC). These parameters give a general idea of the state of the
cells present in the sample, but cannot be taken into account as reliable markers.
However, by combining these FC parameters with the staining with specific dyes it is
possible to identify and distinguish cells apoptosis and necrosis with less margin of error
(Hingorani et al., 2011; Wlodkowic et al., 2011).
When attempting to discriminate between apoptosis and necrosis, it is important to know
their characteristics and to interpret them in their association with the dyes used in the
analysis. In the case of apoptosis, the fact that cells keep intact their plasma membrane
until about 4h-6h makes them able to exclude propidium iodide (PI), unlike cells that are in
the state of cellular necrosis, which allow the dye to enter and to intersperse with DNA
and RNA (Arends et al., 1990; Hingorani et al., 2011).
A feature that distinguishes cells in apoptosis from viable cells is the presence of the
phospholipid component phosphatidylserine (PS) exposed on the outer surface of the cell
membrane, as opposed to what happens in viable cells, where this component is found

18
only on the inner surface of the membrane. This translocation of PS to the external
surface of the cell membrane is dependent on caspases, according to Fink and Cookson
(2005).
A5-FITC allows cells to be stained in apoptosis due to its binding to PS, thus
differentiating viable cells from apoptotic cells (Figure 6).
PI marks the cells in an advanced state of apoptosis and necrosis, allowing to distinguish
apoptotic cells from necrotic cells when associated with A5-FITC, as shown in Figure 6
(Hingorani et al., 2011).
Figure 6 – Diagram showing probes for detection of healthy, apoptotic and necrotic cells
(Hingorani et al., 2011).
3.4.1.2. Experimental procedure
A first step of the work consisted in the optimization of the analytical protocol. Samples 1
to 10 (Table 2) were used for this preliminary task.
The samples were centrifuged in 1.5 mL plastic microtubes at 22 °C, at 600 g and for 45
min in the case of VH-R and VH-L and for 15 min in the case of CSF. After centrifugation,

19
the supernatant was aspirated and the pellet was washed with 200 µL of incubation buffer
from A5-FITC kit and resuspended. For each sample, the cell suspension was divided by
two plastic microtubes (100 µL in each); one tube was labeled as “stained” and the other
one as “unstained”. To the “stained” ones, 2 µL of A5-FITC and 2 µL of PI were added. To
the “unstained” ones the equivalent volume of incubation buffer of the A5-FITC kit was
added. All samples were incubated for 15 min, protected from light. Afterwards, 500 µL of
incubation buffer were added to both tubes (“stained” and “unstained”). The content of
each tube was then totally transferred to cytometry tubes through filtration by FC filters.
The viability parameters, apoptosis and necrosis, were then analyzed by FC.
Fluorescence signals for each sample were collected using an Accuri™ C6 flow cytometer
(BD Biosciences). To restrict the analysis to cells of interest only, a polygon gate (P1) was
set according to their light scattering properties (in a forward scatter vs. side scatter plot),
thus excluding cell debris. To evaluate the % of cell debris among all samples a polygon
gate (P2) was set according to light scattering properties (in a forward vs. side scatter
plot) of cell debris.
Fluorescence signals of at least 5,000 and 10,000 cells were acquired for VH-R and VH-L
and of at least 25,000, 50,000 and 100,000 cells for CSF, both in logarithmic mode, and
the data were analyzed using the Accuri™ C6 flow cytometer software. The green
fluorescence due to A5–FITC was followed in channel 1 (FL1) and plotted as a histogram
of FL1 staining. Fluorescence due to the PI incorporation was followed in channel 3 (FL3).
Samples marked as “unstained” were analyzed before the “stained” ones, acting as
negative controls.
After this previous evaluation of the procedure, the following changes were made on the
protocol: a) VH samples from right and left eyeballs were mixed and analyzed together;
b) centrifugation was fixed at 600 g for 15 min for all the samples; c) fluorescence signals
was acquired for 10,000 cells for VH and 100,000 cells for CSF.
b) A5-FITC and PI binding assay
After the establishment of the optimal protocol, samples no. 11 to 31 (n=21) (Table 1)
were studied in this second phase of the work.

20
Cellular density was calculated by the following equation:
𝐶𝑒𝑙𝑙𝑢𝑙𝑎𝑟 𝐷𝑒𝑛𝑠𝑖𝑡𝑦 (𝑈/𝑚𝐿) =𝑁º 𝑜𝑓 𝑒𝑣𝑒𝑛𝑡𝑠
𝑣𝑜𝑙𝑢𝑚𝑒 𝑎𝑠𝑝𝑖𝑟𝑎𝑡𝑒𝑑 (𝑚𝑙)
To calculate the final percentage of apoptosis and necrosis, determined based on the
percentage of events in the quadrant Q2-LR (lower right) for apoptosis; and on the
percentage of events in the quadrant Q2-UR (upper right) for necrosis, of the FL3 (PI
staining) x FL1 (A5–FITC) channel dot plots, as displayed in Figure 13, the unstained
samples values were subtracted to those obtained for the stained ones.
3.5. Statistical analysis
Data statistics analysis were performed using GraphPad Prism™ 6.0 (GraphPad
Software, USA). Comparisons were made using the two-way analysis of variance
(ANOVA), followed by the Bonferroni's post-hoc test.

21
4. Results
4.1 Protocol optimization
4.1.1. Cellular density
The cellular density (cell counting) was determined by two distinct procedures: Neubauer
chamber – concomitantly to the TB assay and FC. The results obtained for the tested
samples (10 individuals = 28 samples: 10 VH-R, 10 VH-L and 8 CSF) during the
optimization of the analytical protocol are summarized in Table 2.
Table 2 – Cellular density (U/mL) in the tested samples (VH-R, VH-L and CSF) as determined with
NC and FC.
NA – Not analyzed (due to contamination with red blood cells). CSF – Cerebrospinal fluid; FC –
Flow cytometry; NC – Neubauer chamber; PMI – Postmortem interval; VH-L – Vitreous humor from
left eyeball; VH-R – Vitreous humor from right eyeball.
PMI (h)
Sample nº
Cellular density (U/mL)
NC FC
VH-R VH-L CSF VH-R VH-L CSF
14h45 8 5.00 x10⁴ 1.08 x10
6 1.13 x10
6 4.16 x10
4 2.08 x10
6 1.25 x10
7
14h55 10 1.50 x10⁵ 4.20 x10
5 1.02 x10
6 2.40 x10
4 6.76 x10
5 1.25 x10
7
26h25 2 7.15 x10⁵ 2.40 x10
5 NA 7.96 x10
4 1.19 x10
6 NA
32h20 3 8.00 x10⁴ 4.50 x10
4 5.95 x10
5 1.25 x10
7 8.33 x10
6 2.50 x10
7
34h55 1 1.38 x10⁴ 2.75 x10
4 1.68 x10
5 4.24 x10
5 4.63 x10
4 4.39 x10
5
35h05 4 4.75 x10⁵ 1.80 x10
5 4.00 x10
5 3.01 x10
4 5.10 x10
5 3.16 x10
5
60h10 5 3.45 x10⁵ 2.20 x10
5 NA 2.08 x10
5 2.61 x10
4 NA
62h00 6 6.40 x10⁵ 1.00 x10
5 5.60 x10
6 1.47 x10
6 2.32 x10
4 7.58 x10
5
63h00 7 1.35 x10⁵ 2.35 x10
5 2.86 x10
6 3.22 x10
4 6.10 x10
5 2.50 x10
7
69h55 9 9.50 x10⁴ 4.30 x10
5 2.25 x10
5 1.64 x10
5 3.57 x10
6 1.25 x10
6
22
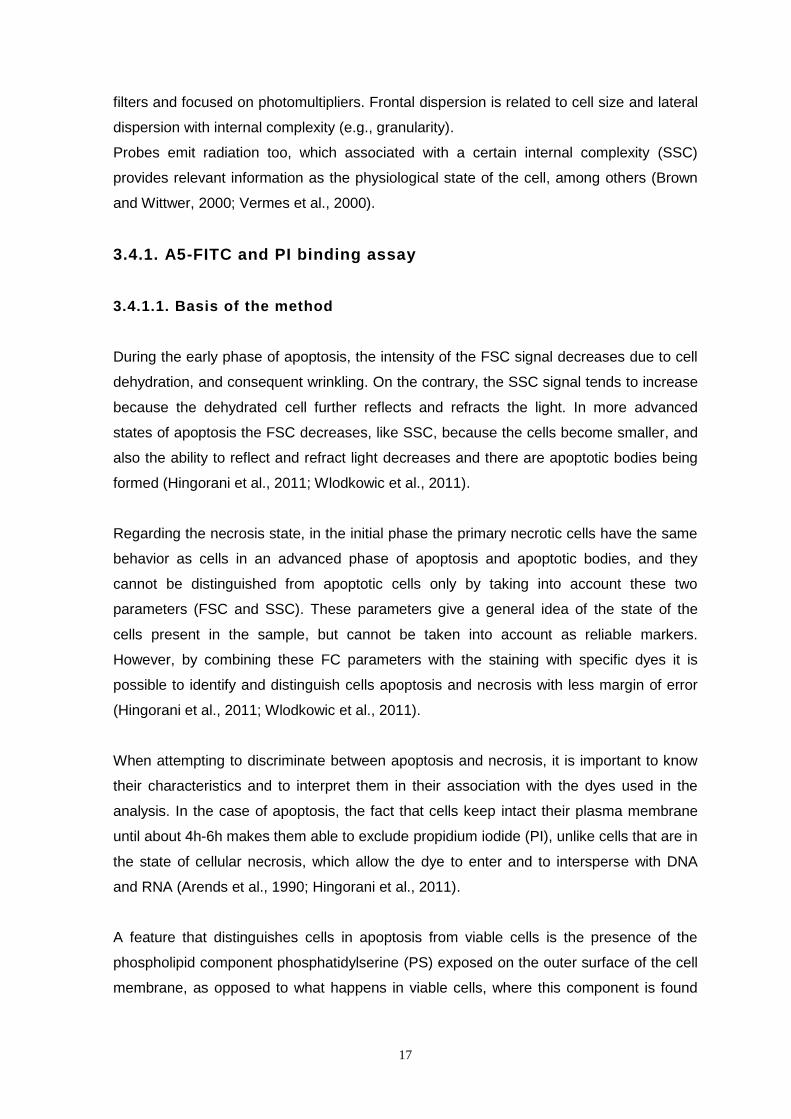
Generally, it was observed that cellular density values (number of cells / unit volume)
determined using the Neubauer chamber procedure were much lower than those obtained
by FC for the same samples (Table 2). As shown in Figure 7, the difference was
particularly noticeable for CSF.
Figure 7 – Cellular density (U/mL) for VH-R, VH-L and CSF as determined by NC and FC
procedures. CSF – Cerebrospinal fluid; FC – Flow cytometry; NC – Neubauer chamber; VH-L –
Vitreous humor from left eyeball; VH-R – Vitreous humor from right eyeball; ** p < 0.05, comparing
NC and FC methods for CSF cellular density. The values are given as the mean ± SEM (n = 10).
Table 2 data and Figure 7 also show that CSF presented a much higher cellular density
than both VH-R and VH-L.
In what concerns the correlation with PMI, it was not possible to perceive a clear pattern
of variation of cellular density over time. For NC data, it was observed a fluctuation of the
results for VH-R from 5x10⁴ U/mL for PMI = 14h45, to 9,50x10⁴ U/mL for PMI = 69h55,
with the maximum value of cellular density (7,15x10⁵ U/mL) for PMI = 26h25; and for CSF
from 1,13x10⁶ U/mL for PMI = 14h45 to 2,25x10⁵ U/mL for PMI = 69h55, with the
maximum value of 5.60x10⁶ U/mL for PMI = 62 h. The same fluctuant behavior was
observed for FC data for all matrices: in VH-R the values varied from 4,16x10⁴ U/mL for
PMI = 14h45 to 1,64x10⁵ U/mL for PMI = 69h55, with the maximum value of 1,25x10⁷
U/mL for PMI = 32h20 h; in VH-L varied from 2,08x10⁶ U/mL for PMI = 14h45 to 3,57x10⁶
U/mL for PMI = 69h55, with the maximum of 8,33x10⁶ U/mL for PMI = 32h20; and in CSF
varied from 1,25x10⁷ U/mL for PMI = 14h45 to 1,25x10⁶ U/mL for PMI = 69h55, with the
maximum of 2,50x10⁷ U/mL for PMIs = 32h20 and 63 h.
23
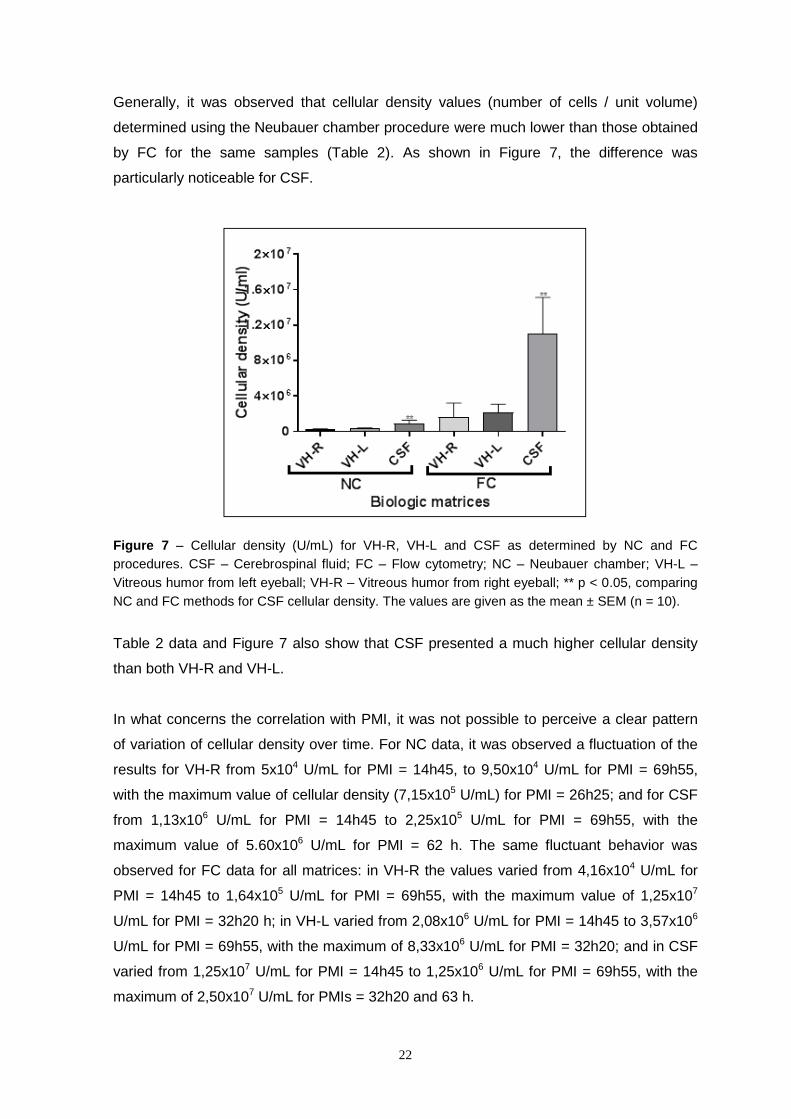
4.1.2. Cellular viability
The results obtained for the cellular viability for all the tested samples during protocol
optimization (n = 30 samples; 10 VH-R, 10 VH-L and 8 CSF) with both the TB assay (with
NC cell counting) and FC are summarized in Table 3.
Table 3 – Cellular viability (%) for VH-R, VH-L and CSF as determined by TB assay and FC.
PMI (h) Sample
nº
Cellular viability (%)
TB FC
VH-R VH-L CSF VH-R VH-L CSF
14h45 8 0.00 31.16 82.22 0.00 31.16 82.22
14h55 10 13.33 0.00 89.71 13.33 0.00 89.71
26h25 2 5.59 37.50 NA 5.59 37.50 NA
32h20 3 37.50 100.00 41.18 37.50 100.00 41.18
34h55 1 52.92 67.86 51.40 52.92 67.86 51.40
35h05 4 48.42 16.67 23.75 48.42 16.67 23.75
60h10 5 15.94 6.82 NA 15.94 6.82 NA
62h00 6 13.28 15.00 87.67 13.28 15.00 87.67
63h00 7 62.96 40.43 91.26 62.96 40.43 91.26
69h55 9 10.53 46.51 80.00 10.53 46.51 80.00
NA – Not analyzed (due to contamination with red blood cells). CSF – Cerebrospinal fluid; FC –
Flow cytometry; PMI – Postmortem interval; TB – Trypan blue assay (with Neubauer chamber cell
counting); VH-L – Vitreous humor from left eyeball; VH-R – Vitreous humor from right eyeball.
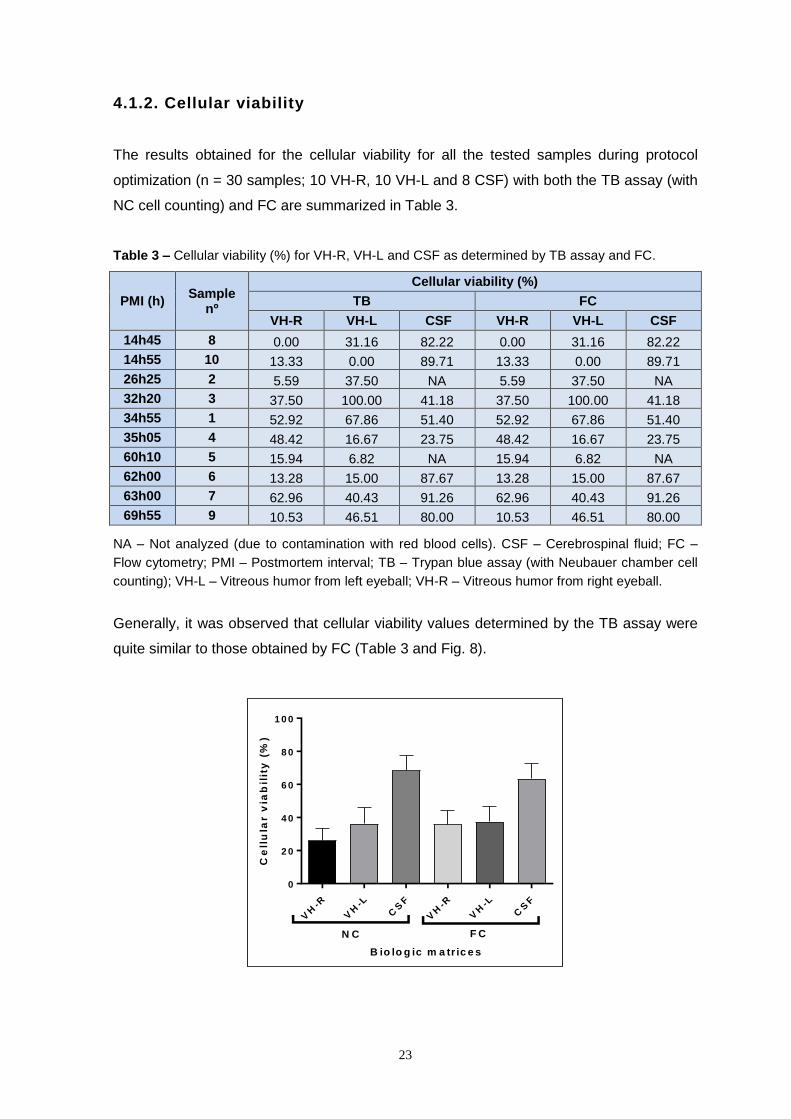
Generally, it was observed that cellular viability values determined by the TB assay were
quite similar to those obtained by FC (Table 3 and Fig. 8).
B io lo g ic m a tr ic e s
Ce
llu
lar v
iab
ilit
y (
%)
VH
-R
VH
-L
CS
F
VH
-R
VH
-L
CS
F
0
2 0
4 0
6 0
8 0
1 0 0
N C F C
24
Figure 8 – Cellular viability (%) in VH-R, VH-L and CSF as determined by NC and FC procedures.
CSF – Cerebrospinal fluid; FC – Flow cytometry; TB – Trypan blue assay ((with Neubauer chamber
cell counting); VH-L – Vitreous humor from left eyeball; VH-R – Vitreous humor from right eyeball;
** p < 0.05, comparing NC and FC procedures for CSF cellular density. The values are given as the
mean ± SEM (n = 10).
Table 3 and Figure 8 also clearly show that CSF presented higher levels of cellular
viability than VH-R and VH-L, as evaluated by both NC-TP and FC procedures.
4.2 Samples analysis
After this initial study on methodological aspects, FC was selected to continue the work.
Also, due to their low cell count, it was decided to mix the VH samples from left and right
eyeballs of the same individual to increase the final sample volume. The work continued
with the analysis of n=21 VH samples and n=17 CSF samples (4 CSF samples were
excluded due to contamination with red blood cells), and the following parameters were
studied: i) cellular density; ii) cells of interest and cellular debris; iii) cellular viability, and
iv) apoptosis and necrosis. The results are presented below.
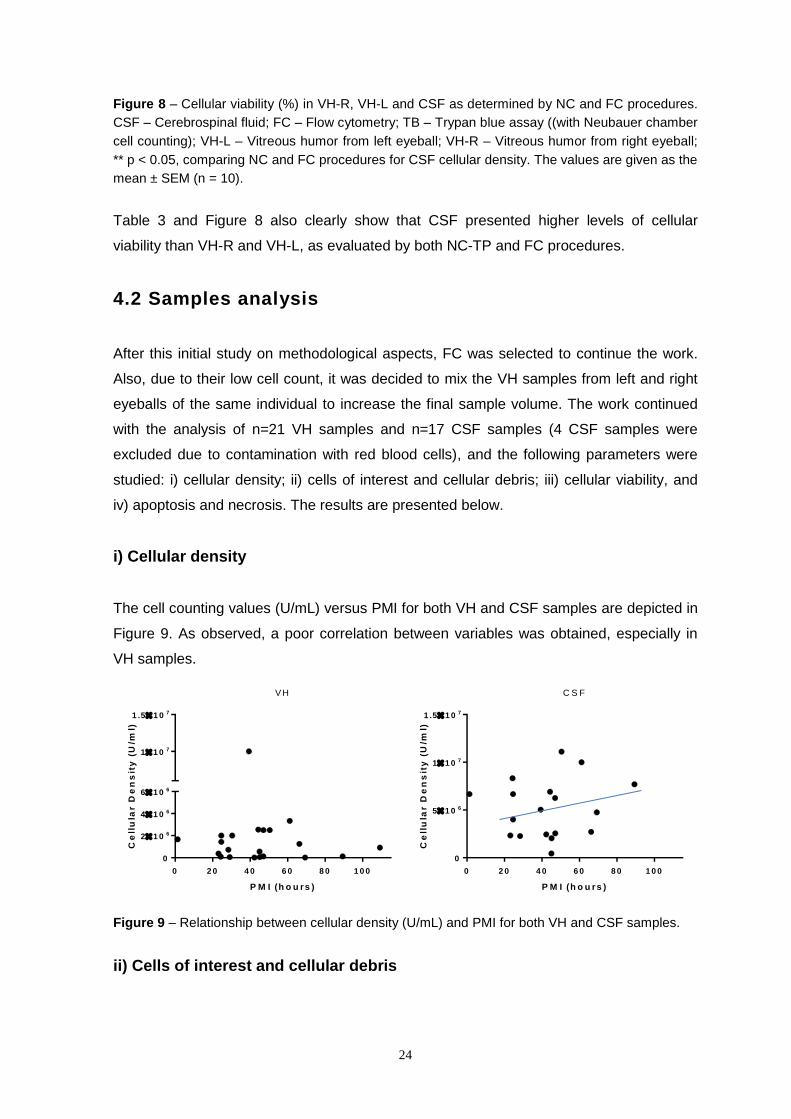
i) Cellular density
The cell counting values (U/mL) versus PMI for both VH and CSF samples are depicted in
Figure 9. As observed, a poor correlation between variables was obtained, especially in
VH samples.
Figure 9 – Relationship between cellular density (U/mL) and PMI for both VH and CSF samples.
ii) Cells of interest and cellular debris
0 2 0 4 0 6 0 8 0 1 0 0
0
51 0 6
11 0 7
1 .51 0 7
P M I (h o u rs )
Ce
llu
lar D
en
sit
y (
U/m
l)
C S F
0 2 0 4 0 6 0 8 0 1 0 0
0
21 0 6
41 0 6
61 0 6
11 0 7
1 .51 0 7
P M I (h o u rs )
Ce
llu
lar D
en
sit
y (
U/m
l)
VH

25
Representative dot plots of FC analysis of two samples [a) VH sample no. 24; b) CSF
sample no. 20] are depicted in Figure 10.
The “cells of interest” and the “cellular debris” were defined, according to their size and
complexity, through the polygon gates P1 and P2, respectively (drawn in red in the SSC
vs. FSC dot plots shown in Figure 10).
Figure 10 – Representative FC dot plots of SSC (Y-axis) and FSC (X-axis) parameters for a VH (a)
and a CSF (b) samples.
For VH samples, the results obtained (P1 – cells of interest and P2 – cellular debris
percentages) were related to the correspondent PMI as shown in Figure 11.
Figure 11 – Relationship between the parameter %P1 (cells of interest), %P2 (cellular debris) and
PMI for VH samples.
a) b)

26
The values of %P1 for VH samples (Figure 11, left) varied from a minimum of 8.87% for
PMI = 28h35 to a maximum of 57.76% for PMI = 66h20.
The values of %P2 for VH samples (Figure 11, right) varied from a minimum of 37.76% at
PMI = 24h31 to a maximum of 88.32% at PMI = 28h35.
The data showed a random scatter not dependent on PMI.
A similar graphic representation of the results obtained for CSF samples (P1 – cells of
interest; P2 – cellular debris percentages) as a function of PMI is depicted in Figure 12.
Figure 12 – Relationship between the parameter %P1 (cells of interest), %P2 (cellular debris) and
PMI for CSF samples.
The most interesting finding is the quite similar data pattern between CSF and VH. Again,
the %P1 values showed a clear tendency for increased cell levels with increased PMI (in
the range 20-70 hours), and %P2 values showed an inverse relation with increased PMI
(in the range 20-70 hours), in comparison with %P1. However, CSF samples presented a
much higher %P1 (cells of interest) and lower %P2 (cellular debris) than VH.
iii) Cellular viability
The percentage of viable cells in CSF and VH samples was determined based on the
percentage of events at quadrants Q1-LL or Q2-LL (lower left) in FL3 x FL1 dot plots (as
displayed in Figure 14).
The relationship between the obtained data and PMI is shown on Figure 13.
27
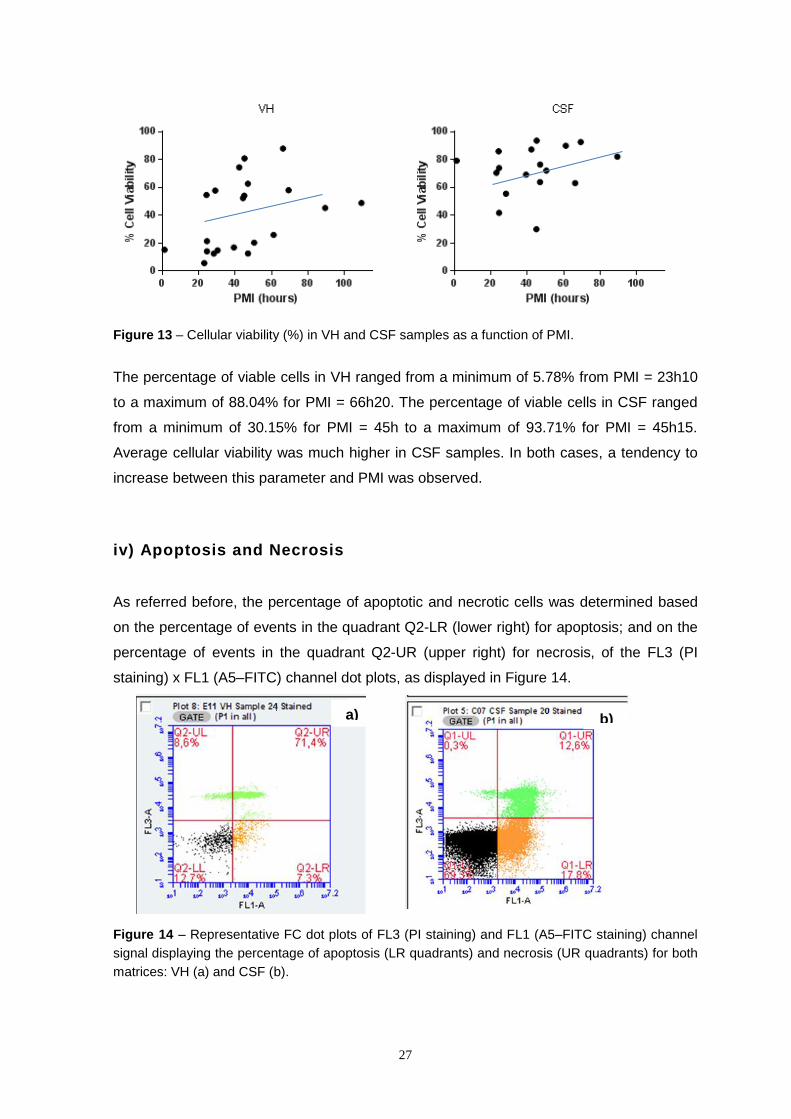
Figure 13 – Cellular viability (%) in VH and CSF samples as a function of PMI.
The percentage of viable cells in VH ranged from a minimum of 5.78% from PMI = 23h10
to a maximum of 88.04% for PMI = 66h20. The percentage of viable cells in CSF ranged
from a minimum of 30.15% for PMI = 45h to a maximum of 93.71% for PMI = 45h15.
Average cellular viability was much higher in CSF samples. In both cases, a tendency to
increase between this parameter and PMI was observed.
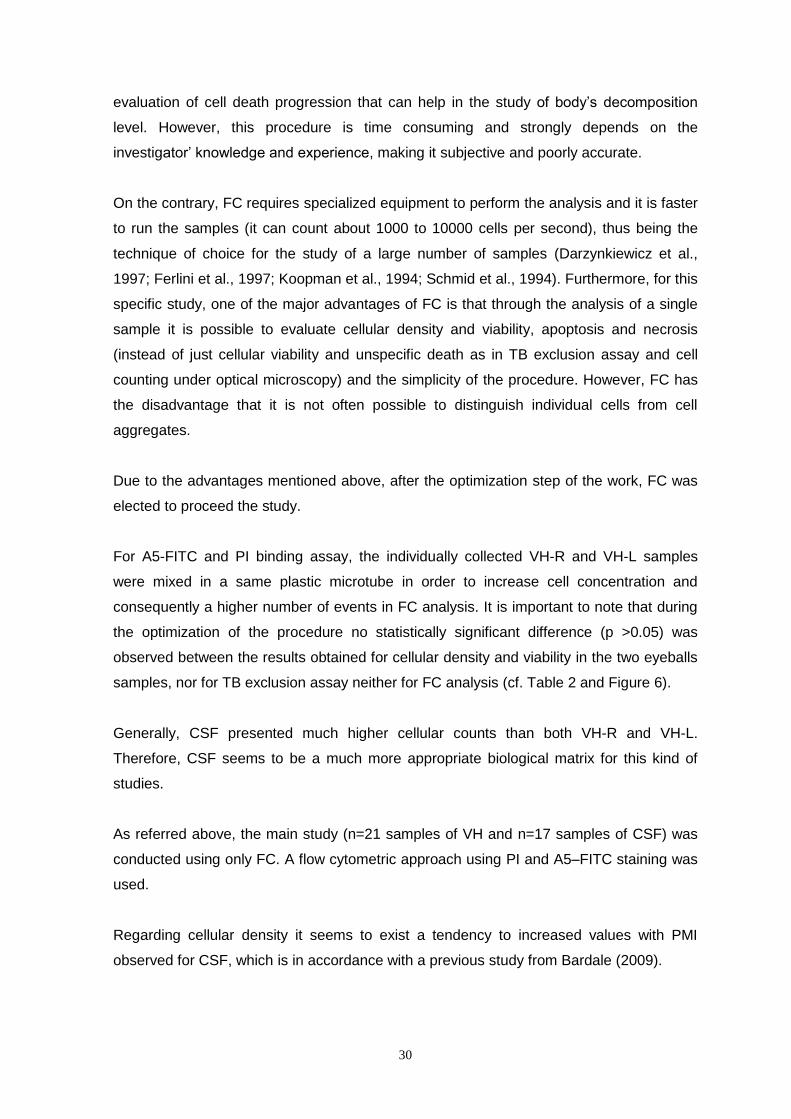
iv) Apoptosis and Necrosis
As referred before, the percentage of apoptotic and necrotic cells was determined based
on the percentage of events in the quadrant Q2-LR (lower right) for apoptosis; and on the
percentage of events in the quadrant Q2-UR (upper right) for necrosis, of the FL3 (PI
staining) x FL1 (A5–FITC) channel dot plots, as displayed in Figure 14.
Figure 14 – Representative FC dot plots of FL3 (PI staining) and FL1 (A5–FITC staining) channel
signal displaying the percentage of apoptosis (LR quadrants) and necrosis (UR quadrants) for both
matrices: VH (a) and CSF (b).
a) b)

28
a) Apoptosis
The percentage of apoptosis in VH (Figure 15, left) varied from a minimum of 7.10% for
PMI = 47h04 to a maximum of 92.98% for PMI = 23h10. In CSF the percentage of
apoptosis was somewhat lower (Figure 15, right). The percentage varied from a minimum
of 3.91% for PMI = 47h04 to a maximum of 65.33% for PMI = 45h.
A tendency for increasing values with PMI was observed for VH samples but not for CSF,
where the tendency was to decrease along PMI.
Figure 15 – Percentage of apoptotic cells in VH and CSF samples as a function of PMI.
b) Necrosis
The percentage of necrotic cells in VH and CSF samples are depicted in Figure 16. For
VH (Figure 16, left) the values ranged from 0% for PMI = 23h10 to a maximum of 71.03%
for PMI = 47h04. The highest values were found for PMI between 20-50 h, but no
correlation with PMI was observed. In CSF (Figure 16, right) the percentage of necrosis
was significantly lower (maximum of 14.38%), even at high PMI values (<15%), but an
even random data scatter was observed.
Figure 16 – Percentage of necrotic cells in VH and CSF samples as a function of PMI.

29
5. Discussion and Conclusions
In criminal investigation, PMI is an important parameter to be determined and a lot of
studies have been performed to achieve this goal, such as biochemical studies of markers
in bone marrow and other organs (which may be cells or proteins), immunohistochemical,
with DNA/RNA, entomological and in bone remains, as reviewed by Hayman and
Oxenham (2016). However, and according to our knowledge, no one has developed a
sufficient accurate method to be used in daily forensic routine. Therefore, the pursuing to
new methods and studies continues to be of paramount interest in this field.
Bardale (2009) performed a study with CSF to evaluate the alterations on the cells
present in this matrix over time. The author concluded that the number of cells in this
biological fluid increases over time after death and that up to 12 hours it was possible to
identify the presence of different cell types, such as lymphocytes, neutrophils and
monocytes, but after this period the identification / classification becomes very difficult. It
should be noted that the samples used in the abovementioned work were collected by
cisternal puncture, and from brain ventricles, and this may justify some differences
regarding total cell counts.
In the present work two different biologic matrices, VH and CSF, collected from human
corpses during autopsy procedures were studied. The main reasons to choose these
matrices were: its anatomical location – more protected from decomposition than for e.g.
blood samples and organs in general; no special sample pretreatment required; the
different biochemical composition of each one (thus eventually allowing to obtain different
information from each one); the fact that they are commonly used in other studies; and
finally the fact they are easy to collect in medical autopsies.
The main objective of this study, as referred before, was to evaluate if PMI could be
estimated through the analysis of cell death progression in the cells present in two
biological matrices with different biochemical composition: VH and CSF. Different
parameters were studied, such as cellular density and viability, apoptosis and necrosis. To
achieve this goal, TB exclusion assay (with cell counting in Neubauer chamber under
optical microscopy) and a FC approach using PI and A5–FITC staining were used.
TB exclusion test is an inexpensive method and does not require special equipment. It
enables to obtain both quantitative and qualitative results and a quite convenient
30
evaluation of cell death progression that can help in the study of body’s decomposition
level. However, this procedure is time consuming and strongly depends on the
investigator’ knowledge and experience, making it subjective and poorly accurate.
On the contrary, FC requires specialized equipment to perform the analysis and it is faster
to run the samples (it can count about 1000 to 10000 cells per second), thus being the
technique of choice for the study of a large number of samples (Darzynkiewicz et al.,
1997; Ferlini et al., 1997; Koopman et al., 1994; Schmid et al., 1994). Furthermore, for this
specific study, one of the major advantages of FC is that through the analysis of a single
sample it is possible to evaluate cellular density and viability, apoptosis and necrosis
(instead of just cellular viability and unspecific death as in TB exclusion assay and cell
counting under optical microscopy) and the simplicity of the procedure. However, FC has
the disadvantage that it is not often possible to distinguish individual cells from cell
aggregates.
Due to the advantages mentioned above, after the optimization step of the work, FC was
elected to proceed the study.
For A5-FITC and PI binding assay, the individually collected VH-R and VH-L samples
were mixed in a same plastic microtube in order to increase cell concentration and
consequently a higher number of events in FC analysis. It is important to note that during
the optimization of the procedure no statistically significant difference (p >0.05) was
observed between the results obtained for cellular density and viability in the two eyeballs
samples, nor for TB exclusion assay neither for FC analysis (cf. Table 2 and Figure 6).
Generally, CSF presented much higher cellular counts than both VH-R and VH-L.
Therefore, CSF seems to be a much more appropriate biological matrix for this kind of
studies.
As referred above, the main study (n=21 samples of VH and n=17 samples of CSF) was
conducted using only FC. A flow cytometric approach using PI and A5–FITC staining was
used.
Regarding cellular density it seems to exist a tendency to increased values with PMI
observed for CSF, which is in accordance with a previous study from Bardale (2009).

31
Regarding “cells of interest” (P1) and “cellular debris” (P2), no conclusions can be drawn.
An inverse relationship was expected between these parameters because they are
complementary. For VH samples there was no direct relationship with PMI neither for P1
nor for P2, but P2 percentages were much higher than P1 in this matrix. For CSF samples
(Figure 12), an inverse relationship between “cells of interest” (P1) and “cellular debris”
(P2) was observed. P1 tended to increase with PMI, and according to Bardale (2009), this
may be due to the migration of cells to CSF during the first hours after death.
The % of cellular viability in VH seemed to increase but in two parallel lines, reflecting a
great inter-individual variability. Therefore a common model cannot be assumed. For CSF
this tendency to increased values with PMI was also observed, with a higher correlation
coefficient (Figure 13).
The parameter % apoptosis showed a conflicting tendency (to decrease with PMI in CSF
and to increase in VH). The % necrosis showed no tendency for both matrices. The data
were random scatter with no relationship to PMI.
In summary, this study showed that the flow cytometric approach used (involving PI and
A5–FITC staining) has potential to generate important information regarding cellular
changes after death. However, no direct correlation was found between any of the
parameters tested (related to progression of cell death) and PMI.
The present work has as major limitation which is the absence of an exact knowledge of
the PMI of each individual studied (because of the absence of exact information about the
time at which the dead occurred). So, this study needs to be continued in order to
increase the number of analyzed individuals and to extend the range of PMI studied.
In future works it is important to consider the possibility of study individuals who died at
hospitals, in controlled environmental conditions which would allow more accurate time of
dead determination.
Looking to the literature, this study was pioneer in using FC analysis to evaluate the
progression of cell death overtime in VH and CSF in order to use this approach in the
future to estimate PMI.
32
6. References
Angi M, Kalirai H, Coupland SE, Damato BE, Semeraro F and Romano MR (2012) Proteomic Analyses of the Vitreous Humour. Mediators of Inflammation 2012:7.
Ansari N, Müller S, Stelzer E and Pampaloni F (2013) Quantitative 3D Cell-Based Assay Performed with Cellular Spheroids and Fluorescence Microscopy.
Arends MJ, Morris RG and Wyllie AH (1990) Apoptosis. The role of the endonuclease. The American Journal of Pathology 136:593-608.
Bardale R (2009) Evaluation of cerebrospinal fluid cells in postmortem period to estimate death interval. J Indian Acad Forensic Med 31:3.
Bate-Smith EC and Bendall JR (1947) Rigor mortis and adenosine-triphosphate. The Journal of Physiology 106:177-185.
Beran RG (2010) What is legal medicine--are legal and forensic medicine the same? Journal of forensic and legal medicine 17:137-139.
Bévalot F, Cartiser N, Bottinelli C, Fanton L and Guitton J (2016) Vitreous humor analysis for the detection of xenobiotics in forensic toxicology: a review. Forensic Toxicology 34:12-40.
Brown M and Wittwer C (2000) Flow cytometry: principles and clinical applications in hematology. Clinical chemistry 46:1221-1229.
Clark M, Worrell M and Pless J (1997) Postmortem Changes in Soft Tissues, in Forensic Taphonomy: The Post-mortem Fate of Human Remains (Haglund WD, Sorg, M.H. ed) pp 151-164, CRC Press.
Damkier HH, Brown PD and Praetorius J (2013) Cerebrospinal Fluid Secretion by the Choroid Plexus. Physiological Reviews 93:1847-1892.
Darzynkiewicz Z, Juan G, Li X, Gorczyca W, Murakami T and Traganos F (1997) Cytometry in cell necrobiology: analysis of apoptosis and accidental cell death (necrosis). Cytometry 27:1-20.
Escobar-Sánchez ML, Sánchez-Sánchez L and Sandoval-Ramírez J (2015) Steroidal Saponins and Cell Death in Cancer, in Cell Death - Autophagy, Apoptosis and Necrosis (Ntuli TM ed) p Ch. 15, InTech, Rijeka.
Ferlini C, Kunkl A, Scambia G and Fattorossi A (1997) The use of Apostain in identifying early apoptosis. Journal of immunological methods 205:95-101.
Fink SL and Cookson BT (2005) Apoptosis, pyroptosis, and necrosis: mechanistic description of dead and dying eukaryotic cells. Infection and immunity 73:1907-1916.
Forbes SL (2008) Decomposition Chemistry in a Burial Environment, in Soil Analysis in Forensic Taphonomy pp 203–223.
Gill-King H (1997) Chemical and Ultrastructural Aspects of Decomposition, in Forensic Taphonomy: The Postmortem Fate of Human Remains (Haglund WD and Sorg MH eds) pp 93-108, CRC Press.
Green DR (2017) Cell death and the immune system: getting to how and why. Immunological Reviews 277:4-8.
Hayman J and Oxenham M (2016) Human Body Decomposition, Academic Press, Australia. Hingorani R, Deng J, Elia J, McIntyre C and Mittar D (2011) Detection of apoptosis using the BD
annexin V FITC assay on the BD FACSVerse™ system. Johanson C, Stopa E, Baird A and Sharma H (2011) Traumatic brain injury and recovery
mechanisms: peptide modulation of periventricular neurogenic regions by the choroid plexus-CSF nexus. Journal of neural transmission (Vienna, Austria : 1996) 118:115-133.
Kerr JF, Wyllie AH and Currie AR (1972) Apoptosis: a basic biological phenomenon with wide-ranging implications in tissue kinetics. British Journal of Cancer 26:239-257.

33
Kobayashi M, Ikegaya H, Takase I, Hatanaka K, Sakurada K and Iwase H (2001) Development of rigor mortis is not affected by muscle volume. Forensic science international 117:213-219.
Koopman G, Reutelingsperger CP, Kuijten GA, Keehnen RM, Pals ST and van Oers MH (1994) Annexin V for flow cytometric detection of phosphatidylserine expression on B cells undergoing apoptosis. Blood 84:1415-1420.
Krompecher T (1981) Experimental evaluation of rigor mortis V. Effect of various temperatures on the evolution of rigor mortis. Forensic science international 17:19-26.
Lee Goff M (2009) Early post-mortem changes and stages of decomposition in exposed cadavers. Experimental & applied acarology 49:21-36.
Madea B and Kernbach-Wighton G (2013) Early and Late Postmortem Changes A2 - Siegel, Jay A, in Encyclopedia of Forensic Sciences (Saukko PJ and Houck MM eds) pp 217-228, Academic Press, Waltham.
Mathur A and Agrawal YK (2011) An overview of methods used for estimation of time since death. Australian Journal of Forensic Sciences 43:275-285.
Perper JA (2006) Time of death and changes after death. Spitz and Fisher's Medico Legal Investigation of Death:107-108.
Prieto J, Magana C and Ubelaker D (2004) Interpretation of Postmortem Change in Cadavers in Spain.
Puntis M, Reddy U and Hirsch N (2016) Cerebrospinal fluid and its physiology. Anaesthesia & Intensive Care Medicine 17:611-612.
Purves D, Fitzpatrick D, Katz LC, Lamantia AS, McNamara JO, Williams SM and Augustine GJ (2001) Neuroscience, Sinauer Associates.
Remington LA (2011) Clinical Anatomy of the Visual System E-Book, Elsevier Health Sciences. Sachdeva N, Rani Y, Singh R and Murari A (2011) Estimation of Post-Mortem Interval from the
Changes in Vitreous Biochemistry. J Indian Acad Forensic Med 33:171-174. Saukko P and Knigth B (2004) Forensic Pathology, Edward Arnold, London. Schmid I, Uittenbogaart CH, Keld B and Giorgi JV (1994) A rapid method for measuring apoptosis
and dual-color immunofluorescence by single laser flow cytometry. Journal of immunological methods 170:145-157.
Spector R, Robert Snodgrass S and Johanson CE (2015) A balanced view of the cerebrospinal fluid composition and functions: Focus on adult humans. Experimental Neurology 273:57-68.
Stoddart MJ (2011) Cell viability assays: introduction. Methods in molecular biology (Clifton, NJ) 740:1-6.
Stratchko L, Filatova I, Agarwal A and Kanekar S (2016) The Ventricular System of the Brain: Anatomy and Normal Variations. Seminars in ultrasound, CT, and MR 37:72-83.
Strober W (2001) Trypan blue exclusion test of cell viability. Current protocols in immunology. Tenreiro MM, Ferreira R, Bernardino L and Brito MA (2016) Cellular response of the blood-brain
barrier to injury: Potential biomarkers and therapeutic targets for brain regeneration. Neurobiology of Disease 91:262-273.
Ubelaker DH and Zarenko KM (2011) Adipocere: What is known after over two centuries of research. Forensic science international 208:167-172.
Vanezis P and Trujillo O (1996) Evaluation of hypostasis using a colorimeter measuring system and its application to assessment of the post-mortem interval (time of death). Forensic science international 78:19-28.
Vermes I, Haanen C and Reutelingsperger C (2000) Flow cytometry of apoptotic cell death. Journal of immunological methods 243:167-190.
Wlodkowic D, Telford W, Skommer J and Darzynkiewicz Z (2011) Apoptosis and Beyond: Cytometry in Studies of Programmed Cell Death. Methods in Cell Biology 103:55-98.
34
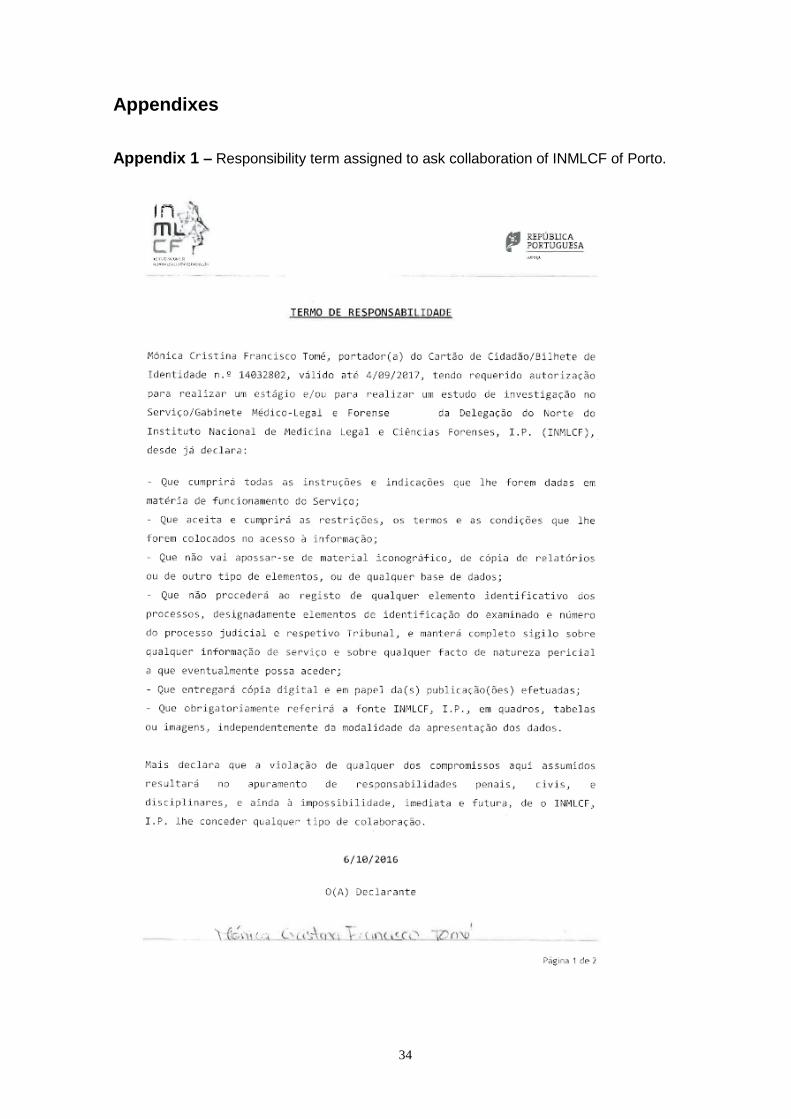
Appendixes
Appendix 1 – Responsibility term assigned to ask collaboration of INMLCF of Porto.
35
Appendix 2 – Authorization of INMLCF of Porto to collaborate in the study.