estimation of the future rates of oil and gas … · estimation of the future rates of oil and gas...
TRANSCRIPT

Estimation of the Future Rates of Oil and Gas Discoveries in the Western Gulf of Mexico
GEOLOGICAL SURVEY PROFESSIONAL PAPER 1252

Estimation of the Future Rates of Oil and Gas Discoveries in the Western Gulf of MexicoBy L. J. DREW, J. H. SCHUENEMEYER, and W. J. BAWIEC
GEOLOGICAL SURVEY PROFESSIONAL PAPER 1252
A discovery-process model adapted to forecast future rates of oil and gas discoveries under the conditions of economic truncation
UNITED STATES GOVERNMENT PRINTING O FFI CE, W ASH I N GT O N: 1 9 8 2
UNITED STATES DEPARTMENT OF THE INTERIOR
JAMES G. WATT, Secretary
GEOLOGICAL SURVEY
Dallas L. Peck, Director
Library of Congress Cataloging in Publication Data
Drew, Lawrence J.Estimation of the future rates of oil and gas discoveries in the western Gulf of Mexico.
(U.S. Geological Survey professional paper ; 1252)Bibliography: p.1. Petroleum in submerged lands Mexico, Gulf of Mathematical models. 2. Gas, Natural, in submerged lands Mexico,
Gulf of Mathematical models. 3. Prospecting Mexico, Gulf of Mathematical models. I. Schuenemeyer, J. H.n. Bawiec, W. J. HI. Title. IV. Series: Geological Survey professional paper ; 1252.
TN872.A5D73 553.2 (8W726 81-6768AACR2
______________ _____ ___ _____________________________Rev.
For sale by the Superintendent of Documents, U.S. Government Printing OfficeWashington, D.C. 20402

CONTENTS
Introduction Compiling the exploratory-well data file Analyzing the historical rates of discovery
Overall discovery rateDiscovery rates for each size class
Partitioning the data
Page
1 1 1 3 3
- 7 9
Page
Estimating the parameters of the discovery-
Estimating the parameters for theMiocene-Pliocene trend 16
Estimating the parameters of thediscovery-process model Continued
Estimating the incremental future rates of oil and gas field discoveries in the Miocene-Pliocene trend
Estimating the parameters for the Pleistocene trend
Estimating the incremental future ratesof oil and gas field discoveries in thePleistocene trend -
Conclusions References cited -
22
23
242526
ILLUSTRATIONS
Page
FIGURE 1. Map showing location of our study area in the Gulf of Mexic2. Graph showing rate of discovery of oil and gas in our study area in the Gulf of Mexico in both State and Federal waters
3-4. Graphs showing cumulative volume of oil and gas discovered on Federal Outer Continental Shelf acreage in our study area in the Gulf of Mexico on which leases were sold by February 4, 1975:
3. Volume reported as barrels of oil equivalent per cumulative number of leases 54. Volume reported as barrels of oil equivalent per cumulative number of wildcat wells 6
5. Graph showing relationship between the number of wildcat wells drilled per lease and the cumulative number of leasesdrilled in our study area in the Gulf of Mexico 7
6-9. Graphs showing cumulative number of oil and gas fields discovered by December 31, 1976, in our study area in the Gulfof Mexico in combined State and Federal waters 0-200 m deep in size-classes:
6. 15-19
8. 10-13 -9. 3-9 -
10. Map showing geographic locations of the offshore geologic trend areas in our study area in the Gulf of Mexico
8 9 10 11 12
11-13. Graphs showing cumulative number of oil and gas fields discovered in the Miocene-Pliocene trend of the study area in the Gulf of Mexico in combined State and Federal waters 0-200 m deep in size-classes:
13. 9-11 15
14-15. Graphs showing cumulative number of oil and gas fields discovered in the Pleistocene trend of the study area in the Gulf of Mexico in waters 0-200 m deep in size-classes:
16. Graph showing size distribution of oil and gas fields discovered in the Miocene-Pliocene trend of the study area in combined State and Federal waters 0-200 m deep 19
m

w CONTENTS
Page
FIGURE 17. Graph showing size-class-by-size-class increase in ultimate frequencies of oil and gas fields in the 0-5,000-foot depthinterval of the Permian basin 20
18. Schematic diagram of the method used to estimate the part of the field-size distribution below the historical level ofeconomic truncation 21
TABLES
Page
TABLE 1. Layout of the data file on exploratory wells drilled during 1945-78 offshore Texas and Louisiana in the Gulf of Mexico 22. Description of deposit-size classes 7
3. Summary data and estimates of the ultimate number of oil and gas fields by class size and contained resources for theMiocene-Pliocene trend of the study area 17
4. Forecasted future number of discoveries per increment of 200 wildcat wells drilled in the Miocene-Pliocene trend of thestudy area 23
5. Summary data and estimates of the ultimate number of oil and gas fields by class size and contained resources for thePleistocene trend of the study area 24
6. Forecasted future number of discoveries per increment of 200 wildcat wells drilled in the Pleistocene trend ofthe study area 25

ESTIMATION OF THE FUTURE RATES OF OIL AND GAS DISCOVERIESIN THE WESTERN GULF OF MEXICO
By L. J. DREW, J. H. ScHUENEMEYER1 , and W. J. BAWIEC
ABSTRACT
A discovery-process model was used to predict, as of January 1, 1977, the expected number and size distribution of oil and gas fields remaining to be discovered in the study area in the Gulf of Mexico and also to forecast the rate at which these fields will be discovered in the future. These predictions and forecasts were done separately for the combined Miocene-Pliocene trend area, which occupies 123,027 km* of the study area, and the Pleistocene trend area, which occupies 33,612 km*. In both these areas, water depths ranged from 0 to 200m.
As of January 1,1977, more than 2,700 oil and gas fields were still expected to be discovered in both trends. These fields range in size from 0.76 million to 194.3 million barrels of producible oil equiv alent. Most of these fields (94.5 percent) are predicted to contain less than 12.14 million BOE (barrels of oil equivalent) each. The rate at which these oil and gas fields will be discovered is forecasted to start at approximately 1.25 million BOE per wildcat well. This rate is forecasted to decline to about half this yield per wildcat well after the drilling of 2,600 wildcat wells in the combined Miocene-Pliocene trend area and 1,200 wildcat wells in the Pleistocene trend area.
Analysis of data from areas where exploration has been relatively unrestricted indicates that the size distribution of oil and gas fields has a log-geometric form. As a result of this analysis, a new pro cedure was devised to estimate the form of the underlying size dis tribution of oil and gas fields in areas, such as the study area, where the discovery-data series has been truncated by economic factors.
INTRODUCTION
The purpose of this study was to devise a model to forecast the rate at which oil and gas fields will be discovered in the study area in the Gulf of Mexico. The study area is off Texas and Louisiana and covers 156,639 km2 in which water depths are as great as 200 m (fig. 1). Making a forecast for this region is more com plicated than making a similar forecast for a typical onshore basin. These complications arise because ex ploration for oil and gas in the Gulf of Mexico has been both geographically and temporally restrained by eco nomic, technical, legal, and philosophy-of-exploration factors. As a consequence of these restraints, the his-
U.S. Geological Survey and University of Delaware, Newark, Del. 19711.
torical rate for discovery of oil and gas (historical time profile of discoveries) in this region is atypical. This rate of discovery differs from the normal rate of dis covery characteristic of most onshore basins and even such offshore basins as the North Sea in that it has re mained at a high and approximately constant level for nearly the entire 30-year history of exploration in the Gulf of Mexico. This rate of discovery is constant whether expressed as barrels of oil equivalent (BOE) discovered per wildcat well or as 30E discovered per lease drilled.
In this paper, we describe the exploratory-well data file, the discovery history, our partitioning of the data, and how we compensated for the complications in the discovery-data series in adapting the Arps-Roberts (1958) discovery-process model to predict the ultimate number of oil and gas fields existing in the study area and the rate at which the remaining fields will be dis covered after January 1, 1977. The adaptations of the model can be used for other areas where exploration has been restricted.
COMPILING THE EXPLORATORY-WELL DATA FILE
An exploratory-well data file was compiled covering the 1945-78 period of exploratory drilling in the off shore Louisiana and Texas parts of the Gulf of Mexico. Many source documents were used in the compilation including the International Oil and Gas Scouts Asso ciation yearbooks; Petroleum Information, Inc., well- history file; the AAPG (American Association of Petro leum Geologists) Bulletin, North American develop ment issues; and studies of offshore oil and gas fields published by various professional societies. The file in cludes specific data on each exploratory well drilled during the 1945-78 period; in addition, wildcat wells that discovered new fields were identified, and the volumes of producible oil and gas contained in the

FUTURE RATES OF OIL AND GAS DISCOVERIES, WESTERN GULF OF MEXICO
TEXAS
GULF OF MEXICO
100 KILOMETERS
FIGURE 1. Location of our study area in the Gulf of Mexico.
fields that they discovered were noted. Estimates of the ultimate field productivities on the federally owned acreage were supplied by the U.S. Geological Survey, and such estimates on the State-owned acreage were supplied by the Dallas field office of the U.S. Depart ment of Energy.
The layout of the data file and the data from an ex ample well are given in table 1. The data file contains information on a total of 7,077 exploratory wells of which 4,639 are wildcats that discovered new fields and the other 2,438 wells are either extensions or new- pool tests.
Each exploratory well was located within the proper geologic trend (Miocene, Pliocene, or Pleistocene) on an unpublished geologic-trend map prepared for OCS (Outer Continental Shelf) Lease Sale 38 by the U.S. Geological Survey, Metairie, La. The source documents used to assign a lease number and a lease-sale number to the wells drilled in the Federal waters of the Gulf of Mexico were provided by the U.S. Geological Survey, Reston, Va. The lease numbers for the wells drilled in
TABLE 1. Layout of the data file on exploratory wells drilled during 1945-78 offshore Texas and Louisiana in the Gulf of Mexico
Columns Data Data for example well
High IS1 1QCS 1,831 . 206 L2
-8,587 850
1_11 Subarea - 12-19 Well number ___ __ 20-24 Lease number 25-31 Block number 32 Block specification 33-38 Total vertical depth (in feet) 39-40 Lahee class 41-42 Completion date (month) 9 43-44 Completion date (a year between 1945 and 1978) 6845 Geological region * 146-47 Federal lease-sale number 522 48-57 Producible oil discovered (in millions of barrels
of oil) 0.0 58-66 Producible gas discovered (in billions of cubic feet) 0.0 67-72 Area of field (in square kilometers) 0.0 73-80 Operator Humble
'Designation for "High Island area."'Designation for "large block."'Designation for "dry and abandoned wildcat well."'Designation for "Miocene trend."'Designation for "Federal lease sale number 22 (which was held on Apr. 21, 1968)."

COMPILING THE EXPLORATORY-WELL DATA FILE
the State waters of the Gulf of Mexico were obtained where possible from the International Oil and Gas Scouts Association yearbooks.
The encoding sequence used to create the data file was as follows:
1. The data were coded according to the format shown in table 1 for each exploratory well listed in part 1 of the International Oil and Gas Scouts Association yearbooks for the period 1945 through 1977.
2. A retrieval, to the same format, was made in June 1979 from the Petroleum Information, Inc., well-history control file and provided information on wells not described in the International Oil and Gas Scouts Asso ciation yearbooks. All the data for wells drilled in 1978 were obtained from this source.
3. The North American development issues of the AAPG Bulletin were then used to add exploratory wells recorded in these issues that were not recorded in the first two sources.
4. Initially, wildcat discovery wells were designated as the last wildcat wells drilled prior to the drilling of the first nonwildcat exploratory or development wells drilled in each oil or gas field. These designations were then revised if the individual field studies published by such sources as the Lafayette, New Orleans, Louisiana, and other geological societies cited a different wildcat well as the actual discovery well.
5. In October 1979, the authors checked the overall completeness and correctness of the data file by com paring the file with data in the Metairie, La., office of the U.S. Geological Survey. From the results of this field check, which were based on a random sample of 250 OCS leases, we are able to state that the file is 95 percent complete and correct. We greatly appreciate the assistance of Mr. Floyd Bryan for his work in checking individual well logs to validate the discovery- well assignments made by the authors.
ANALYZING THE HISTORICAL RATES OF DISCOVERY
OVERALL DISCOVERY RATE
Almost all acreage blocks drilled in the Gulf of Mexico are on acreage owned by the Federal Government and sold in some 30 Federal lease sales beginning in 1954. Much of this acreage was later subject to a jurisdic- tional dispute between the Federal Government and the State of Louisiana, which took more than 20 years to resolve. When these disputed acreages were finally drilled, several large oil and gas fields were found that normally would have been discovered earlier had ex ploration not been restricted.
Exploratory drilling during the 1950's and early 1960's was limited to shallow waters near the shore line. As deep-water drilling technology improved and as pipeline infrastructure expanded, drilling moved into deeper waters in the 1960's.
In about 1970, the petroleum industry anticipated an increase in natural-gas prices and began drilling leases in areas thought to contain gas. In 1971, however, a large oil field, the Eugene Island Block 330, was dis covered. Although no more large oil fields were found, the subsequent increase in exploratory drilling resulted in the discovery of many significant gas fields.
As a result of all these restrictions, the rate-of- discovery profiles for the Gulf of Mexico are different from the profiles typically observed for many of the petroliferous provinces within the United States and around the world, where operators have had more or less equal access to all the acreage in each province. In regions where exploration is relatively unrestricted, the initial level of discovery is relatively high because large oil and gas fields are found. This short initial phase is followed by a transition phase of approximately the same duration during which the rate of discovery falls rapidly to a low level. During the third phase of exploration, the discovery rate persists at a relatively low but stable level for a long period of exploratory drilling. Mostly small fields are discovered during this phase. Various aspects of the unusual discovery his tory in the study area are illustrated in figures 2-5.
The rate of discovery of oil and gas during the entire history of exploratory drilling in our study area in the Gulf of Mexico is shown in figure 2. This profile shows that early in the exploration history of this region (through 1958), the rate of discovery was relatively high and remained above 7 million BOE/well. From 1959 onward, the discovery rate oscillated around 2 million BOE/well. The high rate of discovery recorded during the early years of exploration in the Gulf of Mexico is attributed, to a large degree, to the discovery of several giant oil and gas fields such as Bay Mar- chand Block 2 and the combined South Pass Block 24-27 fields. These fields were included in the data set even though they are not entirely offshore. The normal convention was followed here by allowing such fields to be called offshore fields. For the purpose of this study, this distinction is not important because no more fields this large are expected to be discovered.
Within the part of the Gulf of Mexico owned and leased by the Federal Government, the rate of dis covery of oil and gas has been essentially constant dur ing the entire history of exploration in this region. This region also contains the vast majority of the favorable acreage for oil and gas. In figure 3, cumulative volume

FUTURE RATES OF OIL AND GAS DISCOVERIES, WESTERN GULF OF MEXICO
TIME
25.01955 1960 1965 1970 1975
0 1000 2000 3000 4000 5000 6000 7000CUMULATIVE NUMBER OF EXPLORATORY WELLS
FIGURE 2. Rate of discovery of oil and gas in our study area in the Gulf of Mexico in both State and Federal waters 0-200 m deep.
of oil and gas discoveries in this region is plotted against the cumulative number of leases drilled. Each data point was created by cumulating the discoveries made in each lease-sale area and adding this quantity to the quantity of oil and gas discovered as a result of all previous lease sales. These data cover the entire history of exploration in this region from the first
Federal sale held on October 13,1954, through sale No. 37 held on February 4, 1975.
Examination of the graph shown in figure 3 reveals that the volume of producible oil and gas discovered on a lease-by-lease basis has been nearly constant from the earliest leases drilled to the recently drilled leases. The curvature defined by the data points covering the

ANALYZING THE HISTORICAL RATES OF DISCOVERY
15.0
14.0
13.0
12.0
OLLJ
£ t
Drainage-lease sale
<UJ
°=!10.0 QO
_j 9.0
Ooc 8.0
-)U.
jO 7.0
§Z
S§ 6.0
Drainage-lease sales
)rainage-lease sales
Drainage-lease sale
)rainage-lease sales
O
4.0
3.0-
2.0100 200 300 400 500 600 700 800 900 1000 1100 1200 1300 1400 1500 1600
CUMULATIVE NUMBER OF LEASES DRILLED
FIGURE 3. Cumulative volume of oil and gas discovered on Federal Outer Continental Shelf acreage in our study area in the Gulf of Mexfto on which leases were sold by February 4, 1975 volume reported as barrels of oil equivalent (BOB) per cumulative number of leases. Discoveries associated with drainage-lease sales are explained in the text. The first data point represents the 2.3 billion BOB discovered on acreage that is now under Federal jurisdiction but that originally was leased by the State of Louisiana. All this oil and gas was discovered on leases sold before the first Federal sale, which was held October 13,1954. The last data point includes drilling done through December 31, 1978, on acreage on which leases were sold by February 4, 1975.
last four to five lease sales appears to indicate that the rate of return to exploratory drilling has started to diminish in this region. Several more years will be needed to determine if the rate is actually diminishing or if, instead, the fields discovered in the last few lease- sale areas will be found by further drilling to be large enough to reestablish the previous constant rate of return to exploratory drilling. The "tight" collections of data points in the middle sector of figure 3 represent the results of drilling a few exploration leases included in nine drainage-lease sales held between 1962 and 1971. The general intent of drainage-lease sales is to
sell leases on structures previously proved to be produc tive. In most drainage-lease sales, however, a few ex ploration leases are included. The data from the drain age-lease sales plot as tight clusters because not more than three new-field discoveries were made on the acre age leased in any of these sales.
The graph produced by plotting the cumulative volume of oil and gas discovered in this region against the cumulative number of wildcat wells (fig. 4) shows essentially the same pattern as that shown in figure 3. The graph in figure 4 does, however, change its slope somewhat after the drilling of the 1,000th wildcat well

FUTURE RATES OF OIL AND GAS DISCOVERIES, WESTERN GULF OF MEXICO
15.0
14.0
13.0
12.0QUJoc
c/)O< UJ^=1 QO
9.0
u_ nr Off: 7.0
6.0
>§ 5-°I- =1 <co2Z 4.0
O3.0
2.0
1.0
0.0
<$>
200 400 600 800 1000 1200 1400 1600 1800 2000 2200 2400 2600 CUMULATIVE NUMBER OF WILDCAT WELLS
2800 3000 3200
FIGURE 4. Cumulative volume of oil and gas discovered on Federal Outer Continental Shelf acreage in our study area in the Gulf of Mexico on which leases were sold by February 4, 1975 volume reported as barrels of oil equivalent (BOE) per cumulative number of wildcat wells. The first data point represents the 2.3 billion BOE discovered on acreage that is now under Federal jurisdiction but that originally was leased by the State of Louisiana. All this oil and gas was discovered on leases sold before the first Federal sale, which was held October 13, 1954. The last data point includes drilling done through December 31, 1978, on acreage on which leases were sold by February 4, 1975.
in this region (in 1966). This difference in slope shows that the rate of discovery of oil and gas was somewhat higher during the earlier period of exploration than during the later period. When the first 1,000 wildcat wells were drilled, exploratory drilling was confined, in large part, to Miocene and Pliocene rocks on the Fed eral OCS acreage off Louisiana. The second segment of the graph covers the period 1967-78 when the explora
tory drilling was focused in the Pleistocene deposits. The centers of this exploration play were the adjoining subregions of West Cameron (offshore Louisiana) and High Island (offshore Texas). This play has produced mainly gas, whereas the Miocene and Pliocene rocks produced a much larger proportion of crude oil.
The strong similarity between the shapes of the two graphs in figures 3 and 4 is a consequence of the consis-

ANALYZING THE HISTORICAL RATES OF DISCOVERY
4.0HIin
<r Hi o nQ_ O.U
in
<O Q _J
£u_ OccLU CD
2.0
1.0
0.0
®
0 100 200 300 400 500 600 700 800 900 1000 1100 1200 1300 1400 1500 1600 1700 1800 CUMULATIVE NUMBER OF OUTER CONTINENTAL SHELF LEASES DRILLED
FIGURE 5. Relationship between the number of wildcat wells drilled per lease and the cumulative number of leases drilled in our study area in the Gulf of Mexico. The figure reflects drilling done through December 31,1979, on acreage on which leases were sold by June 29,1979 (sale 48).
tent manner used by offshore operators to evaluate the result of wildcat drilling through time. The graph in figure 5 shows that no discernible trend exists in the number of wildcat wells drilled per lease during the en tire history of wildcat drilling on the Federal OCS acre age. The data points in figure 5 that plot at less than one wildcat well per lease are for drainage-lease sales or for multiple-lease-block structures for which only one or two wildcat wells were used to prove up a structure.
DISCOVERY RATES FOR EACH SIZE CLASS
Analysis of the graphs of the rate of discovery of in dividual size classes of fields (figs. 6-9) reveals clearly why the overall rate of discovery of oil and gas in the Gulf of Mexico has remained essentially constant dur ing the history of exploration in this region. The end- points of each of these class intervals are given in table 2. In figure 6, the graphs of the cumulative discovery curves for oil and gas fields in classes 17 through 19 show that most of these largest fields were discovered very early in the exploration history of the region. For example, half the fields in these three largest field-size classes were discovered by 1958 when only 400 wildcat wells had been drilled in the region. This pattern of dis covery, in which the largest fields are discovered early, is widely observed in basins and similar large regions when the exploration process has not been restricted,
and, to that extent, the historical pattern of discovery in the Gulf of Mexico is similar to the pattern in many other regions. However, for all but the largest size classes of fields, the pattern of discoveries in the Gulf of Mexico is quite different from the patterns for other
TABLE 2. Description of deposit-size classes
Class
2
4 -5 ________Q
7
101112 -
1 q
14 -1 K
16 17 --I Q
1Q
Size range1
.006 to .012- - - .012 to .024
- - - - 024 to 047 .047 to .095 .095 to .19
- - 19 to 38OQ 4-^ net
.76 to 1.521.52 to 3.043.04 to 6.07
- 6 07 to 12 14
12.14 to 24.324.3 to 48.648 6 to 97 2
...... Q7 2 tn 1 94 31 f\A O 4-~ OQO C
QQQ C 4-n TT7 O
lit O f n 1 HHA A
'Millions of barrels of oil equivalent.

FUTURE RATES OF OIL AND GAS DISCOVERIES, WESTERN GULF OF MEXICO
TIME
60
50
3COVERIES
**o
Q
u. O
SJ30
5 DZ
rtULATIVEro0
^ D U
10
°«
1955 1960 1965 1970 1975
~J
fr*~
I
/
/
*£-I
i
ss
. .^' /* /
I I
^. ̂
9 _ , "^**"^
. . -~~~~
I I
I I I
/
/.
^-
^-
"^^'
I I I
I
.15
16
- 10
» 19
\ 500 1000 1500 2000 2500 3000 3500 4000 4500CUMULATIVE NUMBER OF WILDCAT WELLS
FIGURE 6. Cumulative number of oil and gas fields discovered by December 31,1976, in size-classes 15 through 19 in our study area in theGulf of Mexico in combined State and Federal waters 0-200 m deep.
regions. For example, a strong reversal in the slopes of the cumulative discovery graphs for size-classes 9 through 15 (figs. 6-9) took place in the early 1970's. This reversal in the rate of discovery also took place in 1971 to a lesser degree for size-class 16 (fig. 6).
The pattern of discoveries across size classes that is normally observed from the unrestricted exploration of such a large region as the Gulf of Mexico consists of the following general elements: (1) the graphs of the cumu lative discoveries across field-size classes have the same general analytic form and show that the rate of return to exploratory drilling diminishes even though, at any point in the exploration process, the decrease may not be obvious, (2) the degree of the diminishing rates of return will be less obvious in each successively smaller size class, and, for the smallest field-size class, it may not be evident until very late in the exploration history of a region, and (3) on the average, at any par
ticular point in the exploration of a region, more dis coveries will have been made in a given field-size class than in the next largest size class, if the discovery proc ess has not been affected by economic factors and also if, on the average, more fields remain to be discovered in a given field-size class than in the next class at this same point in the exploration history of the region.
The marked upturn in the rate of discovery of fields in size-class 16 and smaller fields during the early 1970's is then an atypical pattern, which can be ex plained as a consequence of the restraints that were placed upon exploration processes in the past in this region. We believe that the rate of discovery of fields in these size classes would not have increased at all if natural-gas prices had been on a par with crude-oil prices. The exploration history indicates that the ex ploration companies knew that the central and west ern Gulf of Mexico was likely to contain gas and that

ANALYZING THE HISTORICAL RATES OF DISCOVERY
70
60
__50
o o
u. 40 OccUJm
30
| 20 o
10
1955 1960 1965TIME
1970 1975
500 1000 1500 2000 2500 3000CUMULATIVE NUMBER OF WILDCAT WELLS
3500 4000 4500
FIGURE 7. Cumulative number of oil and gas fields discovered by December 31, 1976, in size-class 14 in our study area in the Gulf ofMexico in combined State and Federal waters 0-200 m deep.
they also avoided this area because a large part of it consisted of Pleistocene deposits, which in the 1950's and 1960's were thought to contain, at best, poor- quality reservoirs. Not until 1971, when the giant Eugene Island Block 330 field was discovered in Pleistocene deposits, were rocks of this age demon strated to have high-quality reservoirs containing large reserves of oil and gas.
Additional factors such as the status of the pipeline infrastructure and water depths also explain why some discoveries have been made later than they otherwise would have been. But with regard to the marked up turn in discovery rates for fields in size-classes 16 and smaller (figs. 6-9), we conclude here that the artifi cially low price of natural gas during the 1950's and
1960's was the main contributing factor that delayed the exploration and development of the gas fields that were discovered in the central and western Gulf of Mexico after 1970. In summary, then, had the price of natural gas been on a par with the price of crude oil, the Pleistocene deposits would almost certainly have been explored earlier than they were and a more nor mal decline pattern in the rate of returns to explora tory drilling would have been observed.
PARTITIONING THE DATA
Because the normal pattern of declining rates of return to exploratory drilling does not exist in the

10 FUTURE RATES OF OIL AND GAS DISCOVERIES, WESTERN GULF OF MEXICO
1955 1960 1965TIME
1970 1975
0 500 1000 3500 4000 45001500 2000 2500 3000
CUMULATIVE NUMBER OF WILDCAT WELLS
FIGURE 8. Cumulative number of oil and gas fields discovered by December 31, 1976, in size-classes 10 through 13 in our study area inthe Gulf of Mexico in combined State and Federal waters 0-200 m deep.
discovery-data series through 1976 for the combined State and federally owned sections of the Gulf of Mex ico (0-200 m water depth), we cannot use a discovery- process model to forecast either the ultimate number of oil and gas fields that are expected to exist in each size class or the rate at which they will be discovered. This conclusion does not imply that this type of model can not be used at all to produce these predictions for the Gulf of Mexico. In fact, this forecasting problem can be
solved by blocking the total discovery time series into subsets that do show the necessary declining rate of return to exploratory drilling and then performing the forecasting tasks. Although many blocking schemes could conceivably be used, the scheme of blocking ac cording to geologic trends appears to be the most direct approach. Examples of other schemes that could be used are blocking according to water depth intervals or blocking by geographic subregions.
PARTITIONING THE DATA 11
60
50
LUOC HI
oO40
QLL O
OCOQ 30
D ZHI
§20
D
D O
10
0(
1955 1960
/
/'"'
^
1965
.
__/
I
^^«
S
1
/
/
/
TIME 1970
X"^
\ \
.^^
//^^-*
I I
1975
/r
>* *j"~y
-
) 500 1000 1500 2000 2500 3000 3500 4000 4500CUMULATIVE NUMBER OF WILDCAT WELLS
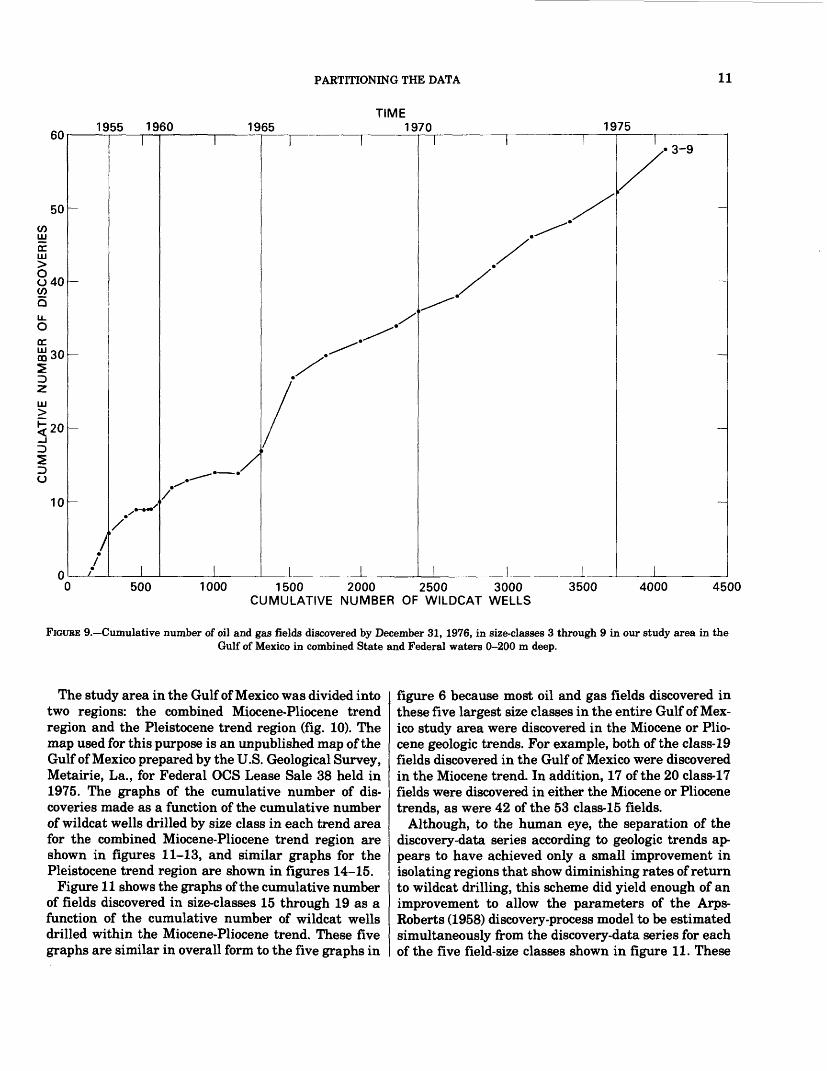
FIGURE 9. Cumulative number of oil and gas fields discovered by December 31, 1976, in size-classes 3 through 9 in our study area in theGulf of Mexico in combined State and Federal waters 0-200 m deep.
The study area in the Gulf of Mexico was divided into two regions: the combined Miocene-Pliocene trend region and the Pleistocene trend region (fig. 10). The map used for this purpose is an unpublished map of the Gulf of Mexico prepared by the U.S. Geological Survey, Metairie, La., for Federal OCS Lease Sale 38 held in 1975. The graphs of the cumulative number of dis coveries made as a function of the cumulative number of wildcat wells drilled by size class in each trend area for the combined Miocene-Pliocene trend region are shown in figures 11-13, and similar graphs for the Pleistocene trend region are shown in figures 14-15.
Figure 11 shows the graphs of the cumulative number of fields discovered in size-classes 15 through 19 as a function of the cumulative number of wildcat wells drilled within the Miocene-Pliocene trend. These five graphs are similar in overall form to the five graphs in
figure 6 because most oil and gas fields discovered in these five largest size classes in the entire Gulf of Mex ico study area were discovered in the Miocene or Plio cene geologic trends. For example, both of the class-19 fields discovered in the Gulf of Mexico were discovered in the Miocene trend. In addition, 17 of the 20 class-17 fields were discovered in either the Miocene or Pliocene trends, as were 42 of the 53 class-15 fields.
Although, to the human eye, the separation of the discovery-data series according to geologic trends ap pears to have achieved only a small improvement in isolating regions that show diminishing rates of return to wildcat drilling, this scheme did yield enough of an improvement to allow the parameters of the Arps- Roberts (1958) discovery-process model to be estimated simultaneously from the discovery-data series for each of the five field-size classes shown in figure 11. These

12 FUTURE RATES OF OIL AND GAS DISCOVERIES, WESTERN GULF OF MEXICO
TEXAS
GULF OF MEXICO
100 KILOMETERS
FIGURE 10. Geographic locations of the offshore geologic trend areas in our study area in the Gulf of Mexico (from unpublished map of the Gulf of Mexico prepared by the U.S. Geological Survey for Federal OCS Lease Sale 38 held in 1975).
parameters are the ultimate number of oil and gas fields expected to exist in each size class and the effi ciency of discovery within each size class.
With respect to the rates of discovery of oil and gas fields in size-class 14, and each successively smaller size class down to and including size-class 9, this block ing routine (the separation of data according to geologic trends) yielded a substantial improvement in isolating the effect (that is, removing the effect in the subsets) the increased price of natural gas had upon the class- by-class rates of discovery (figs. 12 and 13). This effect was removed to a large enough degree so that within the Miocene-Pliocene data set, stable estimates were obtained for both the critical parameters of the Arps- Roberts (1958) discovery-process model. The blocking of the total discovery-data series in the Gulf of Mexico study area according to geologic trends did not, how ever, completely isolate the effect that the enormous increase in price of natural gas during the 1970's had upon the rate of discovery of gas fields in the Gulf of Mexico. For example, by 1974, at least modest reversals
in the slopes of the cumulative discovery graphs had taken place for field-size-classes 9-15 in the Miocene- Pliocene data subset (figs. 11-13). These reversals are the result of the recording of an increase in the rate of discovery of gas fields in these size classes mainly within the Vermillion, East Cameron, West Cameron, and High Island regions of the Gulf of Mexico.
We conclude here that the Pleistocene trend and, to some extent, the Pliocene and Miocene trends within these regions were known to contain gas and conse quently were not explored intensely until expectations were created in the late 1960's and early 1970's that the price of gas was going to increase rapidly in the near future. Although, after the fact, a data-blocking scheme could be constructed to isolate these regions containing gas for separate treatment, the arbitrari ness required to outline such regions would almost cer tainly be subject to criticism. For this reason, we decided to block the data according to geologic trends, which are clearly defined and widely recognized entities.

PARTITIONING THE DATA 13
1955 1960 1965TIME
1970 1975
500 1000 1500 2000 2500 CUMULATIVE NUMBER OF WILDCAT WELLS
3000 3500
FIGURE 11. Cumulative number of oil and gas fields discovered in size-classes 15 through 19 in the Miocene-Pliocene trend of the study area in the Gulf of Mexico in combined State and Federal waters 0-200 m deep.
The graphs of the cumulative number of oil and gas fields discovered in the Pleistocene geologic trend in size-classes 9 through 18 are shown in figures 14 and 15. With exception of the graphs for size-classes 17 and 18, the graphs in these two figures reveal that within the Pleistocene trend, at least through the end of 1976, little evidence exists for diminishing returns to wildcat drilling. The nearly complete absence of size-class-by- size-class diminishing rates of return to wildcat drill ing within the Pleistocene trend prevented the direct estimation of the two critical parameters in the Arps- Roberts (1958) discovery-process model within this region. The method used to predict (1) the ultimate number of oil and gas fields expected to exist in each field-size class and (2) the rate at which these fields will be discovered in the future is discussed in detail in the following section.
ESTIMATING THE PARAMETERS OF THE DISCOVERY-PROCESS MODEL
The method used to estimate the ultimate number of oil and gas fields expected to exist within each field- size class and the rate at which these fields are ex pected to be discovered in the future is based upon the discovery-process model devised by Arps and Roberts (1958). This model incorporates the well-documented characteristic of the petroleum discovery process that the larger an oil or gas field is, the earlier it will tend to be discovered in the exploration history of any region. For examples of this phenomenon, see reports by Ryan (1973a, b), Drew (1975), Kaufman, Balcer, and Kruyt (1975), and Root and Drew (1979).
In the Arps-Roberts model, the probability that the next wildcat well will discover a given oil or gas field is
14 FUTURE RATES OF OIL AND GAS DISCOVERIES, WESTERN GULF OF MEXICO
1975
500 1000 1500 2000 2500 CUMULATIVE NUMBER OF WILDCAT WELLS
3000 3500
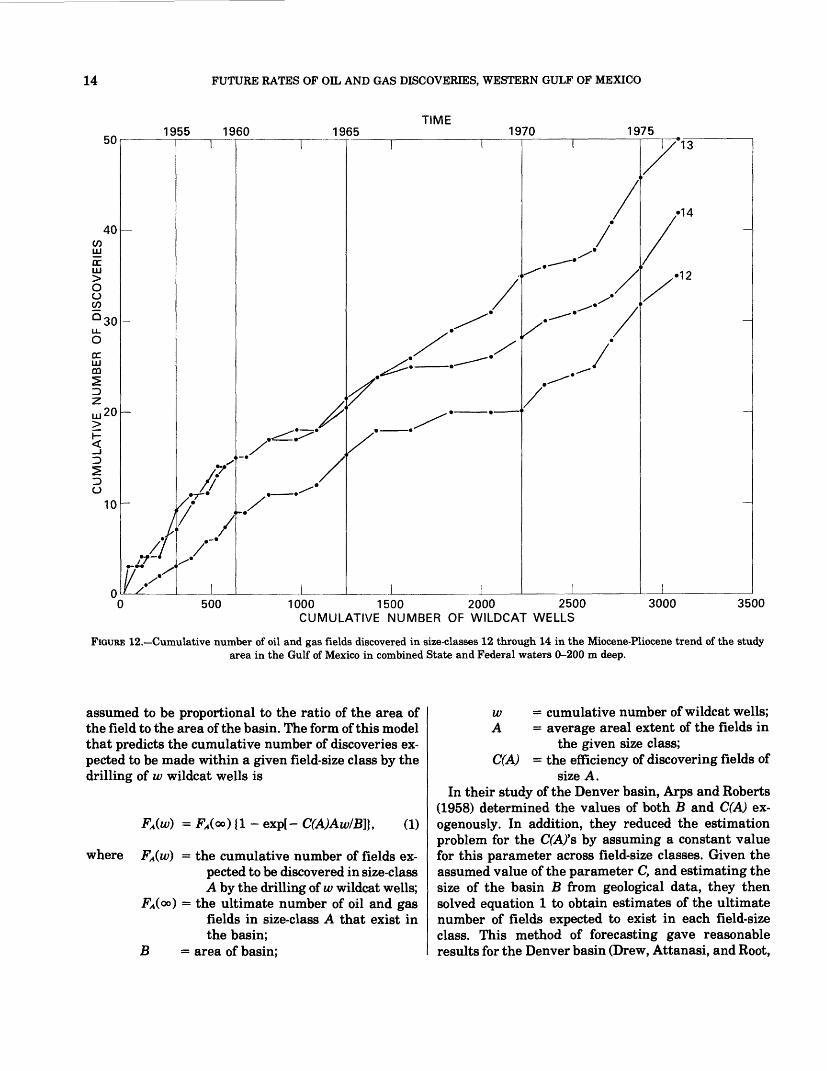
FIGURE 12. Cumulative number of oil and gas fields discovered in size-classes 12 through 14 in the Miocene-Pliocene trend of the study area in the Gulf of Mexico in combined State and Federal waters 0-200 m deep.
assumed to be proportional to the ratio of the area of the field to the area of the basin. The form of this model that predicts the cumulative number of discoveries ex pected to be made within a given field-size class by the drilling of w wildcat wells is
FA(w) = Fx(oo){l - exp[- C(A)Aw/B]}, (1)
where FA(w) = the cumulative number of fields ex pected to be discovered in size-class A by the drilling of w wildcat wells;
-^(oo) = the ultimate number of oil and gas fields in size-class A that exist in the basin;
B = area of basin;
w = cumulative number of wildcat wells;A = average areal extent of the fields in
the given size class;C(A) = the efficiency of discovering fields of
size A.In their study of the Denver basin, Arps and Roberts
(1958) determined the values of both B and C(A) ex- ogenously. In addition, they reduced the estimation problem for the C(A)'s by assuming a constant value for this parameter across field-size classes. Given the assumed value of the parameter C, and estimating the size of the basin B from geological data, they then solved equation 1 to obtain estimates of the ultimate number of fields expected to exist in each field-size class. This method of forecasting gave reasonable results for the Denver basin (Drew, Attanasi, and Root,

ESTIMATING THE PARAMETERS OF THE DISCOVERY-PROCESS MODEL 15
1955 1960TIME
1965 1970 1975
500 1000 1500 2000 2500 CUMULATIVE NUMBER OF WILDCAT WELLS
3000 3500
FIGURE 13. Cumulative number of oil and gas fields discovered in size-classes 9 through 11 in the Miocene-Pliocene trend of the study area in the Gulf of Mexico in combined State and Federal waters 0-200 m deep.
TIME1965 1970 1975
200 400 600 800 CUMULATIVE NUMBER OF WILDCAT WELLS
1000
FIGURE 14. Cumulative number of oil and gas fields discovered in size-classes 13 through 18 in the Pleistocene trend of the study area in the Gulf of Mexico in water 0-200 m deep.

16 FUTURE RATES OF OIL AND GAS DISCOVERIES, WESTERN GULF OF MEXICO
TIME1965 1970 1975
200 400 600 800 CUMULATIVE NUMBER OF WILDCAT WELLS
1000
FIGURE 15. Cumulative number of oil and gas fields discovered in size-classes 9 through 12 in the Pleistocene trend of the study area in the Gulf of Mexico in water 0-200 m deep.
1977) and also for the Permian basin (Drew, Root, and Bawiec, 1979).
However, application of a discovery-process model based on the concept of the area of influence of a drill hole (Drew, Schuenemeyer, and Root, 1980) and the variation in the forms of the cumulative-discovery curves for the Permian basin (Root and Drew, 1979) clearly indicate that the efficiency of discovery varies across class sizes. This conclusion can also be reached from inspection of the cumulative-discovery curves for the largest field-size classes in the Miocene-Pliocene trend in the Gulf of Mexico (fig. 11).
The efficiency of discovery does not depend nearly as much on class size for the Pleistocene trend area. Only for the three largest field-size classes (classes 16-18) had rates of return to wildcat drilling begun to decrease by the end of 1976 (fig. 14). The declining rates of discovery in these three field-size classes have been offset, however, by either approximately constant or increasing rates of discovery in field-size classes 9-15 (figs. 14 and 15). We conclude here that, even through the end of 1976, the Pleistocene geologic trend had to be considered an immature region; that is, many more discoveries were going to be made after 1976 in this region. More simply put, the Pleistocene trend was still a favorable place to explore for gas fields starting January 1, 1977. Because many more fields remain to be discovered in the Pleistocene trend, size-class-by- size-class discovery efficiencies could not be estimated directly from the discovery-data series. The discovery efficiencies for this trend area were then assumed to be the same as the corresponding efficiencies estimated from the Miocene-Pliocene trend area where direct esti mation from the discovery-data series was possible.
ESTIMATING THE PARAMETERS FOR THE MIOCENE-PLIOCENE TREND
Before estimates could be made of the ultimate number of oil and gas fields expected to exist in each field-size class [the Fx(o>)'s in equation 1] and the cor responding discovery efficiencies [the C(A)'s in equa tion 1], several preliminary data analyses had to be done. These tasks included the planimetering of the areal extents of the combined Miocene-Pliocene and Pleistocene trend areas. The Miocene-Pliocene trend in the study area was determined to cover 123,027 km*, and the Pleistocene trend to cover 33,612 km*. These values were used as the respective basin-size estimates (the variable B in equation 1). Additional tasks in cluded the restructuring of the cumulative-discovery curves shown in figures 11-13 onto a uniform scale of wildcat wells. This restructuring was done to produce an even distribution of discovery data points across the wildcat drilling history of each region because the esti mation algorithm goes more smoothly when the data are presented as a function of even increments of the independent variable. The average areal extent of the oil and gas fields that have been discovered in each field-size class was also computed. These averages were used as estimates of the variable A in equation 1. Data for this purpose were obtained from the Transco Company maps (Transcontinental Gas Pipe Line Corporation and Transco Exploration Company, 1980; Stanley and Evans, 1979) of the oil and gas fields and natural gas pipelines in the Gulf of Mexico as of September 1979 and March 1980.
These estimates of A and B and the nonlinear least- squares algorithm (NLIN2) by Marquardt (1963) were used to obtain simultaneous estimates of the C(A)'s

ESTIMATING THE PARAMETERS OF THE DISCOVERY-PROCESS MODEL 17
and the Fx(«)'s in equation 1. The NLIN2 algorithm chooses successive estimates of C(A) and FA(oo) for each field-size class so as to minimize the sum of squares be tween the observed and predicted value of FA(w). Good initial values for C(A) and FA(v>) were obtained by solv ing equation 1 for known values of w and FA(w). The choices of successive values of the parameters are deter mined by evaluating the partial derivatives of FA(w) with respect to C(A) and FA(<x>\ Estimates of the CfA/s for size-classes 13-17 (table 3) and class 12 were found to be greater than 1. An efficiency of 1 is used to describe random drilling.
Too few fields have been found in classes 18 and 19 to permit meaningful statistical estimation. This lack of data is unimportant because no additional discoveries are expected to be made in these two largest field-size classes. The estimates for the CfA/s in size-classes 9 through 11 were determined to be approximately equal tol.
Fewer discoveries were made in the smaller size classes (classes 9-12) than otherwise would have been expected because of economic factors such as the artifi cially low price of natural gas during the 1950's and 1960's and into the early 1970's. Other truncation fac tors are water depth and infrastructure status.
The main effect of the pre-1979 economic truncation in the Gulf of Mexico was the nonreporting of the ac tual discovery of many small gas fields containing less
than 25 BCF (billion cubic feet) because, at the time of their discovery, such fields were rarely profitable to develop. However, today, gas fields in the 10-20-BCF size range are commercial at a wide variety of locations and water depths. Gas fields containing less than 10 BCF are also economically viable under some situa tions today and will become increasingly important if the real price of natural gas continues to increase as is currently (1981) being projected. As a result of this situation, a forecast of the future rates of discovery of these small fields has to be made even though little in formation exists on their past rates of discovery that can be used to estimate the parameters in a discovery- process model.
We argue here that the size class in which an economic truncation first appears can be determined by inspecting the relative positions of each of the cumulative-discovery curves. For example, the post-1965 part of the cumulative-discovery curve for each successively smaller field-size class in the Miocene-Pliocene trend, down to size-class 14, lies above the discovery curve for each successively larger size class (figs. 11-12). We thereby identify size-class 13 as the smallest size class not to be seriously affected by economic truncation.
Another way in which this truncation phenomenon can be visualized is to construct a histogram of the number of recorded discoveries and to observe where
TABLE 3. Summary data and estimates of the ultimate number of oil and gas fields by class size and contained resources for theMiocene-Pliocene trend of the study area
[Dash leaders indicate that the nonlinear least-squares procedure could not be used; BOE, barrels of oil equivalent]
Size class1
91011121314
1516171819
Number of fields found by 3,100 wildcat wells
242727355042
43251752
,,,889.4539.1326.7198.0120.365.9
50.725.817.05.02.0
Unsmoothed
_
2.554.78
4.943.315.35(4)(4)
Smoothed
_
_
2.653.40
4.154.895.65(4)(4)
Expected total ultimate resource
(BOE x 101)
1005.0
1223.81509.41716.72223.12282.1
3551.03302.74583.72873.22273.7
Expected remaining resource*
(BOE x 101)
977.91162.51384.61413.21299.1827.7
539.3102.4
.0
.0
.0
Percent of total resource
remaining
12.715.118.018.316.910.7
7.01.3
.0
.0
.0
Total- 297 2,239.9 26,544.4 7,706.7 100.0'See table 2 for definition of field-size classes.The ultimate numbers of fields estimated to exist in size-classes 13-19 were estimated directly from the discovery-data series. The ultimate numbers of fields in size-classes 9-12 were estimated by applying the average f,.Jf, = 1.65 ratio determined from size-classes 13 through 17.
'Amounts are for the period starting 1/1/77. 'Insufficient data to estimate £(A).

18 FUTURE RATES OF OIL AND GAS DISCOVERIES, WESTERN GULF OF MEXICO
the mode of the distribution exists. In the Miocene- Pliocene trend, the mode of the distribution is in size- class 13, which contains fields in the size range of 12.14 million to 24.3 million BOE (or 72.84 billion to 145.8 BCF of gas equivalent). We argue here that the record ing of discoveries in the field-size classes below this level has been truncated. Some truncation may also have affected field-size-class 13. Therefore, we believe that fields containing more than 24.3 million BOE of producible reserves have been economically viable from the beginning of exploration in the Miocene- Pliocene trend area. We, of course, allow for the excep tion that a few fields above this size may not have been developed after their discovery because of peculiarities in the evaluation and decisionmaking process.
The assertion that the field-size class below which economic truncation has taken place can be deter mined by inspection of the discovery-rate curve or a histogram of reported discoveries is supported by the following semiquantitative and qualitative data. First, in the 1950's, 1960's, and even into the early 1970's, gas fields containing 100-150 BCF in the Miocene- Pliocene trend generally were considered marginal to develop. This truncation level can be checked by calculating the cost of developing such a field by using the prices and costs of completion and operation that prevailed at that time.
Additional support for the assertion that the part of the recorded field-size distribution at and below its mode has been truncated by economic factors is gained by examining data from areas where the costs of ex ploration and production differ. An excellent example of such a situation is illustrated in the Permian basin, where the location of the mode of the recorded field-size distribution is strongly related to the depth of the dis coveries (Drew, Schuenemeyer, and Bawiec, 1981). In this basin, the mode of the field-size distribution for the discoveries recorded through the end of 1974 in the 0-5,000-foot depth interval is in size-class 6. In the 5,000-10,000-foot interval, the mode is in field-size- class 7. In the 10,000-15,000-foot depth interval, the mode is in field-size-class 11. This migration of the mode of the recorded field-size distribution across depth intervals is almost certainly related to the eco nomic cost conditions that prevailed in the basin before 1975.
Further information to support this assertion exists in the fact that many noncommercial discoveries, often referred to as "shows of oil and gas," had been recorded before 1975 in the Permian basin and in most other basins in the United States. Since then, as a result of the large price increases in recent years, many of these have been reentered and recompleted as commercial
wells. These recompletions are then in fact "filling out" the recorded size distributions of discoveries, thereby causing the location of the mode of the field- size distributions to shift toward the smaller field sizes. This same phenomenon is also taking place currently in the Gulf of Mexico, where many lease blocks that were previously leased, drilled, and dropped as non commercial are now being re-leased, redrilled, and put into commercial production.
Accepting the assertion that, in the Miocene-Pliocene trend area, the part of the recorded field-size distribu tion below the mode (size-class 12 and smaller, fig. 16) has been truncated establishes a requirement for a technique to remove the effect of this type of trunca tion. If the effect of this truncation were not removed from the data, the future rates of discovery forecasted by the Arps-Roberts (1958) discovery-process model would be biased downward; that is, the rates would be underestimated.
The approach taken here to estimate how many oil and gas fields would have been recorded as discoveries in size-class 12 and smaller size classes had the price of natural gas and crude oil been on par with current prices is based upon observations about the form of the field-size distributions in other areas such as the Per mian and Denver basins. Figure 17 is a graph of the in creases in the size-class-by-size-class frequencies of the fields expected ultimately to be discovered in the 0-5,000-foot depth interval in the Permian basin. Each point on this graph is the ratio of the ultimate number of oil and gas fields expected to exist in a given class, ft-iy to the ultimate number of oil and gas fields ex pected to exist in the next largest size class, ft. This graph is then read as follows: take, for example, the ratio between size-classes 11 and 12 where fi-i/fi = 1.65, that is, where 1.65 times as many fields are expected to exist in size-class 11 as in size-class 12. This ratio is based on /J-i«n = 85.2 and /J=12 = 51.5 for oil and gas fields ultimately expected to exist in these two size classes in the 0-5,000-foot depth interval in the Permian basin.
The graph in figure 17 shows that no trend is ap parent in the ft-Jft ratio across the entire range of size classes above size-class 6, below which economic trun cation is believed to take place. This lack of a trend in the fi-i/fi ratio for size classes above the size class in which economic truncation takes place characterizes both the 5,000-10,000-foot and 10,000-15,000-foot depth intervals in this same basin and also character izes the Denver* basin as a whole. Therefore, we assume that, in general, the frequency of fields in the ultimate underlying field-size distribution based upon a Iog2 size-class scaling progresses across size classes as a

ESTIMATING THE PARAMETERS OF THE DISCOVERY-PROCESS MODEL 19
60
50
CO Q
30f-
ocLU
£20
10
ZONE OF ECONOMIC TRUNCATION
1 2 3 4 5 6 7 8 9 10 11 12 13 14 15 16 17 18 19 20SIZE CLASSES
FIGURE 16. Size distribution of oil and gas fields discovered in the Miocene-Pliocene trend of the study area in combined State andFederal waters 0-200 m deep as of December 31, 1976.
geometric series. We, therefore, believe that the under lying field-size distribution is approximately log- geometric in form.
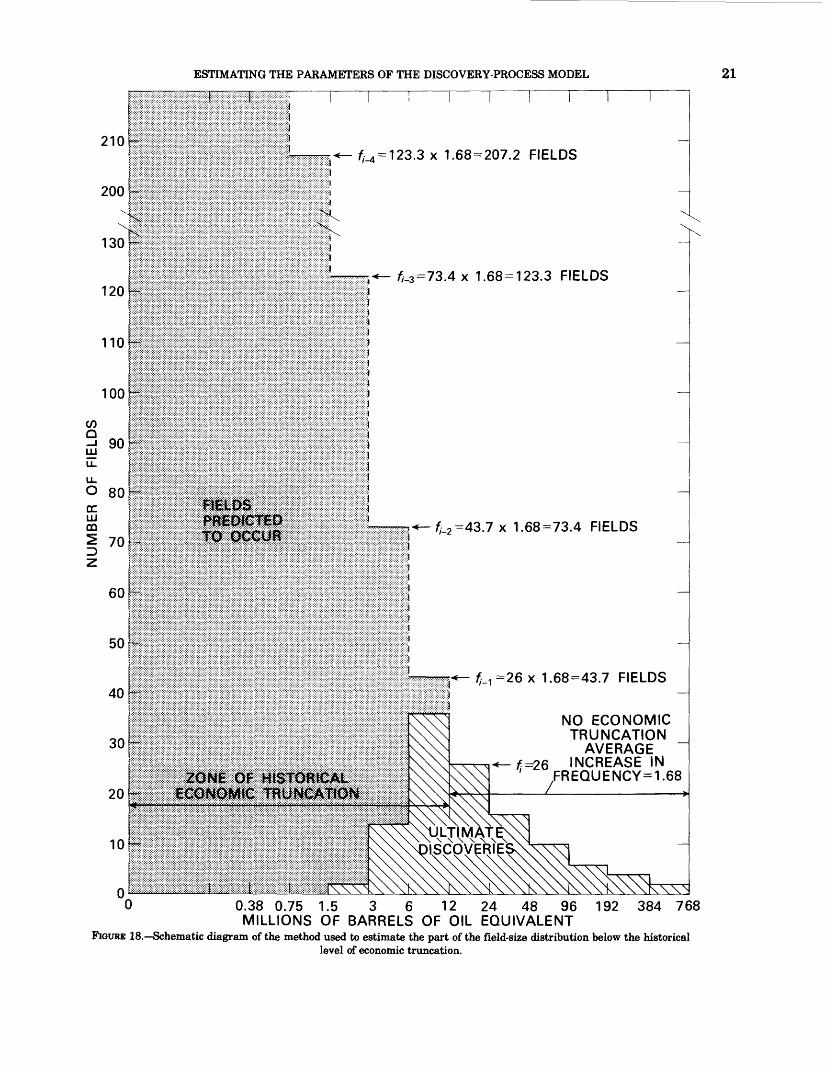
The above observations and conclusions were used to form a basis for a technique to remove the effect of economic truncation upon the observed distribution of oil and gas field discoveries made by any given point in time. In figure 18, this technique is schematically diagramed for a hypothetical region.
In figure 18, the /J_/s represent the estimated fre quencies (number of fields) in each size class below the historical economic truncation level. In this example, the smallest size class in which no economic truncation has taken place is assumed to be the 12-24-million- BOE size class. In all, 26 oil and gas fields are esti mated to exist in this size class. This estimate normal
ly would be derived from the historical discovery-data series by use of a discovery-process model.
The number of fields in the 6-12-million-BOE size class (defined to be fc-i) is estimated to be 43.7 by multiplying the average increase in frequency factor of r = 1.68 by ^ = 26 fields. This multiplication factor is the computed average increase in the ultimate number of oil and gas fields estimated to exist in each size class above the 12-million-BOE field-size-class truncation level. The ultimate number of fields expected to exist in each smaller size class under consideration is esti mated in a similar manner.
For example, the ultimate number of fields estimated to exist in the 3-6-million-BOE field-size class is deter mined to be fi-2 = 43.7 x 1.68 = 73.4 fields. Given a complete set of estimates of the expected ultimate

20 FUTURE RATES OF OIL AND GAS DISCOVERIES, WESTERN GULF OF MEXICO
3.0
2.0
1.0
0.010 11 12 13
SIZE CLASS,M14 15 16 17 18 19
FIGURE 17. Size-class-by-size-class increase in ultimate frequencies of oil and gas fields in the 0-5,000-foot depth interval of the Permianbasin. The average rate of increase is fi-Jfi = 1.67.
number of fields in each size class to be considered, we can use a discovery-process model to estimate the rates at which the remaining fields will be discovered.
This same procedure has been used to estimate the field-size distribution of fields in the Miocene-Pliocene trend of the study area that have been subject to eco nomic truncation. A geometric progression was ob served in the ultimate number of fields in each class from class 17 to class 13. The average increase in this progression is equal to r = 1.65. This average was used to estimate the ultimate number of oil and gas fields expected to exist in size-classes 12 down through and
including size-class 9 in the Miocene-Pliocene trend area. The results of this estimation process are shown in the first four rows of column 3 of table 3. The esti mation of the ultimate field-size distribution was ter minated at field-size-class 9 because fields containing less than 760,000 BOE are unlikely to be commercial unless they are under very shallow water or close to an existing production facility. The data from size-classes 18 and 19 were not considered because too few dis coveries were made in these classes to allow meaning ful estimation and because no more fields in these classes are expected to be discovered.
ESTIMATING THE PARAMETERS OF THE DISCOVERY-PROCESS MODEL 21
210
200
130
120
110
100
ill
cc LIJDO
= 123.3 x 1.68=207.2 FIELDS
£-3=73.4 x 1.68 = 123.3 FIELDS
/U=43.7 x 1.68=73.4 FIELDS
1.68=43.7 FIELDS
NO ECONOMIC TRUNCATION
AVERAGE/:=26 INCREASE IN
FREQUENCY=1.68
0.38 0.75 1.5 3 6 12 24 48 96 192 384 768MILLIONS OF BARRELS OF OIL EQUIVALENT
FIGURE 18. Schematic diagram of the method used to estimate the part of the field-size distribution below the historicallevel of economic truncation.
22 FUTURE RATES OF OIL AND GAS DISCOVERIES, WESTERN GULF OF MEXICO
In order to reduce the effects of statistical variation upon estimates of the ultimate numbers of fields in classes 12 to 9, a smoothed estimate is used for class 13. This estimate is based upon a reestimation, for smooth ing purposes only, of fn.
Let T = L fif.=13
then ?17 = 7Tr-l)/(r 5 - 1).
because T represents the partial sum of a geometric series and /J3 = r 4/17 .
Another method of estimating the average ratio f (David H. Root, 1980, oral commun.) is to estimate the probability of success p of the truncated Iog2 geometric series by the method of maximum likelihood. For this procedure, we find the value of p that maximizes
a-
where d and e are the lower and upper nontruncated class sizes in Iog2 . In our example, they are 13 and 17, respectively. The other parameters are
a = i f{ and b = L f^i-l).i = d i = d
The average ratio r= l/(l-p). Both methods yield similar results.
Examination of table 3 shows that after January 1, 1977, no fields are expected to be discovered in size- classes 17-19 in the combined Miocene-Pliocene trend area; in other words, we do not expect to find fields con taining more than 194.3 million producible BOE (or 1.17 trillion cubic feet of gas equivalent). The largest volume of undiscovered oil and gas within a single size class (18.3 percent of the total) is predicted to exist in field-size-class 12 (that is, within fields that range in size from 6.07 million to 12.14 million BOE or equiv- alently, from 36.4 to 72.8 BCF of producible gas). In this size class, 1.4 billion BOE is predicted to remain to be discovered in 163 fields.
In addition, table 3 shows that 64.1 percent of the oil and gas remaining to be discovered in the combined Miocene-Pliocene trend of the study area is predicted to exist in the four smallest field-size classes considered; that is, size-classes 9-12. Fields in these size classes are within the size range where the field-size distribu tion was historically truncated by economic factors. Although the following conclusions are subject to qualifications, we believe that we can say with a high degree of confidence that the rapid increase in the price of natural gas in the middle to late 1970's and, to a
degree, the associated increase in the price of crude oil have caused more than half the oil and gas resources remaining to be discovered in the combined Miocene- Pliocene trend of the study area in fields containing more than 0.76 million barrels of producible oil equiv alent to be converted from the uneconomic category to the economic category.
ESTIMATING THE INCREMENTAL FUTURE RATES OFOIL AND GAS FIELD DISCOVERIES IN THE
MIOCENE-PLIOCENE TREND
Given estimates of the ultimate number of oil and gas fields expected to exist in each field-size class and their associated discovery efficiencies (table 3), along with additional information on average area! extents and measurement of the basin size, we calculated the future rates of discovery of these fields in the Miocene- Pliocene trend area by using the Arps-Roberts (1958) discovery-process model. This forecast is shown in table 4. The numbers of discoveries expected to be made in each field-size class by the first increment of 200 wildcat wells drilled starting January 1, 1977, are given in the first row of table 4. These oil and gas fields (26.1 fields in all) are predicted to contain 251.1 million barrels of producible oil equivalent.
The numbers of discoveries forecasted to be made by the first 200 wildcat wells range from a maximum of 7.78 discoveries expected in size-class 9 down to only 0.16 expected discoveries in size-class 16. The quantity of oil equivalent expected to be discovered at the com pletion of each successive wildcat-drilling increment is forecasted to decline slowly. We forecast that 2,400 ad ditional wildcat wells will have to be drilled in the com bined Miocene-Pliocene trend (12 increments of 200 wildcat wells each) before the forecasted rate of dis covery per drilling increment declines to half of that forecasted for the first drilling increment. Thus, almost as many wildcat wells (79.2 percent as many) have to be drilled in the future (2,400 wildcats starting Jan. 1, 1977) as have been drilled in the past (3,300 wildcats through the end of 1976) before the expected level of discovery per drilling increment declines to approxi mately half (125.1 million BOE per increment or 625,500 BOE per wildcat well) of that forecasted for the first drilling increment (251.1 million BOE per incre ment or 1,255,000 BOE per wildcat well). Such rates of discovery are judged to be sufficiently attractive to in sure that the Miocene-Pliocene trend area in the Gulf of Mexico study area will be an attractive exploration theater for 10 to 15 years after the start of the forecast at January 1, 1977. This judgement is based upon the assumption that it will take 10-15 years or until 1987-92 to drill the 2,400 wildcat wells forecasted to be

ESTIMATING THE PARAMETERS OF THE DISCOVERY-PROCESS MODEL 23
TABLE 4. Forecasted future number of discoveries per increment of 200 wildcat wells drilled in the Miocene-Pliocene trend of the study area[BOE, barrels of oil equivalent]
Cumulative number of
wildcat wells
3,3003,5003,7003,9004,100
4,3004,5004,7004,9005,100
5,3005,5005,7005,9006,100
6,3006,5006,7006,9007,100
Number of fields to be discovered in each class1
9
7.78
7.707.627.547.47
7.397.317.247.167.09
7.026.956.876.806.73
6.676.606.536.466.40
10
5.775.705.625.555.48
5.405.335.265.195.13
5.064.994.934.864.80
4.734.674.614.554.49
11
4.364.284.214.134.06
3.993.923.853.783.72
3.653.593.533.463.40
3.343.283.233.173.11
12
3.263.193.113.032.96
2.892.822.752.692.62
2.562.502.442.382.32
2.272.212.162.112.06
13
2.392.312.232.162.08
2.011.951.881.811.75
1.691.641.581.531.47
1.421.381.331.281.24
14
1.511.421.331.241.16
1.091.02
.96
.90
.84
.79
.74
.69
.65
.61
.57
.53
.50
.47
.44
15
0.88.78.69.61.54
.48
.42
.38
.33
.29
.26
.23
.20
.18
.16
.14
.13
.11
.10
.09
16
0.16.13.10.08.06
.05
.04
.03
.03
.02
.02
.01
.01
.01
.01
.01
.00
.00
.00
.00
Incremental discoveries in all size classes (millions of BOE)
251.1
233.0217.2203.2190.7
179.5169.4160.2151.9144.3
137.4131.0125.1119.7114.6
109.9105.6101.597.694.0
'See table 2 for definition of field-size classes.
required to lower the rate of discovery in this region to approximately 625,500 BOE per wildcat well.
ESTIMATING THE PARAMETERS FOR THE PLEISTOCENE TREND
Estimation of the ultimate number of oil and gas fields existing in each field-size class directly from the discovery-data series was not possible for fields in the Pleistocene trend. This type of estimation was not pos sible because the exploration history in the region has covered too short a period to allow the size-class-by- size-class rates of discovery to decline significantly. This lack of decline is not an unexpected result for such a short data series that essentially covers only the 1969-76 period.
Given this situation, assumptions had to be made in order to produce a size-class-by-size-class forecast of the future rates of discovery in this region. The first assumption made was that the discovery efficiency for each size class in the Pleistocene trend is the same as that determined for the same size class in the Miocene- Pliocene trend area. We are then assuming that the cumulative size-class-by-size-class discovery graphs in the Pleistocene trend will be identical to the corre sponding graphs in the Miocene-Pliocene trend area. The second assumption made was that the part of the field-size distribution of oil and gas fields smaller than
fields in size-class 13 has the same general form in this trend area as the field-size distribution has in the Miocene-Pliocene trend area, that is, the average ft-Jfi ratio = 1.65 for size-class 12 and the smaller size classes.
Given these two assumptions, the ultimate number of oil and gas fields expected to exist in each field-size class in the Pleistocene trend was estimated by use of the Arps-Roberts (1958) model. These estimates are given in column 3 of table 5. For the Pleistocene trend area, the same two-stage estimation procedures were used as were used for the Miocene-Pliocene trend area. In the first stage, estimates were made of the number of fields ultimately expected to exist in the first size classes unaffected by economic truncation; that is, in size-classes 13-17, inclusive. An example calculation is shown below for size-class 13:
1. Assume C(A) = 2.65 (the Miocene-Pliocene estimate).
2. Given the additional data: Ai3 = 6.68 km2; w = 1,000 wildcat wells as of approximately
the end of 1976; Fi3(w) = 21 fields discovered by the drilling of
1,000 wildcat wells; B = 33,612 km2 = Pleistocene trend area of
study area.

24 FUTURE RATES OF OIL AND GAS DISCOVERIES, WESTERN GULF OF MEXICO
TABLE 5. Summary data and estimates of the ultimate number of oil and gas fields by class size and contained resources for the Pleistocene trend of the study area
(BOE, barrels of oil equivalent]
Number of fields Class found by 1,000 size1 wildcat wells F*(<*>V
910111213
1415161718
911201721
269831
358.7217.4131.879.951.3
39.910.48.23.01.0
Smoothed CM,
_
2.65
3.404.154.895.65
Expected total ultimate
resource (BOE x 10«)
391.0450.0581.2670.4871.6
1,392.1692.7
1,038.9623.4502.8
Expected remaining resource*
(BOE x 10s)
381.2427.3493.0527.7514.8
485.093.325.3
.0
.0
Percent of total
resource remaining
12.914.516.717.917.5
16.53.2
.9
.0
.0
Total 125 901.6 - 7,214.1 2,947.6 100.0
'See table 2 for definition of field-size classes. See text for explanation of estimation procedure used.'Amounts are for the period starting 1/1/77.
3. Solve the Arps-Roberts (1958) model for F^(oo) FA(w) = £(oo){l-exp[-CfA;Au>/B]}; 21 = &(oo){l-exp[(-2.65.6.68
1,000)733,612]}; FA(oo) - 51.3 fields expected to exist in size-class
13.Given estimates of the F^(<x>)'s made in this manner
for size-classes 13-17, we proceeded to the second stage of estimation by estimating in F^(c»)'s for size-classes 12 down to and including size-class 9. These four esti mates were determined by using the same average geometric progressive estimate r 1.65 as was used to estimate the ultimate number of fields in these same size classes in the Miocene-Pliocene trend area. In tak ing this approach, we are further assuming that the same historical level of economic truncation has taken place in both trend areas.
The results from this estimation procedure produce a forecast that a total of 901.6 oil and gas fields are ulti mately expected to exist in the Pleistocene trend (table 5); each of these fields contains more than 0.76 million barrels of producible oil equivalent. Of this total, 125 fields have been discovered through the end of 1976. The expected ultimate production of these 776.6 oil and gas fields remaining to be discovered as of January 1, 1977, is estimated to be 2.95 billion BOE. This esti mate implies then that 40.9 percent of the oil and gas ultimately producible from the Pleistocene trend re mained to be discovered as of January 1,1977, whereas only 29 percent of the oil and gas ultimately producible
from the combined Miocene-Pliocene trend remained to be discovered at the same date.
In addition, table 5 shows that no fields in classes 17-18 (that is, fields containing more than 194.3 million BOE) are expected to be discovered in the Pleistocene trend area; as discussed above, we don't ex pect to find any fields this size in the Miocene-Pliocene trend area either. The field-size class predicted to have the largest volume of oil and gas remaining to be dis covered as of January 1,1977, is class 12, which is esti mated to contain 527.7 million BOE (17.9 percent of the total remaining). This volume of oil and gas is ex pected to exist in 62.9 fields. A similar amount of oil and gas is predicted to remain to be discovered in 30.3 fields of size-class 13; these 30.3 fields are expected to contain 514.8 million BOE (17.5 percent of total remaining).
The total volume of oil and gas remaining to be dis covered in the four smallest field-size classes (9 through 12) is predicted to be 1.8 billion BOE, which is 62 percent of the total oil and gas resources remaining to be discovered in the Pleistocene trend in fields larger than 0.76 million BOE. This volume of oil and gas is expected to exist in 730.8 fields that range in size from 0.76 million to 12.14 million BOE. These fields would, on the average, contain 2.5 million BOE. Although most of these fields would historically have been too small to warrant development, we anticipate that, in the future, many of these fields when discovered will be put into production.
ESTIMATING THE INCREMENTAL FUTURE RATES OFOIL AND GAS FIELD DISCOVERIES IN THE
PLEISTOCENE TREND
These estimates of the expected ultimate number of oil and gas fields existing in each field-size class were used as input for the Arps-Roberts (1958) model to fore cast the future rates of discovery in the Pleistocene trend area. This forecast (table 6) shows that 25.5 fields (in size-classes 9 through 16) are forecasted to be discovered by the first increment of 200 wildcat wells to be drilled starting January 1, 1977. This collection of fields is forecasted to contain 256.8 million BOE or an expected yield of 1,284,000 BOE per wildcat well.
The rate of return to wildcat drilling will be reduced to approximately half of its initial level by the comple tion of the sixth drilling increment when the cumula tive number of wildcats drilled in the Pleistocene trend will stand at 2,200 wells. We forecast that the comple tion of these 1,200 wildcat wells will result in the dis covery of 1.06 billion BOE, which is 35.9 percent of the recoverable oil and gas resources forecasted to remain to be discovered starting January 1,1977, in Pleistocene

ESTIMATING THE PARAMETERS OF THE DISCOVERY-PROCESS MODEL 25
TABLE 6. Forecasted future number of discoveries per increment of 200 wildcat wells drilled in the Pleistocene trend of the study area[BOB, barrels of oil equivalent]
Cumulativenumber of
wildcat wells
1,2001,4001,6001,8002,000
2,2002,4002,6002,8003,000
3,2003,4003,6003,8004,000
4,2004,4004,6004,8005,000
Number of fields to be discovered in each class1
9
5.84
5.73
5.635.534.53
5.345.245.155.064.97
4.884.794.714.624.54
4.464.384.304.224.15
10
5.185.044.904.774.64
4.514.394.274.154.04
3.923.823.713.613.51
3.423.323.233.143.06
114.504.314.123.953.78
3.623.473.323.183.05
2.922.792.672.562.45
2.352.252.152.061.98
12
3.733.493.263.042.84
2.662.482.322.172.03
1.891.771.651.551.44
1.351.261.181.101.03
13
3.032.732.452.211.99
1.791.611.451.301.17
1.06.95.86.77.69
.62
.56
.51
.45
.41
14
2.642.141.731.401.14
.92
.74
.60
.49
.40
.32
.26
.21
.17
.14
.11
.09
.07
.06
.05
15
0.46.31.21.14.09
.06
.04
.03
.02
.01
.01
.01
.00
.00
.00
.00
.00
.00
.00
.00
16
0.11
.05
.02
.01
.01
.00
.00
.00
.00
.00
.00
.00
.00
.00
.00
.00
.00
.00
.00
.00
Incremental discoveries in all size classes 9-16
(millions of BOB)
256.8213.1180.9156.0136.4
120.4107.296.286.878.8
71.965.960.656.051.8
48.244.941.939.336.8
See table 2 for definition of field-size classes.
fields larger than 0.76 million BOE. By comparison, 1,200 wildcat wells drilled in the combined Miocene- Pliocene trend area starting January 1, 1977, are forecasted to yield 1.27 billion BOE (the sum of the yields of the first six drilling increments in table 4) in fields of the same size. This combined yield is only 16.6 percent of the total oil and gas resources forecasted to remain in this region in fields of this size starting January 1, 1977. Comparison of the forecasts for both trend areas shows that the incremental yield per wild cat well in the Pleistocene trend will decline much more rapidly than the yields per wildcat well in the Miocene-Pliocene trend. To a large extent, this differ ence in decline rates is a direct consequence of the small area occupied by the Pleistocene trend (33,612 km2) and the much larger area occupied by the Miocene-Pliocene trend (123,027 kma). Both these geo logic trends, however, have substantial resources re maining to be discovered as of January 1,1977, and the pace of exploration will be intense at least through the end of the 1980's.
CONCLUSIONS
The expected number of oil and gas fields remaining to be discovered by size class in the Gulf of Mexico was estimated. The rate at which these fields will be dis
covered in the future (starting Jan. 1, 1977) was also forecasted. These forecasts were made individually for two regions in the study area in the Gulf of Mexico: the combined Miocene-Pliocene geologic trend, which oc cupies 123,027 km2, and the Pleistocene trend, which occupies 33,612 km2. The water depth ranges from the shoreline to 200 m so that both State and Federal waters are included in the study area.
Within the Miocene-Pliocene trend area, 1,943 oil and gas fields individually containing more than 0.76 million BOE (or equivalently 4.6 BCF of gas) are ex pected to remain to be discovered starting January 1, 1977. Collectively these fields are estimated to contain 7.71 billion BOE. Of this total number of fields, 94.7 percent are estimated to contain individually less than 12.14 million BOE. These 1,840 fields are predicted to contain 4.94 million BOE or 64.1 percent of the total volume of oil and gas estimated to exist in the Miocene- Pliocene trend area.
The comparable estimates for the Pleistocene trend are as follows: (1) 776.6 oil and gas fields each larger than 0.76 million BOE remain to be discovered as of January 1, 1977, collectively containing 2.95 billion BOE, and (2) of the 776.6 total fields expected to be re maining to be discovered, 730.8 (94.1 percent) are ex pected to contain individually between 0.76 million and 12.14 million BOE.

26 FUTURE RATES OF OIL AND GAS DISCOVERIES, WESTERN GULF OF MEXICO
In the 1950's, 1960's, and into the early 1970's, fields in this size range were economically viable only under nearshore or similar low-cost conditions. We argue here that the large increase in the price of natural gas in the late 1970's (and also, to a degree, the associated increase in the price of crude oil) has been sufficient to allow fields even as small as 1 million to 2 million BOE (6-12 BCF of gas) to be commercial today in water 10-20 m deep. In the near future, newly devised com pletion techniques promise to make even smaller fields commercial. Therefore, we conclude that recent price increases as well as anticipated price increases along with the implementation of new production techniques have moved the economic truncation level to a level low enough that most fields predicted to remain to be discovered in size-classes 9 through 12 (0.76 million to 12.14 million BOE) in both the Miocene-Pliocene and Pleistocene trends are now commercially producible. More specifically, a large part of the 6.7 billion BOE predicted to remain to be discovered in both geologic trend areas in fields smaller than 12.14 million BOE now can be commercially developed after discovery, whereas before the mid-1970's, such small fields could not have been commercially developed. This 6.7 billion BOE in fields ranging in size from 0.76 million to 12.14 million BOE is, however, only 19.9 percent of the total volume of oil and gas that has been discovered and is pre dicted to remain to be discovered in the Gulf of Mexico.
Forecasts of the future rates of discovery of oil and gas fields in both geologic trend areas were made for a succession of wildcat drilling increments of 200 wells each. We forecasted that an additional 2,600 wildcat wells will be drilled in the combined Miocene-Pliocene trend before the yield per wildcat well is reduced to ap proximately half that to be obtained in the first drill ing increment (from 1.255 million to 0.625 million BOE per wildcat well). In the Pleistocene trend area, the forecasted yield per wildcat well in the first incre ment of 200 wildcats drilled after January 1, 1977, is 1.284 million BOE per wildcat well. This yield will be reduced to approximately half this level (0.602 million BOE per wildcat well) by the completion of the sixth drilling increment when 1,200 additional wildcat wells will have been drilled in this trend area. Given the prediction that many fields remain to be discovered in the Gulf of Mexico in water as deep as 200 m and that substantial discovery yields per wildcat well will be available from the drilling of at least 2,000 wildcat wells after January 1, 1977, in this region, we con
cluded that, if the rate of leasing is not greatly chang ed, the study area in the Gulf of Mexico will be an ac tive exploration theater into the late 1980's and even into the early 1990's.
REFERENCES CITED
Arps, J. J., and Roberts, T. G., 1958, Economics of drilling for Creta ceous oil on east flank of Denver-Julesburg basin: American Association of Petroleum Geologists Bulletin, v. 42, no. 11, p.2549-2566.
Drew, L. J., 1975, Linkage effects between deposit discovery and postdiscovery exploratory drilling: U.S. Geological Survey Jour nal of Research, v. 3, no. 2, p. 169-179.
Drew, L. J., Attanasi, E. D. and Root, D. H., [1977], Importance of physical parameters in petroleum supply models, in DeYoung, J. H., Jr., ed., Mineral policies in transition Proceedings of the Mineral Economics Symposium, November 8-9, 1977, Washing ton, D.C.: [Washington, D.C.], American Institute of Mining, Metallurgical, and Petroleum Engineers, p. 52-69. (Also pub lished in Materials and Society, 1979, v. 3, no. 2, p. 163-174.)
Drew, L. J., Root, D. H., and Bawiec, W. J., 1979, Estimating future rates of petroleum discoveries in the Permian basin, in SPE-AIME Symposium on Economics and Evaluation, 8th, Dallas, Tex., 1979, Proceedings: Dallas, American Institute of Mining, Metallurgical and Petroleum Engineers, Inc., Society of Petrole um Engineers, p. 101-106.
Drew, L. J., Schuenemeyer, J. H., and Bawiec, W. J., 1981, The effect of economic truncation on the apparent size distribution of oil and gas fields in the Gulf of Mexico [abs.]: 9th Geo Chautauqua, University of Miami, Fla., Jan. 9-10, 1981, 1 p. (mimeo).
Drew, L. J., Schuenemeyer, J. H., and Root, D. H., 1980, Petroleum- resource appraisal and discovery rate forecasting in partially ex plored regions An application to the Denver basin: U.S. Geological Survey Professional Paper 1138-A, 11 p.
Kaufman, G. M., Baker, Y., and Kruyt, D., 1975, A probabilistic model of oil and gas discovery, in Haun, J. D., ed., Methods of estimating the volume of undiscovered oil and gas resources: American Association of Petroleum Geologists Studies in Geology, no. 1, p. 113-142.
Marquardt, D. W., 1963, An algorithm for least-squares estimation of nonlinear parameters: Society for Industrial and Applied Mathematics Journal, v. 11, no. 2, p. 431-441.
Root, D. H., and Drew, L. J., 1979, The pattern of petroleum discovery rates: American Scientist, v. 67, no. 6, p. 648-652.
Ryan, J. T., 1973a, An analysis of crude-oil discovery rate in Alberta: Bulletin of Canadian Petroleum Geology, v. 21, no. 2, p. 219-235.
Ryan, J. T., 1973b, An estimate of the conventional crude-oil poten tial in Alberta: Bulletin of Canadian Petroleum Geology, v. 21, no. 2, p. 236-246.
Stanley, M. F., and Evans, R. W., 1979, Map of Texas Gulf Coast and Continental Shelf showing natural gas pipe lines: Houston, Texas, Transcontinental Gas Pipe Line Corporation and Transco Exploration Company.
Transcontinental Gas Pipe Line Corporation and Transco Explora tion Company, 1980, Map of South Louisiana and Continental Shelf showing natural gas pipe lines: Houston, Texas.