estonia corporate r&d report 2014 - deloitte · development, more attention in ... strategy...
TRANSCRIPT

EstoniaCorporate R&D Report2014
July 2014

2
3Estonia Corporate R&D Report 2014
Earlier this year, Deloitte carried out its second R&D survey across the CE region. The survey attempts to assess the factors that influence companies’ spending on R&D and to identify those of the greatest importance. This is the first time that Estonia has participated in the Deloitte Central Europe Corporate Research and Development survey and report. The majority of those taking part in this survey were from the retail and wholesale, financial and transpor-tation sectors.
According to the report, the Estonian state contributes to R&D activities significantly more than the private sector. In order to be successful in R&D, it is important to invest in it – but this understanding does not yet appear to have been embraced by the private sector.
In closing, I would like to thank all the companies who participated in the survey, and we hope that private sector will pay more and more attention to R&D so we can expect more detailed results in the next edition of our survey.
Veiko HintsovPartner, AuditDeloitte Estonia
The complexity of problems resulting from social chal-lenges is increasing globally. The main development objectives of countries are growth of a competitive economy, a successfully functioning society, high living standards and a healthy population growth.
The Estonian society and economy have developed rapidly over the past decade. To ensure further development, more attention in the right place in the international value chain is required to enhance the well-being of Estonians. To meet this goal, we have to invest much more in research and innovation.
Research and development (R&D) is important in the fields of education, culture, economy and society. Estonian Research and Development and Innovation Strategy 2014-2020 “Knowledge-based Estonia”, focuses on the following four sub-objectives:
• Estonian science is on high level of research and diverse
• R&D acts in interest of the Estonian society and the economy
• R&D is changing economic structure more knowledge-intensive
• Estonia is active and visible in international R&D cooperation
Foreword

4
Assessing the survey results
Based on the results of the study, 87.5% of surveyed companies regard R&D as dealing with the improve-ment of existing products, processes or services.
Half the sample, meanwhile, sees it as contributing to the development of new products or services.
The economy is strengthened when companies invest in their R&D activities to develop new products or improve existing ones. However, according to the study, investments in R&D activities in Estonia are very low.
75% of respondents invested less than 1% of their turnover in R&D in 2013, while 12.5% invested between 1% and 2%. The remaining 12.5% bucked the trend by investing more than 10%.
What best describes your R&D activity?
0%
10%
20%
30%
40%
50%
60%
70%
80%
Above 10%Between 1% and 3%Less than 1%
0% 10% 20% 30% 40% 50% 60% 70% 80% 90% 100%
Cooperation with external entities by means of purchasing R&D services/IP/know-how
Joint realization of research projects aiming at improvement or developmentof new products/processes/services with other capital group entities/
companies
Changes / improvements of existing products/processes/services leading to better performance/characteristics
of products/processes/services
Development of new products/processes/services
Developing important innovation/a breakthrough solution for various markets
50%
87.5%
37.5%
25%
0%
0%
10%
20%
30%
40%
50%
60%
70%
80%
Above 10%Between 1% and 3%Less than 1%
0% 10% 20% 30% 40% 50% 60% 70% 80% 90% 100%
Cooperation with external entities by means of purchasing R&D services/IP/know-how
Joint realization of research projects aiming at improvement or developmentof new products/processes/services with other capital group entities/
companies
Changes / improvements of existing products/processes/services leading to better performance/characteristics
of products/processes/services
Development of new products/processes/services
Developing important innovation/a breakthrough solution for various markets
What percentage of your turnover was spent on R&D in 2013?
75%
12.5% 12.5%

5Estonia Corporate R&D Report 2014
Companies are not very optimistic for the future. 62.5% estimate that they will invest as much in R&D during the next one to two years as they did in 2013, while 25% expect to invest more than they did in 2013 and 12.5% anticipate investing much less. Looking further ahead, 75% of respondents expect their three-to-five year investments to remain in the same range, and 25% of respondents expect to invest more than in 2013.
87.5% of the participants protect their trade secrets, and 62.5% their trademarks. Patents / utility models and copyright protection are not as prevalent (37.5% and 25% respectively).
As we say above, only 25% of respondents expect to invest more than last year during the next one to two years. The external factors that would be most impor-tant in increasing R&D spending are held to be more types of support (financial support, tax incentives, etc.) in place and especially compared to the tax incentives for more financial contributions, If there were to be more support, companies would invest more in their R&D activities. In addition, the increase of spending is positively correlated with having more association with universities and research institutes.
Companies also see a major problem in hiring a highly skilled workforce. All respondents found that in this respect there could be more tax incentives (especially relating to labour and fringe benefit taxes).
We have already mentioned the low level of participa-tion in the study; one reason for this, confirmed by the survey findings, is that companies are not aware of R&D opportunities. 37.5% of participants are not aware of available R&D grants, or they do not have enough opportunities to monitor the availability of grants and prepare successful applications. Just 12.5% of participating companies are both aware of the benefits of R&D grants and actually make use of them.
Based on the foregoing, it is understandable that only 37.5% of the participants collaborate with third parties in carrying out their R&D activities. Most of these third parties are universities and public research institu-tions, followed by private research and development centres or academic institutions. It is pleasing to note that the involvement of third parties is considered important in carrying out successful R&D activities, and not just because it is required for greater funding.
In conclusion, we can say that although the state’s contribution to Estonia’s R&D activities is large, certain barriers need to be removed, including the private sector’s limited knowledge, investment levels and academic collaboration, in order to enable businesses grow and help the state’s economy become stronger. In the years to come, increasing opportunities to participate in R&D opportunities and raise awareness of implementation are the most important keywords.

6
Regional perspective

7Estonia Corporate R&D Report 2014
The European Commission’s Innovation Union Scoreboard 2014 shows that among countries taking part in the survey, only Estonia is ranked in the group of so-called innovation followers (those whose innovation performance is close to or above the EU average). Croatia, the Czech Republic, Hungary, Lithuania, Poland and Slovakia are among the moderate innovators with performance below the EU average, while Bulgaria, Latvia and Romania are rated as modest innovators (innovation performance well below the EU average).
Innovation-wise we all are looking in the same direction. However, a differentiated approach to supporting R&D is apparent across the region. As the findings of last year’s survey showed, the R&D activities of companies vary across the region and different factors are influencing increase of spending on R&D. Much is however to be learnt and shared – this is one of main reasons for covering additional countries in this year’s survey, gathering data from 10 countries in the region. This brings us the opportunity to compare how countries stimulate R&D activities, how implemented systems are evaluated by enterprises and how this impacts the effectiveness of various systems.
Supplementary to the on-line survey, we have conducted detailed interviews with representatives of some of the best-known R&D developers in the region. Key quotes from these interviews provide a valuable complement to the survey conclusions presented in the report.
I very much hope that you find this report an interesting and insightful read.
Magdalena Burnat-MikoszPartnerCentral European Leader for Deloitte R&D and Government Incentives Service Line
Central European countries are in the process of transforming into knowledge–based economies. They can no longer compete with low-cost labour on the global market. This has already been acknowledged by Asian countries, whose share in global spending on R&D is still rising – from 33% in 2009 to nearly 40% in 2014 (and China’s from 10% to nearly 18%). In the meanwhile Europe is decreasing its participation – down from 26% of the total in 2009 to 22% in 20141.
After political changes, countries in the region have begun their transformation from a similar level although currently they are at different stages of development.
Partner’s Foreword
1 2014 Global R&D Funding Forecast by Battelle and R&D Magazine

8
Key trends and findings:
• Availabilityofmoretypesofincentivesisstillthe mostimportantfactoraffectingthe levelofexpenditureonR&D.Resultsofthe surveyshowthatcashgrantsareonlya slightlymorefrequentlyexpectedincentivethantaxreliefs–a mixedsystem,combiningthesetwoschemes,isperceivedasthe mosteffectivewaytosupportcompanies’R&Dactivities.Inordertomaintainthe presentrisingtrendofcompanies’shareinR&Dexpenditure,itisessentialtoadjustthe supportschemesavailableinCentralEuropetomatchenterpriseexpectations2.
• PredictedpercentageofR&Dexpendituresisdecliningoverall–morecompaniesareallocatinglessthan1%andunder3%oftheirturnovertoR&D,whilethoseallocatingover10%havedeclinedfrom24%to22.1%ofthe sample.Asindicatedabove,the availabilityofincentivesstronglyinfluencesR&Dspending;thismeansslightlypessimisticforecastsregardingshort-termR&Dspendingmayresultfromongoingworkonsupportschemesunderthe EU2014-2020agendaandlimitedavailabilityofgrants.
• Increasingnumbersofcompaniesarecollaboratingwithresearchunits,indicatinga trendtowardsstrengtheningco-operationbetweenbusinessandscience.The proportionofcompanieswiththeirownR&Dcentreisalsogrowing,andthisresultsinthe factthatthe availabilityofskilledandexperiencedresearchersisoneofthe mostimportantfactorsinfluencingR&Dexpenditure.However,the possibilityofco-operatingwithuniversities/researchinstitutesisstillhighlyappreciatedanddesirableinR&Dactivities.
2 In 2011 BERD (Business Expenditures on R&D) index value for Europe Union was 54.9% and only Estonia had this index value above the average (55%). The lowest index was in Bulgaria (16.9%), Latvia (24.8%), Poland (28.1%) and Lithuania (28.2%) – Eurostat

9Estonia Corporate R&D Report 2014
• Wecanseea numberofchangesinhowcompaniesdefineR&DandtheirR&Dactivities.Whilethe proportionoffirmsin2014definingR&D as changes / improvements of existing products / processes / services leading to better performance / characteristics of products / processes / services hasfallenfrom67%to65.2%,thisselectionhasalsomovedupfromthirdtofirstplace.The leadingdefinitionin2013(Development of new products / processes / services)hasfallenfrom88%to60%,whilethe thirdmostpopulardefinitionisjoint realisation of research projects aimed at improvement or development of new products/processes/services with other capital group entities/companies.(Itrisesfromfourthtothirddespitea reductioninsupportfrom49%to29.4%).ClearandtransparentunderstandingofR&Disbeingunderlinedbyfirmsinthe regionasimportantfactorforallsupportschemes.
• IP/know-howareprotectedusuallyinthe formofa companysecretspolicyandtrademarks.However,companiesdeclarethatthe mosteffectivewayistocombinedifferentformsofprotectionandtailorthemtothe specificneedsofdifferentsectors.

10
Definition of companies’ R&D activities
Within last year’s survey, respondents were asked to define their understanding of R&D. This year, we invited them to describe their R&D activities – and there have been some major changes in their answers. In the 2014 report, 65.2% of companies across the region defined R&D activity as making Changes / improvements to existing products / processes / services, leading to better performance / characteris-tics of products / processes / services. This was a small decline comparing to 2013’s 67%, but despite this the definition has moved up from number three to the number one choice. Its new popularity was driven up by above average selection in Estonia (87.5%) and Romania (78.6%).
In the 2013 report, the leading definition of choice was the Development of new products / processes / services, chosen by 88% of respondents. In 2014, this has slipped to 60%, although it attracted 75% of respondents in Lithuania.
2014’s third most popular definition, with 29.4%, is the Joint realisation of research projects aimed at improvement or development of new products / processes / services with other capital group entities / companies. In the 2013 report, this was number four with 49%. This year, it was driven up by above average scores in Romania (over 46%) and Estonia (over 37%).
Perhaps the most significant change in the definition of R&D activities appeared within the Co-operation with external entities by means of purchasing R&D services/IP/know-how. This has been observed particularly among Polish respondents – last year, 68% declared that it is how they understand R&D activities; this year, that figure went down to 19.4%.
Findings
What best describes your R&D activity?
0% 10% 20% 30% 40% 50% 60% 70% 80% 90%
Cooperation with external entities by meansof purchasing R&D services / IP / know-how
Developing important innovation /a breakthrough solution for various markets
Joint realization of research projects aiming at improvementor development of new products / processes /
services with other capital group entities / companies
Development of new products / processes / services
Changes / improvements of existing products /processes / services leading to better performance /
characteristics of products/processes/services
0,0 0,5 1,0 1,5 2,0 2,5
Other factors
Possibility of cofinancing costs of IP protection procedures,including costs of protection maintenance period
Access to the R&D sectoral benchmarks
Protection of intellectual property rights
More R&D tax incentives compared to R&D cash grants
Stability of the regulatory environment
Access to and cooperation with universities / research
Costs of researchers
More R&D cash grants compared to R&D tax incentives
Availability of experienced researchers
Availability of skilled researchers
Availability of more types of benefits
0% 5% 10% 15% 20% 25% 30%
Other
My company is familiar with how to prove that its activities are R&Dbut the company’s reporting / cost tracking / time sheet / etc. systems
are not capable of appropriate recording / proof of related costs
I believe that my company does not carry out any R&D activities /projects that would be eligible for R&D tax incentives
My company is familiar with R&D tax incentives but uncertainabout which activity could be classified as R&D and how to prove
that its activities are R&D (classification of activities as R&D activities)
R&D tax regulations are not clearand are presenting too many risks for the company
My company is not very familiar with the methodson how risks related to classification
of its activities as R&D could be managed
My company is uncertain about the approachof the tax authority with respect to R&D costs;
therefore I find the use of these tax incentives risky
My company is rather unfamiliar with R&D tax incentives
0% 5% 10% 15% 20% 25% 30% 35% 40%
Grant opportunities relevant for our company wouldrequire involvement of partners (consortium), but the nature
of our R&D project / our business interests do not allowsuch co-operation with third parties
Do not use them
Has no sufficient resources to monitor such opportunitiesand eventually prepare successful application(s)
Not very familiar with R&D grants
Familiar with R&D grants and use them
0,0 0,4 0,8 1,2 1,6 2,0
R&D organizational structure
IP protection policy
Existence of R&D procedures
External cooperation
R&D portfolio management
Human capital management focused on recruitingand retaining most valuable people
R&D financing
0% 10% 20% 30% 40% 50% 60% 70%
None
Industrial design
Copyright
Trademark
Patents / utility design
Company secrets policy
65,2%
67,0%
60,0%
88,0%
29,4%
49,0%
24,5%
81,0%
13,9%
25,0%
2013
2014

11Estonia Corporate R&D Report 2014
Spending on R&D
The 2014 report shows that in 2013 20.6% of companies allocated less than 1% of their turnover to R&D – this went up from 15% in 2012. There was also an increase in companies allocating less than 3% of their turnover to R&D (rising to 41.8% from 36% in 2012).
Meanwhile, just 22.1% of companies allocated more than 10% of their turnover on R&D, down from 24%. However, in Slovakia (as in the previous year) and Bulgaria the percentage is well above average at 54.5% and 40% respectively.
Only 5.5% of companies allocated no expenditure for R&D activities in 2013, down from 2012’s 10%. Hungary (17.8%) and Poland (9.7%), however both significantly exceeded the average.
20.5% of companies in Croatia, 12.1% in Slovakia and 11.1% in Poland do not know how much expenditure has been allocated to R&D activities. In Poland, this might be the case because there are no effective incentives in place that encourage them to keep solid records of their R&D expenditure.
Across the region, 88.5% of companies plan to maintain the current level of spending or increase it in the short term (one to two years). At the same time, 89.7% expect to maintain or increase spending in the next three to five years. All the respondent companies in Lithuania and Estonia are confident that there will be no decrease in spending on R&D over the next five years.
Across the region, 4.8% of respondents expect to make no expenditure in the next five years - only in Bulgaria, Estonia and Lithuania did no respondents make this claim. It is also worth noting the results from Romania, where 67.9% of companies plan to increase expenditure in the next two years and 78.6% in the next three to five years (the averages for the region are 42% and 58% respectively).
Responses indicate positive forecasts in terms of the economic situation of companies, and may result from the fact that in years to come significant R&D support will be available from EU funds.
What percentage of your turnover was spent on R&D in 2013?0% 10% 20% 30% 40% 50% 60% 70% 80% 90%
Cooperation with external entities by meansof purchasing R&D services / IP / know-how
Developing important innovation /a breakthrough solution for various markets
Joint realization of research projects aiming at improvementor development of new products / processes /
services with other capital group entities / companies
Development of new products / processes / services
Changes / improvements of existing products /processes / services leading to better performance /
characteristics of products/processes/services
0,0 0,5 1,0 1,5 2,0 2,5
Other factors
Possibility of cofinancing costs of IP protection procedures,including costs of protection maintenance period
Access to the R&D sectoral benchmarks
Protection of intellectual property rights
More R&D tax incentives compared to R&D cash grants
Stability of the regulatory environment
Access to and cooperation with universities / research
Costs of researchers
More R&D cash grants compared to R&D tax incentives
Availability of experienced researchers
Availability of skilled researchers
Availability of more types of benefits
0% 5% 10% 15% 20% 25% 30%
Other
My company is familiar with how to prove that its activities are R&Dbut the company’s reporting / cost tracking / time sheet / etc. systems
are not capable of appropriate recording / proof of related costs
I believe that my company does not carry out any R&D activities /projects that would be eligible for R&D tax incentives
My company is familiar with R&D tax incentives but uncertainabout which activity could be classified as R&D and how to prove
that its activities are R&D (classification of activities as R&D activities)
R&D tax regulations are not clearand are presenting too many risks for the company
My company is not very familiar with the methodson how risks related to classification
of its activities as R&D could be managed
My company is uncertain about the approachof the tax authority with respect to R&D costs;
therefore I find the use of these tax incentives risky
My company is rather unfamiliar with R&D tax incentives
0% 5% 10% 15% 20% 25% 30% 35% 40%
Grant opportunities relevant for our company wouldrequire involvement of partners (consortium), but the nature
of our R&D project / our business interests do not allowsuch co-operation with third parties
Do not use them
Has no sufficient resources to monitor such opportunitiesand eventually prepare successful application(s)
Not very familiar with R&D grants
Familiar with R&D grants and use them
0,0 0,4 0,8 1,2 1,6 2,0
R&D organizational structure
IP protection policy
Existence of R&D procedures
External cooperation
R&D portfolio management
Human capital management focused on recruitingand retaining most valuable people
R&D financing
0% 10% 20% 30% 40% 50% 60% 70%
None
Industrial design
Copyright
Trademark
Patents / utility design
Company secrets policy
7,3%
5,5%
20,6%
21,2%10,6%
12,4%
22,1%
Between 1% and 3%
Between 5% and 10%
None
Above 10%
Less than 1%
Between 3% and 5 %
I do not know

12
To what extent would the external factors mentioned below influence the increase of your R&D spending in the coming 1-2 years?
0% 10% 20% 30% 40% 50% 60% 70% 80% 90%
Cooperation with external entities by meansof purchasing R&D services / IP / know-how
Developing important innovation /a breakthrough solution for various markets
Joint realization of research projects aiming at improvementor development of new products / processes /
services with other capital group entities / companies
Development of new products / processes / services
Changes / improvements of existing products /processes / services leading to better performance /
characteristics of products/processes/services
0,0 0,5 1,0 1,5 2,0 2,5
Other factors
Possibility of cofinancing costs of IP protection procedures,including costs of protection maintenance period
Access to the R&D sectoral benchmarks
Protection of intellectual property rights
More R&D tax incentives compared to R&D cash grants
Stability of the regulatory environment
Access to and cooperation with universities / research
Costs of researchers
More R&D cash grants compared to R&D tax incentives
Availability of experienced researchers
Availability of skilled researchers
Availability of more types of benefits
0% 5% 10% 15% 20% 25% 30%
Other
My company is familiar with how to prove that its activities are R&Dbut the company’s reporting / cost tracking / time sheet / etc. systems
are not capable of appropriate recording / proof of related costs
I believe that my company does not carry out any R&D activities /projects that would be eligible for R&D tax incentives
My company is familiar with R&D tax incentives but uncertainabout which activity could be classified as R&D and how to prove
that its activities are R&D (classification of activities as R&D activities)
R&D tax regulations are not clearand are presenting too many risks for the company
My company is not very familiar with the methodson how risks related to classification
of its activities as R&D could be managed
My company is uncertain about the approachof the tax authority with respect to R&D costs;
therefore I find the use of these tax incentives risky
My company is rather unfamiliar with R&D tax incentives
0% 5% 10% 15% 20% 25% 30% 35% 40%
Grant opportunities relevant for our company wouldrequire involvement of partners (consortium), but the nature
of our R&D project / our business interests do not allowsuch co-operation with third parties
Do not use them
Has no sufficient resources to monitor such opportunitiesand eventually prepare successful application(s)
Not very familiar with R&D grants
Familiar with R&D grants and use them
0,0 0,4 0,8 1,2 1,6 2,0
R&D organizational structure
IP protection policy
Existence of R&D procedures
External cooperation
R&D portfolio management
Human capital management focused on recruitingand retaining most valuable people
R&D financing
0% 10% 20% 30% 40% 50% 60% 70%
None
Industrial design
Copyright
Trademark
Patents / utility design
Company secrets policy
2,112,22
1,941,92
1,87
1,821,67
1,781,44
1,541,42
1,51,61
1,36
1,321,29
1,28
1,21
0,321,14
2013
2014

13Estonia Corporate R&D Report 2014
As in the previous survey, the most important factor affecting the level of expenditure on R&D over the next two years is to be the availability of more types of incentives – this was chosen as the most important factor by more than 50% of companies in Bulgaria, Estonia and Romania, and almost 54% of companies in Poland.
The next most important factors are the availability of skilled and experienced researchers (particularly impor-tant in Bulgaria and Lithuania, where it is the most important factor for over 60% of companies) and issues related to the cost of R&D activities (selected by 50% of companies from Lithuania).
Respondents indicate that the availability of grants stimulates spending more than the availability of tax incentives. This is particularly the case for companies in Bulgaria and Poland, where 48% or more chose this answer. The importance of grants is growing too – in 2014, they were chosen by 34.5% of respondents across the region, compared to 22% in 2013.
In Slovakia, while over 50% of companies declare that grants are more important than tax incentives in influencing their R&D expenditure, only 12% say more tax incentives would not be an influencing factor. This is of significant importance as a new tax incentive is to be introduced there on July 1st 2014, which is expected to have a positive impact on R&D spending in Slovakia.
One factor that has declined in importance is the stability of the regulatory environment. In 2013, this was the factor with the greatest impact on expenditure for 22% of respondents; in 2014, it has fallen to 18.8%. This may mean that there is a gener-ally positive attitude to those authorities that have not made significant changes in the legislation regulating R&D.
Almost 47% of companies in Latvia consider the possibility of co-financing the costs of IP protec-tion procedures, including the costs of maintaining protection, to be a factor with no influence on their R&D spending.
The internationalexperienceofGMindicatesthatthe availabilityofincentivesforR&Dactivities,thatmaybean elementofa long-termdevelopmentstrategy,significantlyfacilitates“acquisition”andexecutionofhigh-techprojectsbycompaniesinlocalcountries.
Paweł Widel, Governmental Relations Director, General Motors Poland Sp. z o.o.
14
Companies’ R&D policies and Intellectual Property / know-how protection
Almost 21% of companies in the region say they have no R&D policy. Clearly above average in having no policy are companies from Estonia (50%), Hungary (42.2%), Croatia (28.2%) and Poland (27.8%).
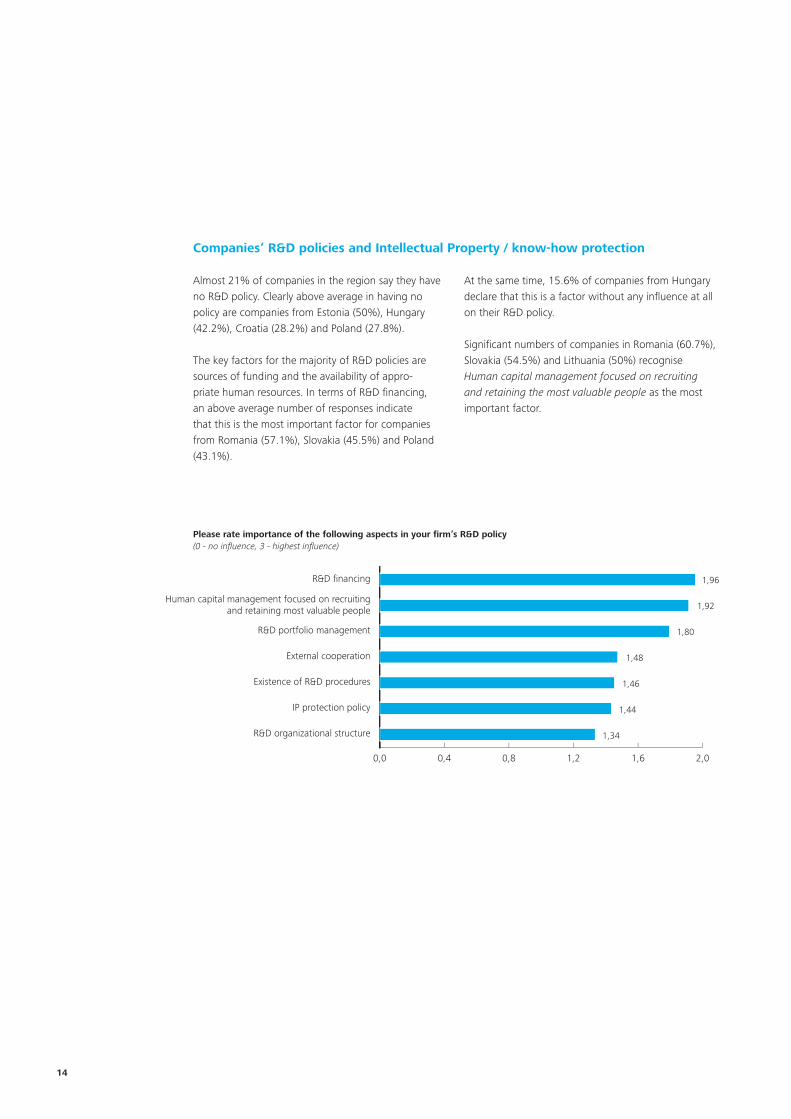
The key factors for the majority of R&D policies are sources of funding and the availability of appro-priate human resources. In terms of R&D financing, an above average number of responses indicate that this is the most important factor for companies from Romania (57.1%), Slovakia (45.5%) and Poland (43.1%).
At the same time, 15.6% of companies from Hungary declare that this is a factor without any influence at all on their R&D policy.
Significant numbers of companies in Romania (60.7%), Slovakia (54.5%) and Lithuania (50%) recognise Human capital management focused on recruiting and retaining the most valuable people as the most important factor.
Please rate importance of the following aspects in your firm’s R&D policy(0 - no influence, 3 - highest influence)
0% 10% 20% 30% 40% 50% 60% 70% 80% 90%
Cooperation with external entities by meansof purchasing R&D services / IP / know-how
Developing important innovation /a breakthrough solution for various markets
Joint realization of research projects aiming at improvementor development of new products / processes /
services with other capital group entities / companies
Development of new products / processes / services
Changes / improvements of existing products /processes / services leading to better performance /
characteristics of products/processes/services
0,0 0,5 1,0 1,5 2,0 2,5
Other factors
Possibility of cofinancing costs of IP protection procedures,including costs of protection maintenance period
Access to the R&D sectoral benchmarks
Protection of intellectual property rights
More R&D tax incentives compared to R&D cash grants
Stability of the regulatory environment
Access to and cooperation with universities / research
Costs of researchers
More R&D cash grants compared to R&D tax incentives
Availability of experienced researchers
Availability of skilled researchers
Availability of more types of benefits
0% 5% 10% 15% 20% 25% 30%
Other
My company is familiar with how to prove that its activities are R&Dbut the company’s reporting / cost tracking / time sheet / etc. systems
are not capable of appropriate recording / proof of related costs
I believe that my company does not carry out any R&D activities /projects that would be eligible for R&D tax incentives
My company is familiar with R&D tax incentives but uncertainabout which activity could be classified as R&D and how to prove
that its activities are R&D (classification of activities as R&D activities)
R&D tax regulations are not clearand are presenting too many risks for the company
My company is not very familiar with the methodson how risks related to classification
of its activities as R&D could be managed
My company is uncertain about the approachof the tax authority with respect to R&D costs;
therefore I find the use of these tax incentives risky
My company is rather unfamiliar with R&D tax incentives
0% 5% 10% 15% 20% 25% 30% 35% 40%
Grant opportunities relevant for our company wouldrequire involvement of partners (consortium), but the nature
of our R&D project / our business interests do not allowsuch co-operation with third parties
Do not use them
Has no sufficient resources to monitor such opportunitiesand eventually prepare successful application(s)
Not very familiar with R&D grants
Familiar with R&D grants and use them
0,0 0,4 0,8 1,2 1,6 2,0
R&D organizational structure
IP protection policy
Existence of R&D procedures
External cooperation
R&D portfolio management
Human capital management focused on recruitingand retaining most valuable people
R&D financing
0% 10% 20% 30% 40% 50% 60% 70%
None
Industrial design
Copyright
Trademark
Patents / utility design
Company secrets policy
1,96
1,92
1,80
1,48
1,46
1,44
1,34
15Estonia Corporate R&D Report 2014
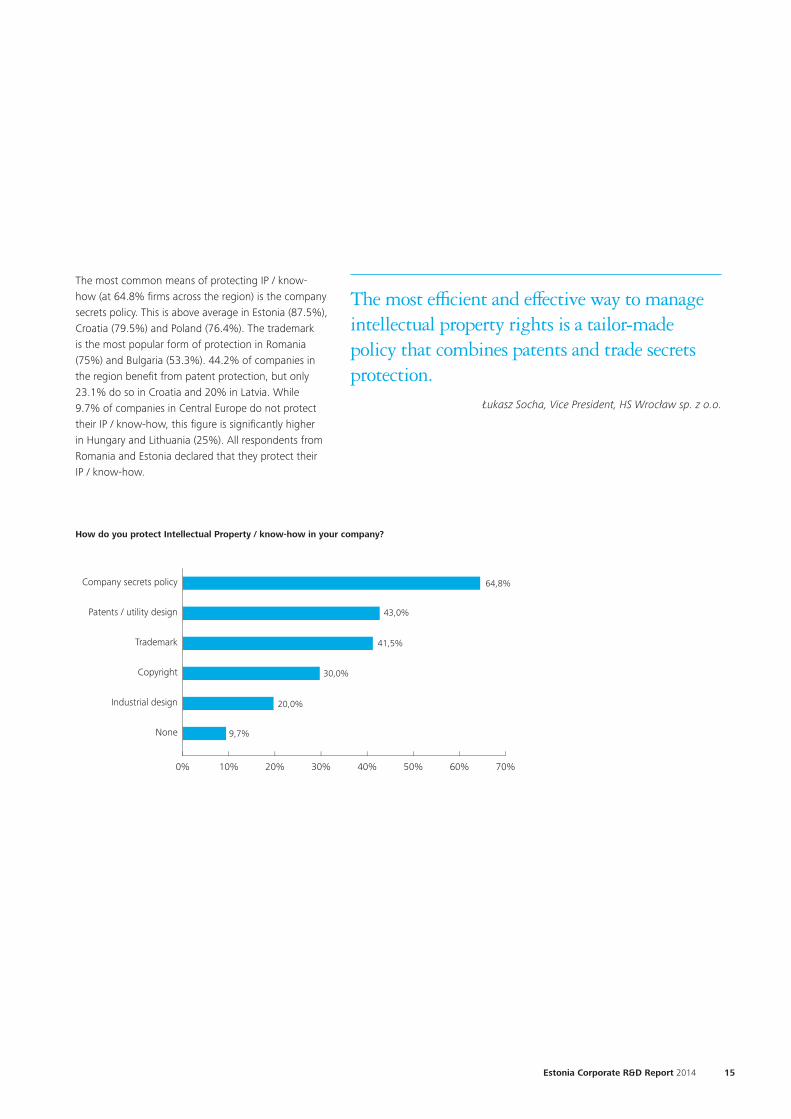
The most common means of protecting IP / know-how (at 64.8% firms across the region) is the company secrets policy. This is above average in Estonia (87.5%), Croatia (79.5%) and Poland (76.4%). The trademark is the most popular form of protection in Romania (75%) and Bulgaria (53.3%). 44.2% of companies in the region benefit from patent protection, but only 23.1% do so in Croatia and 20% in Latvia. While 9.7% of companies in Central Europe do not protect their IP / know-how, this figure is significantly higher in Hungary and Lithuania (25%). All respondents from Romania and Estonia declared that they protect their IP / know-how.
The mostefficientandeffectivewaytomanageintellectualpropertyrightsisa tailor-madepolicythatcombinespatentsandtradesecretsprotection.
Łukasz Socha, Vice President, HS Wrocław sp. z o.o.
How do you protect Intellectual Property / know-how in your company?
0% 10% 20% 30% 40% 50% 60% 70% 80% 90%
Cooperation with external entities by meansof purchasing R&D services / IP / know-how
Developing important innovation /a breakthrough solution for various markets
Joint realization of research projects aiming at improvementor development of new products / processes /
services with other capital group entities / companies
Development of new products / processes / services
Changes / improvements of existing products /processes / services leading to better performance /
characteristics of products/processes/services
0,0 0,5 1,0 1,5 2,0 2,5
Other factors
Possibility of cofinancing costs of IP protection procedures,including costs of protection maintenance period
Access to the R&D sectoral benchmarks
Protection of intellectual property rights
More R&D tax incentives compared to R&D cash grants
Stability of the regulatory environment
Access to and cooperation with universities / research
Costs of researchers
More R&D cash grants compared to R&D tax incentives
Availability of experienced researchers
Availability of skilled researchers
Availability of more types of benefits
0% 5% 10% 15% 20% 25% 30%
Other
My company is familiar with how to prove that its activities are R&Dbut the company’s reporting / cost tracking / time sheet / etc. systems
are not capable of appropriate recording / proof of related costs
I believe that my company does not carry out any R&D activities /projects that would be eligible for R&D tax incentives
My company is familiar with R&D tax incentives but uncertainabout which activity could be classified as R&D and how to prove
that its activities are R&D (classification of activities as R&D activities)
R&D tax regulations are not clearand are presenting too many risks for the company
My company is not very familiar with the methodson how risks related to classification
of its activities as R&D could be managed
My company is uncertain about the approachof the tax authority with respect to R&D costs;
therefore I find the use of these tax incentives risky
My company is rather unfamiliar with R&D tax incentives
0% 5% 10% 15% 20% 25% 30% 35% 40%
Grant opportunities relevant for our company wouldrequire involvement of partners (consortium), but the nature
of our R&D project / our business interests do not allowsuch co-operation with third parties
Do not use them
Has no sufficient resources to monitor such opportunitiesand eventually prepare successful application(s)
Not very familiar with R&D grants
Familiar with R&D grants and use them
0,0 0,4 0,8 1,2 1,6 2,0
R&D organizational structure
IP protection policy
Existence of R&D procedures
External cooperation
R&D portfolio management
Human capital management focused on recruitingand retaining most valuable people
R&D financing
0% 10% 20% 30% 40% 50% 60% 70%
None
Industrial design
Copyright
Trademark
Patents / utility design
Company secrets policy 64,8%
43,0%
41,5%
30,0%
20,0%
9,7%

16
Usage of R&D grants and tax incentives
Increasing numbers of companies say they are not very familiar with the methods of managing risks associ-ated with the classification of their activities as R&D; this has risen from 19% in 2013 to 22.7% in this year’s report. Also rising are those saying that R&D tax regu-lations are not clear and present the company with too many risks (up from 18% to 22.1%). These find-ings may mean that the systems of R&D tax incentives are becoming unclear; fewer companies are therefore
benefitting from it, leading to a strong preference for grants (as shown by the answer to the previous ques-tion). There is a lack of knowledge about tax incentives among 67% of companies from Bulgaria. In Latvia, 60% of companies state that they do not carry out any R&D activities or projects that would be eligible for R&D tax incentives. This is an important finding given the introduction of a new R&D tax incentive on July 1st 2014.
Companies’ statements about R&D tax incentives
0% 10% 20% 30% 40% 50% 60% 70% 80% 90%
Cooperation with external entities by meansof purchasing R&D services / IP / know-how
Developing important innovation /a breakthrough solution for various markets
Joint realization of research projects aiming at improvementor development of new products / processes /
services with other capital group entities / companies
Development of new products / processes / services
Changes / improvements of existing products /processes / services leading to better performance /
characteristics of products/processes/services
0,0 0,5 1,0 1,5 2,0 2,5
Other factors
Possibility of cofinancing costs of IP protection procedures,including costs of protection maintenance period
Access to the R&D sectoral benchmarks
Protection of intellectual property rights
More R&D tax incentives compared to R&D cash grants
Stability of the regulatory environment
Access to and cooperation with universities / research
Costs of researchers
More R&D cash grants compared to R&D tax incentives
Availability of experienced researchers
Availability of skilled researchers
Availability of more types of benefits
0% 5% 10% 15% 20% 25% 30%
Other
My company is familiar with how to prove that its activities are R&Dbut the company’s reporting / cost tracking / time sheet / etc. systems
are not capable of appropriate recording / proof of related costs
I believe that my company does not carry out any R&D activities /projects that would be eligible for R&D tax incentives
My company is familiar with R&D tax incentives but uncertainabout which activity could be classified as R&D and how to prove
that its activities are R&D (classification of activities as R&D activities)
R&D tax regulations are not clearand are presenting too many risks for the company
My company is not very familiar with the methodson how risks related to classification
of its activities as R&D could be managed
My company is uncertain about the approachof the tax authority with respect to R&D costs;
therefore I find the use of these tax incentives risky
My company is rather unfamiliar with R&D tax incentives
0% 5% 10% 15% 20% 25% 30% 35% 40%
Grant opportunities relevant for our company wouldrequire involvement of partners (consortium), but the nature
of our R&D project / our business interests do not allowsuch co-operation with third parties
Do not use them
Has no sufficient resources to monitor such opportunitiesand eventually prepare successful application(s)
Not very familiar with R&D grants
Familiar with R&D grants and use them
0,0 0,4 0,8 1,2 1,6 2,0
R&D organizational structure
IP protection policy
Existence of R&D procedures
External cooperation
R&D portfolio management
Human capital management focused on recruitingand retaining most valuable people
R&D financing
0% 10% 20% 30% 40% 50% 60% 70%
None
Industrial design
Copyright
Trademark
Patents / utility design
Company secrets policy
27,6%
25,3%
27,3%
27,5%
22,7%
18,5%
22,1%
17,6%
22,1%
23,2%
18,8%
20,6%
13,3%
12,9%
11,5%
11,6%
2013
2014

17Estonia Corporate R&D Report 2014
Across the CE region, 37% of companies are familiar with and use R&D grant opportunities (up from 31% in the 2013 survey). This proportion is particularly high in the Czech Republic (almost 60%) and far below average in the Baltic countries (16%). At the same time, 23% of respondents across the region are not very familiar with R&D grants (rising to 43.6% in Croatia and 42.9% in Romania).
In addition, 19.4% of respondents indicate that they do not have sufficient resources to monitor grant opportunities and submit a successful application (down from 25% in 2013); in Poland, however, the figure is almost twice as high at 36.1% (an increase from 29% in 2013). Such answers about discouraging bureaucracy and doubts concerning the use of available sources of support are particularly alarming when we consider that companies claim that their R&D spending is largely determined by the avail-ability of external funding.
Companies’ statements about R&D grants
0% 10% 20% 30% 40% 50% 60% 70% 80% 90%
Cooperation with external entities by meansof purchasing R&D services / IP / know-how
Developing important innovation /a breakthrough solution for various markets
Joint realization of research projects aiming at improvementor development of new products / processes /
services with other capital group entities / companies
Development of new products / processes / services
Changes / improvements of existing products /processes / services leading to better performance /
characteristics of products/processes/services
0,0 0,5 1,0 1,5 2,0 2,5
Other factors
Possibility of cofinancing costs of IP protection procedures,including costs of protection maintenance period
Access to the R&D sectoral benchmarks
Protection of intellectual property rights
More R&D tax incentives compared to R&D cash grants
Stability of the regulatory environment
Access to and cooperation with universities / research
Costs of researchers
More R&D cash grants compared to R&D tax incentives
Availability of experienced researchers
Availability of skilled researchers
Availability of more types of benefits
0% 5% 10% 15% 20% 25% 30%
Other
My company is familiar with how to prove that its activities are R&Dbut the company’s reporting / cost tracking / time sheet / etc. systems
are not capable of appropriate recording / proof of related costs
I believe that my company does not carry out any R&D activities /projects that would be eligible for R&D tax incentives
My company is familiar with R&D tax incentives but uncertainabout which activity could be classified as R&D and how to prove
that its activities are R&D (classification of activities as R&D activities)
R&D tax regulations are not clearand are presenting too many risks for the company
My company is not very familiar with the methodson how risks related to classification
of its activities as R&D could be managed
My company is uncertain about the approachof the tax authority with respect to R&D costs;
therefore I find the use of these tax incentives risky
My company is rather unfamiliar with R&D tax incentives
0% 5% 10% 15% 20% 25% 30% 35% 40%
Grant opportunities relevant for our company wouldrequire involvement of partners (consortium), but the nature
of our R&D project / our business interests do not allowsuch co-operation with third parties
Do not use them
Has no sufficient resources to monitor such opportunitiesand eventually prepare successful application(s)
Not very familiar with R&D grants
Familiar with R&D grants and use them
0,0 0,4 0,8 1,2 1,6 2,0
R&D organizational structure
IP protection policy
Existence of R&D procedures
External cooperation
R&D portfolio management
Human capital management focused on recruitingand retaining most valuable people
R&D financing
0% 10% 20% 30% 40% 50% 60% 70%
None
Industrial design
Copyright
Trademark
Patents / utility design
Company secrets policy
37,0%
30,5%
23,0%
21,9%
19,4%
24,5%
13,6%
15,5%
9,4%
4,3%
2013
2014

18
Co-operation with third parties while carrying out R&D projects
A very high proportion (78.2%) of companies say they work with third parties during the implementation of R&D projects (up from 65% in 2013). While the most important primary factor driving co-operation across the region is that it’s vital to carrying out projects, grant requirements and the possibility of receiving higher funding are almost equally important in Poland. For those companies that have their own R&D centres (either within the immediate structure of the business or in a sister firm in the same capital group), this is the most important reason for not collaborating with third parties.
While most companies in the CE region co-operate with universities / academies of science, there is an increase in the importance of public and private R&D / scientific institutes (29.8% and 35.7% respec-tively, up from 25.8% and 33.8%).
Cooperation with third parties when the companies are carrying out R&D projects
0% 10% 20% 30% 40% 50% 60% 70% 80% 90%
Cooperation with external entities by meansof purchasing R&D services / IP / know-how
Developing important innovation /a breakthrough solution for various markets
Joint realization of research projects aiming at improvementor development of new products / processes /
services with other capital group entities / companies
Development of new products / processes / services
Changes / improvements of existing products /processes / services leading to better performance /
characteristics of products/processes/services
0,0 0,5 1,0 1,5 2,0 2,5
Other factors
Possibility of cofinancing costs of IP protection procedures,including costs of protection maintenance period
Access to the R&D sectoral benchmarks
Protection of intellectual property rights
More R&D tax incentives compared to R&D cash grants
Stability of the regulatory environment
Access to and cooperation with universities / research
Costs of researchers
More R&D cash grants compared to R&D tax incentives
Availability of experienced researchers
Availability of skilled researchers
Availability of more types of benefits
0% 5% 10% 15% 20% 25% 30%
Other
My company is familiar with how to prove that its activities are R&Dbut the company’s reporting / cost tracking / time sheet / etc. systems
are not capable of appropriate recording / proof of related costs
I believe that my company does not carry out any R&D activities /projects that would be eligible for R&D tax incentives
My company is familiar with R&D tax incentives but uncertainabout which activity could be classified as R&D and how to prove
that its activities are R&D (classification of activities as R&D activities)
R&D tax regulations are not clearand are presenting too many risks for the company
My company is not very familiar with the methodson how risks related to classification
of its activities as R&D could be managed
My company is uncertain about the approachof the tax authority with respect to R&D costs;
therefore I find the use of these tax incentives risky
My company is rather unfamiliar with R&D tax incentives
0% 5% 10% 15% 20% 25% 30% 35% 40%
Grant opportunities relevant for our company wouldrequire involvement of partners (consortium), but the nature
of our R&D project / our business interests do not allowsuch co-operation with third parties
Do not use them
Has no sufficient resources to monitor such opportunitiesand eventually prepare successful application(s)
Not very familiar with R&D grants
Familiar with R&D grants and use them
0,0 0,4 0,8 1,2 1,6 2,0
R&D organizational structure
IP protection policy
Existence of R&D procedures
External cooperation
R&D portfolio management
Human capital management focused on recruitingand retaining most valuable people
R&D financing
0% 10% 20% 30% 40% 50% 60% 70%
None
Industrial design
Copyright
Trademark
Patents / utility design
Company secrets policy
Our Company has got an R&D Centre in other firm of capital group
It is required in order to receive higher cash grant for conducting an R&D project
It is required to apply for grant
Yes
Other reason
Other reason
No
Our Company has got an R&D Centre It is needed for conducting out research projects
43,1%
43,1%
20,8%
21,8%
78,2%
25,2%
7,4%
68,6%
22,5%

19Estonia Corporate R&D Report 2014

20
Regional contacts
R&D and Government Incentives
CENTRAL EUROPEMagdalena Burnat-MikoszPartnerPhone: +48 22 511 00 65E-mail: [email protected]
BULGARIAGeorgi SarakostovPartnerPhone: +359 (2) 8023 118E-mail: [email protected]
CROATIASonja IfkovićDirectorPhone: +36 1 2351 915E-mail: [email protected]
CZECH REPUBLICLuděk HanáčekDirectorPhone: +420 246 042 108E-mail: [email protected]
ESTONIAVeiko HintsovPartnerPhone: +372 6406512E-mail: [email protected]
HUNGARYDr. Csaba MarkusDirectorPhone: +36 (1) 428 6793E-mail: [email protected]
LATVIAJānis ČupānsDirectorPhone: +371 (6) 7074171E-mail: [email protected]
LITHUANIATatjana VaičiulienėDirectorPhone: +370 (5) 2553004E-mail: [email protected]
POLANDMagdalena Burnat-MikoszPartnerPhone: +48 (22) 511 00 65E-mail: [email protected]
Michał TurczykDirectorPhone: +48 (12) 394 43 38E-mail: [email protected]
ROMANIAOana PetrescuPartnerPhone: +40 (21) 2075 288E-mail: [email protected]
SLOVAKIAMartin RybarDirectorPhone: +421 258 249 113E-mail: [email protected]
CE Clients & Markets
Halina FrańczakDirectorPhone: +48 (22) 511 00 21E-mail: [email protected]
Cem TuranManagerPhone: +420 234 078 464E-mail: [email protected]

21Estonia Corporate R&D Report 2014
Local contacts
Veiko HintsovPartner+372 640 [email protected] Ivo VanasaunManager, Tax+372 640 [email protected]
Gisela ToomesooManager, Margeting+372 640 [email protected]

22

23Estonia Corporate R&D Report 2014

This publication contains general information only, and none of Deloitte Touche Tohmatsu Limited, any of its member firms or any of the foregoing’saffiliates (collectively the “Deloitte Network”) are, by means of this publication, rendering accounting, business, financial, investment, legal, tax, or otherprofessional advice or services.
This publication is not a substitute for such professional advice or services, nor should it be used as a basis for any decision or action that may affect yourfinances or your business. Before making any decision or taking any action that may affect your finances or your business, you should consult a qualifiedprofessional adviser. No entity in the Deloitte Network shall be responsible for any loss whatsoever sustained by any person who relies on this publication.
***
“Deloitte” is the brand under which tens of thousands of dedicated professionals in independent firms throughout the world collaborate to provide audit, consulting, financial advisory, risk management, and tax and legal services to selected clients. These firms are members of Deloitte Touche Tohmatsu Limited (DTTL), a UK private company limited by guarantee. Each member firm provides services in a particular geographic area and is subject to the laws and professional regulations of the particular country or countries in which it operates. DTTL does not itself provide services to clients. DTTL and DTTL member firm are separate and distinct legal entities, which cannot obligate the other entities. DTTL and each DTTL member firm are only liable for their own acts or omissions, and not those of each other. Each of the member firms operates under the names “Deloitte”, “Deloitte & Touche”, “Deloitte Touche Tohmatsu”, or other related names. Each DTTL member firm is structured differently in accordance with national laws, regulations, customary practice, and other factors, and may secure the provision of professional services in their territories through subsidiaries, affiliates, and/or other entities.
Deloitte Central Europe is a regional organization of entities organized under the umbrella of Deloitte Central Europe Holdings Limited, the member firm in Central Europe of Deloitte Touche Tohmatsu Limited. Services are provided by the subsidiaries and affiliates of Deloitte Central Europe Holdings Limited, which are separate and independent legal entities. The subsidiaries and affiliates of Deloitte Central Europe Holdings Limited are among the region’s leading professional services firms, providing services through more than 3,900 people in 34 offices in 17 countries.
Deloitte provides audit, tax, consulting, and financial advisory services to public and private clients spanning multiple industries. With a globally connected network of member firms in more than 150 countries, Deloitte brings world-class capabilities and deep local expertise to help clients succeed wherever they operate. Deloitte’s approximately 200,000 professionals are committed to becoming the standard of excellence.
© 2014 Deloitte Central Europe