estuaries: classification and mixing processes · 2013-04-05 · estuaries: classification and...
TRANSCRIPT

Estuaries:Estuaries:
Classification and Classification and
Mixing ProcessesMixing Processes
OCN 623 – Chemical Oceanography4 April 2013
© 2013 Frank Sansone

OutlineOutline
• River-water vs. sea-water concentrations
• Definitions of types of estuaries
• Mixing curves
• The mid-estuary turbidity maximum
• Submarine groundwater discharge


rw << sw
rw ≈ swNutrients
are
different!
RiverRiver--water and Seawater and Sea--water water
ConcentrationsConcentrations

RiverRiver--water / Seawater / Sea--water Ion Ratioswater Ion Ratios
Two major factors:
• Na+/K+ difference reflects lower affinity of marine rocks for
sodium, as compared to potassium (ocean is a is less effective sink for sodium)
• Ca2+/Mg2+ difference reflects preferential removal of calcium
in the ocean as biogenic calcite (ocean is a is more effective sink for calcium)

Definitions of Definitions of ““EstuaryEstuary””
Two major components involved:
• Transition from fresh (river) water to saline
(ocean) water
• Tidal influence
One definition:
“An estuary is a semi-enclosed coastal water
body that extends to the effective limit of tidal
influence, within which sea water is significantly
diluted with freshwater from land drainage”

• Estuarine ecosystems includes:
- The river channel, to the maximum upstream extent of tidal
influence
- The adjacent coastal waters, to the maximum extent of
freshwater flow
- Salt marshes and tidal flats that develop along the shore
line, built up from riverine sediments deposited as river flow
rate slows once sea level is reached; subject to daily tidal
inundation
• Estuaries are zones of mixing, displaying strong
salinity gradients from land to sea

Water Movement in EstuariesWater Movement in Estuaries
• River flow is essentially unidirectional
• As river water meets the sea, tidal oscillation
introduces a bi-directional (“in-out”) component to
flow
– This bi-directionality may be throughout the water
column (well-mixed estuary)
– Or there may be predominantly surface outflow
and deep inflow (salt-wedge estuary)

RiverRiver--dominated Estuarydominated Estuary

What factors determine the type of estuary??

Net
outflow
of water
Net
inflow
of water
E
E
Actually,
evaporation - precipitation

Mixing CurvesMixing Curves
The Basic Tool for Studying River-Ocean Interactions
Assumes end-
members are constant
over the flushing time
of the estuary


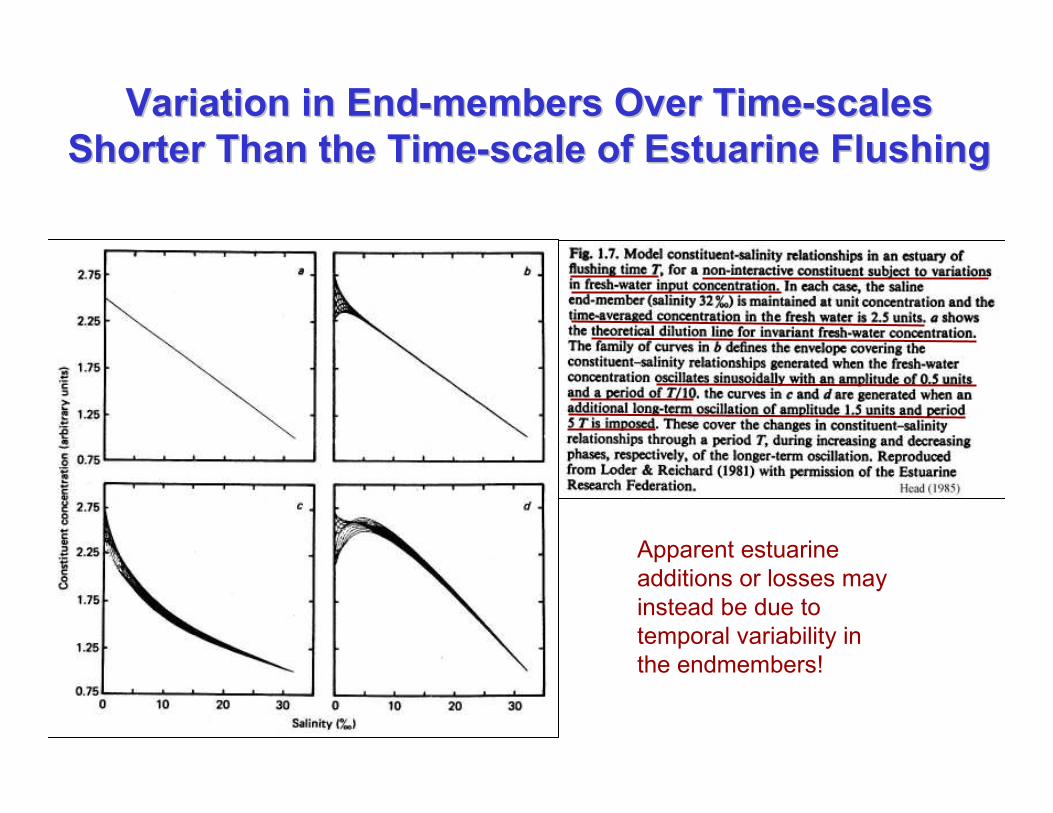
Variation in EndVariation in End--members Over Timemembers Over Time--scales scales
Shorter Than the TimeShorter Than the Time--scale of Estuarine Flushingscale of Estuarine Flushing
Apparent estuarine
additions or losses may
instead be due to
temporal variability in
the endmembers!

Data from several points
up-river
Greater
impact of
mid-estuary
input during
low flow
(summer)
An Example of Seasonal EffectsAn Example of Seasonal Effects


Expected:
Measured:
The The MidMid--estuary Turbidity Maximumestuary Turbidity Maximum
Turbidity max is due to
both 1) chemical
flocculation and 2)
sediment resuspension

A MidA Mid--estuary Trap for estuary Trap for
RiverborneRiverborne MaterialMaterial
Flocculation & resuspension
S
E
A

Note tidal
asymmetries
Particle Distribution Particle Distribution vs.vs. Estuary TypeEstuary Type
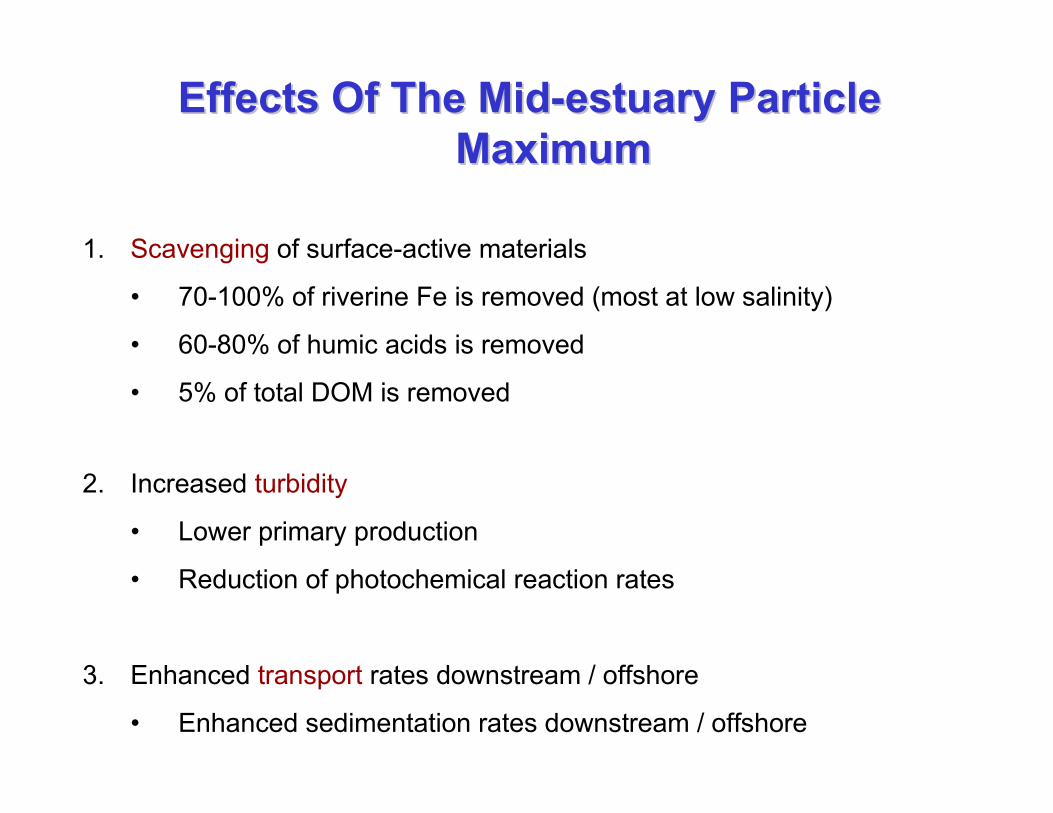
Effects Of The MidEffects Of The Mid--estuary Particle estuary Particle
MaximumMaximum
1. Scavenging of surface-active materials
• 70-100% of riverine Fe is removed (most at low salinity)
• 60-80% of humic acids is removed
• 5% of total DOM is removed
2. Increased turbidity
• Lower primary production
• Reduction of photochemical reaction rates
3. Enhanced transport rates downstream / offshore
• Enhanced sedimentation rates downstream / offshore

An Estuarine SummaryAn Estuarine Summary


Submarine Groundwater DischargeSubmarine Groundwater Discharge
““The Subterranean EstuaryThe Subterranean Estuary””

Jack Cook, WHOI

Next class: Estuarine and Coastal Next class: Estuarine and Coastal
BiogeochemistryBiogeochemistry
• Salinity changes are accompanied by chemical changes(nutrients, pH, O2, redox, etc.)
• Sediment trapping (and subsequent organic matter oxidation) occurs because of slowed flow
• Nutrient and organic loads to estuaries are typically high and are often influenced by pollution sources
• Primary production is typically elevated, but estuaries may be either net autotrophic or heterotrophic