estuaries of the northeastern united states: habitat …orton/results/hudsonmixing/refs/...q 2000...
TRANSCRIPT
743Q 2000 Estuarine Research Federation
Estuaries Vol. 23, No. 6, p. 743–764 December 2000
Estuaries of the Northeastern United States: Habitat and Land
Use Signatures
CHARLES T. ROMAN1,*, NORBERT JAWORSKI2, FREDERICK T. SHORT3, STUART FINDLAY4, and R.SCOTT WARREN5
1 USGS Patuxent Wildlife Research Center, Graduate School of Oceanography, University of RhodeIsland, Narragansett, Rhode Island 02882
2 (retired, U.S. Environmental Protection Agency), 2004 Magnolia Avenue, Sanford, Florida32771
3 Jackson Estuarine Laboratory, University of New Hampshire, 85 Adams Point Road, Durham,New Hampshire 03824
4 Institute of Ecosystem Studies, Box AB, Millbrook, New York 125455 Department of Botany, Connecticut College, New London, Connecticut 06320
ABSTRACT: Geographic signatures are physical, chemical, biotic, and human-induced characteristics or processes thathelp define similar or unique features of estuaries along latitudinal or geographic gradients. Geomorphologically, estu-aries of the northeastern U.S., from the Hudson River estuary and northward along the Gulf of Maine shoreline, arehighly diverse because of a complex bedrock geology and glacial history. Back-barrier estuaries and lagoons occur withinthe northeast region, but the domiant type is the drowned-river valley, often with rocky shores. Tidal range and meandepth of northeast estuaries are generally greater when compared to estuaries of the more southern U.S. Atlantic coastand Gulf of Mexico. Because of small estuarine drainage basins, low riverine flows, a bedrock substrate, and denseforest cover, sediment loads in northeast estuaries are generally quite low and water clarity is high. Tidal marshes, seagrassmeadows, intertidal mudflats, and rocky shores represent major habitat types that fringe northeast estuaries, supportingcommercially-important fauna, forage nekton and benthos, and coastal bird communities, while also serving as linksbetween deeper estuarine waters and habitats through detritus-based pathways. Regarding land use and water qualitytrends, portions of the northeast have a history of over a century of intense urbanization as reflected in increased totalnitrogen and total phosphorus loadings to estuaries, with wastewater treatment facilities and atmospheric depositionbeing major sources. Agricultural inputs are relatively minor throughout the northeast, with relative importance increasingfor coastal plain estuaries. Identifying geographic signatures provides an objective means for comparing the structure,function, and processes of estuaries along latitudinal gradients.
Introduction
Estuaries have been classified as drowned-rivervalleys or coastal plain, bar-built, lagoons, fjords,and tectonically-caused (Pritchard 1967a). Withinthis geomorphic classification, estuaries are de-fined by a diverse suite of characteristics, includingcirculation patterns (Pritchard 1967b) and relatedphysical factors (e.g., tidal range, freshwater input,sediment load, etc.), dominant habitat types, andwatershed factors, including physiography andland use. These characteristics often vary geo-graphically and can be evaluated to define funda-mental signatures of estuaries on a regional basis.Geographic signatures, as defined in this paper,are considered as physical, chemical, biotic, andhuman-induced characteristics or processes that re-sult in particular, or sometimes unique, ecosystem
* Corresponding author: tele: 401/874-6886; fax: 401/874-6887; e-mail: [email protected].
responses within a region. For example, Chapman(1960) observed that salt marshes in New Englandare often small in area with organic peat substratesresulting from small drainage basins with relativelylow suspended sediment loads. In contrast, south-eastern U.S. drainage basins are large with highsuspended sediment loads resulting in extensivesalt marshes with substrates of high inorganic con-tent. Physiography of the drainage basin and sus-pended sediment load can be considered as keycharacteristics, or signatures, that define the vari-ability of salt marshes across regions. Similarly,these factors regulate seagrass distribution andgrowth along the U.S. Atlantic coast. As the highsuspended sediment load of southeast coastal plainestuaries reduces water clarity, seagrass is limitedin extent and where present, it is limited to lessthan 2 m depth (Thayer et al. 1984). Seagrassmeadows in New England and Canada can exceed10 m depth (Harrison and Mann 1975; Dennisonand Alberte 1985; Short and Neckles 1999).

744 C. T. Roman et al.
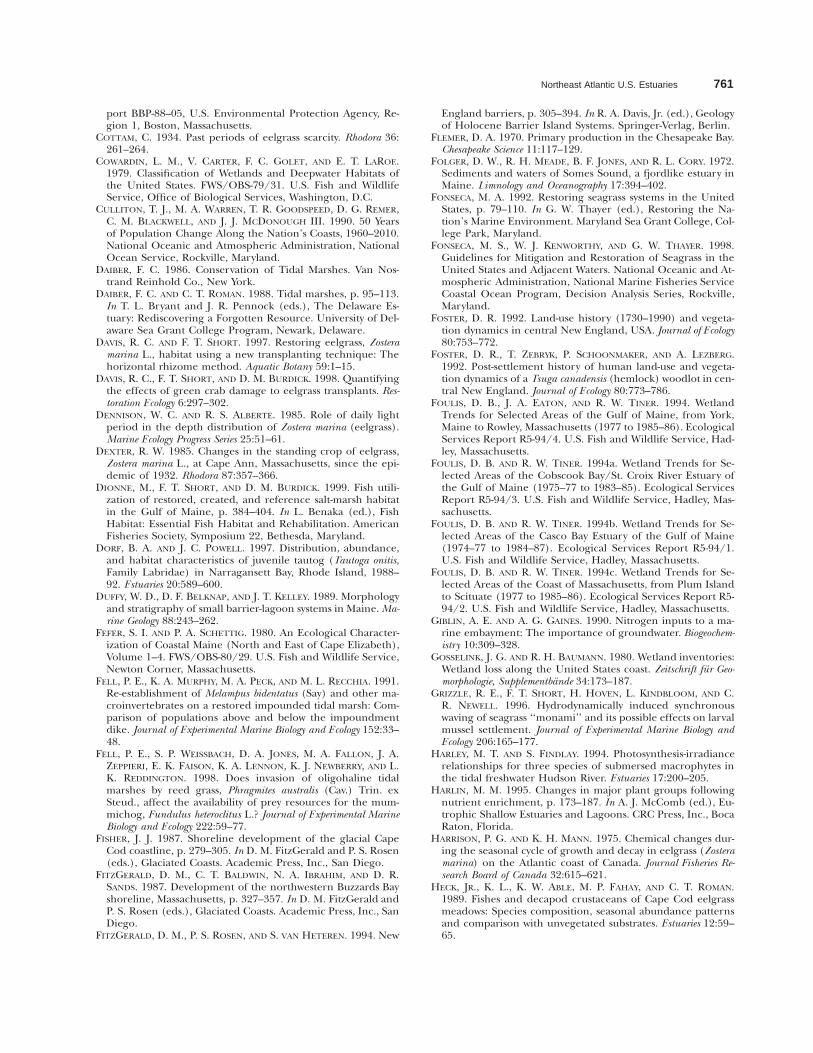
Fig. 1. Geographic extent of northeast estuaries. Many of the estuaries and sub-estuaries discussed in this paper are listed.
This paper will focus on the northeastern Unit-ed States coastal zone, from the Hudson River andLong Island Sound to the Gulf of Maine (Fig. 1).The region is characterized by a diversity of estu-arine types including, glacially-carved (e.g., Penob-scot Bay, Maine) and fjord-like systems (SomesSound, Maine), drowned-river valleys (e.g., Con-necticut River, Hudson River) and lagoons (e.g.,Rhode Island salt ponds). There is a wide range ofdevelopment pressure and land use history withsome watersheds exposed to over two centuries ofintense urbanization (e.g., Lower Hudson River),while others have endured less development (e.g.,Maine estuaries). This paper identifies the variedgeomorphologies, land use histories, and other sig-
natures that define past and current trends in thestructure and function of estuarine habitats withinthe northeastern U.S.
Estuarine GeomorphologyGEOLOGICAL HISTORY
The shoreline of New England, from the Hud-son River and northward is extremely diverse whencompared to the barrier island-lagoon dominatedcoast that prevails from the south shore of LongIsland, extending along the east coast of the Atlan-tic and into the Gulf of Mexico. The basic or grossconfiguration of the New England shoreline is re-lated to the composition of bedrock and its differ-ential weathering (FitzGerald et al. 1994). As an
Northeast Atlantic U.S. Estuaries 745
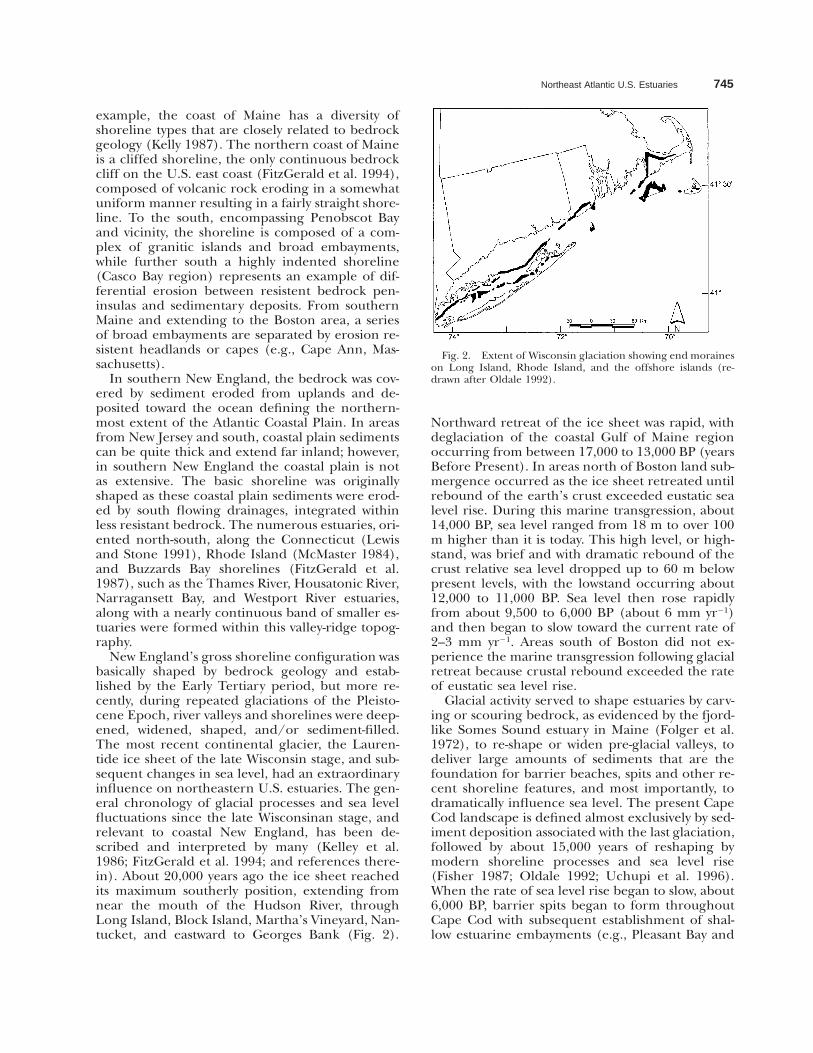
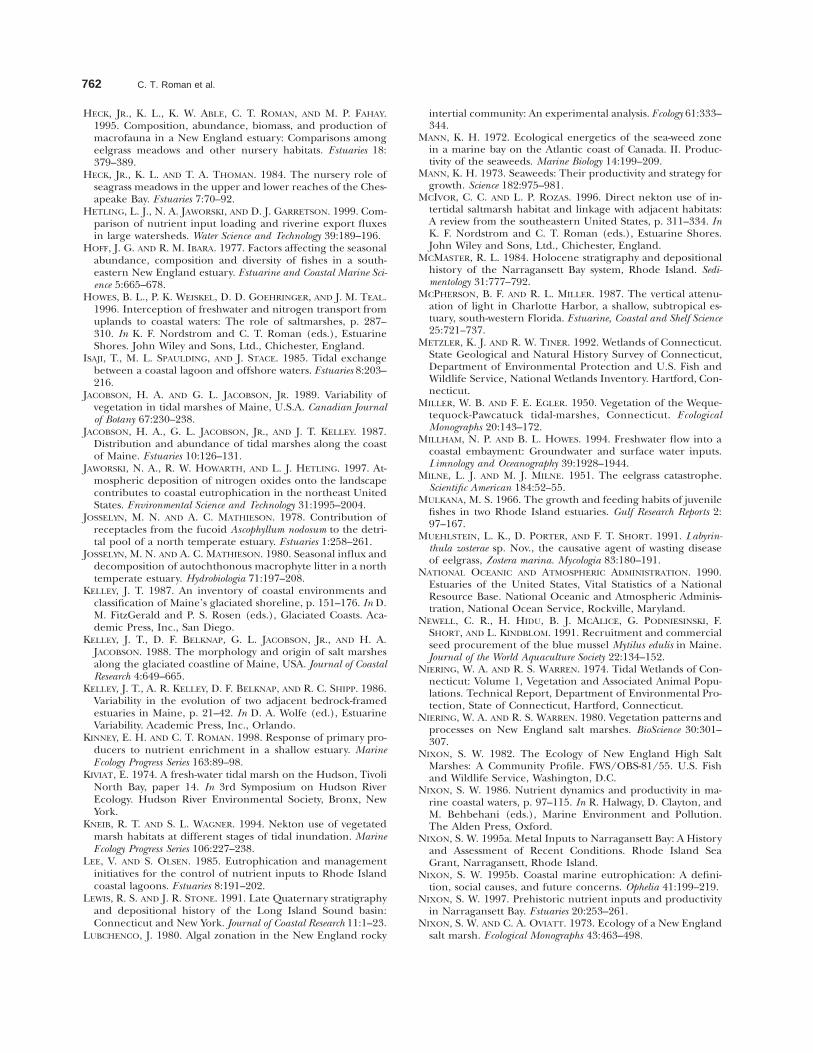
Fig. 2. Extent of Wisconsin glaciation showing end moraineson Long Island, Rhode Island, and the offshore islands (re-drawn after Oldale 1992).
example, the coast of Maine has a diversity ofshoreline types that are closely related to bedrockgeology (Kelly 1987). The northern coast of Maineis a cliffed shoreline, the only continuous bedrockcliff on the U.S. east coast (FitzGerald et al. 1994),composed of volcanic rock eroding in a somewhatuniform manner resulting in a fairly straight shore-line. To the south, encompassing Penobscot Bayand vicinity, the shoreline is composed of a com-plex of granitic islands and broad embayments,while further south a highly indented shoreline(Casco Bay region) represents an example of dif-ferential erosion between resistent bedrock pen-insulas and sedimentary deposits. From southernMaine and extending to the Boston area, a seriesof broad embayments are separated by erosion re-sistent headlands or capes (e.g., Cape Ann, Mas-sachusetts).
In southern New England, the bedrock was cov-ered by sediment eroded from uplands and de-posited toward the ocean defining the northern-most extent of the Atlantic Coastal Plain. In areasfrom New Jersey and south, coastal plain sedimentscan be quite thick and extend far inland; however,in southern New England the coastal plain is notas extensive. The basic shoreline was originallyshaped as these coastal plain sediments were erod-ed by south flowing drainages, integrated withinless resistant bedrock. The numerous estuaries, ori-ented north-south, along the Connecticut (Lewisand Stone 1991), Rhode Island (McMaster 1984),and Buzzards Bay shorelines (FitzGerald et al.1987), such as the Thames River, Housatonic River,Narragansett Bay, and Westport River estuaries,along with a nearly continuous band of smaller es-tuaries were formed within this valley-ridge topog-raphy.
New England’s gross shoreline configuration wasbasically shaped by bedrock geology and estab-lished by the Early Tertiary period, but more re-cently, during repeated glaciations of the Pleisto-cene Epoch, river valleys and shorelines were deep-ened, widened, shaped, and/or sediment-filled.The most recent continental glacier, the Lauren-tide ice sheet of the late Wisconsin stage, and sub-sequent changes in sea level, had an extraordinaryinfluence on northeastern U.S. estuaries. The gen-eral chronology of glacial processes and sea levelfluctuations since the late Wisconsinan stage, andrelevant to coastal New England, has been de-scribed and interpreted by many (Kelley et al.1986; FitzGerald et al. 1994; and references there-in). About 20,000 years ago the ice sheet reachedits maximum southerly position, extending fromnear the mouth of the Hudson River, throughLong Island, Block Island, Martha’s Vineyard, Nan-tucket, and eastward to Georges Bank (Fig. 2).
Northward retreat of the ice sheet was rapid, withdeglaciation of the coastal Gulf of Maine regionoccurring from between 17,000 to 13,000 BP (yearsBefore Present). In areas north of Boston land sub-mergence occurred as the ice sheet retreated untilrebound of the earth’s crust exceeded eustatic sealevel rise. During this marine transgression, about14,000 BP, sea level ranged from 18 m to over 100m higher than it is today. This high level, or high-stand, was brief and with dramatic rebound of thecrust relative sea level dropped up to 60 m belowpresent levels, with the lowstand occurring about12,000 to 11,000 BP. Sea level then rose rapidlyfrom about 9,500 to 6,000 BP (about 6 mm yr21)and then began to slow toward the current rate of2–3 mm yr21. Areas south of Boston did not ex-perience the marine transgression following glacialretreat because crustal rebound exceeded the rateof eustatic sea level rise.
Glacial activity served to shape estuaries by carv-ing or scouring bedrock, as evidenced by the fjord-like Somes Sound estuary in Maine (Folger et al.1972), to re-shape or widen pre-glacial valleys, todeliver large amounts of sediments that are thefoundation for barrier beaches, spits and other re-cent shoreline features, and most importantly, todramatically influence sea level. The present CapeCod landscape is defined almost exclusively by sed-iment deposition associated with the last glaciation,followed by about 15,000 years of reshaping bymodern shoreline processes and sea level rise(Fisher 1987; Oldale 1992; Uchupi et al. 1996).When the rate of sea level rise began to slow, about6,000 BP, barrier spits began to form throughoutCape Cod with subsequent establishment of shal-low estuarine embayments (e.g., Pleasant Bay and

746 C. T. Roman et al.
Nauset Marsh, Sandy Neck/Barnstable Marsh).The sequence of barrier spit growth and subse-quent salt marsh development within the protect-ed embayment is best typified by Redfield’s (1965)classic study of Sandy Neck/Barnstable Marsh(Cape Cod, Massachusetts), where growth of thespit and salt marsh began about 4,000 years ago.
Similar to the Cape Cod example, barrier sys-tems and salt marshes that are present today beganto form throughout the New England region about4,000 years ago, under a regime of slowed sea levelrise. In southern Maine (Wells, Maine), a basal ra-diocarbon date of 4,220 BP is reported for backbarrier salt marsh peat (Kelley et al. 1988). OnLong Island Sound, Orson et al. (1987) describe ascenario of marsh development beginning about3,800–4,000 years ago that was independent of bar-rier formation; freshwater marsh was replaced bysalt marsh as the Pataguanset River valley wasdrowned with sea level rise. On the northern coastof Maine, a salt marsh located along the estuarineshore of a major river system dates to 4,095 BP,with salt marsh peat overlying freshwater peat (Kel-ley et al. 1988), similar to the Pataguanset example.
GEOMORPHOLOGICAL CHARACTERISTICS
Because of this complex of bedrock geology, gla-cial history, and sea level rise, coupled with factorslike sediment supply and wave exposure, the shore-lines of New England estuaries and associated hab-itats are extremely variable. Extensive barrier is-land shorelines (often extending for 50 km ormore) fronting large shallow lagoonal estuaries(e.g., Barnegat Bay, New Jersey; Pamlico Sound,North Carolina) or large salt marsh complexes(e.g., associated with the Georgia and South Car-olina coastal barriers) are limited in New England.The Merrimack River barrier system (e.g., PlumIsland, Massachusetts; FitzGerald et al. 1994), theouter Cape Cod barrier complex (e.g., Nauset Spit,Monomoy Island, Massachusetts; Uchupi et al.1996), and the southern shore of Rhode Island(Boothroyd et al. 1985) contain sandy barriers ofabout 30 km in length that front shallow estuariesdominated by Spartina marsh or tidal lagoons.However, most of the barrier shorelines of NewEngland are short, generally less than 1 km, andunlike the sand substrate of barriers to the south,they can be composed of sediment ranging fromfine sand to gravel and cobble, reflecting local bed-rock and glacial geology (FitzGerald et al. 1994).Shallow estuaries are often associated with thesesmall barriers.
While barrier shorelines are found throughoutthe region from northern Maine to the HudsonRiver estuary, back barrier estuaries, lagoons andcoastal ponds represent a relatively small percent-
age of the types of estuaries found in the northeast.For instance, it is estimated that just 25% of theMassachusetts and Connecticut shoreline is com-posed of barrier systems, despite being the portionof the region with most abundant sediment sup-plies for barrier formation (FitzGerald et al. 1994).Most of the major estuarine systems in the regionare of the drowned-river valley (e.g., Hudson River,Connecticut River, Narragansett Bay, KennebecRiver) or drowned-basin type (e.g., Long IslandSound). The bedrock shorelines of the estuariesthroughout the region were carved by glacial ac-tivity, but just one estuary in the northeast has thetypical geomorphology of a fjord-type estuary.Somes Sound is a long (8 km), narrow (, 1 km),U-shaped valley flanked by mountains that riseover 250 m above sea level, with a maximum depthof 50 m and a shallow 10 m sill at the mouth (Pet-tigrew et al. 1997).
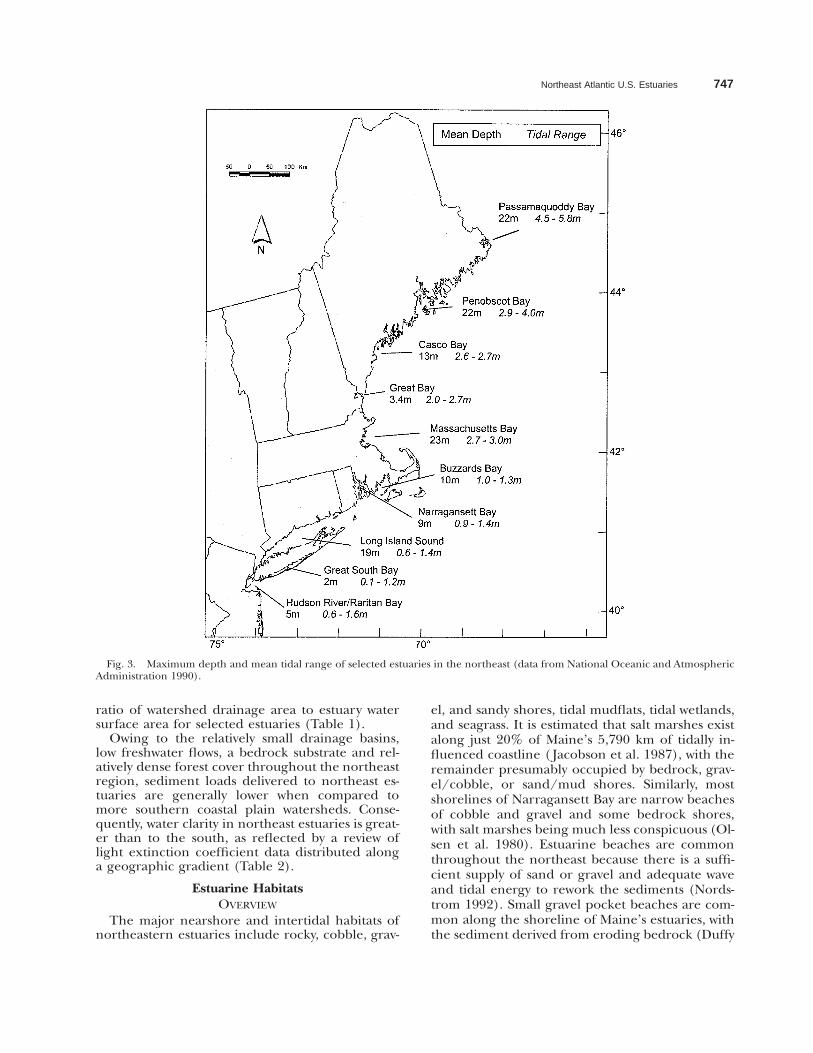
Reflecting the glacial history of the region,northeast estuaries are generally deep, except forthe back-barrier systems (Fig. 3). Based on the Na-tional Oceanic and Atmospheric AdministrationNational Estuarine Inventory database, the averagedepth of northeast estuaries (Passamaquoddy Bay,Maine to Hudson River/Raritan Bay, New York/New Jersey) is 13 m, compared to the much shal-lower coastal plain and back-barrier estuaries tothe south (Middle Atlantic, 3 m; South Atlantic, 4m; Gulf of Mexico, 2 m; National Oceanic and At-mospheric Administration 1990).
PHYSICAL CHARACTERISTICS
Because of high tidal range and relatively lowfreshwater discharge from riverine sources, tidalmixing is the dominant factor determining circu-lation patterns in northeast estuaries. Mean rangeof the semidiurnal tide in Passamaquoddy Bay canapproach 6 m and is generally up to 3 m elsewherethroughout Gulf of Maine estuaries (Fig. 3). Tidalrange of more southern New England estuaries isless (about 1–2 m), but still greater than in estu-aries along the coastal plain to the south. Thereare obvious exceptions, such as the minimal tidalrange of Rhode Island’s coastal pond estuaries (,0.5 m; Isaji et al. 1985), or portions of the Georgiacoast exhibiting tidal ranges of 2 m or more. De-spite these exceptions, tides of the northeast coast,and especially within the Gulf of Maine, are am-plified with the highest recorded tides in the worldoccurring in the Bay of Fundy (15 m).
With regard to freshwater flow, Fig. 4 clearly il-lustrates that estuaries in the northeast have sig-nificantly lower average daily riverine flow than es-tuaries of the middle and south Atlantic coastalplain and Gulf of Mexico. In the northeast, water-sheds are generally smaller as exemplified by the
Northeast Atlantic U.S. Estuaries 747
Fig. 3. Maximum depth and mean tidal range of selected estuaries in the northeast (data from National Oceanic and AtmosphericAdministration 1990).
ratio of watershed drainage area to estuary watersurface area for selected estuaries (Table 1).
Owing to the relatively small drainage basins,low freshwater flows, a bedrock substrate and rel-atively dense forest cover throughout the northeastregion, sediment loads delivered to northeast es-tuaries are generally lower when compared tomore southern coastal plain watersheds. Conse-quently, water clarity in northeast estuaries is great-er than to the south, as reflected by a review oflight extinction coefficient data distributed alonga geographic gradient (Table 2).
Estuarine HabitatsOVERVIEW
The major nearshore and intertidal habitats ofnortheastern estuaries include rocky, cobble, grav-
el, and sandy shores, tidal mudflats, tidal wetlands,and seagrass. It is estimated that salt marshes existalong just 20% of Maine’s 5,790 km of tidally in-fluenced coastline ( Jacobson et al. 1987), with theremainder presumably occupied by bedrock, grav-el/cobble, or sand/mud shores. Similarly, mostshorelines of Narragansett Bay are narrow beachesof cobble and gravel and some bedrock shores,with salt marshes being much less conspicuous (Ol-sen et al. 1980). Estuarine beaches are commonthroughout the northeast because there is a suffi-cient supply of sand or gravel and adequate waveand tidal energy to rework the sediments (Nords-trom 1992). Small gravel pocket beaches are com-mon along the shoreline of Maine’s estuaries, withthe sediment derived from eroding bedrock (Duffy

748 C. T. Roman et al.
Fig. 4. Average daily freshwater flow to northeast, middleand south Atlantic, and Gulf of Mexico estuaries (data fromNational Oceanic and Atmospheric Administration 1990).
TABLE 1. Ratio of watershed drainage area to estuary watersurface area for selected estuaries along the Atlantic and Gulfof Mexico coasts (data from National Oceanic and AtmosphericAdministration 1990).
Estuary Ratio
NortheastPassamaquoddy BayPenobscot BayCasco BayMassachusetts BayBuzzards BayNarragansett BayLong Island SoundHudson/Raritan, New York/New Jersey
2026733
111355
Middle AtlanticBarnegat BayDelaware BayChesapeake Bay
141818
Southeast AtlanticCape Fear RiverWinyah BayAltamaha RiverSt. Andrews, St. Simons Sounds
23960394756
Gulf of MexicoApalachicola BayMobile BayAtchafalayaGalveston Bay
9610914345
TABLE 2. Light extinction coefficients for estuaries along the Atlantic and Gulf of Mexico coasts of the U.S. As water clarity increases,extinction coefficient decreases.
EstuaryExtinction Coefficient
(m21) Source
NortheastSomes Sound, MaineDamariscotta River, MaineNarragansett Bay, Rhode IslandHudson River, New York
0.38–0.460.45–0.720.58–0.761.68–2.80
Roman and Doering unpublished dataNixon 1986Schenck and Davis 1973Sirois and Fredrick 1978
Middle AtlanticDelaware Bay, DelawareChesapeake BayChesapeake Bay
0.3–7.00.4–.2.0
1–5
Biggs et al. 1983Flemer 1970Champ et al. 1980
Southeast AtlanticCore Sound, North CarolinaFort Pierce Inlet, Florida
1.5–2.02.0–4.4
Thayer 1971Thompson et al. 1979
Gulf of MexicoCharlotte Harbor, FloridaBarataria Bay, LouisianaSabine-Neches estuary, Louisiana/Texas
0.46–5.12.1
0.8–3.4
McPherson and Miller 1987Nixon 1986Bianchi et al. 1997
et al. 1989). In contrast, a coastal plain estuary likeDelaware Bay contains a nearly continuous saltmarsh border (Daiber and Roman 1988), yet es-tuarine beaches often front the marshes. Along theSouth Carolina and Georgia coasts salt marshes areextensive, with these two states containing over60% of all east coast salt marshes from Maine toFlorida (Reimold 1977). The following discussionfocuses on signatures of tidal marsh, seagrass, in-tertidal mudflat, and rocky intertidal habitats ofthe northeast region.
TIDAL MARSHES
Compared to the signature of salt marshes of themiddle and south Atlantic coasts and the Gulf ofMexico, northeast salt marshes are small in spatialextent and often exist as narrow fringing systems.The mean area of discrete marsh polygons inMaine is just 0.26 ha ( Jacobson et al. 1987), while
Northeast Atlantic U.S. Estuaries 749
along the Connecticut shoreline of the Long Is-land Sound estuary the mean area is larger (39 ha;calculated from data provided in Niering and War-ren 1974), but still small when compared to south-ern latitudes. Marshes in the Hudson River estuaryrange from saline to freshwater and are spreadalong the 240 km tidal portion. Like other north-east marshes, they are small with a mean area ofjust 23 ha. The lack of a broad and relatively flatcoastal plain tends to limit the areal extent ofmarshes in the northeast. While small salt marshesdominate, there are some New England systems ofnotable size that are associated with barrier islandor spit systems (e.g., Scarborough Marsh, Maine;Plum Island/Parker River marshes and BarnstableMarsh, Massachusetts).
The physiography and vegetation of northeasttidal marshes has been described by many, but withmost detail provided for southern New Englandsalt marshes (Miller and Egler 1950; Redfield 1972;Niering and Warren 1980; Nixon 1982). Here, adistinct pattern of vegetation is observed, with anarrow band of tall Spartina alterniflora occupyingthe low marsh, areas flooded twice daily by tides,and with high marsh areas flooded less frequentlyand forming a mosaic of vegetation types that mayinclude, Spartina patens, Distichlis spicata, shortform S. alterniflora, and Juncus gerardii. Salt marshpannes, shallow depressions on the marsh surfaceoften vegetated with forbs, and salt marsh poolscan be present throughout the high marsh mosaic.
Descriptions of vegetation patterns on northernNew England salt marshes are few, but differencesare apparent. The low marsh along the Mainecoast, north and east of Penobscot Bay, is domi-nated by S. alterniflora, but the high marsh has agreater diversity of plant species (Calhoun et al.1993). In addition to S. patens and J. gerardii, themosaic pattern of northern Maine salt marshesmay include J. balticus, Festuca rubra, Agrostis gigan-tea, and Carex paleacea, among others. Along theupland border of salt marshes throughout NewEngland and extending into southern Maine,Phragmites australis commonly occurs; it has notbeen noted in more northern salt marshes ofMaine and the Bay of Fundy region ( Jacobson andJacobson 1989; Calhoun et al. 1993; Chmura et al.1997). The northern region of Maine may repre-sent a transition to Bay of Fundy salt marsheswhere vegetation zones of S. alterniflora, Plantagomaritima, S. patens, C. paleacea, and J. balticus arenoted (Pielou and Routledge 1976; Chmura et al.1997).
Extensive areas of freshwater and brackish watertidal marshes are a common signature of the upperreaches of river-dominated estuaries throughoutthe middle and south Atlantic regions, but in the
northeast they are rare, except for the major rivervalley systems of the northeast (Odum et al. 1984).For example, brackish water tidal marshes domi-nated by Typha angustifolia (narrow-leaved cattail)and freshwater tidal marshes with Zizania aquatica(wild rice), Pontederia cordata (pickerelweed), andScirpus pungens (common three-square) are com-mon along tidal reaches of the Connecticut River(Metzler and Tiner 1992) and Hudson River (Kiv-iat 1974). The rocky and steep-sided geomorphol-ogy of most tidal riverine systems throughout thenortheast precludes the formation of extensivefresh and brackish tidal marshes (Odum et al.1984). Most major rivers throughout the northeasthave been dammed and the effect of this alteredhydrology and sediment transport on tidal fresh-water wetland development remains unstudied. Inaddition to dams, most of the tidal marshes alongthe Hudson River occur behind a railroad em-bankment that runs parallel to the river.
The geographically widespread effects of physi-cal, human-caused, alterations on salt marshes is afundamental habitat signature in the northeast.These impacts include filling, draining, mosquitoditching, and alteration of tidal exchange by roads,dikes, impoundments, culverts, tide gates, and oth-er structures. Prior to passage of coastal wetlandprotection legislation by northeast states, begin-ning in the 1960s, salt marsh losses due to fillingwere extraordinary. For example, in Connecticut30–50% of tidal marshes have been lost (Metzlerand Tiner 1992; Rozsa 1995). Thirty-five percentof the United State’s coastal population (based oncensus of coastal counties only) resides in thenortheast (Maine to Virginia; Culliton et al. 1990)and it is not surprising that a direct relationshipbetween coastal wetland loss and population den-sity has been noted (Gosselink and Baumann1980).
Mosquito ditches represent one of the mostcommon features on the northeastern salt marshwith an estimated 90% of the marshes from Maineto Virginia being ditched (Bourne and Cottam1950). In New England, salt marsh ditching beganduring Colonial times, the 17th century, primarilyto drain the marsh and enhance opportunities forsalt hay farming, but became most prevalent in the1930s when ditches were dug in an effort to sys-tematically drain mosquito breeding areas. In thesmall marshes that dominate the New Englandcoast, ditches were often dug by hand, spanningentire marshes in dense parallel grid patterns, withabout 40–50 m spacing. Unditched salt marshesare rarely encountered in the northeast (Fig. 5).Ditching, channelization, and impounding werecommon practices on marshes of the southeast andGulf coast, but these practices were not nearly as
750 C. T. Roman et al.
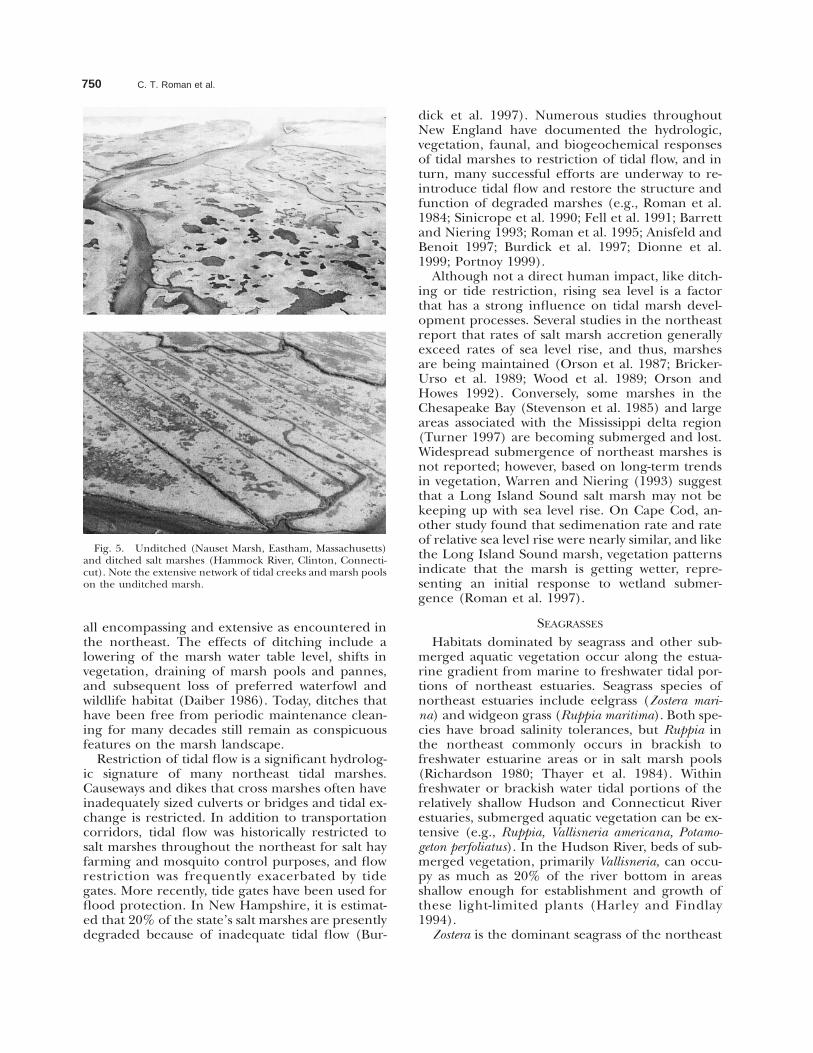
Fig. 5. Unditched (Nauset Marsh, Eastham, Massachusetts)and ditched salt marshes (Hammock River, Clinton, Connecti-cut). Note the extensive network of tidal creeks and marsh poolson the unditched marsh.
all encompassing and extensive as encountered inthe northeast. The effects of ditching include alowering of the marsh water table level, shifts invegetation, draining of marsh pools and pannes,and subsequent loss of preferred waterfowl andwildlife habitat (Daiber 1986). Today, ditches thathave been free from periodic maintenance clean-ing for many decades still remain as conspicuousfeatures on the marsh landscape.
Restriction of tidal flow is a significant hydrolog-ic signature of many northeast tidal marshes.Causeways and dikes that cross marshes often haveinadequately sized culverts or bridges and tidal ex-change is restricted. In addition to transportationcorridors, tidal flow was historically restricted tosalt marshes throughout the northeast for salt hayfarming and mosquito control purposes, and flowrestriction was frequently exacerbated by tidegates. More recently, tide gates have been used forflood protection. In New Hampshire, it is estimat-ed that 20% of the state’s salt marshes are presentlydegraded because of inadequate tidal flow (Bur-
dick et al. 1997). Numerous studies throughoutNew England have documented the hydrologic,vegetation, faunal, and biogeochemical responsesof tidal marshes to restriction of tidal flow, and inturn, many successful efforts are underway to re-introduce tidal flow and restore the structure andfunction of degraded marshes (e.g., Roman et al.1984; Sinicrope et al. 1990; Fell et al. 1991; Barrettand Niering 1993; Roman et al. 1995; Anisfeld andBenoit 1997; Burdick et al. 1997; Dionne et al.1999; Portnoy 1999).
Although not a direct human impact, like ditch-ing or tide restriction, rising sea level is a factorthat has a strong influence on tidal marsh devel-opment processes. Several studies in the northeastreport that rates of salt marsh accretion generallyexceed rates of sea level rise, and thus, marshesare being maintained (Orson et al. 1987; Bricker-Urso et al. 1989; Wood et al. 1989; Orson andHowes 1992). Conversely, some marshes in theChesapeake Bay (Stevenson et al. 1985) and largeareas associated with the Mississippi delta region(Turner 1997) are becoming submerged and lost.Widespread submergence of northeast marshes isnot reported; however, based on long-term trendsin vegetation, Warren and Niering (1993) suggestthat a Long Island Sound salt marsh may not bekeeping up with sea level rise. On Cape Cod, an-other study found that sedimenation rate and rateof relative sea level rise were nearly similar, and likethe Long Island Sound marsh, vegetation patternsindicate that the marsh is getting wetter, repre-senting an initial response to wetland submer-gence (Roman et al. 1997).
SEAGRASSES
Habitats dominated by seagrass and other sub-merged aquatic vegetation occur along the estua-rine gradient from marine to freshwater tidal por-tions of northeast estuaries. Seagrass species ofnortheast estuaries include eelgrass (Zostera mari-na) and widgeon grass (Ruppia maritima). Both spe-cies have broad salinity tolerances, but Ruppia inthe northeast commonly occurs in brackish tofreshwater estuarine areas or in salt marsh pools(Richardson 1980; Thayer et al. 1984). Withinfreshwater or brackish water tidal portions of therelatively shallow Hudson and Connecticut Riverestuaries, submerged aquatic vegetation can be ex-tensive (e.g., Ruppia, Vallisneria americana, Potamo-geton perfoliatus). In the Hudson River, beds of sub-merged vegetation, primarily Vallisneria, can occu-py as much as 20% of the river bottom in areasshallow enough for establishment and growth ofthese light-limited plants (Harley and Findlay1994).
Zostera is the dominant seagrass of the northeast

Northeast Atlantic U.S. Estuaries 751
TABLE 3. Percentage of the total area of estuarine habitat types classified as intertidal flat for several states in the northeast andmid-Atlantic coastal plain. Percentages for some specific estuaries or portions of shoreline are also presented. Classifications areaccording to the National Wetlands Inventory (Cowardin et al. 1979).
Coastal State
% of TotalEstuarine Area
Classified asIntertidal Flat Source
NortheastMaine 32 Fefer and Schettig 1980
Cobscook Bay/St. Croix estuaryMount Desert Island and vicinityCasco Bay estuary
507552
Foulis and Tiner 1994aCalhoun et al. 1993Foulis and Tiner 1994b
Maine, New Hampshire, MassachusettsGulf of Maine (York, Maine to Rowley, Massachusetts) 25 Foulis et al. 1994Gulf of Maine (Plum Island, Massachusetts to Scituate, Massachusetts) 35 Foulis and Tiner 1994c
Rhode IslandConnecticut
4133
Tiner 1989Metzler and Tiner 1992
Mid-Atlantic Coastal PlainNew JerseyDelaware
1710
Tiner 1985aTiner 1985b
often forming extensive underwater meadows. Interms of supporting detritus-based estuarine foodwebs, it is estimated that six new leaf crops are pro-duced annually in a Cape Cod eelgrass meadow(Roman and Able 1988). This high turnover con-tributes to estuarine detritus, including extensiveareas of eelgrass wrack that dominate many estua-rine shorelines throughout the northeast (e.g., Jos-selyn and Mathieson 1980; Thorne-Miller et al.1983).
Historically, eelgrass grew in most of the baysand estuaries of the northeast (e.g., Cottam 1934;Renn 1934; Addy and Aylward 1944; Costa 1988).The historic distribution of eelgrass in estuarieshas been poorly documented, although it is likelythat eelgrass disappeared in the 19th century frommany systems of the northeast as a result of landclearing, deforestation, and industrial develop-ment. For example, in Great Bay, New Hampshireextensive logging and operation of saw mills onmost rivers entering the estuary created a deposi-tional layer of sawdust that likely eliminated eel-grass from many parts of the estuary (Short 1992).Such losses of eelgrass were generally localized andrelated specifically to human activity. However, inthe 1930s an epidemic disease threatened to elim-inate eelgrass from the northeast and elsewherethroughout the North Atlantic and Europe (Ras-mussen 1977). This eelgrass decline, known as thewasting disease (Milne and Milne 1951), was a nat-urally occurring disease event likely caused by themarine slime mold Labryrinthula zosterae (Muehl-stein et al. 1991). It devastated eelgrass popula-tions, eliminating 90% of North Atlantic eelgrass.Following the extensive wasting disease epidemicof the 1930s, eelgrass populations slowly reestab-
lished in much of their historic habitat throughoutthe northeast (Conover 1961; Dexter 1985; Costa1988), although some areas (such as parts of Nar-ragansett Bay) do not appear to have recovered(Short et al. 1993).
A recurrence of the wasting disease occurred inthe 1980s (Short et al. 1986), with symptoms sim-ilar to those in the 1930s. Localized die-offs oc-curred along the east coast of the United States inupper Casco Bay, Maine; Great Bay, New Hamp-shire; Stage Harbor, Massachusetts; and the NianticRiver, Connecticut. Although eliminated from thedeveloped parts of estuaries and often fragmentedby human activity, eelgrass remains an importantand widespread estuarine habitat in the northeast.
With an increasing awareness of the values ofeelgrass habitat, every northeast coastal state hasinitiated restoration, with mixed success. Site selec-tion, insuring sufficient water quality, and appro-priate geomorphological conditions are critical torestoration efforts (Fonseca et al. 1998). At a 2.5ha restoration site in the Great Bay estuary, eel-grass has survived for 6 years with plant and animalpopulations comparable to natural eelgrass beds(Short et al. 2000). Development and refinementof planting methods (Orth et al. 1994; Davis andShort 1997), coupled with an emerging knowledgeof site selection criteria (Fonseca 1992; Davis et al.1998), will result in the long-term success of eel-grass habitat restoration efforts throughout thenortheast.
INTERTIDAL MUDFLATS
Intertidal flats are a common and extensive hab-itat type in the northeast (Table 3). In some partsof the Gulf of Maine, intertidal flats represent over
752 C. T. Roman et al.
50% of the total area of estuarine habitat types. Atmore southern latitudes, such as along the NewJersey and Delaware estuarine shorelines, intertidalflats are less conspicuous, mainly because of re-duced tidal range. Mudflats, the dominant type ofunconsolidated intertidal bottom in the Gulf ofMaine, occur within protected areas often in as-sociation with salt marshes, eelgrass meadows andbarrier systems. Over the long-term mudflats aredepositional environments responding to risingsea level, but on seasonal or daily time scales theyare both depositional and erosional features, re-sponding to tidal currents, waves, ice scour, andbioturbation (Anderson et al. 1981; Pethick 1996).
Mudflats support microalgal production, domi-nated by benthic diatoms (Whitlatch 1982) andsome are dominated by macroalgal mats. Welsh(1980) reports dense mats of the green macroalga,Ulva lactuca, in association with a Long IslandSound estuary under a regime of high nutrientloading. In a relatively undeveloped northernMaine estuary, dense mats of the green filamen-tous macroalga, Enteromorpha intestinalis, have beenobserved on mudflats, but the cause is unknown(Vadas and Beal 1987). These microalgal and ma-croalgal primary producers, coupled with the in-put of organic matter from adjacent habitats, playan important role in structuring and supporting arich benthic fauna. Fefer and Schettig (1980),Whitlatch (1982), and Reise (1985), among others,provide excellent reviews on the role of tidal mud-flats in coastal detritus-based food webs. Tidal flatsare closely linked to adjacent habitats such as saltmarshes, eelgrass meadows, and open water.
Predators are especially important in shapingbenthic community structure and abundance inthe mudflats. Bertness (1999), based on a litera-ture review, has suggested that large mobile pred-ators, such as blue crab (Callinectes sapadis) andspot (Leiostomus xanthurus), predominate to thesouth of Cape Cod. To the north, mobile predatorsare less abundant (especially blue crab which is ab-sent) and infaunal predators, like polychaeteworms, dominate. Comparing the role of predatorsin controlling benthic community structure andfunction of the biogeographically distinct regionsnorth and south of Cape Cod deserves furtherstudy (Bertness 1999).
ROCKY SHORELINES
Coupled directly to glacial history and geomor-phology, rocky shoreline habitats are perhaps themost unique habitat signature of northeast estu-aries. This habitat is virtually absent along mid-At-lantic, southeast, and Gulf of Mexico coasts of theU.S. Ascophyllum nodosum (knotted wrack) domi-nates the intertial rocky habitats of protected es-
tuarine shores throughout the northeast (Topinkaet al. 1981; Bertness 1999). Productivity of rockyshore algae represents a dominant proportion oftotal primary production in shallow systems inNova Scotia, Canada (Mann 1972, 1973). In theGreat Bay Estuary, New Hampshire, Ascophyllumand other fucoid algae are also reported to be valu-able contributors to the estuarine detrital pool( Josselyn and Mathieson 1978; Chock and Mathie-son 1983).
Recent species introductions have had a dra-matic influence on the ecology of northeasternrocky shorelines, as well as other habitats. Bertness(1984), studying the rocky cobble beaches of Nar-ragansett Bay, found densities of the common per-iwinkle (Littorina littorea) in excess of 1,000 m22
and reports grazing of all algae, except crustoseforms. L. littorea, introduced in the mid 1800s, hasbecome the dominant intertidal herbivore alongthe northeast coast. Lubchenco’s (1980) classicstudy clearly documents the role of L. littorea incontrolling the structure of New England rocky in-tertidal communities.
Another introduced species, the green crab(Carcinus maenus), is a predator on both rocky andsoft-substrate habitats of the northeast, and like L.littorea has assumed an important role in shapingestuarine intertidal community structure. The is-sue of introduced species has become a seriousconcern, to the point that the structure and func-tion of native estuarine communities in the north-east are difficult to define (Bertness 1999).
NURSERY ROLE OF NORTHEAST ESTUARINEHABITATS
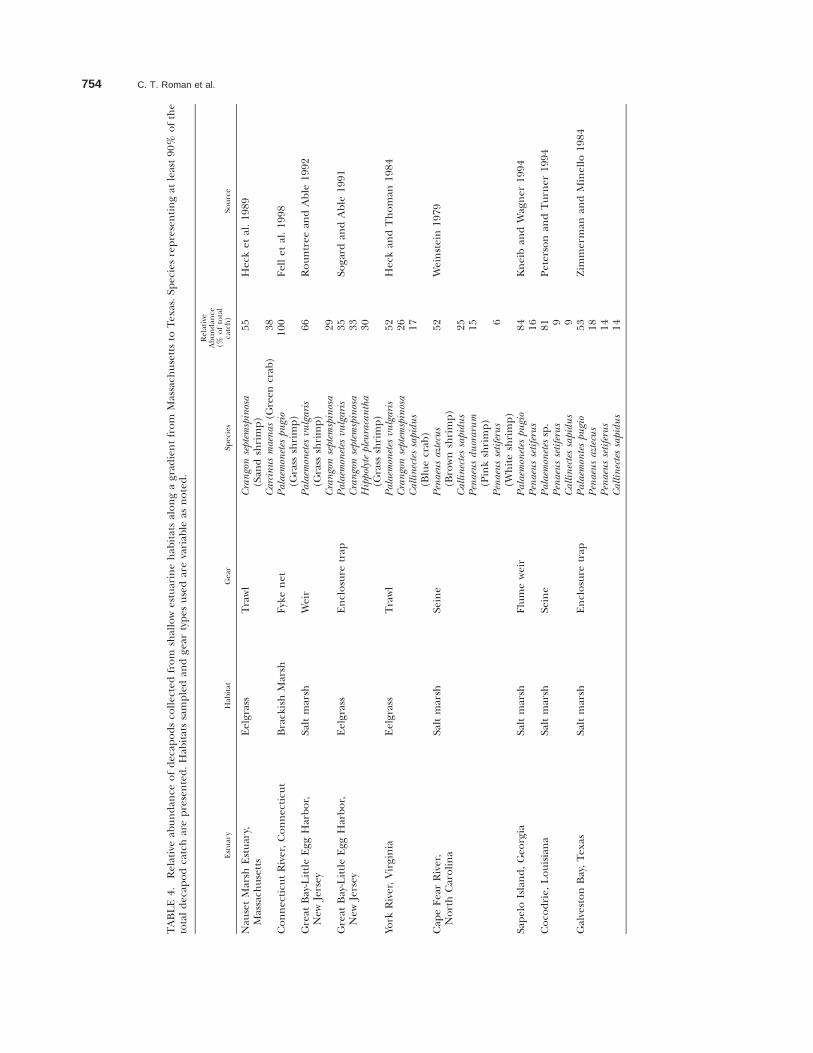
Salt marshes and seagrass meadows have longbeen recognized as providing essential habitat foreconomically-important species and/or serving asan important nursery for marine species, yet moststudies documenting nursery function have beenfrom the mid-Atlantic and south. Young of the yearpenaeid shrimp (Penaeus aztecus, Penaeus setiferus),an economically valuable species, commonly usesalt marshes along the southeast Atlantic and Gulfof Mexico coasts and are numerically abundantcompared to other nekton using the marsh (e.g.,Turner 1977; Boesch and Turner 1984; Zimmer-man and Minello 1984; Kneib and Wagner 1994;McIvor and Rozas 1996). In Chesapeake Bay, it iswell-documented that Zostera beds support highdensities of the commercially and recreationallyimportant blue crab (Heck and Thoman 1984).Published quantitative studies for decapod utiliza-tion of shallow estuarine systems in the northeastare few; but a comparison of studies from Massa-chusetts to Texas does demonstrate that commer-cially-important species, like blue crab and penaeid

Northeast Atlantic U.S. Estuaries 753
shrimp begin to be numerically abundant in themiddle-Atlantic and south (Table 4). Although nota numerically dominant decapod, American lob-ster (Homarus americanus) was collected from CapeCod eelgrass meadows (Heck et al. 1989), and inthe same estuary it was discovered that salt marshcreek banks are used by American lobster as anursery area for inshore populations (Able et al.1988). We acknowledge that sampling methodsand sampled habitats varied for the studies pre-sented in Table 4 and direct comparisons shouldbe made with caution; however, a trend doesemerge suggesting a greater relative abundance ofcommercially or recreationally important deca-pods using southern estuarine habitats when com-pared to northern latitudes.
Regarding fishes using salt marsh and seagrasshabitats as nursery areas, investigations from moresouthern latitudes have found commercially im-portant species, such as spot (Leiostomus xanthu-rus), mullet (Mugil curema), and bay anchovy (An-choa mitchilla), to be ranked as abundant (see ref-erences cited in Fig. 6 and Southeast and Gulf ofMexico review by McIvor and Rozas 1996). Fisheswith life history strategies classified as nursery, ma-rine, diadromous, or transient visitor appear torepresent a much greater percentage of fishes us-ing shallow estuarine habitats from more southernlatitudes. In shallow estuarine habitats of thenortheast, it is clear that resident fishes, such asmummichogs (Fundulus heteroclitus) and stickle-backs (e.g., Gasterosteus aculeatus, Apeltes quadracus),and seasonal residents (e.g., Menidia menidia) dom-inate the fauna (Fig. 6). About 90% of fishes col-lected from northeast estuaries (from Maine toNew Jersey) were classified as resident, except forone site in southern Maine where the marine spe-cies sand launce (Ammodytes americanus) was dom-inant.
New England and northeast salt marsh and eel-grass habitats serve an important habitat functionfor commercially and recreationally important nek-ton species (e.g., menhaden, Brevoortia tyrannus;winter flounder, Pseudopleuronectes americanus; whitehake, Urophycis tenuis; herrings, Alosa aestivalis, Alo-sa pseudoharengus, Clupea harengus; American lob-ster; and tautog, Tautoga onitis, among others; Nix-on and Oviatt 1973; Teal 1986; Heck et al. 1989;Ayvazian et al. 1992; Dorf and Powell 1997), albeitnot as abundant fauna like the blue crab, brownshrimp or spot from more southern systems. Interms of commercial molluscs, eelgrass in thenortheast provides settlement substratum for spatand juvenile shellfish as noted for blue mussels(Mytilus edulis; Newell et al. 1991; Heck et al. 1995;Grizzle et al. 1996) and bay scallops (Argopecten ir-radians) in Great South Bay (Pohle et al. 1991) and
Cape Cod (Heck et al. 1995). Regarding intertidalmudflats in the northeast, commercial harvest ofsoft-shelled clams (Mya arenaria) and baitworms(bloodworm, Glycera dibranchiata; sandworm, Nereisvirens) is prevalent, especially in northern NewEngland (Fefer and Schettig 1980).
Salt marshes, eelgrass beds, and mudflats of thenortheast support commercially-harvested estua-rine fauna, but they also serve an especially im-portant role in providing habitat for forage species,which in turn support commercial and recreation-al fishes and coastal bird populations. This briefreview of nursery role focuses on the intertidal andshallow water habitats that fringe northeast estu-aries. Subtidal and deeper estuarine habitats alsoserve an important nursery function and supportof commercial and recreational fisheries through-out the region, including among others, Americanlobster, hard clam (Mercenaria mercenaria), bay scal-lop, winter flounder, tautog, and anadromous fin-fish species. The shallow and emergent habitats ofnortheast estuaries serve an important link to thedeeper estuarine waters and habitats through theestuarine detritus-based trophic structure.
Land Use and Nutrients
HISTORIC TRENDS
There have been over two centuries of intensedevelopment pressure within the northeast as evi-denced by transformation of the landscape fromdeforested (1750–1860), extensive agriculture(1790–1860), and then reforestation (1860 to thepresent; Fig. 7; Foster et al. 1992). This land clear-ing marked the start of the American IndustrialRevolution with the nation’s first mill establishedin 1790 on the Blackstone River, Rhode Island, atributary to the Narragansett Bay estuary. Withland clearing and industry, contaminants were dis-charged into northeast estuaries, as evidenced inestuarine sediment records. In Narragansett Bay,metals such as lead, chromium, and copper firstappeared in the sediment record by the early1800s, with pronounced increases beginning in the1850s as industrial activities accelerated (Bricker-Urso et al. 1989; Nixon 1995a).
Regarding the history of nutrient loading tonortheast estuaries, estimates were made of the av-erage annual loading of total nitrogen from water-sheds, for the period of 1900 to 1994, and includedthe contribution of various sources, includingwastewater, atmospheric deposition, and agricul-tural runoff. The method for developing these his-torical reconstructions is presented elsewhere ( Ja-worski et al. 1997; Hetling et al. 1999) and onlybriefly described here. The historical wastewaterflows were assumed to be proportional to water-
754 C. T. Roman et al.
TA
BL
E4.
Rel
ativ
eab
un
dan
ceof
dec
apod
sco
llect
edfr
omsh
allo
wes
tuar
ine
hab
itat
sal
ong
agr
adie
nt
from
Mas
sach
use
tts
toT
exas
.Sp
ecie
sre
pre
sen
tin
gat
leas
t90
%of
the
tota
ld
ecap
odca
tch
are
pre
sen
ted
.H
abit
ats
sam
ple
dan
dge
arty
pes
use
dar
eva
riab
leas
not
ed.
Est
uar
yH
abit
atG
ear
Spec
ies
Rel
ativ
eA
bun
dan
ce(%
ofto
tal
catc
h)
Sou
rce
Nau
set
Mar
shE
stu
ary,
Mas
sach
use
tts
Eel
gras
sT
raw
lC
rang
onse
ptem
spin
osa
(San
dsh
rim
p)
55H
eck
etal
.19
89
Car
cinu
sm
aena
s(G
reen
crab
)38
Con
nec
ticu
tR
iver
,C
onn
ecti
cut
Bra
ckis
hM
arsh
Fyke
net
Pala
emon
etes
pugi
o(G
rass
shri
mp
)10
0Fe
llet
al.
1998
Gre
atB
ay-L
ittl
eE
ggH
arbo
r,N
ewJe
rsey
Salt
mar
shW
eir
Pala
emon
etes
vulg
aris
(Gra
sssh
rim
p)
Cra
ngon
sept
emsp
inos
a
66 29
Rou
ntr
eean
dA
ble
1992
Gre
atB
ay-L
ittl
eE
ggH
arbo
r,N
ewJe
rsey
Eel
gras
sE
ncl
osu
retr
apPa
laem
onet
esvu
lgar
isC
rang
onse
ptem
spin
osa
Hip
poly
tepl
eura
cant
ha(G
rass
shri
mp
)
35 33 30
Soga
rdan
dA
ble
1991
York
Riv
er,
Vir
gin
iaE
elgr
ass
Tra
wl
Pala
emon
etes
vulg
aris
Cra
ngon
sept
emsp
inos
aC
allin
ecte
ssa
pidu
s(B
lue
crab
)
52 26 17
Hec
kan
dT
hom
an19
84
Cap
eFe
arR
iver
,N
orth
Car
olin
aSa
ltm
arsh
Sein
ePe
naeu
saz
tecu
s(B
row
nsh
rim
p)
52W
ein
stei
n19
79
Cal
linec
tes
sapi
dus
Pena
eus
duor
arum
(Pin
ksh
rim
p)
25 15
Pena
eus
setif
erus
(Wh
ite
shri
mp
)6
Sap
elo
Isla
nd
,G
eorg
iaSa
ltm
arsh
Flu
me
wei
rPa
laem
onet
espu
gio
Pena
eus
setif
erus
84 16K
nei
ban
dW
agn
er19
94
Coc
odri
e,L
ouis
ian
aSa
ltm
arsh
Sein
ePa
laem
onet
essp
.Pe
naeu
sse
tifer
usC
allin
ecte
ssa
pidu
s
81 9 9
Pet
erso
nan
dT
urn
er19
94
Gal
vest
onB
ay,
Tex
asSa
ltm
arsh
En
clos
ure
trap
Pala
emon
tes
pugi
oPe
naeu
saz
tecu
sPe
naeu
sse
tifer
usC
allin
ecte
ssa
pidu
s
53 18 14 14
Zim
mer
man
and
Min
ello
1984

Northeast Atlantic U.S. Estuaries 755
Fig. 6. Percent of total number of fishes that are classifiedas resident or seasonal resident species (after Ayvazian et al.1992; Peterson and Turner 1994; Able et al. 1996), collectedfrom several shallow estuarine salt marsh and eelgrass habitatsfrom Maine to Texas. ME-1 5 Montsweag Bay (Targett andMcCleave 1974); ME-2 5 Wells Harbor (Ayvazian et al. 1992);MA-1 5 Nauset Marsh (Heck et al. 1989); MA-2 5 Waquoit Bay(Ayvazian et al. 1992); MA-3 5 Great Sippewissett (Werme1981); MA-4 5 Slocum River (Hoff and Ibara 1977); RI 5 Pet-taquamscutt River and Point Judith Pond (Mulkana 1966); CT5 Connecticut River (Fell et al. 1998); NY 5 Great South Bay(Briggs and O’Connor 1971); NJ 5 Great Bay-Little Egg Harbor(Rountree and Able 1992); VA 5 York River (Heck and Tho-man 1984); NC 5 Cape Fear River (Weinstein 1979); SC 5North Inlet (Cain and Dean 1976); LA 5 Cocodrie (Petersonand Turner 1994); TX 5 Galveston Bay (Zimmerman and Mi-nello 1984).
Fig. 7. Historic trends in percent forest cover in the state ofMassachusetts and a portion of the Harvard Forest in centralMassachusetts (redrawn after Foster 1992).
shed population, and for total nitrogen, the his-torical wastewater effluent concentrations were setequal to current effluent concentrations. For totalphosphorus, wastewater effluent concentrationshave changed dramatically because of the chang-ing composition of detergents, thus historical totalphosphorus effluent concentrations were estimat-ed from historical sampling data. By assuming thecurrent ratio of emissions to deposition has re-mained the same since 1900, historical nitrogendeposition loadings were computed from estimatesof the historical emissions of nitrogen oxides to theatmosphere. Loadings from agricultural runoffwere estimated from animal census and fertilizeruse data. Detailed presentations and discussions ofnutrient loading data, both historic and current,are being prepared and are summarized here(Hetling and Jaworski in preparation; Jaworski andHetling in preparation).
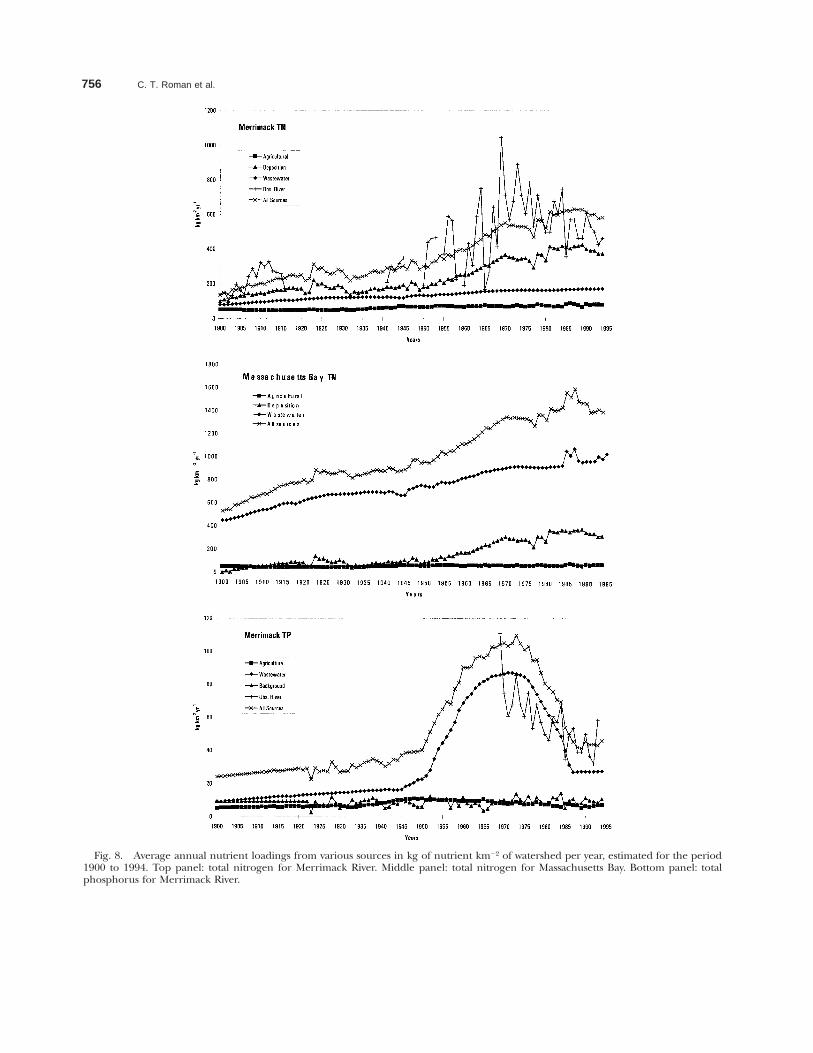
The reconstructed riverine source apportion-ments in Fig. 8 are based on average annual inputsand do not show the considerable variability of av-erage annual loadings calculated from actual mon-itoring programs. Regardless, the match betweenobserved loadings and average annual estimates isreasonable. Historic trends in total nitrogen forthe Merrimack River, Massachusetts show a four-
fold increase in atmospheric deposition as a sourcefrom 1900–1994 (Fig. 8a). A more urban water-shed, such as Massachusetts Bay, revealed thatwastewater inputs of total nitrogen dominated overtime, as would be expected (Fig. 8b).
An analysis of 10 watersheds along a latitudinalgradient from Maine to Virginia shows that totalnitrogen loading increased from about 200 to1,000 kg N km22 yr21 since 1900, with atmosphericdeposition clearly representing the largest anthro-pogenic source to coastal watersheds ( Jaworski etal. 1997). Going back further in historic time topre-industrial conditions, Nixon (1997) has sug-gested that atmospheric deposition of nitrogenwithin the Narragansett Bay watershed was only 5%of present deposition.
The loading of total phosphorus from wastewa-ter discharges has changed dramatically over thepast 95 years, as noted for the Merrimack River(Fig. 8c). With the introduction of high phospho-rus detergents in the late 1940s phosphorus load-ing from wastewater facilities increased dramatical-ly. The advent of low phosphorus detergents in the1970s has resulted in the precipitous decline in re-cent decades.
In addition to determining historic nutrientloading trends to northeast estuaries, we have re-constructed the historic annual average concentra-tions of total nitrogen and total phosphorus enter-ing estuaries (i.e., point-of-entry concentrations) asanother means of studying the impact of humanactivity on estuarine nutrient status (Fig. 9). Theseconcentration estimates were derived from average
756 C. T. Roman et al.
Fig. 8. Average annual nutrient loadings from various sources in kg of nutrient km22 of watershed per year, estimated for the period1900 to 1994. Top panel: total nitrogen for Merrimack River. Middle panel: total nitrogen for Massachusetts Bay. Bottom panel: totalphosphorus for Merrimack River.

Northeast Atlantic U.S. Estuaries 757
Fig. 9. Average annual concentration of nutrients entering several northeast estuaries, reconstructed for the period 1900–1994.Top panel: total nitrogen. Bottom panel: total phosphorus.
annual loadings, in kg km22 of watershed yr21, di-vided by the annual river discharge. The point-of-entry nutrient concentrations do not include anytidal dilution or dispersion. Total nitrogen point-of-entry concentrations in eight northeast estuarieshave increased by a factor of over three since 1900(Fig. 9a). The estuaries to the north, in Maine,have lower average annual concentrations than themore southern systems. It is noted that total nitro-gen concentration in the more urban systems ofthe northeast appears to have leveled in recent de-cades, while concentration in the more northernsystems is increasing, presumably due to increasedurbanization and atmospheric deposition. Mainewatersheds, with high riverine flows, thin soils, andshort growing seasons may be less effective at re-
taining atmospherically-deposited nitrogen ( Jawor-ski et al. 1997).
Total phosphorus point-of-entry concentrationsin the estuarine plumes for the eight northeast sys-tems reached highest levels in the 1960s and havedeclined since, reflecting detergent bans (Fig. 9b).As with total nitrogen, the more urban estuaries inthe southern portion of the region have higherconcentrations.
CURRENT TRENDS
Based on an assessment of coastal counties, thenortheast (defined from Maine to Virginia by Cul-liton et al. 1990) is the most densely populatedcoastal region in the U.S. Sixteen percent of theentire national population resides within this nar-

758 C. T. Roman et al.
TABLE 5. Average annual loading (1988–1994) and relative sources (atmospheric, agricultural runoff, wastewater treatment facilities,background) of total nitrogen and total phosphorus loading to northeast estuaries compared to some mid-Atlantic coastal plainestuaries.
EstuaryTotal N Loading
(kg km22 y21)
% Total N Source
Atmos Agri WasteTotal P Loading
(kg km22 y21)
% Total P Source
Agri Waste Backgd
Northeast Less DevelopedPenobscot Bay, MaineSheepscot River, MaineCasco Bay, MaineSaco River, Maine
310372573387
82775082
131268
6114410
12256322
27258
19
30368235
43391045
Northeast UrbanMassachusetts Bay, MassachusettsBuzzards Bay, Massachusetts
13731373
2433
68
7059
198139
36
9287
57
Narragansett Bay, Massachusetts/Rhode Island 1597 23 4 73 233 2 93 5
Long Island Sound, Connecticut/New York 1571 29 11 61 143 11 83 7
New York/New Jersey Harbor 1882 27 15 58 253 12 84 4
Coastal PlainDelaware Bay, Pennsylvania/
New Jersey/Delaware 1825 34 22 45 124 31 60 8Upper Chesapeake, MarylandPotomac River, MarylandRappahannock River, Virginia
10831245641
483660
363632
17288
445869
367265
452113
187
22
row fringe of northeast coastal counties. Over 60%of the region’s total population, in 1990, lived with-in coastal counties, representing just 25% of theregion’s total land area.
Related to the high population density, waste-water strongly influences the current loading ofnutrients to northeast estuaries (Table 5). Estuariesto the south, along the mid-Atlantic coastal plain,have a greater agricultural influence. For the pe-riod of 1988–1994, sources of total nitrogen andtotal phosphorus were quantified by combiningthe source apportionment watershed loading dataand wastewater effluent loading data that discharg-es directly into tidal waters. The average annualtotal nitrogen loading flux, normalized by water-shed area, for the estuaries in Maine was 410 kgkm22 yr21, while the average loading for the moreurban estuaries from Massachuestts Bay to NewYork/New Jersey Harbor was substantially greater,1,560 kg km22 yr21. About 65% of total nitrogenloading for the urban estuaries was from municipalwastewater discharges. In contrast, atmospheric de-position represented over 70% of total nitrogenloading to the Maine estuaries. Agricultural runoffrepresents less that 10% of total nitrogen loadingfor all of the northeast estuaries, while for themore southern coastal plain estuaries agriculturehas a much greater influence on total nitrogenloadings, often exceeding 30% of all sources (Ta-ble 5).
As would be expected, total phosphorus loadingfor the Maine estuaries averaged 30 kg km22 yr21
with about 59% from municipal wastewater dis-
charges, while almost 90% of the total phosphorusloading to the urban northeast estuaries was fromwastewater treatment discharges. Agricultural in-fluences dominated total phosphorus loadings tothe coastal plain estuaries.
SHALLOW ESTUARINE SYSTEMS: NUTRIENTS ANDHABITAT RESPONSES
A shift from seagrass to macroalgal-dominatedcommunities appears to be an increasingly recog-nizable signature within shallow nutrient-enrichedestuaries of the urban and urbanizing northeasternU.S. There is a clear relationship between in-creased housing density and decreased cover ofeelgrass at the Ninigret Pond, Rhode Island andWaquoit Bay, Massachusetts shallow estuarine em-bayments (Fig. 10; Short et al. 1996; Short and Bur-dick 1996). With increased housing density, cor-responding increased nutrient loading, and de-creased eelgrass cover, there is an increase in ma-croalgal biomass at these two southern NewEngland systems (Thorne-Miller et al. 1983; Valielaet al. 1992; Peckol and Rivers 1996). Similarly, Kin-ney and Roman (1998) have documented the re-lationship between increased nutrient loading andthe conversion of a Ruppia-dominated shallow es-tuary in Maine to green macroalgae, and alongConnecticut’s Long Island Sound shoreline thegreen macroalga, Ulva lactuca, often dominates inshallow nutrient enriched embayments (MumfordCove, see Harlin 1995). Competition for light is akey factor responsible for the seagrass declines un-der nutrient enriched conditions (Short et al.

Northeast Atlantic U.S. Estuaries 759
Fig. 10. Relationship between housing density and eelgrassat Ninigret Pond, Rhode Island (data from Short et al. 1996).
TABLE 6. Role of groundwater in delivering nitrate to shallow estuarine systems of southern New England. * denotes average rangefrom several sites.
Estuary
% of TotalFreshwaterInput by
Groundwater
% of TotalN Inputs by
GroundwaterGroundwater NitrateConcentration (mM) Source
Rhode Island Salt Ponds, Rhode IslandButtermilk Bay, Massachusetts
8885 0.2–450
318–431*
Lee and Olsen 1985Valiela and Costa 1988Weiskel and Howes 1992
Waquoit Bay, Massachusetts 890.3–352
Cambareri and Eichner 1998Valiela et al. 1990
Little Pond, Massachusetts 95 Milham and Howes 1994Nanset Marsh, Massachusetts 6–203* Portnoy et al. 1998
1995; Taylor et al. 1995). Light limitation of en-riched seagrass communities can also be attributedto phytoplankton blooms and seagrass epiphytegrowth (Ryther and Dunstan 1971; Harlin 1995).
Pathways of nitrogen delivery to estuarine sys-tems include atmospheric deposition, river dis-charge, oceanic fluxes, and groundwater, whilemost significant sources of nitrogen may includeatmospheric contamination, wastewater from treat-ment facilities or on-site septic systems, and fertil-izer use (Nixon 1995b; Jaworski et al. 1997; Valielaet al. 1997). In shallow estuarine systems through-out the northeast, especially within watershedsdominated by highly permeable sand/gravel gla-cial outwash aquifers, groundwater is a dominantsource of freshwater and associated nitrate contam-ination (Valiela et al. 1990; Short et al. 1996; Port-noy et al. 1998). In some shallow southern NewEngland estuaries, over 80% of total inorganic ni-trogen inputs are from groundwater discharge (Ta-ble 6). There is minimal removal of nitrate asgroundwater discharges from highly permeablewatersheds into estuarine shorelines that havesandy and low organic sediments, with little or nofringe of salt marsh (Valiela and Costa 1988; Giblinand Gaines 1990; Nowicki et al. 1999). These
shorelines are common from New York to south-eastern Massachusetts and concentrations ofgroundwater-delivered nitrate can be exceptionallyelevated within developed watersheds, in excess of400 mM (Table 6). In contrast to sandy shorelines,as groundwater discharges through highly organicintertidal/subtidal sediments, removal of nitrate bydenitrification would be expected before dischargeto estuarine waters (Valiela and Teal 1979; Caponeand Bautista 1985; Howes et al. 1996).
Summary
Statements that highlight typical characteristicsof estuaries for discrete geographic regions shouldbe made with caution because there are always ex-ceptions. For the northeastern U.S. general orcommon signatures of estuaries are evident, butsince the geomorphology is so complex, rangingfrom bedrock-dominated shores to sand-dominat-ed barriers, there are many exceptions to the typ-ical northeast estuary. Acknowledging this variabil-ity, northeast estuaries are relatively deep whencompared to more southern systems along thecoastal plain, tidal range is high, drainage basinsare small and forested, leading to low riverinefreshwater flows and low suspended sedimentloads. Tidal marshes are small in area and oftenoccur as fringing systems. Resident fishes, includ-ing mummichogs, sticklebacks, and silversides,dominate shallow estuarine habitats of northeastestuaries (salt marshes, eelgrass meadows). Relatedto the high tidal range, intertidal mudflats are ex-tensive in northern New England. Compared tomid-Atlantic, southeast, and Gulf of Mexico coasts,rocky shorelines are a unique feature of northeastestuaries and a direct result of the region’s glacialhistory. Urban land use is a striking feature ofnortheast estuarine watersheds, especially fromBoston to New York. In response, nutrient enrich-ment is an increasingly recognizable signature, es-pecially within shallow estuarine embayments ofthe region.
Understanding fundamental characteristics or

760 C. T. Roman et al.
signatures of estuaries from throughout the U.S.coastal zone, and other areas worldwide, is espe-cially important to recognizing unique processes,trends, or forcing functions that define particularregions. For example, deep estuarine basins areunique to northeast estuaries. What are the eco-logical linkages between these basins and shallowestuarine habitats, such as seagrass beds, marshes,and mudflats? Rocky shores, dominated by ma-croalgae, are common throughout the northeast,and in some estuaries may represent the dominantshallow water habitat. The relative contribution ofthese habitats to total system primary productionneeds to be quantified. And what is the nektonsupport function of these rocky habitats? Withinthe northeast region, Cape Cod is a major biogeo-graphic boundary between boreal species and tem-perate/southern species. How will global climatechange, and associated alteration of physical char-acteristics of northeast estuaries, influence speciescomposition and abundances along this biogeo-graphic boundary? A major source of nutrient in-puts to estuaries of the urbanizing northeasternU.S. is from wastewater sources, whereas agricul-tural sources are more important in mid-Atlanticand southern coastal plain estuaries. How do thesevarying sources, when coupled with different wa-tershed characteristics (deciduous forests, thinsoils, step topographic gradients to the north; con-iferous forests or agricultural, well-developed soils,subtle gradients to the south), influence the pro-cessing of nutrients during delivery to the estuary?Knowledge of both unique and common estuarinesignatures can be especially useful when designingnew research initiatives intended to focus on geo-graphic comparisons.
ACKNOWLEDGMENTS
Thanks are extended to Kenneth Raposa and Eleanor Kinneyfor assistance with preparation of the graphics. This is contri-bution number 352 to the Jackson Estuarine Laboratory, Uni-versity of New Hampshire.
LITERATURE CITED
ABLE, K. W., K. L. HECK, JR., M. P. FAHAY, AND C. T. ROMAN.1988. Use of salt-marsh peat reefs by small juvenile lobsterson Cape Cod, Massachusetts. Estuaries 11:83–86.
ABLE, K. W., D. A. WITTING, R. S. MCBRIDE, R. A. ROUNTREE,AND K. J. SMITH. 1996. Fishes of polyhaline estuarine shoresin Great Bay-Little Egg Harbor, New Jersey: A case study ofseasonal and habitat influences, p. 335–353. In K. F. Nords-trom and C. T. Roman (eds.), Estuarine Shores. John Wileyand Sons, Ltd., Chichester, England.
ADDY, C. E. AND D. A. AYLWARD. 1944. Status of eelgrass in Mas-sachusetts during 1943. Journal of Wildlife Management 8:269–275.
ANDERSON, F. E., L. BLACK. L. E. WATLING, W. MOOK, AND L. M.MAYER. 1981. A temporal and spatial study of mudflat erosionand deposition. Journal of Sedimentary Petrology 51:729–736.
ANISFELD, S. C. AND G. BENOIT. 1997. Impacts of flow restrictions
on salt marshes: An instance of acidification. EnvironmentalScience and Technology 31:1650–1657.
AYVAZIAN, S. G., L. A. DEEGAN, AND J. T. FINN. 1992. Comparisonof habitat use by estuarine fish assemblages in the Acadianand Virginian zoogeographic provinces. Estuaries 15:368–383.
BARRETT, N. E. AND W. A. NIERING. 1993. Tidal marsh restora-tion: Trends in vegetation change using a Geographical In-formation System (GIS). Restoration Ecology 1:18–28.
BERTNESS, M. D. 1984. Habitat and community modification byan introduced herbivorous snail. Ecology 65:370–381.
BERTNESS, M. D. 1999. The Ecology of Atlantic Shorelines. Sin-auer Associates Inc., Sunderland, Massachusetts.
BIANCHI, T. S., M. BASKARAN, J. DELORD, AND M. RAVICHANDRAN.1997. Carbon cycling in a shallow turbid estuary of southeastTexas: The use of plant pigment biomarkers and water qualityparameters. Estuaries 20:404–415.
BIGGS, R. B., J. H. SHARP, T. M. CHURCH, AND J. M. TRAMONTANO.1983. Optical properties, suspended sediments, and chemis-try associated with the turbidity maxima of the Delaware Es-tuary. Canadian Journal of Fisheries and Aquatic Sciences 40:172–179.
BOESCH, D. F. AND R. E. TURNER. 1984. Dependence of fisheryspecies on salt marshes: The role of food and refuge. Estuaries7:460–468.
BOOTHROYD, J. C., N. E. FRIEDRICH, AND S. R. MCGINN. 1985.Geology of microtical coastal lagoons, Rhode Island. MarineGeology 63:35–76.
BOURN, W. S. AND C. COTTAM. 1950. Some Biological Effects ofDitching Tidewater Marshes. Research Report 19. U.S. Fishand Wildlife Service, Washington, D.C.
BRICKER-URSO, S., S. W. NIXON, J. K. COCHRAN, D. J. HIRSHBERG,AND C. HUNT. 1989. Accretion rates and sediment accumula-tion in Rhode Island salt marshes. Estuaries 12:300–317.
BRIGGS, P. T. AND J. S. O’CONNOR. 1971. Comparison of shore-zone fishes over naturally vegetated and sand-filled bottomsin Great South Bay. New York Fish and Game Journal 18:15–41.
BURDICK, D. M., M. DIONNE, R. M. BOUMANS, AND F. T. SHORT.1997. Ecological responses to tidal restorations of two north-ern New England salt marshes. Wetlands Ecology and Manage-ment 4:129–144.
CAIN, R. L. AND J. M. DEAN. 1976. Annual occurrence, abun-dance and diversity of fish in a South Carolina intertidalcreek. Marine Biology 36:369–379.
CALHOUN, A. J. K., J. E. CORMIER, R. B. OWEN, JR., A. F.O’CONNELL, JR., C. T. ROMAN, AND R. W. TINER, JR. 1993. TheWetlands of Acadia National Park and Vicinity. Maine Agri-cultural and Forest Experiment Station Miscellaneous Publi-cation 721. Orono, Maine.
CAMBARERI, T. C. AND E. M. EICHNER. 1998. Watershed delinea-tion and groundwater discharge to a coastal embayment.Ground Water 36:626–634.
CAPONE, D. G. AND M. F. BAUTISTA. 1985. A groundwater sourceof nitrate in nearshore marine sediments. Nature 313:214–216.
CHAMP, M. A., G. A. GOULD III, W. E. BOZZO, S. G. ACKELSON,AND K. C. VIERRA. 1980. Characterization of light extinctionand attenuation in Chesapeake Bay, August 1977, p. 263–277.In V. S. Kennedy (ed.), Estuarine Perspectives. AcademicPress, New York.
CHAPMAN, V. J. 1960. Salt Marshes and Salt Deserts of the World.Interscience Publishers, Inc., New York.
CHMURA, G. L., P. CHASE, AND J. BERCOVITCH. 1997. Climaticcontrols of the middle marsh zone in the Bay of Fundy. Es-tuaries 20:689–699.
CHOCK, J. S. AND A. C. MATHIESON. 1983. Variations of New Eng-land estuarine seaweed biomass. Botanica Marina 26:87–97.
CONOVER, R. J. 1961. A study of Charlestown and Green HillPonds, Rhode Island. Ecology 42:119–140.
COSTA, J. E. 1988. Eelgrass in Buzzards Bay: Distribution, Pro-duction and Historical Changes in Abundance. Technical Re-
Northeast Atlantic U.S. Estuaries 761
port BBP-88–05, U.S. Environmental Protection Agency, Re-gion 1, Boston, Massachusetts.
COTTAM, C. 1934. Past periods of eelgrass scarcity. Rhodora 36:261–264.
COWARDIN, L. M., V. CARTER, F. C. GOLET, AND E. T. LAROE.1979. Classification of Wetlands and Deepwater Habitats ofthe United States. FWS/OBS-79/31. U.S. Fish and WildlifeService, Office of Biological Services, Washington, D.C.
CULLITON, T. J., M. A. WARREN, T. R. GOODSPEED, D. G. REMER,C. M. BLACKWELL, AND J. J. MCDONOUGH III. 1990. 50 Yearsof Population Change Along the Nation’s Coasts, 1960–2010.National Oceanic and Atmospheric Administration, NationalOcean Service, Rockville, Maryland.
DAIBER, F. C. 1986. Conservation of Tidal Marshes. Van Nos-trand Reinhold Co., New York.
DAIBER, F. C. AND C. T. ROMAN. 1988. Tidal marshes, p. 95–113.In T. L. Bryant and J. R. Pennock (eds.), The Delaware Es-tuary: Rediscovering a Forgotten Resource. University of Del-aware Sea Grant College Program, Newark, Delaware.
DAVIS, R. C. AND F. T. SHORT. 1997. Restoring eelgrass, Zosteramarina L., habitat using a new transplanting technique: Thehorizontal rhizome method. Aquatic Botany 59:1–15.
DAVIS, R. C., F. T. SHORT, AND D. M. BURDICK. 1998. Quantifyingthe effects of green crab damage to eelgrass transplants. Res-toration Ecology 6:297–302.
DENNISON, W. C. AND R. S. ALBERTE. 1985. Role of daily lightperiod in the depth distribution of Zostera marina (eelgrass).Marine Ecology Progress Series 25:51–61.
DEXTER, R. W. 1985. Changes in the standing crop of eelgrass,Zostera marina L., at Cape Ann, Massachusetts, since the epi-demic of 1932. Rhodora 87:357–366.
DIONNE, M., F. T. SHORT, AND D. M. BURDICK. 1999. Fish utili-zation of restored, created, and reference salt-marsh habitatin the Gulf of Maine, p. 384–404. In L. Benaka (ed.), FishHabitat: Essential Fish Habitat and Rehabilitation. AmericanFisheries Society, Symposium 22, Bethesda, Maryland.
DORF, B. A. AND J. C. POWELL. 1997. Distribution, abundance,and habitat characteristics of juvenile tautog (Tautoga onitis,Family Labridae) in Narragansett Bay, Rhode Island, 1988–92. Estuaries 20:589–600.
DUFFY, W. D., D. F. BELKNAP, AND J. T. KELLEY. 1989. Morphologyand stratigraphy of small barrier-lagoon systems in Maine. Ma-rine Geology 88:243–262.
FEFER, S. I. AND P. A. SCHETTIG. 1980. An Ecological Character-ization of Coastal Maine (North and East of Cape Elizabeth),Volume 1–4. FWS/OBS-80/29. U.S. Fish and Wildlife Service,Newton Corner, Massachusetts.
FELL, P. E., K. A. MURPHY, M. A. PECK, AND M. L. RECCHIA. 1991.Re-establishment of Melampus bidentatus (Say) and other ma-croinvertebrates on a restored impounded tidal marsh: Com-parison of populations above and below the impoundmentdike. Journal of Experimental Marine Biology and Ecology 152:33–48.
FELL, P. E., S. P. WEISSBACH, D. A. JONES, M. A. FALLON, J. A.ZEPPIERI, E. K. FAISON, K. A. LENNON, K. J. NEWBERRY, AND L.K. REDDINGTON. 1998. Does invasion of oligohaline tidalmarshes by reed grass, Phragmites australis (Cav.) Trin. exSteud., affect the availability of prey resources for the mum-michog, Fundulus heteroclitus L.? Journal of Experimental MarineBiology and Ecology 222:59–77.
FISHER, J. J. 1987. Shoreline development of the glacial CapeCod coastline, p. 279–305. In D. M. FitzGerald and P. S. Rosen(eds.), Glaciated Coasts. Academic Press, Inc., San Diego.
FITZGERALD, D. M., C. T. BALDWIN, N. A. IBRAHIM, AND D. R.SANDS. 1987. Development of the northwestern Buzzards Bayshoreline, Massachusetts, p. 327–357. In D. M. FitzGerald andP. S. Rosen (eds.), Glaciated Coasts. Academic Press, Inc., SanDiego.
FITZGERALD, D. M., P. S. ROSEN, AND S. VAN HETEREN. 1994. New
England barriers, p. 305–394. In R. A. Davis, Jr. (ed.), Geologyof Holocene Barrier Island Systems. Springer-Verlag, Berlin.
FLEMER, D. A. 1970. Primary production in the Chesapeake Bay.Chesapeake Science 11:117–129.
FOLGER, D. W., R. H. MEADE, B. F. JONES, AND R. L. CORY. 1972.Sediments and waters of Somes Sound, a fjordlike estuary inMaine. Limnology and Oceanography 17:394–402.
FONSECA, M. A. 1992. Restoring seagrass systems in the UnitedStates, p. 79–110. In G. W. Thayer (ed.), Restoring the Na-tion’s Marine Environment. Maryland Sea Grant College, Col-lege Park, Maryland.
FONSECA, M. S., W. J. KENWORTHY, AND G. W. THAYER. 1998.Guidelines for Mitigation and Restoration of Seagrass in theUnited States and Adjacent Waters. National Oceanic and At-mospheric Administration, National Marine Fisheries ServiceCoastal Ocean Program, Decision Analysis Series, Rockville,Maryland.
FOSTER, D. R. 1992. Land-use history (1730–1990) and vegeta-tion dynamics in central New England, USA. Journal of Ecology80:753–772.
FOSTER, D. R., T. ZEBRYK, P. SCHOONMAKER, AND A. LEZBERG.1992. Post-settlement history of human land-use and vegeta-tion dynamics of a Tsuga canadensis (hemlock) woodlot in cen-tral New England. Journal of Ecology 80:773–786.
FOULIS, D. B., J. A. EATON, AND R. W. TINER. 1994. WetlandTrends for Selected Areas of the Gulf of Maine, from York,Maine to Rowley, Massachusetts (1977 to 1985–86). EcologicalServices Report R5-94/4. U.S. Fish and Wildlife Service, Had-ley, Massachusetts.
FOULIS, D. B. AND R. W. TINER. 1994a. Wetland Trends for Se-lected Areas of the Cobscook Bay/St. Croix River Estuary ofthe Gulf of Maine (1975–77 to 1983–85). Ecological ServicesReport R5-94/3. U.S. Fish and Wildlife Service, Hadley, Mas-sachusetts.
FOULIS, D. B. AND R. W. TINER. 1994b. Wetland Trends for Se-lected Areas of the Casco Bay Estuary of the Gulf of Maine(1974–77 to 1984–87). Ecological Services Report R5-94/1.U.S. Fish and Wildlife Service, Hadley, Massachusetts.
FOULIS, D. B. AND R. W. TINER. 1994c. Wetland Trends for Se-lected Areas of the Coast of Massachusetts, from Plum Islandto Scituate (1977 to 1985–86). Ecological Services Report R5-94/2. U.S. Fish and Wildlife Service, Hadley, Massachusetts.
GIBLIN, A. E. AND A. G. GAINES. 1990. Nitrogen inputs to a ma-rine embayment: The importance of groundwater. Biogeochem-istry 10:309–328.
GOSSELINK, J. G. AND R. H. BAUMANN. 1980. Wetland inventories:Wetland loss along the United States coast. Zeitschrift fur Geo-morphologie, Supplementbande 34:173–187.
GRIZZLE, R. E., F. T. SHORT, H. HOVEN, L. KINDBLOOM, AND C.R. NEWELL. 1996. Hydrodynamically induced synchronouswaving of seagrass ‘‘monami’’ and its possible effects on larvalmussel settlement. Journal of Experimental Marine Biology andEcology 206:165–177.
HARLEY, M. T. AND S. FINDLAY. 1994. Photosynthesis-irradiancerelationships for three species of submersed macrophytes inthe tidal freshwater Hudson River. Estuaries 17:200–205.
HARLIN, M. M. 1995. Changes in major plant groups followingnutrient enrichment, p. 173–187. In A. J. McComb (ed.), Eu-trophic Shallow Estuaries and Lagoons. CRC Press, Inc., BocaRaton, Florida.
HARRISON, P. G. AND K. H. MANN. 1975. Chemical changes dur-ing the seasonal cycle of growth and decay in eelgrass (Zosteramarina) on the Atlantic coast of Canada. Journal Fisheries Re-search Board of Canada 32:615–621.
HECK, JR., K. L., K. W. ABLE, M. P. FAHAY, AND C. T. ROMAN.1989. Fishes and decapod crustaceans of Cape Cod eelgrassmeadows: Species composition, seasonal abundance patternsand comparison with unvegetated substrates. Estuaries 12:59–65.
762 C. T. Roman et al.
HECK, JR., K. L., K. W. ABLE, C. T. ROMAN, AND M. P. FAHAY.1995. Composition, abundance, biomass, and production ofmacrofauna in a New England estuary: Comparisons amongeelgrass meadows and other nursery habitats. Estuaries 18:379–389.
HECK, JR., K. L. AND T. A. THOMAN. 1984. The nursery role ofseagrass meadows in the upper and lower reaches of the Ches-apeake Bay. Estuaries 7:70–92.
HETLING, L. J., N. A. JAWORSKI, AND D. J. GARRETSON. 1999. Com-parison of nutrient input loading and riverine export fluxesin large watersheds. Water Science and Technology 39:189–196.
HOFF, J. G. AND R. M. IBARA. 1977. Factors affecting the seasonalabundance, composition and diversity of fishes in a south-eastern New England estuary. Estuarine and Coastal Marine Sci-ence 5:665–678.
HOWES, B. L., P. K. WEISKEL, D. D. GOEHRINGER, AND J. M. TEAL.1996. Interception of freshwater and nitrogen transport fromuplands to coastal waters: The role of saltmarshes, p. 287–310. In K. F. Nordstrom and C. T. Roman (eds.), EstuarineShores. John Wiley and Sons, Ltd., Chichester, England.
ISAJI, T., M. L. SPAULDING, AND J. STACE. 1985. Tidal exchangebetween a coastal lagoon and offshore waters. Estuaries 8:203–216.
JACOBSON, H. A. AND G. L. JACOBSON, JR. 1989. Variability ofvegetation in tidal marshes of Maine, U.S.A. Canadian Journalof Botany 67:230–238.
JACOBSON, H. A., G. L. JACOBSON, JR., AND J. T. KELLEY. 1987.Distribution and abundance of tidal marshes along the coastof Maine. Estuaries 10:126–131.
JAWORSKI, N. A., R. W. HOWARTH, AND L. J. HETLING. 1997. At-mospheric deposition of nitrogen oxides onto the landscapecontributes to coastal eutrophication in the northeast UnitedStates. Environmental Science and Technology 31:1995–2004.
JOSSELYN, M. N. AND A. C. MATHIESON. 1978. Contribution ofreceptacles from the fucoid Ascophyllum nodosum to the detri-tal pool of a north temperate estuary. Estuaries 1:258–261.
JOSSELYN, M. N. AND A. C. MATHIESON. 1980. Seasonal influx anddecomposition of autochthonous macrophyte litter in a northtemperate estuary. Hydrobiologia 71:197–208.
KELLEY, J. T. 1987. An inventory of coastal environments andclassification of Maine’s glaciated shoreline, p. 151–176. In D.M. FitzGerald and P. S. Rosen (eds.), Glaciated Coasts. Aca-demic Press, Inc., San Diego.
KELLEY, J. T., D. F. BELKNAP, G. L. JACOBSON, JR., AND H. A.JACOBSON. 1988. The morphology and origin of salt marshesalong the glaciated coastline of Maine, USA. Journal of CoastalResearch 4:649–665.
KELLEY, J. T., A. R. KELLEY, D. F. BELKNAP, AND R. C. SHIPP. 1986.Variability in the evolution of two adjacent bedrock-framedestuaries in Maine, p. 21–42. In D. A. Wolfe (ed.), EstuarineVariability. Academic Press, Inc., Orlando.
KINNEY, E. H. AND C. T. ROMAN. 1998. Response of primary pro-ducers to nutrient enrichment in a shallow estuary. MarineEcology Progress Series 163:89–98.
KIVIAT, E. 1974. A fresh-water tidal marsh on the Hudson, TivoliNorth Bay, paper 14. In 3rd Symposium on Hudson RiverEcology. Hudson River Environmental Society, Bronx, NewYork.
KNEIB, R. T. AND S. L. WAGNER. 1994. Nekton use of vegetatedmarsh habitats at different stages of tidal inundation. MarineEcology Progress Series 106:227–238.
LEE, V. AND S. OLSEN. 1985. Eutrophication and managementinitiatives for the control of nutrient inputs to Rhode Islandcoastal lagoons. Estuaries 8:191–202.
LEWIS, R. S. AND J. R. STONE. 1991. Late Quaternary stratigraphyand depositional history of the Long Island Sound basin:Connecticut and New York. Journal of Coastal Research 11:1–23.
LUBCHENCO, J. 1980. Algal zonation in the New England rocky
intertial community: An experimental analysis. Ecology 61:333–344.
MANN, K. H. 1972. Ecological energetics of the sea-weed zonein a marine bay on the Atlantic coast of Canada. II. Produc-tivity of the seaweeds. Marine Biology 14:199–209.
MANN, K. H. 1973. Seaweeds: Their productivity and strategy forgrowth. Science 182:975–981.
MCIVOR, C. C. AND L. P. ROZAS. 1996. Direct nekton use of in-tertidal saltmarsh habitat and linkage with adjacent habitats:A review from the southeastern United States, p. 311–334. InK. F. Nordstrom and C. T. Roman (eds.), Estuarine Shores.John Wiley and Sons, Ltd., Chichester, England.
MCMASTER, R. L. 1984. Holocene stratigraphy and depositionalhistory of the Narragansett Bay system, Rhode Island. Sedi-mentology 31:777–792.
MCPHERSON, B. F. AND R. L. MILLER. 1987. The vertical attenu-ation of light in Charlotte Harbor, a shallow, subtropical es-tuary, south-western Florida. Estuarine, Coastal and Shelf Science25:721–737.
METZLER, K. J. AND R. W. TINER. 1992. Wetlands of Connecticut.State Geological and Natural History Survey of Connecticut,Department of Environmental Protection and U.S. Fish andWildlife Service, National Wetlands Inventory. Hartford, Con-necticut.
MILLER, W. B. AND F. E. EGLER. 1950. Vegetation of the Weque-tequock-Pawcatuck tidal-marshes, Connecticut. EcologicalMonographs 20:143–172.
MILLHAM, N. P. AND B. L. HOWES. 1994. Freshwater flow into acoastal embayment: Groundwater and surface water inputs.Limnology and Oceanography 39:1928–1944.
MILNE, L. J. AND M. J. MILNE. 1951. The eelgrass catastrophe.Scientific American 184:52–55.
MULKANA, M. S. 1966. The growth and feeding habits of juvenilefishes in two Rhode Island estuaries. Gulf Research Reports 2:97–167.
MUEHLSTEIN, L. K., D. PORTER, AND F. T. SHORT. 1991. Labyrin-thula zosterae sp. Nov., the causative agent of wasting diseaseof eelgrass, Zostera marina. Mycologia 83:180–191.
NATIONAL OCEANIC AND ATMOSPHERIC ADMINISTRATION. 1990.Estuaries of the United States, Vital Statistics of a NationalResource Base. National Oceanic and Atmospheric Adminis-tration, National Ocean Service, Rockville, Maryland.
NEWELL, C. R., H. HIDU, B. J. MCALICE, G. PODNIESINSKI, F.SHORT, AND L. KINDBLOM. 1991. Recruitment and commercialseed procurement of the blue mussel Mytilus edulis in Maine.Journal of the World Aquaculture Society 22:134–152.
NIERING, W. A. AND R. S. WARREN. 1974. Tidal Wetlands of Con-necticut: Volume 1, Vegetation and Associated Animal Popu-lations. Technical Report, Department of Environmental Pro-tection, State of Connecticut, Hartford, Connecticut.
NIERING, W. A. AND R. S. WARREN. 1980. Vegetation patterns andprocesses on New England salt marshes. BioScience 30:301–307.
NIXON, S. W. 1982. The Ecology of New England High SaltMarshes: A Community Profile. FWS/OBS-81/55. U.S. Fishand Wildlife Service, Washington, D.C.
NIXON, S. W. 1986. Nutrient dynamics and productivity in ma-rine coastal waters, p. 97–115. In R. Halwagy, D. Clayton, andM. Behbehani (eds.), Marine Environment and Pollution.The Alden Press, Oxford.
NIXON, S. W. 1995a. Metal Inputs to Narragansett Bay: A Historyand Assessment of Recent Conditions. Rhode Island SeaGrant, Narragansett, Rhode Island.
NIXON, S. W. 1995b. Coastal marine eutrophication: A defini-tion, social causes, and future concerns. Ophelia 41:199–219.
NIXON, S. W. 1997. Prehistoric nutrient inputs and productivityin Narragansett Bay. Estuaries 20:253–261.
NIXON, S. W. AND C. A. OVIATT. 1973. Ecology of a New Englandsalt marsh. Ecological Monographs 43:463–498.
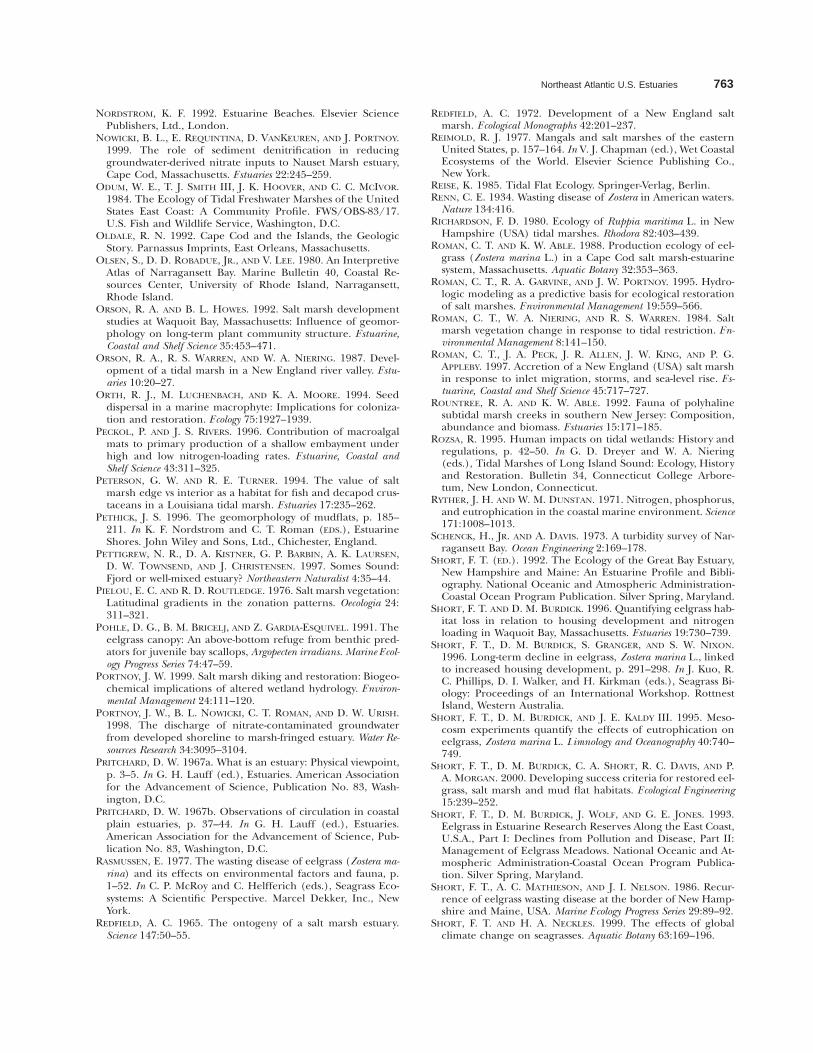
Northeast Atlantic U.S. Estuaries 763
NORDSTROM, K. F. 1992. Estuarine Beaches. Elsevier SciencePublishers, Ltd., London.
NOWICKI, B. L., E. REQUINTINA, D. VANKEUREN, AND J. PORTNOY.1999. The role of sediment denitrification in reducinggroundwater-derived nitrate inputs to Nauset Marsh estuary,Cape Cod, Massachusetts. Estuaries 22:245–259.
ODUM, W. E., T. J. SMITH III, J. K. HOOVER, AND C. C. MCIVOR.1984. The Ecology of Tidal Freshwater Marshes of the UnitedStates East Coast: A Community Profile. FWS/OBS-83/17.U.S. Fish and Wildlife Service, Washington, D.C.
OLDALE, R. N. 1992. Cape Cod and the Islands, the GeologicStory. Parnassus Imprints, East Orleans, Massachusetts.
OLSEN, S., D. D. ROBADUE, JR., AND V. LEE. 1980. An InterpretiveAtlas of Narragansett Bay. Marine Bulletin 40, Coastal Re-sources Center, University of Rhode Island, Narragansett,Rhode Island.
ORSON, R. A. AND B. L. HOWES. 1992. Salt marsh developmentstudies at Waquoit Bay, Massachusetts: Influence of geomor-phology on long-term plant community structure. Estuarine,Coastal and Shelf Science 35:453–471.
ORSON, R. A., R. S. WARREN, AND W. A. NIERING. 1987. Devel-opment of a tidal marsh in a New England river valley. Estu-aries 10:20–27.
ORTH, R. J., M. LUCHENBACH, AND K. A. MOORE. 1994. Seeddispersal in a marine macrophyte: Implications for coloniza-tion and restoration. Ecology 75:1927–1939.
PECKOL, P. AND J. S. RIVERS. 1996. Contribution of macroalgalmats to primary production of a shallow embayment underhigh and low nitrogen-loading rates. Estuarine, Coastal andShelf Science 43:311–325.
PETERSON, G. W. AND R. E. TURNER. 1994. The value of saltmarsh edge vs interior as a habitat for fish and decapod crus-taceans in a Louisiana tidal marsh. Estuaries 17:235–262.
PETHICK, J. S. 1996. The geomorphology of mudflats, p. 185–211. In K. F. Nordstrom and C. T. Roman (EDS.), EstuarineShores. John Wiley and Sons, Ltd., Chichester, England.
PETTIGREW, N. R., D. A. KISTNER, G. P. BARBIN, A. K. LAURSEN,D. W. TOWNSEND, AND J. CHRISTENSEN. 1997. Somes Sound:Fjord or well-mixed estuary? Northeastern Naturalist 4:35–44.
PIELOU, E. C. AND R. D. ROUTLEDGE. 1976. Salt marsh vegetation:Latitudinal gradients in the zonation patterns. Oecologia 24:311–321.
POHLE, D. G., B. M. BRICELJ, AND Z. GARDIA-ESQUIVEL. 1991. Theeelgrass canopy: An above-bottom refuge from benthic pred-ators for juvenile bay scallops, Argopecten irradians. Marine Ecol-ogy Progress Series 74:47–59.
PORTNOY, J. W. 1999. Salt marsh diking and restoration: Biogeo-chemical implications of altered wetland hydrology. Environ-mental Management 24:111–120.
PORTNOY, J. W., B. L. NOWICKI, C. T. ROMAN, AND D. W. URISH.1998. The discharge of nitrate-contaminated groundwaterfrom developed shoreline to marsh-fringed estuary. Water Re-sources Research 34:3095–3104.
PRITCHARD, D. W. 1967a. What is an estuary: Physical viewpoint,p. 3–5. In G. H. Lauff (ed.), Estuaries. American Associationfor the Advancement of Science, Publication No. 83, Wash-ington, D.C.
PRITCHARD, D. W. 1967b. Observations of circulation in coastalplain estuaries, p. 37–44. In G. H. Lauff (ed.), Estuaries.American Association for the Advancement of Science, Pub-lication No. 83, Washington, D.C.
RASMUSSEN, E. 1977. The wasting disease of eelgrass (Zostera ma-rina) and its effects on environmental factors and fauna, p.1–52. In C. P. McRoy and C. Helfferich (eds.), Seagrass Eco-systems: A Scientific Perspective. Marcel Dekker, Inc., NewYork.
REDFIELD, A. C. 1965. The ontogeny of a salt marsh estuary.Science 147:50–55.
REDFIELD, A. C. 1972. Development of a New England saltmarsh. Ecological Monographs 42:201–237.
REIMOLD, R. J. 1977. Mangals and salt marshes of the easternUnited States, p. 157–164. In V. J. Chapman (ed.), Wet CoastalEcosystems of the World. Elsevier Science Publishing Co.,New York.
REISE, K. 1985. Tidal Flat Ecology. Springer-Verlag, Berlin.RENN, C. E. 1934. Wasting disease of Zostera in American waters.
Nature 134:416.RICHARDSON, F. D. 1980. Ecology of Ruppia maritima L. in New
Hampshire (USA) tidal marshes. Rhodora 82:403–439.ROMAN, C. T. AND K. W. ABLE. 1988. Production ecology of eel-
grass (Zostera marina L.) in a Cape Cod salt marsh-estuarinesystem, Massachusetts. Aquatic Botany 32:353–363.
ROMAN, C. T., R. A. GARVINE, AND J. W. PORTNOY. 1995. Hydro-logic modeling as a predictive basis for ecological restorationof salt marshes. Environmental Management 19:559–566.
ROMAN, C. T., W. A. NIERING, AND R. S. WARREN. 1984. Saltmarsh vegetation change in response to tidal restriction. En-vironmental Management 8:141–150.
ROMAN, C. T., J. A. PECK, J. R. ALLEN, J. W. KING, AND P. G.APPLEBY. 1997. Accretion of a New England (USA) salt marshin response to inlet migration, storms, and sea-level rise. Es-tuarine, Coastal and Shelf Science 45:717–727.
ROUNTREE, R. A. AND K. W. ABLE. 1992. Fauna of polyhalinesubtidal marsh creeks in southern New Jersey: Composition,abundance and biomass. Estuaries 15:171–185.
ROZSA, R. 1995. Human impacts on tidal wetlands: History andregulations, p. 42–50. In G. D. Dreyer and W. A. Niering(eds.), Tidal Marshes of Long Island Sound: Ecology, Historyand Restoration. Bulletin 34, Connecticut College Arbore-tum, New London, Connecticut.
RYTHER, J. H. AND W. M. DUNSTAN. 1971. Nitrogen, phosphorus,and eutrophication in the coastal marine environment. Science171:1008–1013.
SCHENCK, H., JR. AND A. DAVIS. 1973. A turbidity survey of Nar-ragansett Bay. Ocean Engineering 2:169–178.
SHORT, F. T. (ED.). 1992. The Ecology of the Great Bay Estuary,New Hampshire and Maine: An Estuarine Profile and Bibli-ography. National Oceanic and Atmospheric Administration-Coastal Ocean Program Publication. Silver Spring, Maryland.
SHORT, F. T. AND D. M. BURDICK. 1996. Quantifying eelgrass hab-itat loss in relation to housing development and nitrogenloading in Waquoit Bay, Massachusetts. Estuaries 19:730–739.
SHORT, F. T., D. M. BURDICK, S. GRANGER, AND S. W. NIXON.1996. Long-term decline in eelgrass, Zostera marina L., linkedto increased housing development, p. 291–298. In J. Kuo, R.C. Phillips, D. I. Walker, and H. Kirkman (eds.), Seagrass Bi-ology: Proceedings of an International Workshop. RottnestIsland, Western Australia.
SHORT, F. T., D. M. BURDICK, AND J. E. KALDY III. 1995. Meso-cosm experiments quantify the effects of eutrophication oneelgrass, Zostera marina L. Limnology and Oceanography 40:740–749.
SHORT, F. T., D. M. BURDICK, C. A. SHORT, R. C. DAVIS, AND P.A. MORGAN. 2000. Developing success criteria for restored eel-grass, salt marsh and mud flat habitats. Ecological Engineering15:239–252.
SHORT, F. T., D. M. BURDICK, J. WOLF, AND G. E. JONES. 1993.Eelgrass in Estuarine Research Reserves Along the East Coast,U.S.A., Part I: Declines from Pollution and Disease, Part II:Management of Eelgrass Meadows. National Oceanic and At-mospheric Administration-Coastal Ocean Program Publica-tion. Silver Spring, Maryland.
SHORT, F. T., A. C. MATHIESON, AND J. I. NELSON. 1986. Recur-rence of eelgrass wasting disease at the border of New Hamp-shire and Maine, USA. Marine Ecology Progress Series 29:89–92.
SHORT, F. T. AND H. A. NECKLES. 1999. The effects of globalclimate change on seagrasses. Aquatic Botany 63:169–196.
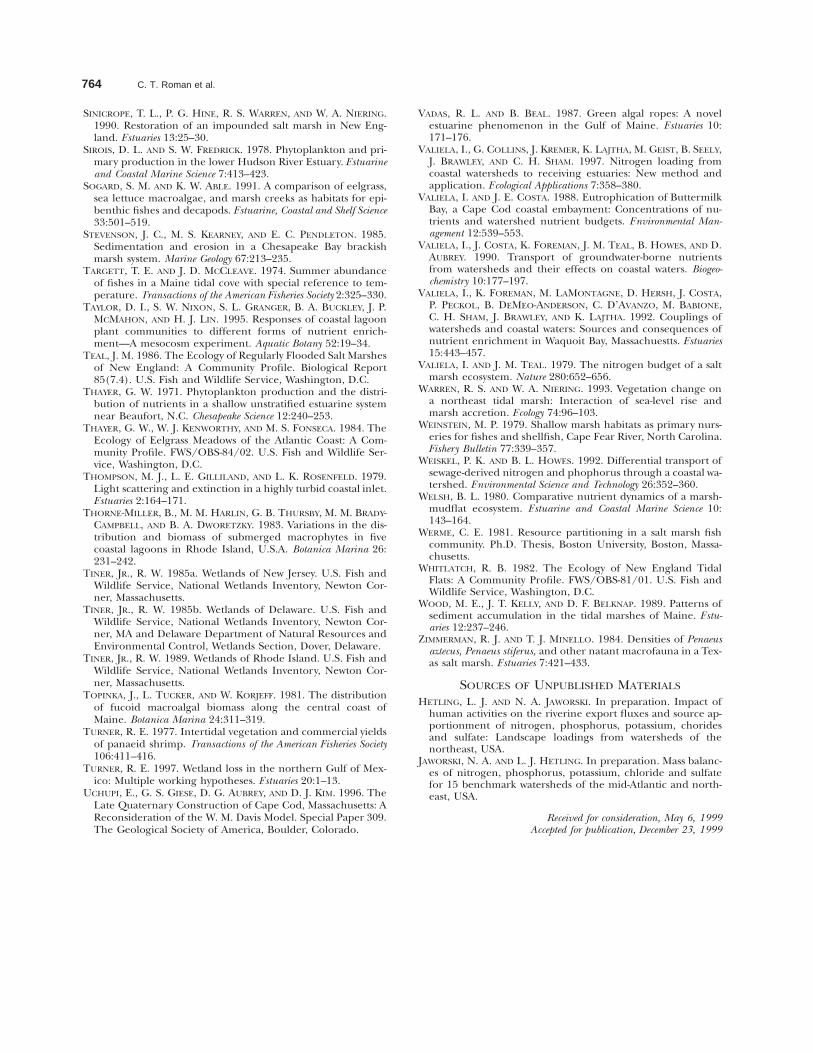
764 C. T. Roman et al.
SINICROPE, T. L., P. G. HINE, R. S. WARREN, AND W. A. NIERING.1990. Restoration of an impounded salt marsh in New Eng-land. Estuaries 13:25–30.
SIROIS, D. L. AND S. W. FREDRICK. 1978. Phytoplankton and pri-mary production in the lower Hudson River Estuary. Estuarineand Coastal Marine Science 7:413–423.
SOGARD, S. M. AND K. W. ABLE. 1991. A comparison of eelgrass,sea lettuce macroalgae, and marsh creeks as habitats for epi-benthic fishes and decapods. Estuarine, Coastal and Shelf Science33:501–519.
STEVENSON, J. C., M. S. KEARNEY, AND E. C. PENDLETON. 1985.Sedimentation and erosion in a Chesapeake Bay brackishmarsh system. Marine Geology 67:213–235.
TARGETT, T. E. AND J. D. MCCLEAVE. 1974. Summer abundanceof fishes in a Maine tidal cove with special reference to tem-perature. Transactions of the American Fisheries Society 2:325–330.
TAYLOR, D. I., S. W. NIXON, S. L. GRANGER, B. A. BUCKLEY, J. P.MCMAHON, AND H. J. LIN. 1995. Responses of coastal lagoonplant communities to different forms of nutrient enrich-ment—A mesocosm experiment. Aquatic Botany 52:19–34.
TEAL, J. M. 1986. The Ecology of Regularly Flooded Salt Marshesof New England: A Community Profile. Biological Report85(7.4). U.S. Fish and Wildlife Service, Washington, D.C.
THAYER, G. W. 1971. Phytoplankton production and the distri-bution of nutrients in a shallow unstratified estuarine systemnear Beaufort, N.C. Chesapeake Science 12:240–253.
THAYER, G. W., W. J. KENWORTHY, AND M. S. FONSECA. 1984. TheEcology of Eelgrass Meadows of the Atlantic Coast: A Com-munity Profile. FWS/OBS-84/02. U.S. Fish and Wildlife Ser-vice, Washington, D.C.
THOMPSON, M. J., L. E. GILLILAND, AND L. K. ROSENFELD. 1979.Light scattering and extinction in a highly turbid coastal inlet.Estuaries 2:164–171.
THORNE-MILLER, B., M. M. HARLIN, G. B. THURSBY, M. M. BRADY-CAMPBELL, AND B. A. DWORETZKY. 1983. Variations in the dis-tribution and biomass of submerged macrophytes in fivecoastal lagoons in Rhode Island, U.S.A. Botanica Marina 26:231–242.
TINER, JR., R. W. 1985a. Wetlands of New Jersey. U.S. Fish andWildlife Service, National Wetlands Inventory, Newton Cor-ner, Massachusetts.
TINER, JR., R. W. 1985b. Wetlands of Delaware. U.S. Fish andWildlife Service, National Wetlands Inventory, Newton Cor-ner, MA and Delaware Department of Natural Resources andEnvironmental Control, Wetlands Section, Dover, Delaware.
TINER, JR., R. W. 1989. Wetlands of Rhode Island. U.S. Fish andWildlife Service, National Wetlands Inventory, Newton Cor-ner, Massachusetts.
TOPINKA, J., L. TUCKER, AND W. KORJEFF. 1981. The distributionof fucoid macroalgal biomass along the central coast ofMaine. Botanica Marina 24:311–319.
TURNER, R. E. 1977. Intertidal vegetation and commercial yieldsof panaeid shrimp. Transactions of the American Fisheries Society106:411–416.
TURNER, R. E. 1997. Wetland loss in the northern Gulf of Mex-ico: Multiple working hypotheses. Estuaries 20:1–13.
UCHUPI, E., G. S. GIESE, D. G. AUBREY, AND D. J. KIM. 1996. TheLate Quaternary Construction of Cape Cod, Massachusetts: AReconsideration of the W. M. Davis Model. Special Paper 309.The Geological Society of America, Boulder, Colorado.
VADAS, R. L. AND B. BEAL. 1987. Green algal ropes: A novelestuarine phenomenon in the Gulf of Maine. Estuaries 10:171–176.
VALIELA, I., G. COLLINS, J. KREMER, K. LAJTHA, M. GEIST, B. SEELY,J. BRAWLEY, AND C. H. SHAM. 1997. Nitrogen loading fromcoastal watersheds to receiving estuaries: New method andapplication. Ecological Applications 7:358–380.
VALIELA, I. AND J. E. COSTA. 1988. Eutrophication of ButtermilkBay, a Cape Cod coastal embayment: Concentrations of nu-trients and watershed nutrient budgets. Environmental Man-agement 12:539–553.
VALIELA, I., J. COSTA, K. FOREMAN, J. M. TEAL, B. HOWES, AND D.AUBREY. 1990. Transport of groundwater-borne nutrientsfrom watersheds and their effects on coastal waters. Biogeo-chemistry 10:177–197.
VALIELA, I., K. FOREMAN, M. LAMONTAGNE, D. HERSH, J. COSTA,P. PECKOL, B. DEMEO-ANDERSON, C. D’AVANZO, M. BABIONE,C. H. SHAM, J. BRAWLEY, AND K. LAJTHA. 1992. Couplings ofwatersheds and coastal waters: Sources and consequences ofnutrient enrichment in Waquoit Bay, Massachuestts. Estuaries15:443–457.
VALIELA, I. AND J. M. TEAL. 1979. The nitrogen budget of a saltmarsh ecosystem. Nature 280:652–656.
WARREN, R. S. AND W. A. NIERING. 1993. Vegetation change ona northeast tidal marsh: Interaction of sea-level rise andmarsh accretion. Ecology 74:96–103.
WEINSTEIN, M. P. 1979. Shallow marsh habitats as primary nurs-eries for fishes and shellfish, Cape Fear River, North Carolina.Fishery Bulletin 77:339–357.
WEISKEL, P. K. AND B. L. HOWES. 1992. Differential transport ofsewage-derived nitrogen and phophorus through a coastal wa-tershed. Environmental Science and Technology 26:352–360.
WELSH, B. L. 1980. Comparative nutrient dynamics of a marsh-mudflat ecosystem. Estuarine and Coastal Marine Science 10:143–164.
WERME, C. E. 1981. Resource partitioning in a salt marsh fishcommunity. Ph.D. Thesis, Boston University, Boston, Massa-chusetts.
WHITLATCH, R. B. 1982. The Ecology of New England TidalFlats: A Community Profile. FWS/OBS-81/01. U.S. Fish andWildlife Service, Washington, D.C.
WOOD, M. E., J. T. KELLY, AND D. F. BELKNAP. 1989. Patterns ofsediment accumulation in the tidal marshes of Maine. Estu-aries 12:237–246.
ZIMMERMAN, R. J. AND T. J. MINELLO. 1984. Densities of Penaeusaztecus, Penaeus stiferus, and other natant macrofauna in a Tex-as salt marsh. Estuaries 7:421–433.
SOURCES OF UNPUBLISHED MATERIALS
HETLING, L. J. AND N. A. JAWORSKI. In preparation. Impact ofhuman activities on the riverine export fluxes and source ap-portionment of nitrogen, phosphorus, potassium, choridesand sulfate: Landscape loadings from watersheds of thenortheast, USA.
JAWORSKI, N. A. AND L. J. HETLING. In preparation. Mass balanc-es of nitrogen, phosphorus, potassium, chloride and sulfatefor 15 benchmark watersheds of the mid-Atlantic and north-east, USA.
Received for consideration, May 6, 1999Accepted for publication, December 23, 1999