estuarine, coastal and shelf sciencemedia2.lpb.org/images/pdf/tt_wilsonallison2008.pdf ·...
TRANSCRIPT

lable at ScienceDirect
Estuarine, Coastal and Shelf Science 80 (2008) 483–494
Contents lists avai
Estuarine, Coastal and Shelf Science
journal homepage: www.elsevier .com/locate/ecss
An equilibrium profile model for retreating marsh shorelinesin southeast Louisiana
Carol A. Wilson a,*, Mead A. Allison b
a Boston University, Earth Sciences, 675 Commonwealth Avenue, Rm. 141, Boston, MA 02215, United Statesb Institute for Geophysics, Jackson School of Geosciences, University of Texas, 10100 Burnet Rd., Austin, TX 78758-4445, United States
a r t i c l e i n f o
Article history:Received 23 April 2008Accepted 1 September 2008Available online 23 September 2008
Keywords:marsh erosionequilibrium profilewave attackmarsh geomorphologysediment yieldsLouisianaBarataria BayBreton SoundBalize Delta
* Corresponding author.E-mail address: [email protected] (C.A. Wilson).
0272-7714/$ – see front matter � 2008 Elsevier Ltd.doi:10.1016/j.ecss.2008.09.004
a b s t r a c t
Louisiana’s coastal marshes are experiencing the highest wetland loss rates in the U.S., in part due tosubsidence-driven relative sea-level rise. These marshes are also vulnerable to the erosive power of waveattack: 1) on the marsh edge adjacent to open-water bodies, and 2) after the marsh platform issubmerged. Marsh shorelines in Barataria Bay, Breton Sound, and the active Balize delta of southeasternLouisiana were examined in areas where the subaerial marsh platform had disappeared since 1932.Vibracore transects of marsh and adjacent bay surface sediments (to w2 m depth) were analyzed usinggeotechnical, stratigraphic, and radiochemical (137-Cs and 210-Pb) methods, and the subaerial-to-subaqueous transition of the marsh was mapped for elevation using standard stadia rod transit andfathometer measurements. Results indicate that marsh edge erosion of the platform takes placesubaqueously until water depths of w1.5 m are reached. This is observed even in interior pond regions,but the shoreface elevation profiles are a function of fetch: exposed open bay sites display greaterincision (depth and rate) of the marsh platform than protected interior bay or pond sites. Core stratig-raphy reveals that the outer part of the subaqueous platform switches from erosional to depositional asretreat proceeds, covering the incised marsh deposits unconformably with estuarine shelly muds. 137-Csand excess 210-Pb activity indicates that these muds are deposited within a few decades of subaerialmarsh loss. The consistency of the cross-shore profile results suggests that a single profile of equilibriumcan approximate the morphology of eroding marsh edges in southeast Louisiana: platform stratigraphyand resistance to erosion have a limited effect on profile shape. This equilibrium profile and remotesensing images of shoreline change are used to estimate the sediment yield to adjacent estuarine areasby this process. On average, 1.5 m3 of sediment are yielded per m shoreline length annually from bothBarataria Bay and Breton Sound. Due to the highly organic nature of the eroded sediment (w30%), thissupply of organic-rich material could significantly impact estuarine productivity and hypoxia on theLouisiana continental shelf.
� 2008 Elsevier Ltd. All rights reserved.
1. Introduction
In the presence of eustatic sea-level rise, understanding theprocesses of wetland deterioration is fundamental for mitigation offuture losses and the current impact on coastal communities andinfrastructure. Louisiana in the United States has some of thenation’s highest wetland loss rates (26–30 km2 yr�1; Barras et al.,2003) which stems from natural factors such as subsidence fromsediment compaction and dewatering, eustatic sea-level rise, waveerosion, growth faulting, isostatic adjustments, and halokinesis, aswell as anthropogenic processes such as channelization of theMississippi River, canal dredging, and fluid withdrawal (Coleman
All rights reserved.
and Gagliano, 1964; Gagliano et al., 1981; Day et al., 2000; Gagliano,2003; Morton et al., 2006). Marshes vertically accrete through insitu production of organic matter and detrital trapping in order tomaintain an optimal elevation for production and sustainability(Delaune et al., 1983; Nyman et al., 1990; Cahoon and Reed, 1995). Ithas been shown in several studies of Louisiana deltaic marshes thataccretion rates are insufficient to offset these rates of regionalrelative sea-level rise (RSLR; w1–2 cm yr�1; Baumann et al., 1984;Cahoon and Reed, 1995; Rybczyk and Cahoon, 2002).
Lateral retreat of the shorelines of bay, lake, and Gulf environ-ments is estimated to account for 25% of overall wetland loss inLouisiana between 1932 and 1990 (Penland et al., 2000), thushorizontal shoreline changes are well-documented. However, littlehas been done to study the vertical shoreline morphology in thisregion. Kirby (2000) revealed that mudshore profiles generallyreflect either the dominance of accretion or erosion: accretion-

C.A. Wilson, M.A. Allison / Estuarine, Coastal and Shelf Science 80 (2008) 483–494484
dominated shores are convex in shape, while erosion-dominatedshores are concave. The shape is also controlled by tidal currentsand, even more dominantly, by wave climate. The role of waveattack on coastal marshes is compounded by the conversion ofmarsh platforms to open-water, thereby increasing the fetch andwave power on exposed marsh edges. Alteration of marsh edgebathymetric gradients increases waterbody depth adjacent to themarsh platform. This likely impacts the rate of loss of remainingsubaerial marshes (an increase in the wave power would increasethe retreat) and would increase the sediment volume needed torebuild wetland habitat with restoration efforts.
The primary objective of this study was to identify the nature andmagnitude of wave-induced subaqueous platform erosion that takesplace with retreat of the marsh shoreline in several study areas insoutheastern Louisiana. We formulate a conceptual model thataddresses this retreat with RSLR. We find that, contrary to a previousstudy by Kirby (2000), marsh shorelines in coastal Louisiana areerosion-dominated and unstable and yield significant material intothe adjacent bays with their rapid retreat (w1 m yr�1 in the studyareas). Quantification of the volume of mineral and particulate organicmatter (POM) released by erosion of the marsh platform is criticalbecause it supplies nutrients to macrofauna and flora in adjacentestuarine water bodies, is a potential contributor to summer hypoxiaon the adjacent inner continental shelf (Bianchi et al., 2007), and is anundervalued source of organic matter flux in carbon budgets.
2. Study areas
The Mississippi deltaic plain is a result of the deposition andreworking of sediments carried by the Mississippi River, which haschanged course at least five times since eustatic sea-level stabilizedin the northern Gulf of Mexico about 7000 yr BP (Frazier, 1967;Roberts, 1997; Coleman et al., 1998). In this study we investigated
Fig. 1. Study areas including locations of study grids occupied and local tide gauges. X’s maLouisiana Department of Natural Resources).
marsh systems formed by three different deltaic lobes (Fig. 1). Thefirst site was in the St. Bernard delta lobe, which was activebetween w3700 year BP and w1500 yr BP east of the modern rivercourse (Tornqvist et al., 1996). Field sites in Breton Sound werechosen in three Spartina alterniflora-dominant marsh areas labeledIBS, or Inner Breton Sound.
The second study site was Barataria Bay, which occupies aninterlobe basin between the modern Balize and abandonedLafourche delta lobes (active w1500–100 yr BP, and w1300 yr BP topresent, respectively; Frazier, 1967; Tornqvist et al., 1996; Flockset al., 2006). Barataria Basin peat deposits began forming 400 yr BPwhen clastic deltaic sediments from the modern Balize delta lobebypassed the area (Kosters, 1989). Compaction and subsidence ofunderlying deltaic deposits has contributed toward shorelinetransgression, and currently both Barataria Bay and Breton Soundare in a similar state of deterioration (large land areas have con-verted to open-water). Field studies were conducted in S. alterni-flora marshes in both the upper and lower Barataria Bay (UBB andLBB, respectively; Fig. 1).
The third site is in the Balize lobe of the modern river course.Although the Balize delta continues to actively receive freshwaterand sediment from the Mississippi River through minor distribu-taries and crevasses and by overbanking of natural levees duringhigh discharge periods, submergence and wetland deteriorationtake place on now moribund crevasse splays formed during the last1–2 centuries (Wells et al., 1982). Three field sites were examined inPanicum hemitomon (maidencane) dominated wetlands located inthe Deltas National Wildlife refuge (DNWR; Fig. 1).
3. Methods
Field areas were chosen using georeferenced wetland lossimages created by Penland et al. (2000), and representative study
rk locations of oil and gas wells within a 4 km radius of the study areas (from SONRIS,
C.A. Wilson, M.A. Allison / Estuarine, Coastal and Shelf Science 80 (2008) 483–494 485
sites were identified for bay-fronting, Gulf-fronting, and interiorpond areas that had experienced marsh loss between 1932 and1999 surveys. Grids w1 km� 500 m were established in each studysite, and a minimum of three grids were occupied in each of thethree-study areas (Fig. 1). The placement of multiple sampling gridsat each site was designed in order to capture a variety of shorelineorientations to predominant wave approach and fetch. Within eachgrid, elevation data of the marsh surface and adjacent subaqueousplatform (mudflat) were established, vibracores were acquiredfrom the marsh shoreline and along a central transect at twodistances offshore, and bathymetry was determined for thesubmerged grid areas (Fig. 1).
3.1. Topographic and bathymetric surveys
Elevation data were collected with an electronic theodolite andstadia rod (�1 cm vertically). Marsh elevations were taken w15 mapart alongshore, and shore-normal approximately every meterfrom the marsh edge to 5 m offshore, then every 5 m to thelocation of the outer vibracore site. Elevations are reported hererelative to the marsh edge elevation (measured by transit data),which were converted to NAVD 88 using as a calibration point theelevation of the water surface compared with local tide gaugerecords (USGS station 073802512 for Barataria Bay, USGS station07374526 for Breton Sound, and NOAA station 8760922 for DNWRsites, Fig. 1).
Bathymetric maps were made with a 200 kHz Odom shallowwater fathometer. Transects were made in both alongshore andshore-normal directions (5–10 per grid) at speeds of <0.5 m/s.Bayfloor elevation measurements were converted to NAVD 88 andthen established relative to the marsh edge using the approachmentioned above. Plotting NAVD-corrected fathometer and coreelevation data with stadia rod transit data revealed noticeableoffsets in the best-fit shoreface elevation profile across some ofthe sites. This offset was restricted to sites >10 km from the tidegauge and likely resulted from a time lag in progression of thediurnal tide in the estuaries. Offsets were corrected by equalizingthe elevation determined for a core location using the transitmeasurements and that determined using water depth and tidegauge data.
3.2. Sedimentology and geotechnical analyses
Stratigraphy to w2 m below the sediment surface was analyzedand correlated using 7.5 cm diameter vibracores (41 total, 14 marshand 27 offshore; locations in Table A Supplemental Material). Top ofcore elevation was determined relative to NAVD 88 and then con-verted to elevation relative to the marsh edge. The possibility of coreshortening and rodding was assessed by measuring inside andoutside the barrel prior to extraction, and the elevations of stratalboundaries were corrected assuming uniform downcore compactionthrough the entire core.
Cores were cut lengthwise, described for stratigraphy, andX-rayed at 40-cm overlapping intervals using a portable X-ray unitoperating at 66 kV/50 mA. Shear strength measurements wereobtained at 10 cm depth intervals in one core half using a hand-held shear vane tester (range 0–200 kPa). The other half of the corewas subsampled at 2 cm intervals every 5 cm to a depth of 100 cm,and 2 cm every 10 cm thereafter. Samples were then frozen forstorage prior to further analysis. Marsh and offshore core samplealiquots were freeze-dried and reweighed to determine watercontent and porosity. For the 13 marsh cores and a few offshorecores, a separate sample aliquot of w10 g of freeze-dried sedimentwas homogenized with a mortar and pestle, and weight loss onignition was performed (550 �C in a muffle furnace for 14 h) to yieldpercent organic matter as a function of depth.
3.3. Radiochemical analyses
Activities of 137Cs and 210Pb with depth were measured usinga low-energy germanium g-spectrometer to examine the timingand rates of sediment accumulation on the marsh surface and in thebay environments offshore. Both coaxial planar and well-typedetectors were used dependent on sample size (all samples froma single core were counted by one detector type). Freeze-driedsediment samples were ground, packed in either 50 mm diameterPetri dishes (planar geometry) or 60 mm long test tubes (wellgeometry), sealed to prevent 222Rn loss, and allowed to ingrow tosecular equilibrium for 210Pb for at least three weeks. Samples werethen counted for 1–2 days. Activities were calculated following themethods outlined in Allison et al. (2007). A best-fit linear regressionof the natural log of excess 210Pb (210Pbxs) with depth below anysurface mixed layer of homogenous activity was used to determinethe sediment accumulation for the past w100 years (Nittrouer andSternberg, 1981). 137Cs (T½¼ 30 year) is the product of fallout fromatmospheric testing of thermonuclear weapons that began in 1954.Two time markers for 137Cs with depth were utilized: the depth ofmaximum 137Cs penetration (1954) and the depth of maximum137Cs activity in the northern hemisphere (1963 according toChmura and Kosters, 1994).
4. Results
4.1. Eroding marsh shoreline and shoreface topography
Topography of the subaerial marsh platforms is fairly uniform,averaging� 12 cm relative to the marsh edge. The sites with themost and the least alongshore variability were Site LBB 2 (þ0.08 to�0.49 m relative to the marsh edge) and Site IBS 3 (þ0.11 andþ0.0 m relative to the marsh edge), but for the most part the marshplatforms are relatively flat. The shore-normal profiles of the firstsite measured, LBB 1, display a vertical scarp 30–50 cm high, andthe offshore mudflat is concave in shape with slopes graduallydecreasing to 1.0–1.5 m depth below the marsh surface, reachinga horizontal platform that extends at least 300 m from the marshedge. Almost all of the sites in all three-study areas display thissame trend (see Fig. 2 for LBB 1, UBB 1, IBS 4, and a compilation of allstudy areas). Exceptions to this trend are sites UBB 3, IBS 1, andDNWR 2. UBB 3 and IBS 1 are adjacent to marsh channels or bayousin Barataria Bay and Breton Sound (Wilkinson Bayou and Baker’sBay, respectively), and DNWR 2 displays a unique profile witha horizontal subaqueous marsh surface and offshore platform 1.0 min depth. Fathometer measurements across multiple shore-normaltransects have little spatial variability (typically �10 cm) and theoffshore bathymetry is relatively uniform.
4.2. Core stratigraphy and sedimentary properties
Core lengths of the 41 vibracores ranged between 1.80 and2.72 m. Cores collected offshore of the subaerial marsh shorelinewere taken in water depths ranging from 0.81 to 1.82 m. Table Ain Supplemental Material summarizes the field data observationsthat were collected at each coring location. Distinct sedimentaryfacies were identifiable basin-wide in the vibracores and havebeen documented throughout southeast Louisiana estuarinebasins (e.g., Coleman and Gagliano, 1964; Kosters, 1989; Mortonet al., 2003). These facies are referred to hereafter as: 1) Organic-rich Mud and Peat, 2) Massive Mud, 3) Interbedded Sand and Mud,and 4) Shelly Bay-bottom Mud (see Table 1 for facies descrip-tions). Throughout all of the study sites these facies are arrangedin a similar stratigraphic order.
At the Barataria Bay and Breton Sound sites, marsh cores typi-cally contained Interbedded Sand and Mud extending to the base of

Fig. 2. Offshore elevation profiles measured for Lower Barataria Bay (LBB) Site 1, Upper Barataria Bay (UBB) Site 1, and Inner Breton Sound (IBS) Site 4 (top). Diagram of generalizedoffshore profile found in most study grids and the equilibrium profile produced by all fathometer and transit measurements (middle), and two notable exceptions to the elevationtrends, IBS 1 and DNWR 2 (bottom).
Table 1Sedimentary facies descriptions, properties, and basins found for this study
Facies Description Generalthickness(cm)
Shearstrengthranges (kPa)
Porosityranges (%)
Organicmatterranges(%)
Basins found
Organic-richMudand Peat
Brown to gray organic-rich, usually fine-grained sediment(clay t silty clay) matrix permeated by roots (spartina sp.) thatgrades into a more compact, organic-rich brown to black peat.
150–200 0–18avg.¼ 3.5
53.1–94.2avg.¼ 83.6
3.4–82.4avg.¼ 31.8
BBBSDNWR
Massive Mud Olive gray mud with little organic content and little root traces.Massive appearance suggests extensive bioturbation.
20–100 0–12avg.¼ 3
51.1–87.8avg.¼ 69.7
4.3–22avg.¼10
BBBSDNWR
InterbeddedSandand Mud
Horizontal mud and sand beds and laminations. Mud deposits areusuallyolive to greenish gray, although some may be yellowishto tan in color. The sand (typically fine to silty sand) is also usuallyolive to greenish gray. No roots or organic content is present,although shells of either estuarineclams (Rangia sp.) or oysters (Crassostrea sp.) may be present.
50–>200 0–24avg.¼ 38.8
51.3–63.4avg.¼ 56.2
2.4–8.0avg.¼ 4.6
BBBSDNWR
ShellyBay-bottomMud
Typically composed of silty mud to muddy sand and frequentlyhas shell fragments (Rangia sp.) throughout. Colors vary betweenlight gray, brownish gray, olive gray, dark greenish gray, and oliveblack. Displays an erosional basal surface with underlying sedimentsof the Organic-rich Mud and Peat facies.
10–150 0–14avg.¼ 3.2
53.9–80avg.¼ 67.9
N/A BaratariaBay BretonSound
C.A. Wilson, M.A. Allison / Estuarine, Coastal and Shelf Science 80 (2008) 483–494486
C.A. Wilson, M.A. Allison / Estuarine, Coastal and Shelf Science 80 (2008) 483–494 487
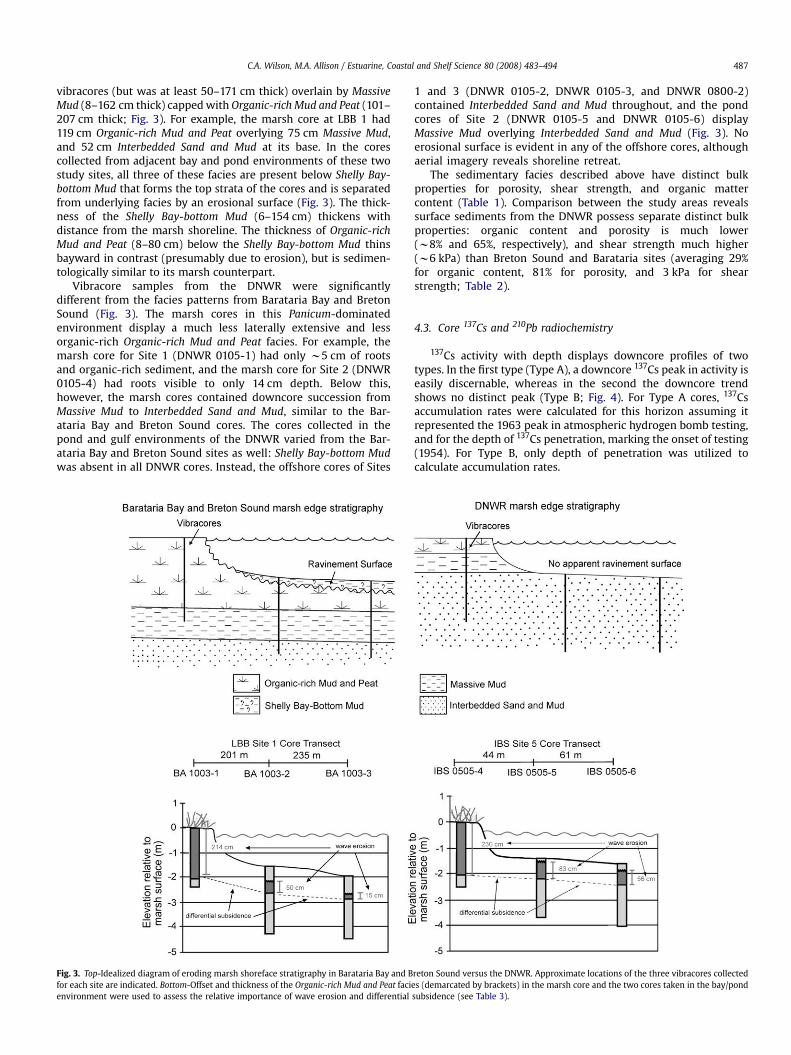
vibracores (but was at least 50–171 cm thick) overlain by MassiveMud (8–162 cm thick) capped with Organic-rich Mud and Peat (101–207 cm thick; Fig. 3). For example, the marsh core at LBB 1 had119 cm Organic-rich Mud and Peat overlying 75 cm Massive Mud,and 52 cm Interbedded Sand and Mud at its base. In the corescollected from adjacent bay and pond environments of these twostudy sites, all three of these facies are present below Shelly Bay-bottom Mud that forms the top strata of the cores and is separatedfrom underlying facies by an erosional surface (Fig. 3). The thick-ness of the Shelly Bay-bottom Mud (6–154 cm) thickens withdistance from the marsh shoreline. The thickness of Organic-richMud and Peat (8–80 cm) below the Shelly Bay-bottom Mud thinsbayward in contrast (presumably due to erosion), but is sedimen-tologically similar to its marsh counterpart.
Vibracore samples from the DNWR were significantlydifferent from the facies patterns from Barataria Bay and BretonSound (Fig. 3). The marsh cores in this Panicum-dominatedenvironment display a much less laterally extensive and lessorganic-rich Organic-rich Mud and Peat facies. For example, themarsh core for Site 1 (DNWR 0105-1) had only w5 cm of rootsand organic-rich sediment, and the marsh core for Site 2 (DNWR0105-4) had roots visible to only 14 cm depth. Below this,however, the marsh cores contained downcore succession fromMassive Mud to Interbedded Sand and Mud, similar to the Bar-ataria Bay and Breton Sound cores. The cores collected in thepond and gulf environments of the DNWR varied from the Bar-ataria Bay and Breton Sound sites as well: Shelly Bay-bottom Mudwas absent in all DNWR cores. Instead, the offshore cores of Sites
Fig. 3. Top-Idealized diagram of eroding marsh shoreface stratigraphy in Barataria Bay and Bfor each site are indicated. Bottom-Offset and thickness of the Organic-rich Mud and Peat facienvironment were used to assess the relative importance of wave erosion and differential
1 and 3 (DNWR 0105-2, DNWR 0105-3, and DNWR 0800-2)contained Interbedded Sand and Mud throughout, and the pondcores of Site 2 (DNWR 0105-5 and DNWR 0105-6) displayMassive Mud overlying Interbedded Sand and Mud (Fig. 3). Noerosional surface is evident in any of the offshore cores, althoughaerial imagery reveals shoreline retreat.
The sedimentary facies described above have distinct bulkproperties for porosity, shear strength, and organic mattercontent (Table 1). Comparison between the study areas revealssurface sediments from the DNWR possess separate distinct bulkproperties: organic content and porosity is much lower(w8% and 65%, respectively), and shear strength much higher(w6 kPa) than Breton Sound and Barataria sites (averaging 29%for organic content, 81% for porosity, and 3 kPa for shearstrength; Table 2).
4.3. Core 137Cs and 210Pb radiochemistry
137Cs activity with depth displays downcore profiles of twotypes. In the first type (Type A), a downcore 137Cs peak in activity iseasily discernable, whereas in the second the downcore trendshows no distinct peak (Type B; Fig. 4). For Type A cores, 137Csaccumulation rates were calculated for this horizon assuming itrepresented the 1963 peak in atmospheric hydrogen bomb testing,and for the depth of 137Cs penetration, marking the onset of testing(1954). For Type B, only depth of penetration was utilized tocalculate accumulation rates.
reton Sound versus the DNWR. Approximate locations of the three vibracores collectedes (demarcated by brackets) in the marsh core and the two cores taken in the bay/pondsubsidence (see Table 3).

Table 2Comparison of sedimentary properties between cores taken in the marsh and bay environments in Lower Barataria Bay (LBB), Upper Barataria Bay (UBB), Inner Breton Sound(IBS), and Deltas National Wildlife Refuge (DNWR) study areas
LLB UBB IBS DNWR
Marsh coresPorosity (%) 51–91
avg.¼ 7755–94avg.¼ 83
51–94avg.¼ 83
51–84avg.¼ 67
Shear strength (kPa) – 0–10avg.¼ 2
0–18avg.¼ 4
0–18avg.¼ 5.6
Organic matter (%) 2–76avg.¼ 22
5–74avg.¼ 34
2–82avg.¼ 31
2–22avg.¼ 8
Bay coresShear strength (kPa) – 0–16
avg.¼ 4.50–24
avg.¼ 5.40–22
avg.¼ 7.3
C.A. Wilson, M.A. Allison / Estuarine, Coastal and Shelf Science 80 (2008) 483–494488
Three patterns were observed in the downcore profiles of210Pb activity (Fig. 4). In Type I, 210Pbxs activity decreases loga-rithmically with depth below a shallow (5–10 cm) surface mixedlayer, indicating a relatively steady-state accumulation rate (coreBA 0604-3 for UBB 3, Fig. 4). In Type II, 210Pbxs activity eitherdecreases to zero immediately below the 0–2 cm interval or is notpresent at all, indicating a sediment age greater than the
Fig. 4. Downcore trends in 137Cs (top) and 210Pb (bottom) activity for t
threshold of 210Pb dating (w100 year; core BA 1003-3 for LBB 1,Fig. 4). In Type III, downcore activities vary randomly with depthsuch that no accumulation rate can be determined (core DNWR-1for DNWR 1, Fig. 4). These sites show major variations in porosityand X-ray density with depth, suggesting layers of distinctlydifferent grain size which impacts 210Pb activity because it ispredominantly adsorbed onto clays.
he two Cesium and three Lead profile types described in the text.

C.A. Wilson, M.A. Allison / Estuarine, Coastal and Shelf Science 80 (2008) 483–494 489
Barataria Bay and Breton Sound marshes had similar accumu-lation rates with some site-specific variability, averaging0.67� 0.49 cm yr�1 and 0.80� 0.17 cm yr�1, respectively (Table B inSupplemental Material summarizes the 137Cs and 210Pb accumula-tion rates for the cores). DNWR marshes had the highest accumu-lation rates, with both marsh sites >1.59 cm yr�1 (for many DNWRcores rates are reported as minima, as 137Cs activity was found atthe base of the vibracore). Marsh sites adjacent to large, open-waterbodies generally have higher accumulation rates than marsh sitesadjacent to small and relatively enclosed water bodies. Forexample, LBB Site 1 has an average marsh accumulation rate that is150% higher than LBB Site 2.1 (1.38 cm yr�1 compared to0.54 cm yr�1). Barataria Bay and Breton Sound bay or pond coreshad lower average accumulation rates than DNWR gulf and pondcores (1.41�0.26 cm yr�1 in the DNWR versus 0.48� 0.16 cm yr�1
and 0.59� 0.50 cm yr�1 in Barataria Bay and Breton Sound,respectively).
5. Discussion
5.1. Development of sedimentary facies
5.1.1. Barataria Bay and Breton SoundThe stratigraphic sequences observed in the Barataria Bay and
Breton Sound cores are characteristic of Holocene progradationaldeposits described previously for the Louisiana lower deltaic plain(Coleman and Gagliano, 1964; Kosters, 1989; Morton et al., 2003).The upward-fining sediment sequence is indicative of a transitionfrom 1) delta-front deposits, to 2) the shoaling of an interdis-tributary/interlobe waterbody, to 3) the establishment ofa subaerial marsh. The Interbedded Sand and Mud facies found in thedeepest sections of the core samples represents delta-frontdeposits when the area was dominated by direct riverine sedimentinput (see Fig. 3). The Massive Mud facies overlying the InterbeddedSand and Mud characterizes deposition in a quiescent, shoalinginterdistributary or interlobe waterbody once active lobe deposi-tion bypassed the area. Finally, the Organic-rich Mud and Peat faciesrepresents subaerial marsh development once elevations aggradedsufficiently to support plant colonization.
Studies have shown that the organic-rich mud and peat in bothBarataria Bay and Breton Sound are horizontally continuous overshort (<1 km) distances (Coleman and Gagliano, 1964; Kosters,1989; Dharmasri, 1998). Assuming lateral continuity of peat hori-zons, the peat deposits found in cores taken in the offshore fieldsites were once continuous with those in the marsh cores, which issupported by shoreline edge retreat observed in aerial imagery(Penland et al., 2000). Because a sharp contact, interpreted as anerosional ravinement surface, exists between these deposits andthe overlying Shelly Bay-bottom Mud in the offshore cores and themarsh shoreline displays an erosional vertical scarp, the strata ofthe offshore bay environments in these areas are interpreted toform as a result of wave incision coupled with possible RSLR. Thesubaerial marsh deposits (Organic-rich Mud and Peat to w1.5 mdepth) are progressively removed by erosion with continuedretreat of the marsh edge. However, rapid RSLR creates accom-modation space and incision rates decrease toward the base of theshoreface, allowing a transition to the accumulation of estuarinebay-bottom sediments (Shelly Bay-bottom Mud) on top of theremaining Organic-rich Mud and Peat facies as predicted by Cole-man and Gagliano (1964) (Fig. 3).
5.1.2. The DNWRThe study grids from the DNWR are located in the Cubit’s Gap
subdelta complex of the Balize delta (Fig. 1). This subdelta formedas a crevasse splay from an 1862 man-made break in the MississippiRiver that prograded northeast onto the continental shelf during
the next several decades (Wells et al., 1982). The freshwaterPanicum marsh is presently receiving freshwater and sedimentfrom the Mississippi River, indicated by rapid sediment accumu-lation rates of 1.3 to >1.59 cm yr�1 in the marsh, gulf, and pondsettings (Supplemental Material Table B). In spite of these highrates, all the Balize lobe subdeltas such as Cubit’s Gap haveundergone significant wetland deterioration in recent decades dueto interior ponding (Penland et al., 2000), compounded recently(2005) by Hurricane Katrina wave erosion of Gulf-facing marshedges (Barras, 2006). The presence of thin Organic-rich Mud andPeat facies in the marsh cores (w5–15 cm of roots, no true peat)supports an earlier study (Kosters, 1989) which noted that organiclithofacies of interdistributary bays in the Balize delta would be thinand poorly developed due to the daily flushing from the river. Thesedimentology in all of the DNWR cores is dominated instead bythe Interbedded Sand and Mud from active riverine deposition andcrevasse splay deposits (delta-front facies).
For Gulf-fronting DNWR sites, lateral retreat of the marshsurface from wave incision would completely remove anyOrganic-rich Mud and Peat. Indeed, the three offshore cores forthese sites lack this facies and solely contain Interbedded Sand andMud (Fig. 3). For Interior Pond sites, the similar lack of Organic-rich Mud and Peat in the pond cores indicates that any organicmaterial from the marsh that occupied the area prior to 1932 hasbeen eroded and flushed, either from river discharge as predictedby Kosters (1989) or possibly from tidal scour since the marshsurface is subaqueous. Instead, a Massive Mud facies is present atthe surface of the pond cores that 137Cs and 210Pb radiochemistryindicates is the result of recent riverine delivery and depositionin the quiescent pond environments (accumulation rate of1.41�0.26 cm yr�1).
5.2. Relative importance of erosion and subsidence on shorefaceevolution
Assuming laterally continuous peat deposits, elevation andthickness differences of the Organic-rich Mud and Peat facies in thethree shore-normal cores at each site can be used to estimaterelative importance of post-depositional subsidence and waveerosion at each site. For each Breton Sound and Barataria grid, theamount of surficial erosion in the shoreface profile was determinedby comparing the thickness of the Organic-rich Mud and Peatbetween the marsh site and each of the two offshore cores,assuming originally equal thickness across the few 100 meters oftheir offset (Fig. 3). Differential subsidence was determined bycomparing the depth to the upper contact of the Massive Mud faciesin each of the cores and assuming that the onset of marsh depo-sition was relatively synchronous over these spatial scales (Fig. 3).This approach has been used in other studies (e.g., Morton et al.,2003). It should be noted, however, that the amount of surficialerosion is a maximum since organic and mineral accumulationcontinued at the marsh coring site even after submergence anderosion of the adjacent marsh platform, resulting in a thickerorganic facies deposit in the marsh core than would be originallypresent in the offshore cores. In addition, we use the terminologydifferential subsidence because general regional subsidence ispresumably affecting the entire region (Penland and Ramsey, 1990;Meckel et al., 2006) but differential subsidence encompasses thespatial variability of this apparent subsidence within the studygrids. This could be a result of different underlying geology at depthor hydrocarbon withdrawal.
The combined processes of wave erosion and differentialsubsidence result in submerged marsh platform elevation defla-tion. In Barataria Bay and Breton Sound, wave erosion accounted forthe majority of the deflation (63% and 72% of the elevation loss,respectively), while differential subsidence accounted for the
C.A. Wilson, M.A. Allison / Estuarine, Coastal and Shelf Science 80 (2008) 483–494490
remainder (37% in Barataria and 28% in Breton Sound; see Table 3).In the DNWR, where a well-defined organic-rich marsh layer isabsent, the above analyses are not possible. However, wave incisionof w50 cm can be inferred at one site, DNWR 3, by matching 210Pbexponential decay profiles in the marsh core and offshore core. Atanother site (DNWR 2, an interior pond site) the Panicum cane wassubmerged on a platform of w1 m depth that extended >300 minto the pond (Fig. 2). The uniformity of this profile suggests a moreinvariant regional subsidence, possibly reflecting that thecompaction of the thick Holocene sediments (w150 m) in thisyoung subdelta of the Mississippi River is the main factor in themarsh loss at this site.
Results of this study relative to work in Madison Bay, Louisiana byMorton et al. (2003) indicate that wave erosion is a larger factorcausing marsh platform deflation (Table 3). The greater exposure inBarataria Bay and Breton Sound study areas likely influences thisbecause Madison Bay is more inland and protected. Differentialsubsidence in the Madison Bay area was across a larger lateraldistances (several km’s) and was ascribed to locally acceleratedsubsidence above a former oil and gas field (Morton et al., 2006). Thepresent results suggest that significantdifferential subsidence (>50–100 cm) appears to have taken place regionally in the lower delta atsites, proximal as well as distal to hydrocarbon wells (see Fig. 1).
Caution must be exercised with the results of the subsidenceanalysis in this study. If the peat was not horizontally continuous,the offset observed between the marsh core and offshore coun-terparts could be explained by differences in elevation of thesurface of marsh growth, and hence, in the timing of onset of peatdeposition. To eliminate this possibility, radiocarbon dates of thebasal peats would be required. The presence of an original slopeacross which the basal marsh deposits form would also increase theapparent differential subsidence in the above calculations. Anotherconcern is that core compaction may not be uniformly partitionedover the different facies through which the core is passing. Vari-ability in the shear strength suggests that susceptibility tocompaction may be non-uniform, with weaker intervals such as theOrganic-rich Mud and Peat undergoing the majority of compaction.However, little has been done to date to ascertain the compactionvariability of different stratigraphic layers in the Mississippi deltaicplain, and it was not the focus of this study.
5.3. A conceptual model of marsh shoreline evolutionin South Louisiana
Traditionally, the concave-upward shape of sandy, ocean-fronting shorefaces have been described in terms of an equilibriumprofile. The profile is steepest at the shoreline and has a progres-sively decreasing offshore slope (Komar, 1998). Only recently has
Table 3Calculated subsidence and erosion at various sites using core transects as illustratedin Fig. 3
Site Subsidence (cm) Erosion (cm)
LBB 1 97 (33%) 199 (67%)LBB 2.1 132 (38%) 211 (62%)LBB 2.2 117 (34%) 227 (48%)UBB 1 201 (52%) 183 (74%)UBB 2 60 (26%) 168 (75%)IBS 2 74 (25%) 220 (75%)IBS 3 95 (32%) 198 (68%)IBS 4 71 (41%) 101 (59%)IBS 5 28 (14%) 174 (86%)Barataria Bay average 121 199Breton Sound average 67 173Madison Baya range and average 53–92 Avg¼ 69 2–34 Avg¼ 25
a From Morton et al. (2003).
the concept of a shoreface equilibrium profile been applied tomuddy coasts, and studies suggest that a mudflat profile is concave-upward where it is erosional (Kirby, 2000; Woodroffe, 2003).
For sandy shorefaces, Bruun (1962) outlined the effect of RSLRon beaches that had attained an equilibrium profile. RSLR wouldcause erosion and lateral retreat of the upper beach, and thissediment would be transported to the adjacent seafloor, causingaggradation. Ultimately, the profile of equilibrium slopes wouldbe preserved, having merely migrated upward and landward, andsediment eroded from the shoreface would account for offshoredeposition (Komar, 1998). Kirby (2000) introduced a similarconcept for mudshores (the Mehby Rule), however it postulatedthat the majority of material eroded from the marsh edge is lostoffshore as opposed to deposited on adjacent mudflats. In addi-tion, Kirby (2000) formulated a mudshore stability model thatidentified Louisiana shorelines as generally stable and accreting.Our results clearly contrast Kirby’s findings: an erosional profile ofequilibrium is ubiquitous on marsh shorelines in southeasternLouisiana, particularly in Barataria Bay and Breton Sound (Fig. 2).Additionally, significant material eroded from the retreat of theseshorelines is likely a component of the proximal Shelly Bay-bottomMud deposit.
Statistically, the marsh shoreface profiles in Louisiana fit anexponential decay regression curve with the equation:
y ¼ �1:5þ 1:2eð�0:05xÞ (1)
The r2 value of this regression was 0.75 (see Fig. 2). Because thispattern is apparent throughout Barataria Bay and Breton Sound,this suggests that variations in sediment strength have a minorinfluence on the nature of the eventual offshore elevation profile.Consequently, wave climate is presumably the primary factordetermining the general shape of the profile. Overall, Barataria Bayand Breton Sound share a similar wave climate (typically waveheights of 0.07–0.8 m, although tropical cyclones can cause wavesin excess of 2 m in height with their associated storm surge;Georgiou et al., 2005; Stone et al., 2005). More significant differ-ences appear to be related to fetch and exposure to predominantdirections of wave approach. Sites in shallow and protected interiorbays with little fetch (e.g., Sites IBS 4, UBB 2) display a muchshallower offshore profile than sites that occupy larger and deeperbays with greater fetch and exposure to wave attack (Sites UBB 1,LBB 1; Figs. 1 and 2).
According to Bruun (1962), maintaining a shoreface profile ofequilibrium with RSLR requires that sediment eroded from themarsh edge is deposited in the adjacent open-water environment(Komar, 1998). This process, along with the lateral retreat of thisprofile upward and landward, explains the stratigraphy in the studygrids at Barataria Bay and Breton Sound. As the profile translatesupward and landward with RSLR, thicker peat deposits arepreserved closer to the present marsh shoreline whereas, in theouter profile, the erosionally thinned peat layer is capped by theShelly Bay-bottom Mud facies that thickens offshore (Fig. 3).However, the latter unit is likely not only sourced from erosion ofadjacent marsh fringe. Material from the Mississippi River could betransported into the bays (e.g., through Barataria Pass in BaratariaBay), particularly during major storm events.
We propose a conceptual model to describe fringing marshshoreline evolution with respect to the translation of an equilib-rium profile in southeast Louisiana (Fig. 5). Studies have shown thatwhile marshes can maintain elevation if accumulation rates areequal to or higher than the rate of RSLR (e.g., Baumann et al., 1984;Rybczyk and Cahoon, 2002), they are still subject to erosion andretreat from wave attack, particularly if the nearshore sedimenta-tion rate is less than the rate of RSLR (Schwimmer and Pizzuto,2000). As subaerial marshes become submerged due to RSLR,
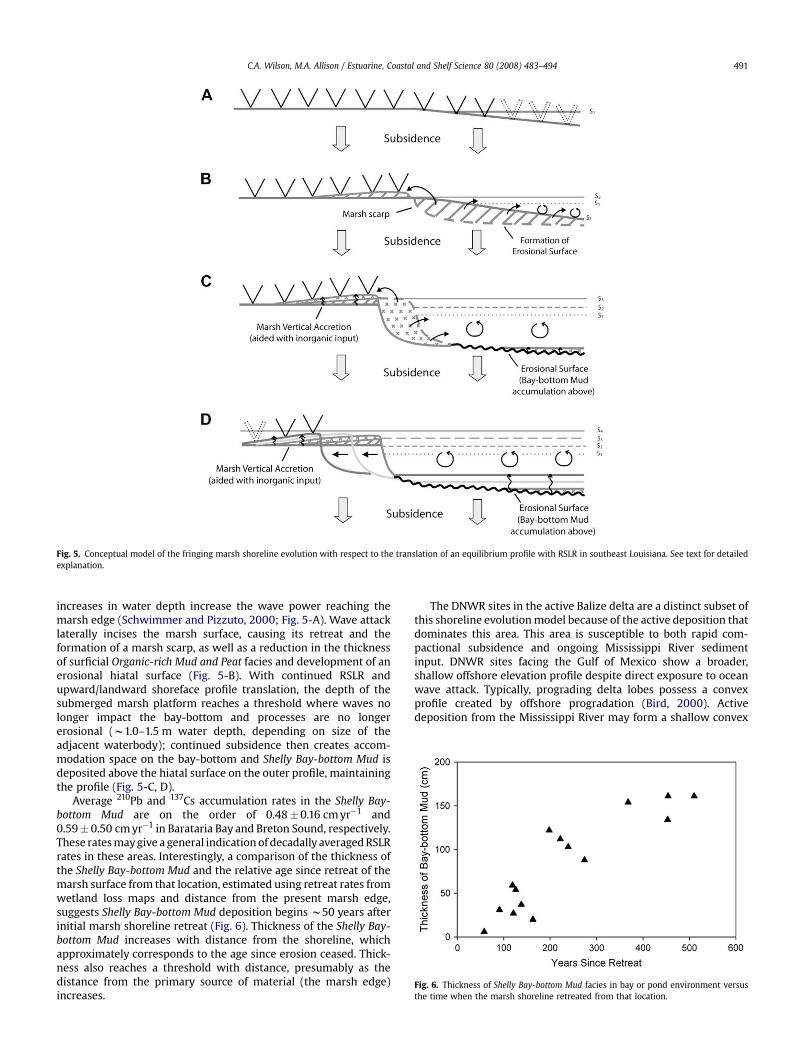
Fig. 5. Conceptual model of the fringing marsh shoreline evolution with respect to the translation of an equilibrium profile with RSLR in southeast Louisiana. See text for detailedexplanation.
Fig. 6. Thickness of Shelly Bay-bottom Mud facies in bay or pond environment versusthe time when the marsh shoreline retreated from that location.
C.A. Wilson, M.A. Allison / Estuarine, Coastal and Shelf Science 80 (2008) 483–494 491
increases in water depth increase the wave power reaching themarsh edge (Schwimmer and Pizzuto, 2000; Fig. 5-A). Wave attacklaterally incises the marsh surface, causing its retreat and theformation of a marsh scarp, as well as a reduction in the thicknessof surficial Organic-rich Mud and Peat facies and development of anerosional hiatal surface (Fig. 5-B). With continued RSLR andupward/landward shoreface profile translation, the depth of thesubmerged marsh platform reaches a threshold where waves nolonger impact the bay-bottom and processes are no longererosional (w1.0–1.5 m water depth, depending on size of theadjacent waterbody); continued subsidence then creates accom-modation space on the bay-bottom and Shelly Bay-bottom Mud isdeposited above the hiatal surface on the outer profile, maintainingthe profile (Fig. 5-C, D).
Average 210Pb and 137Cs accumulation rates in the Shelly Bay-bottom Mud are on the order of 0.48� 0.16 cm yr�1 and0.59� 0.50 cm yr�1 in Barataria Bay and Breton Sound, respectively.These rates may give a general indication of decadally averaged RSLRrates in these areas. Interestingly, a comparison of the thickness ofthe Shelly Bay-bottom Mud and the relative age since retreat of themarsh surface from that location, estimated using retreat rates fromwetland loss maps and distance from the present marsh edge,suggests Shelly Bay-bottom Mud deposition begins w50 years afterinitial marsh shoreline retreat (Fig. 6). Thickness of the Shelly Bay-bottom Mud increases with distance from the shoreline, whichapproximately corresponds to the age since erosion ceased. Thick-ness also reaches a threshold with distance, presumably as thedistance from the primary source of material (the marsh edge)increases.
The DNWR sites in the active Balize delta are a distinct subset ofthis shoreline evolution model because of the active deposition thatdominates this area. This area is susceptible to both rapid com-pactional subsidence and ongoing Mississippi River sedimentinput. DNWR sites facing the Gulf of Mexico show a broader,shallow offshore elevation profile despite direct exposure to oceanwave attack. Typically, prograding delta lobes possess a convexprofile created by offshore progradation (Bird, 2000). Activedeposition from the Mississippi River may form a shallow convex

C.A. Wilson, M.A. Allison / Estuarine, Coastal and Shelf Science 80 (2008) 483–494492
profile in which large waves are buffered at the outer edge of theplatform where water depths increase rapidly to open shelf depths,and smaller waves translating across the nearshore platform formthe shallow concave profile closer to the marsh edge. With lateralretreat of the marsh surface (as caused by Hurricane Katrina in2005; Barras, 2006), sediment supply from the Mississippi Riverresults in deposition of Interbedded Sand and Mud in this delta-frontsetting, rather than the Shelly Bay-bottom Mud found in the moreprotected, Barataria Bay and Breton Sound sites. DNWR sites inmore protected inner ponds, such as DNWR Site 2, are in the earlystages of the conceptual model (stage A of Fig. 5) where RSLR iscausing submergence of the marsh surface. Unlike Spartina, maid-encane is able to continue colonization of the inundated pond untila threshold depth is reached (50–100 cm according to David, 1999).Since the ponds are so small in size (w1 km2), wave action isminimal. Instead, patches of Panicum that deteriorate are flushedfrom the ponds from high river discharge (Kosters, 1989) or tidaland storm surge scour. Rapid RSLR creates accommodation spaceboth on the marsh ‘‘surface’’, now subaqueous, and the adjacentponds enable a Massive Mud deposition because the coarse river-derived supply has bypassed the area.
5.4. Comparison to other eroding marsh shorefaces
In Rehoboth Bay, Delaware, Chrzastowski (1986) and Schwim-mer and Pizzuto (2000) describe a similar process to southeastLouisiana marshes where wave erosion of the transgressing marshshoreline removes a portion of organic-rich sediment and peat(50 cm–1 m thick) from former subaerial marsh, creating anerosional surface overlain with w50 cm to >1 m lagoonal muddeposits that thicken away from the shoreline. In addition, Tully(2004) found that peat (w1.6 m thick) eroded from marsh shore-lines in Pamlico Sound, North Carolina, is a significant source oforganic-rich mud deposited in the estuary. This process of peatincision with marsh shoreline retreat and subsequent deposition oferoded material into adjacent water bodies is therefore not uniqueto Louisiana and our conceptual model may have application inother locations. The magnitude of vertical incision is likelycontrolled by the rates of RSLR and the wave power affecting themarsh shoreline. Higher RSLR more rapidly deepens the water
Table 4Top-Estimated sediment yields in study areas calculated from transect data and equilibriumusing equilibrium profile model. See text for explanation
Location Shoreline retreatratea (myr�1)
Maximum depthof profile (m)
RSLR(myr�
LBB 1 1.59 1.45 0.0111LBB 2.1 1.05 1.42 0.0111LBB 2.2 0.83 1.50 0.0111UBB 1 1.28 1.84 0.0111UBB 2 0.84 1.52 0.0111UBB 3 1.02 N/Ac 0.0111IBS 1 0.76 N/Ac 0.010IBS 2 0.74 1.72 0.010IBS 3 0.66 1.55 0.010IBS 4 0 1.12 0.010IBS 5 0.76 1.60 0.010
Basin 1932–1990Land loss area(m2)
1932–1990Sediment yield(m3)
Organic materialyield (MT)
Barataria Bay 58.3� 105 80.2� 105 4.2� 105
Breton Sound 62.2� 105 88.9� 105 5.3� 105
a Shoreline retreat rates determined from wetland loss maps by Penland et al. (2000).b RSLR rate from Penland and Ramsey (1990).c Sites UBB 3 and IBS 1 were omitted because they occupied a marsh channel or bayou.d Marsh accumulation rates were not calculated for these sites, so they were not includ
bodies and affects the wave power translated to the marsh surface.A rapid rate of RSLR is observed in Louisiana (locally as high as 1–2 cm yr�1; Penland and Ramsey, 1990; Shinkle and Dokka, 2004;Tornqvist and Gonzales, 2006) compared to Delaware and NorthCarolina on the Atlantic Coast (w0.3 cm yr�1; Schwimmer, 2001),however the wave power in Pamlico Sound is presumably largergiven the larger fetch of the waterbody.
5.5. Sediment yields to Barataria Bay and Breton Sound
Utilizing the shore-normal elevation profiles measured for eachof the study grids (Fig. 2), the volume of sediment yield with retreatof the marsh shoreline can be calculated. According to Sorensen(2006), the volume (V) of sediment (organicþ inorganic) that iseroded in a retreating profile can be determined by the equation:
V ¼ h ðdxÞ ðdyÞ (2)
where dy is horizontal/lateral displacement of the profile, h isheight where processes are no longer erosional, and dx is shorelinelength. Average shoreline retreat rates for the study grids (dy) weredetermined using 1932–1990 wetland loss maps (Penland et al.,2000). The annual sediment yield from profile translation along1 m of shoreline is listed for each of the study grids in Table 4 andassumes no subsidence. Values range from 1.02 to 2.35 m3 per m ofshoreline length per year. RSLR, however, decreases the elevation ofthe profile and reduces sediment loss by erosion. Taking this intoconsideration, the actual sediment yield can be calculated by sub-tracting out the proportion of sediment that would be sequesteredfrom erosion each year by RSLR, and also taking into considerationthe amount of sediment accumulated each year on the marshsurface (Table 4). With present uncertainties about subsidencerates in the region only first-order estimates of RSLR are possible.RSLR rates are taken from Penland and Ramsey (1990) for eachbasin, and accumulation rates from this study are used. Notsurprisingly, the sites with the highest sediment yield (LBB 1 andUBB 1, Table 4) are also the most exposed to wave attack and displaythe deepest offshore elevation profiles. The sediment yields esti-mated from the translation of the equilibrium profile (from Eq. (1)varied on average �5% from that calculated from the measuredelevation profiles (Table 4), therefore the profile of equilibrium can
profile. Bottom-Sediment yields in Barataria Bay and Breton Sound from 1932–1990
rateb
1)Annual sediment yield(m3 per m of shoreline)
Equilibrium profile annualsediment yield (m3 per m ofshoreline)
2.32 2.391.49 1.571.24d 1.24d
2.35 1.921.27 1.26N/Ac N/Ac
4 N/Ac N/Ac
4 1.27d 1.11d
4 1.02d 0.99d
4 0.00 0.004 1.22 1.15
Inorganic materialyield (MT)
Annual organicmaterial yield (MT)
Annual in organicmaterial yield (MT)
24.7� 105 7.3� 104 42.5� 104
25.9� 105 9.1� 104 44.7� 104
ed in corrected annual sediment yields.
C.A. Wilson, M.A. Allison / Estuarine, Coastal and Shelf Science 80 (2008) 483–494 493
be very useful in estimating sediment yield in areas experiencingsimilar lateral retreat of the marsh surface.
On average, marsh retreat annually in Barataria Bay and BretonSound yields w1.7 m3 and w1.2 m3 of sediment per m of shorelinelength, respectively. These volumes of annual sediment yield frommarsh retreat are comparable to those determined by Tully (2004)for eroding marshes in Pamlico Sound, North Carolina. In that study,w1.6 m of peat was eroded at 1.32 m yr�1, corresponding to2.11 m3 yr�1 per m of shoreline length. It was determined that2.16�106 m3 yr�1 is liberated by marsh erosion into Pamlico Sound.
Taking into account porosity and average percent organiccontent for the marsh cores and specific gravity conversions fororganic and inorganic sediment (organic¼ 1.14 g cm�3,inorganic¼ 2.61 g cm�3; Callaway et al., 1997), an estimate of themass of organic and inorganic sediment yield annually can becalculated for these estuaries per m shoreline length. For BaratariaBay, this corresponds to an annual yield of 0.09 MT (MT¼metricton) of organic material and 0.53 MT of inorganic material per mshoreline. The annual organic and inorganic yields to Breton Soundare slightly less: 0.07 MT of organic material and 0.35 MT of inor-ganic material per m shoreline.
The total yield of organic and inorganic sediments to the Bar-ataria and Breton Sound basins from 1932 to 1990 can be estimatedusing the equilibrium profile and wetland loss maps of Penlandet al. (2000). This approach includes: 1) multiplying the area of bay-fronting shoreline loss by the depth of incision of the equilibriumprofile (1.5 m) to obtain a volume from profile translation, 2) sub-tracting the volume of sediment that would be sequestered fromRSLR in this time period (RSLR rates from Penland and Ramsey(1990), 3) adding the volume of sediment which would haveaccumulated on the marsh surface during this time period, and 4)using porosity, organic content, and specific gravity measurementsas explained previously to derive the organic and mineral massfraction yielded (Table 4). Using a POC/POM conversion of 0.5(Mitsch and Gosselink, 2000), these values equal an annual POCyield of approximately 3.7�104 MT for Barataria Bay and4.6�104 MT for Breton Sound. By comparison, estimates of annualPOC flux from the Mississippi River into the Gulf of Mexico are9.3�105 MT (Bianchi et al., 2007). Caution must be exercised withthese results because assuming a constant accumulation rate at thecore location is an oversimplification. Numerous studies indicatethat local variations in marsh accretion rates are associated withproximity to tidal streams, bayous, or other water bodies. Marshesproximal to the water bodies receive more sediment and havehigher accretion rates than those farther inland (Delaune et al.,1978; Hatton et al., 1983; Baumann et al., 1984; Childers and Day,1990). In addition, we assumed a constant lateral retreat rate of themarsh shoreline, but erosion and lateral retreat of the marshsurface may be episodic, driven by inter-annual winter stormpatterns and individual cyclonic storms. Regardless, this studyhighlights a largely ignored but potentially significant labile carbonsource to coastal areas.
5.6. Implications
Eroding marshes in Louisiana are ideal for studying marshshoreline morphology with sea-level rise, and may serve asa proxy for other marshes in the face of anticipated acceleratedsea-level rise (Church and White, 2006; Jevrejeva et al., 2008).Therefore, our conceptual model may have application to predictmarsh shoreface evolution on a global scale. Of regional impor-tance, these estimates of annual sediment yields in Barataria Bayand Breton Sound from marsh shoreface erosion may havea profound effect locally: this sediment is a source of recycledmaterial for marsh or bay-bottom accretion that counterssubmergence driven by RSLR (Hatton et al., 1983; Baumann et al.,
1984; Gagliano and Wicker, 1989; Reed, 1989; Turner et al.,2006). Conversely, continued erosion of submerged marsh plat-forms is an unrecognized source of elevation loss in coastalLouisiana, requiring additional sediment volume in future marshcreation efforts. Furthermore, the increase in tidal prisms fromdeterioration of bay-fronting barrier systems can be expected toenhance wave attack on marsh shorelines (FitzGerald et al.,2003), and more material can be eroded from the marsh shore-face. It is also likely that the quantities of sediment and organicmatter released impacts biogeochemical cycles in the estuariesand, potentially, on the adjacent continental shelf given the largecombined meteorological and astronomical tidal flushing of thebasins. The organic-rich material potentially fuels local bay andcoastal productivity, and contributes to coastal hypoxia on theLouisiana shelf by supplying significant volumes of labile marshPOC to the continental shelf (Kendall and Silva, 2005; Bianchiet al., 2007). Critical future research is needed to determine whatproportion of this material is sequestered in these estuariesversus transported offshore, and how this carbon flux impactsglobal carbon budgets.
6. Conclusions
The results of the present study indicate the following aboutmarsh edge evolution in southeastern Louisiana:
1) Erosional removal of the surficial marsh Organic-rich Mud andPeat facies in Barataria Bay, Breton Sound, and the DNWR takesplace at the marsh edge and continues subaqueously withshoreline retreat to a depth of w1–1.5 m. In Barataria Bay andBreton Sound this forms an erosional ravinement surface ontop of these former subaerial marsh deposits. In the DNWR theorganic lithofacies are thin and poorly developed and the entirefacies is removed with lateral retreat of the marsh, or withtidal/riverine flushing.
2) RSLR creates accommodation space in these bay, pond, andGulf-fronting areas, contributing to the formation of a ShellyBay-bottom Mud facies deposited on top of the erodedsubaqueous marsh platform in Barataria Bay and Breton Sound.Sediments from the Mississippi River dominate the subaqueousdeposits in the DNWR.
3) Elevation profiles indicate that shore-normal slopes approxi-mate an exponential profile of equilibrium in both BaratariaBay and Breton Sound. Profiles are concave in shape, witha marsh scarp (w50 cm) at the edge of the marsh platform,a steep slope to w50 m offshore, and then decreasing slopesthat are asymptotic with the bay-bottom at w1.5 m waterdepth (>300 m offshore).
4) A conceptual model similar to those presented for sandyshorefaces describes the geomorphology of eroding marshedges in southeastern Louisiana. This model takes into accountthe lateral and vertical translation of an equilibrium profilecreated by RSLR and wave erosion, and the onlap of estuarinesediments (Shelly Bay-bottom Mud) within accommodationspace created in the open-water environments.
5) Translation of the profile of equilibrium has been used toestimate erosional sediment yields to estuarine areas of Bar-ataria Bay and Breton Sound. It was determined that1.7 m3 yr�1 (0.53 MT of inorganic sediment and 0.09 MT oforganic matter) is currently provided per m shoreline length inBarataria Bay, and 1.2 m3 yr�1 (0.35 MT of inorganic sedimentand 0.07 MT of organic matter) is yielded per m shorelinelength in Breton Sound. From 1932 to 1990, an annual POC yieldof approximately 3.7�104 MT and 4.6�104 MT was calculatedfor Barataria Bay and Breton Sound, respectively.

C.A. Wilson, M.A. Allison / Estuarine, Coastal and Shelf Science 80 (2008) 483–494494
Acknowledgments
We would like to thank Sam Lebœuf and Chuck Guidry ofLUMCON for R/V Silver Bullet vessel use and assistance, the late SheaPenland and his lab for provision of wetland loss maps, Dan Duncanfor assistance with the radiochemistry, numerous field assistants,and reviewers for extremely useful comments that helped in thecompletion of this project. Funding was provided by the LouisianaCoastal Enhancement through Science and Technology (CREST)program.
Appendix A. Supplementary data
Supplementary data associated with this article can be found inthe online version, at doi:10.1016/j.ecss.2008.09.004.
References
Allison, M.A., Bianchi, T.S., McKee, B.A., Sampere, T.P., 2007. Carbon burial on river-dominated continental shelves: impact of historical changes in sedimentloading adjacent to the Mississippi River. Geophysical Research Letters 34 (1)L01606.
Barras, J., Beville, S., Britsch, D., Hartley, S., Hawes, S., Johnston, J., Kemp, P., Kinler,Q., Martucci, A., Porthouse, J., Reed, D., Roy, K., Sapkota., S., Suhayda, J., 2003.Historical and projected coastal Louisiana land changes: 1978–2050. U.S.Geological Survey Open File Report 03-334, 39 p. (revised January 2004).
Barras, J., 2006. Land area change in coastal Louisiana after the 2005 hurricanesdaseries of three maps. U.S. Geological Survey Open File Report 06–1274.
Baumann, R., Day, J., Miller, C., 1984. Mississippi deltaic wetland survival: sedi-mentation versus coastal submergence. Science 224 (4653), 1093–1095.
Bianchi, T., Wysocki, L., Stewart, M., Filley, T., McGee, B., 2007. Temporal variabilityin terrestrially-derived sources of particulate organic carbon in the lowerMississippi River and its upper tributaries. Geochimica et Cosmochimica Acta71 (18), 4425–4437.
Bird, E., 2000. Coastal Geomorphology, an Introduction. John Wiley & Sons Ltd.,West Sussex, England, 322 pp.
Bruun, P., 1962. Sea-level rise as a cause of shore erosion. Journal of Waterways andHarbors Division, American Society of Civil Engineers 88, 117–130.
Cahoon, D., Reed, D., 1995. Relationships among marsh surface topography,hydroperiod, and soil accretion in a deteriorating Louisiana salt marsh. Journalof Coastal Research 11 (2), 357–369.
Callaway, J., Delaune, R., Patrick Jr., W., 1997. Sediment accretion rates from four coastalwetlands along the Gulf of Mexico. Journal of Coastal Research 13 (1), 181–191.
Childers, D., Day, J., 1990. Marsh–water column interactions in two Louisianaestuaries. I. Sediment dynamics. Estuaries 13 (4), 393–403.
Chrzastowski, M., 1986. Stratigraphy and geologic history of a Holocene lagoon:Rehoboth Bay and Indian River Bay, Delaware. Ph.D. thesis, University ofDelaware, Delaware (unpublished).
Chmura, G., Kosters, E., 1994. Storm deposition and patterns of 137Cs accumulationin Marsh Sediments of the Mississippi Delta Plain. Estuarine Coastal and ShelfScience 39, 33–44.
Church, J.A., White, N.J., 2006. A 20th century acceleration in global sea-level rise.Geophysical Research Letters 33 LO1602.
Coleman, J., Gagliano, S., 1964. Cyclic sedimentation in the Mississippi River deltaicplain. Transactions-Gulf Coast Association of Geological Societies 14, 67–80.
Coleman, J., Roberts, H., Stone, G., 1998. The Mississippi River delta; an overview.Journal of Coastal Research 14 (3), 698–716.
David, P., 1999. Response of exotics to restored hydroperiod at Dupuis Reserve,Florida. Restoration Ecology 7 (4), 407–410.
Day, J., Britsch, L., Hawes, S., Shaffer, G., Reed, D., Cahoon, D., 2000. Pattern andprocess of land loss in the Mississippi delta: a spatial and temporal analysis ofwetland habitat change. Estuaries 23 (4), 425–438.
Delaune, R., Patrick Jr., W., Buresh, R., 1978. Sedimentation rates determined by137Cs dating in a rapidly accreting salt marsh. Nature 275, 532–533.
Delaune, R., Baumann, R., Gosselink, J., 1983. Relationships among vertical accretion,coastal submergence, and erosion in a Louisiana gulf coast marsh. Journal ofSedimentary Petrology 53 (1), 147–157.
Dharmasri, L., 1998. Spatial variability of coastal organic soil characteristics. Ph.D.dissertation, Louisiana State University, Baton Rouge, 250 p.
FitzGerald, D., Kulp, M., Penland, S., 2003. Tidal prism changes within Barataria Bayand its effects on sedimentation patterns and barrier shoreline stability.Transactions-Gulf Coast Association of Geological Societies 53, 243–251.
Flocks, J., FitzGerald, D., Kulp, M., Ferina, N., Dreher, C., Kindinger, J., 2006. Highresolution stratigraphy of a Mississippi subdelta-lobe progradation in the Bar-ataria Bight, north-central Gulf of Mexico. Journal of Sedimentary Research 76(3–4), 429–443.
Frazier, D., 1967. Recent deltaic deposits of the Mississippi River: their developmentand chronology. Transactions-Gulf Coast Association of Geological Societies 17,287–315.
Gagliano, S., Meyer-Arendt, K., Wicker, K., 1981. Land loss in the Mississippi Riverdelta plain. Transactions-Gulf Coast Association of Geological Sciences 31,295–300.
Gagliano, S., Wicker, K., 1989. Processes of wetland erosion in the Mississippi Riverdeltaic plain. In: Duffy, W.G., Clark, D. (Eds.), Marsh Management in CoastalLouisiana: Effects and Issues - Proceedings of a Symposium. U.S. Fish andWildlife Service and Louisiana Department of Natural Resources, pp. 28–48, U.S.Fish Wildlife Service Biological Report, 22, 378 p.
Gagliano, S., 2003. Neo-tectonic framework of southeast Louisiana and applicationsto coastal restoration. Transactions-Gulf Coast Association of Geological Socie-ties 53, 262–276.
Georgiou, I., FitzGerald, D., Stone, G., 2005. The impact of physical processes alongthe Louisiana coast. Journal of Coastal Research 44, 72–89 (special edition).
Hatton, R., Delaune, R., Patrick, W., 1983. Sedimentation, accretion, and subsidencein marshes of Barataria Basin, Louisiana. Limnology & Oceanography 28 (3),494–502.
Jevrejeva, S., Moore, J.C., Grinsted, A., Woodworth, P.L., 2008. Recent global sea levelacceleration started over 200 years ago? Geophysical Research Letters 35L08715.
Kendall, C., Silva, S., 2005. Potential contribution of particulate organic matter in theMississippi River to hypoxia in the Gulf of Mexico. Eos, Transactions, AmericanGeophysical Union 86 (18).
Kirby, R., 2000. Practical implications of tidal flat shape. Continental Shelf Research20, 1061–1077.
Komar, P., 1998. Beach Processes and Sedimentation, second ed. Prentice-Hall, NewJersey, 544 pp.
Kosters, E., 1989. Organic-clastic facies relationships and chronostratigraphy of theBarataria interlobe basin, Mississippi delta plain. Journal of SedimentaryPetrology 59 (1), 98–113.
Meckel, T., Brink, U., Williams, S., 2006. Current subsidence rates due to thecompaction of Holocene sediments in southern Louisiana. GeophysicalResearch Letters 33 L11403.
Mitsch, W.J., Gosselink, J.G., 2000. Wetlands, third ed. John Wiley and Sons, NewYork.
Morton, R., Tiling, G., Ferina, N., 2003. Causes of hotspot wetland loss in theMississippi delta plain. Environmental Geosciences 10, 71–80.
Morton, R., Bernier, J., Barras, J., 2006. Evidence of regional subsidence and asso-ciated interior wetland loss induced by hydrocarbon production, Gulf coastregion, USA. Environmental Geology 50, 261–274.
Nittrouer, C., Sternberg, R., 1981. The formation of sedimentary strata in anallochthonous shelf environment: the Washington continental shelf. MarineGeology 42 (1–4), 201–232.
Nyman, J., Delaune, R., Patrick Jr., W., 1990. Wetland soil formation in the rapidlysubsiding Mississippi deltaic plain: mineral and organic matter relationships.Estuarine Coastal and Shelf Science 3 (1), 57–69.
Penland, S., Ramsey, K., 1990. Relative sea-level rise in Louisiana and the Gulf ofMexico: 1908–1988. Journal of Coastal Research 6 (2), 323–342.
Penland, S., Wayne, L., Britsch, L., Williams, S., Beall, A., Butterworth, V., 2000.Geomorphic Classification of Coastal Land Loss between 1932 and 1990 in theMississippi River Delta Plain, Southeastern Louisiana. U.S. Geological SurveyOpen File Report 00–417.
Reed, D., 1989. Patterns of sediment deposition in subsiding coastal salt marshes,Terrebonne Bay, Louisiana: the role of winter storms. Estuaries 12 (4),222–227.
Roberts, H., 1997. Dynamic changes of the Holocene Mississippi River delta plain:the delta cycle. Journal of Coastal Research 13 (3), 605–627.
Rybczyk, J., Cahoon, D., 2002. Estimating the potential for submergence for twowetlands in the Mississippi River delta. Estuaries 25 (5), 985–998.
Schwimmer, R., Pizzuto, J., 2000. A model for the evolution of marsh shorelines.Journal of Sedimentary Research 70 (5), 1026–1035.
Schwimmer, R., 2001. Rates and processes of marsh shoreline erosion in RehobothBay, Delaware. Journal of Coastal Research 17 (3), 672–683.
Shinkle, K., Dokka, R., 2004. Rates of vertical displacement at benchmarks in thelower Mississippi Valley and the Northern Gulf Coast, NOAA Technical Report,NOS/NGS 50, 135 p.
Sorensen, R., 2006. Basic Coastal Engineering. Springer Science and Business Media,Inc, New York, 324 pp.
Stone, G., Zhang, X., Sheremet, A., 2005. The role of barrier islands, muddy shelf andreefs in mitigating the wave field along coastal Louisiana. Journal of CoastalResearch 44, 40–55 (special edition).
Tornqvist, T., Kidder, T., Autin, W., vander Borg, K., de Jong, A.F.M., Klerks, C.,Snijders, E., Storms, J., van Dam, R., Wiemann, M., 1996. A revised chronology forMississippi River subdeltas. Science 273, 1693–1696.
Tornqvist, T., Gonzalez, J., 2006. Coastal Louisiana in crisis: subsidence or sea levelrise? Eos 87 (45), 493–498.
Tully, L., 2004. Evaluation of sediment dynamics using geochemical tracers in thePamlico Sound estuarine system, North Carolina. M.S. thesis, East CarolinaUniversity, Greenville, 180 p.
Turner, R., Baustian, J., Swenson, E., Spicer, J., 2006. Wetland sedimentation fromhurricanes Katrina and Rita. Science 314, 449–452.
Wells, J., Chinburg, S., Coleman, J., 1982. Development of the Atchafalaya Riverdeltas: generic analysis. Louisiana State University, Coastal Studies Institute,Center for Wetland Resources, Baton Rouge. Prepared for U.S. Army Corps ofEngineers, Waterways Experiment Station, Vicksburg, Miss. 91 pp.
Woodroffe, C., 2003. Coasts: Form, Process and Evolution. Press Syndicate of theUniversity of Cambridge, Cambridge, UK, 623 pp.