ethekwini industrial land study and development strategy - durban€¦ · ethekwini industrial land...
TRANSCRIPT

Jeffery J. McCarthy Ph.D.
Development Research
and Strategy
eThekwini Industrial Land Study and Land Development Strategy
Stakeholder Workshop
14 November 2013
1

Purpose of the Project
Project context
Employment in eThekwini is dominated by manufacturing
But the comparative advantage could be slipping – general view that there are shortages of suitable land, land costs are relatively high and developers are experiencing very long search times for land
Need to develop an understanding of the current industrial land supply and demand
Develop a shared vision of the management of industrial land to support economic growth and job creation
Develop a Municipal Industrial Land Strategy that is
Complex and diverse in terms of its sub-components, and thus flexible in terms of reactions to demand-side needs (for example the needs of airfreight oriented logistical firms are different to secondary manufacturers, heavy goods oriented firms, etc.); and
Pro-active in intent and not necessarily constrained to existing notions of land supply, currently designated industrial areas and currently conceived planning and regulatory frameworks
2

Project Outcomes
Industrial Land Inventory / Information System: a GIS based tool that will facilitate the management of data and provide an on-going management tool.
Industrial Land Study: a report setting out a review of existing policy, land management systems, the current situation and future possibilities for industrial land development using the output from the land inventory and information system.
Industrial Land Strategy: a report that sets out clear policy recommendations and strategies for taking industrial development in the eThekwini Municipality to a new level.
Implementation Framework: a report that will include concrete recommendations, interventions and actions emanating from the strategy developed.
Monitoring Plan based on the GIS database management tool established.
3

Methodology and ProgrammePOLICY /INSTITUTIONS INTEGRATION SUPPLY & DEMAND SIDE
INCEPTION Task 0: Project Setup and Inception
Inception Meeting 1: 7 June 2013
REVIEW Task 1: Review National Provincial and Local
policy contexts
Task 2 : Review institutional models
Steering Committee Meeting 2: 4 Sept ‘13
Task 3: Industrial Demand Assessment
Task 4: Industrial Supply Assessment & GIS
Tools
Task 5: Review and workshop demand and supply side assessments interventionsSteering Committee 3: 23 October 2013
Task 6: Implement studies of alternative areas or methods
Wider Reference Forum 1: week of 14 November 2013
STRATEGY Task 7: Provide the Framework for Strategy
Principles and Concepts
Task 8: Develop a strategy applying concepts to
implementation
Task 9: Institutional model recommendations
Steering Committee 4: week of 17 Feb 2014
Task 10: Detailed implementation plans
Wider Reference Forum 2: Week of 24 March 2014
CLOSEOUT Task 11 Close Out Report
Close out Meeting: week of 21 April 2014 4

Work Completed Brief Policy Review
Review of International and local examples
Locational theory update
Development of GIS database
Existing land zoned for industrial development
Extent of existing development: 2012 aerial photography – industrial building footprints
Extent of growth since 2002: 2002 and 2007 aerial photography – industrial building footprints to establish take-up rates
Vacant land in 2012 that is zoned for industrial development
Valuation Roll analysis
SAPOA vacancy survey
SAPOA Comparison of Municipal Costs Study
GGP analysis
Comparison of Land prices and Land Rentals
Rates Comparison
Interviews – Russell Curtis, Frikkie Brooks, Andrew Layman, Glen Robbins, Miles Taylor and Mel Clark
5

2012 GIS Database
6

Purpose of Todays Workshop
Introduce the project to a wider stakeholder group
Briefly present some of the research findings on the supply and demand for industrial land in eThekwini
Discuss the challenges to industrial land supply in eThekwini
Workshop a framework for the development of a Municipal Industrial Land Strategy
Welcome 08h30
Outline of the purpose of the project, methodology, programme and work
completed to date
08h45
Presentation of information on Supply and Demand trends 09h00
Tea 10h00
Workshop on opportunities and constraints to industrial land development;
developing a framework for a strategy for industrial land development
10h30
Lunch 12h30
Concluding remarks and way forward 13h00
7

Research Findings

Policy Review
Highly developed industrial policy framework at a National, Provincial and Local level.
Many institutions involved in incentivising and promoting industrial development.
Forward Planning Projects have identified over 3,500 ha of land for industrial development and 2,500 ha for business parks
But still eThekwini is reportedly facing the challenge of limited land supply and high prices
Where to from here?
9
Source: The Mercury

The Industrial Land Market
Recent Locational theory – industry still wants to locate in metropolitan areas and land price is a key factor in choice of locality. Minimum time is also a key locational choice factor now rather than cost and profit - access.
This Study is therefore about the availability, appropriate location and price of industrial land.
Normally price is determined by interactions of the market forces of demand and supply;
but in the case of land this is often impeded (land is immovable; regulated by government; requires public services) which results in dis-equilibrium in the market.
Signs of this are evident in the slow growth of rentals compared to high land prices which suggest a dis-equilibrium in the market which is unlikely to be sustainable.
10

eThekwini Land Prices and RentalsDURBAN ZONED INDUSTRIAL: Building Rentals vs Land Values (SAIV 2006; Knight Frank 2013)
Location Suburb
Rentals per m22500 - 500m²
Land ValuesR/m²
Rental Growth Growth in Land Values
May-06 Aug-13Rental
GrowthMay-06 Aug-13
Growth in Land Values
By Area Overall By Area Overall
South Mobeni /Jacobs R25-26 R32-40 44%R450 -R600 R 1 250 136%
46%
50%
127%
191%
Yard R8-10 R10-15 50%
Prospecton <15 years old R25-27 R40-45 58%R450 -R600 R1200-1350 127%Prospecton - B Grade
(Old)R25-26 R35-40 49%
Southgate R28-30 R35-40 29% R500-R600 R 1 200 118%
Central Umbilo (Congela/Sydney) R18-28 R32-40 50% R450-R550 R 1 500 200%
40% 192%Umgeni Road R 25 R35-45 30%
R 550 R 1 700 209%
Stamfordhill Rd R 600 R 1 600 167%
North Springfield Park R 30 R45-55 58% R 400 R1600-1800 325%
40% 243%
Sea Cow Lake R 22 R 40 60% R 300 R1,500 400%
North Coast Road R 30 R35-40 25% R450-550 R1,650 230%
Briardene R30-35 R45-55 54% R650+R1,800 -
2,000192%
Glen Anil/Avoca R30-35 R45-50 31% R450-550 R 1 450 190%
Riverhorse Estate R48-55 R55-65 22% R 750 R1,800-2,200 147%
Phoenix R20-30 R30-35 31% R 350 R1,100 214%
Inner West New Germany R22-28 R 35 40% R 450 R1000-1500 178%
52% 179%Westmead
R25-30 R45-50 55% R 500 R1250-1500 175%Mahogany Ridge
Marianhill Industrial 25 R35-45 60% R 350 1000 185%
Outlying Verulam/Canelands R25-30 R40-45 55% R 400 R850-1250 163%
75% 215%Tongaat R 20 R30-32 55% R 300 R550-850 233%
Cato Ridge R15-20 R35-40 114% R 150 R450-600 250%11

Location of Existing Supply
Total eThekwini Area: 229,193 ha
Total amount of Zoned Industrial Land (or Zones that allow Industrial Development as a free entry or Special Consent Use) 2012: 9,000 ha
30% in Central area and South Durban Basin; 18% each in the North and South; 13% Inner West and 22% in Outer West
Of the zoned land 6,900 ha is zoned Noxious, General, General Business, Light and Service Industry
The balance is Zoned Extractive or a Special or Mixed Use Zone that allows some industrial development (2,100 ha)
Total number of industrial sites 2012: 26,000
12

Emergence of Spatial Structure of Industrial Land Initially development was focused on the port where older warehouses and
factories can still be found and are now a focus of redevelopment.
1960’s to 1980’s – Manufacturing became concentrated in the Southern Industrial Basin and Pinetown/New Germany areas. In all these instances the Councils were very proactive in creating these areas.
Late 1980’s – areas were full; perceptions of crime and grime were growing – desire for secure, high quality estates and freeway visibility for warehousing – Umgeni Park area and Riverhorse Valley – again the Council was active in the development of these areas.
Recent attention has been in the Outer West and the North around the new airport, although proximity to the port remains a key factor, hence the back-of-port redevelopment plans.
13

Vacant Land and New Opportunities Vacancy Rates in existing buildings - average of about 2.5% (SAPOA sample surveys). But relatively low.
Brownfield redevelopment opportunities
The total amount of vacant land within zones that are solely for industrial use i.e. Noxious, General, Light and Service Industry in 2012 is: 1,370 ha
Identified New Industrial Opportunities (not zoned or serviced) as per the Spatial Development Plans prepared by the Framework Planning Unit of the Development Planning Branch: Gross 3,500 ha and a further 2,500 ha of Business Park area = 6,000 ha (Gross) which, assuming about 40% is developable = 2,400 ha of developable land
Also - Yet to be identified opportunities
eThekwini
Planning Regions
Total Vacant Zoned
Industrial Land (Ha)
North North 180
South South 120
Central South Durban Basin 40
City and Port 50
Inner West 280
Outer West Outer West 700
TOTAL 1 370
14

New Opportunities – Planned
15
RegionCurrent
Industrial
Areas
Planned
Industrial
Areas
Existing
Business
Park and
Related
Planned
Business
Park
Total
Existing
Total
PlannedComment
North 1 166 2 510 0 2 035 1 166 4 545Major new growth
area
South 1 139 92 0 88 1 139 180redevelopment
role
South Durban
Basin773 0 0 0 773 0
Redevelopment
opportunity
City and Port 1 954 0 80 320 2 033 320
Suitable for
redevelopment
with new port and
freight route
Inner West 1 288 0 0 0 1 288 0Consolidate the
current area
Outer West 608 909 0 115 608 1 023 New growth Area
Overall Total
(Ha)6 929 3 511 80 2 558 7 008 6 069

Take-up of Industrial Land Total ground floor area of industrial buildings (in zoned and non-industrial area) as digitised from aerial
photography
2012: 1,821 ha
2008 : 1,716 ha
2002: 1,509 ha
Increase in ground floor area of industrial buildings (in zoned and non-industrial area) between 2008 and 2012: 105 ha which equates to 21 ha of building footprint per annum over 5 years (15% growth in the north and 18% growth in Outer West and 10% growth in South)
Assuming an Coverage of 60% this equates to a take –up of 35 ha per annum between 2008 and 2012
Increase in ground floor area of industrial buildings (in zoned and non-industrial area) between 2002 and 2007: 207 ha which equates to 41 ha of building footprint per annum over 5 years
Assuming an Coverage of 60% this equates to a take-up of 68 ha per annum between 2002 and 2008
Completed Building Plans –
2006: 38 ha; 2007: 74 ha; 2008: 56 ha; 2009: 59 ha; 2010: 23 ha; 2011: 44 ha; 2012: 46 ha
Significant slow down in take up
KZN GGP has slowed in the past 2 years = 2% p.a. for manufacturing – but fluctuations
Urban Econ report 2012(IHS Global Insight) – growth in transport, storage and communications (including warehouses) and contraction in manufacturing
16

Challenge
Significant amount of vacant land and new industrial opportunities (2,400 ha @ a take up rate of 25 ha p.a. = supply for 96 years and @ 80 ha p.a. = supply for 30 years).
Challenge
Is it correctly located to meet demand trends and
How the Municipality should shift from planning to implementation and release of land
17

A Start – Key Development Projects Identified
18
Challenges to the release of Industrial land SAPOA Survey - Property Development Comparison of
Municipal Services Costs 2013: eThekwini is not overly expensive in aggregate terms – property rates (second highest of metros), vacant land rates and planning application fees were high.
Sensitivity to land pricing – industrial costs and revenue considerations; Different price and locational sensitivities in sub-markets
Price – prevailing price twice that of Gauteng
180 degree land form and topography
Project Management challenges within Projects
Political and Business culture – delays in approvals; bureaucratic red tape, non-response on queries about customs/import duties and working with government staff
China and India competitive costs
Competition from other Municipalities – KwaDukuza, Umsunduzi and Richards Bay
Primary constraint – Lack of funding for Bulk Infrastructure - Need for new models to fund infrastructure
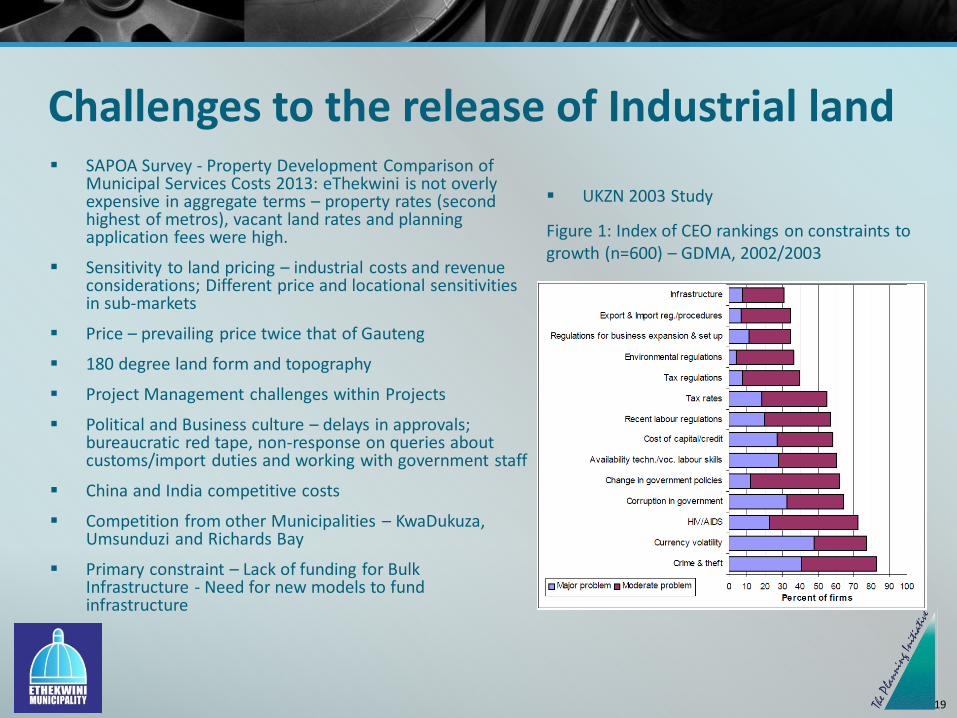
UKZN 2003 Study
Figure 1: Index of CEO rankings on constraints to growth (n=600) – GDMA, 2002/2003
19

SAPOA: - Gross Value Added (Property Development Comparison of Municipal Services Costs 2013)
20

Questions of Clarity
21

Challenges – results of cards
Investor confidence and global economic forces/ macro-economic conditions 7
Rates and financial incentives 9
Relationship between developers and municipalities 16
Red tape/ regulations/ delays/ pro-active planning/ approach – planning too reactive/ bold decisions 25
EIAs/ Act 70 of 1970 8
Lack of para-statals and infrastructure costs 11
Bulk infrastructure costs / limited municipal finance / developers contributions 18
Land price – too high; in the hands of a few; reducing 14
Project management and marketing 6

Broad Interventions
Improve Council and Roleplayers Interactions through a development forum;
Create incentives for development through infrastructure financing, PPPs, one stop shop;
Review approval processes and frameworks including building local municipal capacity and monitor+review processes;
23