ethereum emissions: a bottom-up estimate
TRANSCRIPT
Ethereum Emissions: A Bottom-up Estimate
Kyle [email protected]
Monday 6th December, 2021
Abstract
The Ethereum ecosystem is maintained by a dis-tributed global network of computers that currentlyrequire massive amounts of computational power.Previous work on estimating the energy use and emis-sions of the Ethereum network has relied on top-downeconomic analysis and rough estimates of hardwareefficiency and emissions factors. In this work we pro-vide a bottom-up analysis that works from hashrateto an energy usage estimate, and from mining loca-tions to an emissions factor estimate, and combinesthese for an overall emissions estimate.
Keywords: Ethereum; cryptocurrency; energy;emissions
1 Introduction
According to the 2018 Intergovernmental Panel onClimate Change[27], staying below 1.5°C warmingwill require “deep emissions reductions” in order tomitigate the worst effects of climate change. Thisdemands an accounting of the emissions associatedwith all human activities, including in the world ofdistributed computation and finance.
The Ethereum cryptocurrency currently uses aproof-of-work (PoW) consensus algorithm.1 PoWmeans that lists of new transactions (called a block)are added to the ledger (a database called theblockchain) when a computer (called the worker)guesses a large effectively-random number correctly(a process called hashing or mining). This processresults in a reward for the computer operator whoguesses the correct number (called the miner). PoWrequires miners compete to maximize their guessingspeed (hashrate) and rewards, while minimizing theirexpenses. If their hardware is too slow, or electricityis too expensive, mining will not be profitable.
Here we analyze the energy use and emissions ofthe Ethereum network using a bottom-up approach.Starting with an estimate of the total hashrate, we
1Ethereum is scheduled to phase out PoW in 2022.
add an estimate of hashing efficiency, and add over-head energy usage to estimate the total energy pro-duction required. Then we estimate mining locationsand emissions factors in each location to produce anemissions factor estimate for the entire network. Fi-nally we combine the energy use and emissions esti-mates to produce a total emissions estimate.
This study only estimates the historical energy useand emissions of the Ethereum network. We do notconsider other environmental, social, or governanceissues[68] such as electronics waste, overall fairnessof cryptocurrencies, or effects of financial deregula-tion. We do not compare the energy use or emissionsof Ethereum to other distributed computing systemsor financial networks, we do not make predict futureenergy use or emissions, and we do not attempt toaccount for emissions responsibility.
All code and data for reproducing this work is avail-able at https://github.com/kylemcdonald/ethe
reum-energy
2 Previous Work
Ethereum is the second largest cryptocurrency af-ter Bitcoin by market capitalization—the total valueof all coins is $500B, compared to $1,130B for Bit-coin. Ethereum is also the third most active cryp-tocurrency by volume—Ethereum has a daily tradevolume of $18B, with Bitcoin second at $41B andTether (USDT) first at $77B.[8] Bitcoin is also aPoW currency, and Ethereum energy estimates of-ten draw their methodology from Bitcoin energy es-timates. Energy estimates are either “top-down”,working from the price of the currency to energybased on the economics of mining; or they are“bottom-up”, working from hardware efficiency es-timates and network hashrate measurements to totalenergy. Koomey[30] compares six top-down Bitcoinenergy estimates, with Cambridge Bitcoin Electric-ity Consumption Index (CBECI)[1] an important re-cent bottom-up addition. Koomey finds that differ-ent studies take different approaches to the topic, and
1
arX
iv:2
112.
0123
8v2
[cs
.CY
] 3
Dec
202
1

makes recommendations for best practices that haveguided this study. Recommendations include:
• Report estimates to the day
• Provide complete and accurate information
• Avoid guesses and rough estimates about under-lying data
• Collect measured data in the field for both com-ponents and systems
• Build from the bottom up
• Properly address location variations in siting ofmining facilities
• Explicitly and completely assess uncertainties
• Avoid extrapolating into the future
In addition to analyzing Bitcoin, two of the stud-ies that Koomey reviews also analyze Ethereum:de Vries[67] (Digiconomist) and Krause and Tolay-mat[31]. Besides these Bitcoin studies, two otherstudies analyze Ethereum: Gallersdorfer et al.[16],and Marro and Donno[38].
De Vries provides an estimated and minimum en-ergy estimate. They use the same methodology astheir Bitcoin study, assuming that 60% of miningrevenue is spent on mining costs. De Vries also usesan emissions factor for Bitcoin to estimate Ethereumemissions. Gallersdorfer et al. makes an energy es-timate but not an emissions estimate. Krause andTolaymat provide an estimate for energy, and an up-per and lower bound for emissions based on repre-sentative high and low emissions factors. Marro andDonno use a hashrate-weighted average of emissionsfactors across three regions, and also estimate the im-pact of hardware manufacturing on emissions.
These four studies (de Vries, Gallersdorfer etal., Krause and Tolaymat, Marro and Donno) arein rough agreement with each other, finding thatEthereum power during 2018 varied between 1 GWto 2.5 GW, around 10 TW h to 20 TW h for the year.Emissions estimates span a larger range, between5 ktCO2 per day and 30 ktCO2 per day in 2018. Be-cause these studies work top-down from miner rev-enue to estimating investment in electricity and hard-ware, they are limited by assumptions about howminers make business decisions.
In this study we try to minimize assumptions bybuilding bottom-up with measurements and observa-tions where possible.
3 Energy
Ethereum energy use can be estimated over a timeperiod based on the equation:
hashrate × overhw × overdc × lossgridefficiencyhashing × efficiencypsu
(1)
• hashrate is the average number of guessesper second from all workers. Typicallymegahashes/second (MH/s) for a single worker,or terahashes/second (TH/s) for the whole net-work.
• overhw is the hardware overhead for CPU, net-work card, and other components. This is a mul-tiplier greater than or equal to 1.
• overdc is the datacenter overhead, also calledpower usage effectiveness (PUE). This includescooling (fans, pumps), lighting, security, net-working, but not employee transportation. Thisis a multiplier greater than or equal to 1.
• lossgrid is the grid loss, electricity lost during thetransmission from supplier to consumer. This isa multiplier greater than or equal to 1.
• efficiencyhashing is the hashing efficiency of thehardware, as hashrate per unit of power.2 Weuse megahashes per second per Watt (MH/s/W).
• efficiencypsu is the power supply efficiency forthe AC-DC converter powering the hardware.This is a ratio between 0 and 1, with 1 indicatinga perfectly efficient power supply.
3.1 Hashrate
The hashrate of the Ethereum network cannot bemeasured directly. It can be estimated based onthe block “difficulty” which is the current number ofguesses required to add a new block. The difficultyis automatically tweaked in proportion to how fre-quently new blocks are submitted. This mechanismkeeps the network running at the same block rate,around one block every 13 seconds, even as computa-tional power is added and removed. When more com-putational power is added, new blocks are submittedslightly faster, causing the difficulty to increase, sta-bilizing the block rate. A large difficulty correspondsto a large hashrate. Etherscan[13] estimates hashrate
2Sometimes efficiency is given inverted, as energy-per-hash(for example, Joule-per-megahash or J/MH). We use hash-per-energy so that the value increases as efficiency increases.
2
from block difficulty, for example giving a local peakof 643 TH/s on May 20, 2021.3
3.2 Hashing Efficiency
We measured hardware hashing efficiency as hashratedivided by power. Hashing efficiency is difficult to es-timate without access to the hardware, because bothhashrate and power are connected to a variety of fac-tors.
• The hardware mix used for mining Ethereumchanges over time. New hardware is more ef-ficient, and old hardware becomes either cost in-efficient or can no longer hold the blockchain inmemory.[40]
• The size of the blockchain may affect thehashrate. As a larger blockchain approacheshardware memory limits, the hashrate may drop.Benchmarks at one block height may not berepresentative of performance at another blockheight.[69]
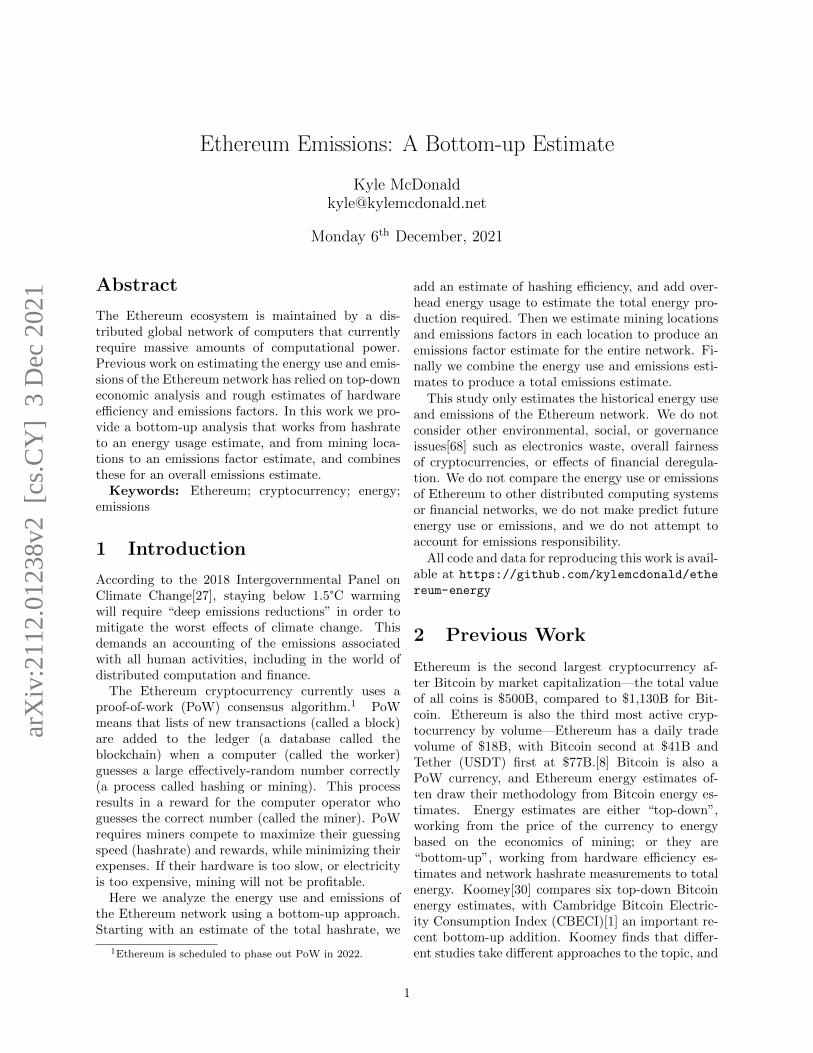
• Hashrate is dependent on software configuration,with recent software sometimes hashing faster onthe same hardware than older software. Whenfaster software increases the hashrate, the powerusage may not increase. Websites like Miner-Monitoring[39] collect benchmarks directly fromusers, and show broad variation in hashrate andpower usage, shown in figure 1.
• The primary hardware used for miningEthereum are graphics processing units (GPUs,also used for gaming and machine learning).GPUs are sometimes modified (overclocked) byminers. This may increase both the hashrateand the power usage relative to out-of-the-boxbenchmarks.
• Hardware does not necessarily use its full nomi-nal power when hashing. Hashing efficiency thatis based on a hashrate benchmark and nominalpower will overestimate power usage.4
• The power self-reported by hardware may be15% lower[36] than the true power.
3Different sources give slightly different hashrate estimates.CoinWarz[9] estimates from 4-5% lower than Etherscan before2018, then was roughly in agreement from 2018 through mid-2019, but has estimated a consistently 5-8% higher hashrate(and rising) since mid-2019.
4By analyzing benchmarks we found that power usage dur-ing hashing is around 74% of nominal power.
Other studies like the CBECI give a lower boundon efficiency that assumes miners are using the leastefficient hardware that is still feasible and still prof-itable (though miners may briefly mine unprofitablecoins speculatively). An upper bound on efficiencymight assume that every miner is currently using themost efficient hardware available. The true efficiencyis in-between.
To make a best guess of hashing efficiency, we col-lected over 500 benchmarks from multiple sources un-der the assumption that mostly popular and prof-itable hardware is benchmarked. We compiled anadditional 18 benchmarks from the median of over9000 user-submitted benchmarks to MinerMonitor-ing[39]. From the launch of Ethereum (2015-07-30)to the present, the typical hashing efficiency of bench-marked hardware doubled from around 0.17 MH/s/Wto 0.44 MH/s/W, as shown in figure 2. The meanabsolute difference between this trendline and themore efficient or less efficient hardware is around0.08 MH/s/W which gives a low and high estimate.We use the trendline to estimate hashing efficiency asa function of time, starting at 0.17 MH/s/W at thebeginning of Ethereum, and recently at 0.44 MH/s/Was of 2021-12-02.
To check our assumption that the true hardwaremix is spread across a variety of devices and not justthe latest hardware, we analyzed metadata from amining pool5. We collected around 200,000 workerIDs (mining computer IDs) from Nanopool[48] perday, on 5 different days during 2021-10 through2021-11, with around 69000 active workers per day(around 34% of all active Nanopool workers).6 MostNanopool worker IDs are idiosyncratic like mpyKId18
or Sneezy f559df40. But around 8,000 IDs in-clude hardware identifiers like moneta 3060Ti 1,or rig5ubuntu1080*6 or even farm layout like9throw2nda10section192x168x30x96. Counting in-stances of 28 terms for common hardware, we foundthat a wide mix of hardware is in use, as shown infigure 3.7
To check that our most recent efficiency estimate0.44 MH/s/W ± 0.08 MH/s/W is in the right range,we take a hashrate-weighted average of the effi-ciency of all identifiable Nanopool workers. Acrossa daily average of 5992 workers representing a daily
5A small-scale Ethereum mining operation will only com-plete a block rarely and intermittently, so most miners joinpools to take advantage of more stable revenue.
6Because workers remain registered to Nanopool even if thehardware has been retired, offline workers do not necessarilyimply that there is unused hardware.
7We also found that one miner[46] with over 300 InnosiliconA10[26] units had a median performance of 374.0 MH/s, belowthe advertised 500 MH/s.
3
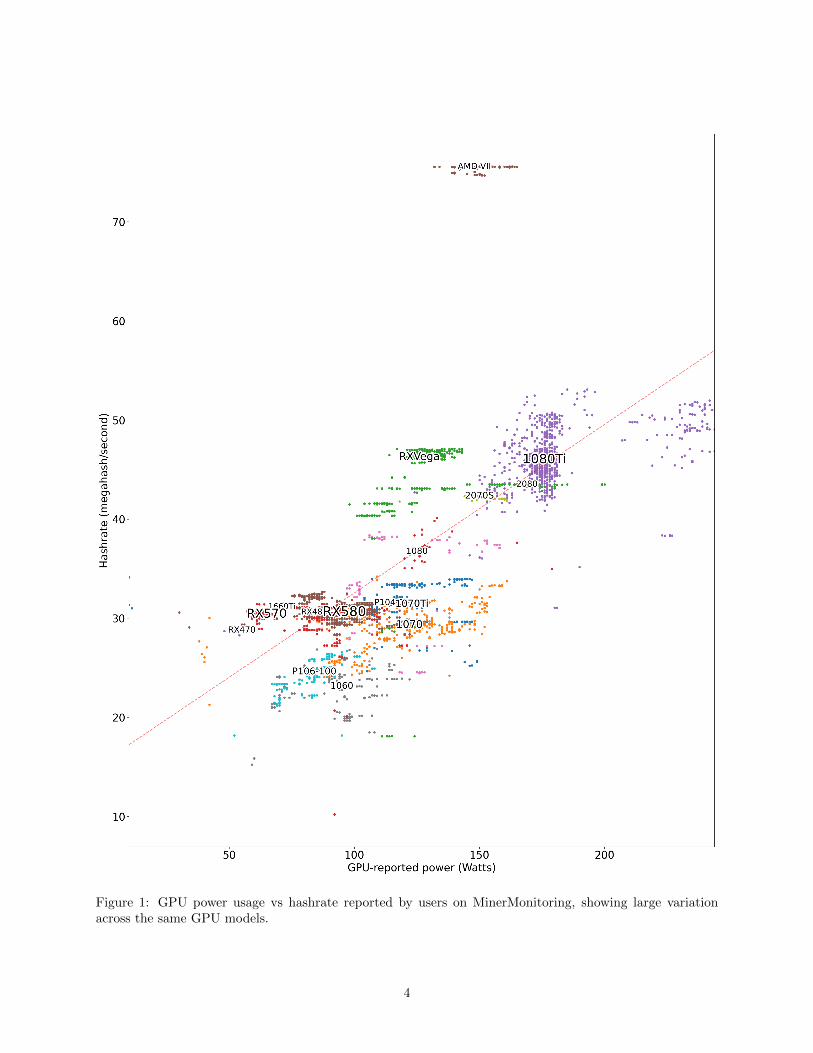
Figure 1: GPU power usage vs hashrate reported by users on MinerMonitoring, showing large variationacross the same GPU models.
4

Figure 2: Plot of hardware hashing efficiency increasing over time, with hardware names drawn next to themedian efficiency across multiple benchmarks.
Figure 3: Total hashrate of active workers on Nanopool that match one of 28 common hardware terms, overmultiple days during 2021-10 through 2021-11.
5

2.39 TH/s, we first assign each an efficiency based onthe mean efficiency of hardware with the same term(for example, 3090 for the Nvidia GeForce RTX 3090is assigned 0.38 MH/s/W). Then we take a hashrate-weighted average, which gives us 0.38 MH/s/W. Thisefficiency sample is likely skewed toward smaller op-erations, as larger farms are less likely to reveal theirhardware mix.
As another check, we check the HiveOS[20] net-work statistics. HiveOS is mining monitoring soft-ware that also reports aggregate hardware statistics.For example on 2021-11-15 they report 17% of theNvidia models are GeForce RTX 3070 8GB, and 33%of the AMD models are Radeon RX 580 8GB, andthat 55% of all the GPU hardware is Nvidia while therest are AMD. We take a weighted average of the me-dian benchmarked efficiency for all GPUs, weightedby hashrate and portion of GPU models. On 2021-11-14 we calculate an efficiency of 0.337 MH/s/W, andusing the the Wayback Machine[21] we are able to cal-culate an efficiency for 2020-04-16 of 0.232 MH/s/W.These efficiencies are below our lower estimate, butfollow the same upward trend. The HiveOS statisticsmay be representative of the way that new hardwaretakes time to ship and install, or HiveOS may not beused by the largest and highest performance miningfacilities.
As a final check, we compare to a numbers frommining company Hut 8[50]. In 2021 they purchased$30M in new GPUs (around 20-60 thousand) fora total 1600 GH/s hashrate at 4 GW. This gives0.4 MH/s/W measured at the plug, which implies ahigher GPU-reported efficiency.
3.3 Power Supply Efficiency
GPU power usage benchmarks are typically reportedby the GPU after the electricity has been convertedfrom AC to DC by the power supply. Power sup-ply units (PSUs) are inefficient. The best PSUs canbe 95% efficient while the worst are 80% efficient orlower.
Miners aim for PSUs in the high 80% range andmany PSUs recommended to miners are rated “80Plus Gold“ which can perform at 90% efficiency un-der a 50% load on a 120V grid in the USA[45][44].In China and Europe this efficiency may be slightlyhigher on the 220V and 230V grid. The efficiencymay also be lower when many cheap PSUs are boughtin bulk, or pre-installed as part of a pre-built miningrig. We use power supply efficiency efficiencypsu =0.90
3.4 Hardware Overhead
While Bitcoin mining is dominated by customcomputers (application-specific integrated circuits,ASICs) that are only capable of mining Bitcoin andrelated coins, Ethereum mining still happens mainlyon GPUs (with the exception of some ASICs fromInnosilicon[26] and Linzhi[34]). Because of this,Ethereum can be mined by small-scale miners whoonly have a few spare GPUs that they might typi-cally use for other applications. However, while thereare many workers that operate on one or two GPUs,most of the hashrate comes from workers with closerto 6× GPUs (see Appendix A).
While hobbyist miners measure their idle powerfrom the wall between 50 W to 100 W[15], a dedi-cated worker designed specifically for mining mightuse as little as 20 W[53][52] for components besidesthe GPU.
The median GPU-reported power usage acrossMinerMonitoring benchmarks is 109 W. Account-ing for typical power supply efficiency, the total at-the-wall GPU power usage is 109 W/0.90 = 121 W.If we assume that the typical number of GPUs perworker is 6, then total GPU-measured power usage is6×121 W = 726 W and the total worker power usageis 726 W + 20 W = 746 W so the hardware overheadis overhw = 746 W/726 W = 1.03.
We can also check our per-worker GPU powerusage estimate by looking at identifiable Nanopoolworkers. The reported hashrate divided by bench-marked efficiency equals GPU-reported power. Themedian power8 across all identifiable Nanopool work-ers is 647 W. This is close to 6 × 10⁹ W = 654 W.
In the most efficient case where a professionalminer is using 8 GPUs measured at 280 W each(like the Nvidia 3090) and a 90% efficient PSU,the GPU power at the wall is 8 × 280 W/0.90 =2489 W and the additional power is 20 W, overhw =2509 W/2489 W = 1.01.
In the most inefficient case where a hobbyist mineris using a single GPU measured at 70 W (like theNvidia 1660Ti), or 78 W at the wall, on a computerthat idles at 100 W, their overhw = 178 W/78 W =2.28.
To realistically account for this inefficient case, weuse data from Appendix A, to mix the different es-timates. We allocate 3% of the hashrate to ineffi-cient hobbyist workers, 22% to the 4-6 GPU work-ers, and the remaining 74% to high-efficiency work-ers, overhw = 1.06.
8We take the median power across all workers instead of themean because a few workers have a very high hashrate[47], andthis may be explained[37] by miners using the same worker IDfor many workers.
6

3.5 Datacenter Overhead
CBECI uses an estimate of 1.1 (10% additional)based on discussions with Bitcoin miners, with arange between 1.2 (20% additional) and 1.01 (1% ad-ditional). Because Bitcoin is mostly mined by large-scale operations (farms), and Ethereum is mined bymore workers with fewer GPUs and therefore proba-bly by more small-scale operations, it could be arguedthat the datacenter overhead of these smaller opera-tions would be higher than the overhead of a farm.Or it could alternatively be argued that a small righas no very little marginal overhead, because theyare often installed in residential contexts where over-head energy, like lighting and cooling, would be usedanyway. We use a value of overdc = 1.1.
3.6 Grid Loss
Also called grid efficiency, transmission and distribu-tion loss, or line loss, the amount of power lost duringtransmission varies significantly between regions[73].Within the USA alone, grid loss varies between 2%to 13% across states, with an average and medianaround 6.5%.
Across the regions where Ethereum is mined mostoften (China, USA, Northern Europe and WesternEurope) grid loss varies between 5% to 7% and isestimated around lossgrid = 6%.
3.7 Energy Summary
In the table below, “low” means that the value wouldproduce a lower energy estimate, “high” means thevalue would produce a higher energy estimate, while“best” is our best estimate.
low high besthashrate - - variesoverhw 1.01 1.06 1.03overdc 1.01 1.20 1.10lossgrid 1.05 1.07 1.06
efficiencyhashing - - variesefficiencypsu 0.95 0.80 0.90
With daily hashrate estimates from Etherscan[13],and our best estimate for each parameter, using equa-tion 1 gives us a power estimate peaking at 2.7 GWon 2021-11-18, as shown in figure 4. Using thelower and higher parameter estimates for this daygive 1.9 GW and 3.9 GW.
Applying equation 1 directly gives a value in unitsof power (Watts). Power is an instantaneous mea-surement. Power usage during one day might begiven in Watts (average power), or as total energy
during that day (power usage over time, Watt-hoursor W h). Other studies extrapolate to annualized en-ergy usage, as yearly Terawatt hours or TW h.
2020-03-27 2018This study 5.6 TW h 9.9 TW h
Gallersdorfer 6.299 TW h -Krause - 10.2 TW h
De Vries 7.64 TW h 20.8 TW h
The results from this study mirror Krause and To-laymat almost exactly.9 While Krause and Tolay-mat do not account for datacenter overhead, hard-ware overhead, grid loss, and more, they estimate alower hashing efficiency than this study: on their firstdate of 2016-01-01 they estimate 0.15 MH/s/W whilewe estimate 0.18 MH/s/W. On their last date 2018-06-30 they estimate 0.21 MH/s/W while we estimate0.29 MH/s/W.
The recent increase by de Vries could be inter-preted as an decrease in overall efficiency. This de-crease would mostly likely be caused by a decreasein efficiencyhashing or by an increase in overhw . TheHiveOS data indicates that hashing efficiency has in-creased since 2020-04 at a similar rate to our trend-line. This means that high prices may not be signif-icantly changing the hardware mix. However, whenhobbyist miners can profit from high rewards in spiteof their relatively inefficient workers, their activitymay decrease the overall efficiency by lowering theaverage overhw .
To date (2015-07-15 to 2021-12-06), we estimatethe Ethereum network has used between 27 TW h and61 TW h with a best guess of 40 TW h.
4 Emissions
In order to estimate the emissions of the Ethereumnetwork, we:
1. Estimate emissions factors for popular regionswhere Ethereum is mined.
2. Guess which region a block was mined in, basedon block metadata.
3. Average the emissions factors across all blocksfor a given day.
4. Multiply the daily energy usage by daily emis-sions factors.
9Krause and Tolaymat estimate annual energy for 2018based on data from the first half of the year, but this turnedout to also be representative of the hashrate during second halfof the year.
7

Figure 4: Ethereum network power in Gigawatts and equivalent annualized Terawatt hours per year, basedon energy equation 1 and parameters. Shaded region shows the range between our lower and upper estimates.
4.1 Emissions Factors
An emissions factor is the ratio between CO2 emis-sions and energy production. Different kinds of elec-tricity sources have different emissions factors. Re-newables and nuclear power have very low directemissions factors, while fossil fuels have very highemissions factors. An electricity consumer is usuallyconnected to a mix of multiple producers, which canbe treated as a weighted average of emissions fac-tors. These energy mixes vary from place to placeand over time. For example, the EPA reports thatthe average emissions factor in the USA in 2016 was455 gCO2/kWh and declining.[65]
To analyze Ethereum, we produced a table of emis-sions factors for 16 electric grids (table B.1). Someof these emissions factors represent a mix of multiplegrids, like “United States” while others are within asingle grid like “Washington”.
Emissions factors were compiled from a mix ofsources10 including government agencies like EPA[65]and EEA[10], corporations like BP[4], thinktanks andconsultants like Shift Energy Data Portal[63] and En-erdata[11], as well as energy researchers like Tao etal[61]. We included six years, starting in 2015 withthe creation of Ethereum, through the present, 2021.
Because China has historically made up a large per-centage of Ethereum mining, we take extra care cal-culating emissions factors there. Miners in China areknown to migrate to the Southern provinces duringthe wet season for cheap hydropower. CBECI esti-mates that during the wet season in China, up to 62%of Bitcoin mining happens in hydropower-abundant
10Some sources that appear initially useful, like “Carbon in-tensity of energy production”[49] statistics from Our World InData, actually refer to all energy production instead of elec-tricity alone. This includes, for example, fuel burned for trans-portation or heating.
provinces like Yunnan and Sichuan. To account forthis we separate out three sets of emissions factors:China as a whole (annual average), Northwest China(dry season), and South China (wet season). See Ap-pendix B for details.
4.2 extraData and Mining Regions
Other studies[2][29][13] that explore the geographicdistribution of Ethereum focus on nodes insteadof workers. Nodes make up the backbone of theEthereum network, storing the blockchain and relay-ing new blocks to other nodes. Some workers arenodes, but if a worker is mining for a pool it is not anode. Studies based on node location may not repre-sent mining location, and have no way of allocatinghashrate. Instead, we use metadata recorded in theblockchain to estimate the regional distribution of theEthereum hashrate.
When a new block is added to the Ethereumblockchain, it includes metadata fields, like whomined the block and when it was mined. Whena worker submits a block to a mining pool server,the mining pool will add the metadata. Somemining pools use the customizable extraData fieldto report which server received the block. Forexample, Ethermine uses ethermine-europe-west3
and ethermine-europe-north1 as extraData val-ues. Because miners configure their workers to con-nect to nearby servers (to spend more time miningand less time using the network), the extraData fieldcan provide a hint about where miners are operating.
For example, if the extraData matches the pat-tern eu-w then the block was likely mined in WesternEurope and we assign it to the region europe-west.By checking extraData against 18 different patterns,we can assign a region to 41% of all blocks. Then
8
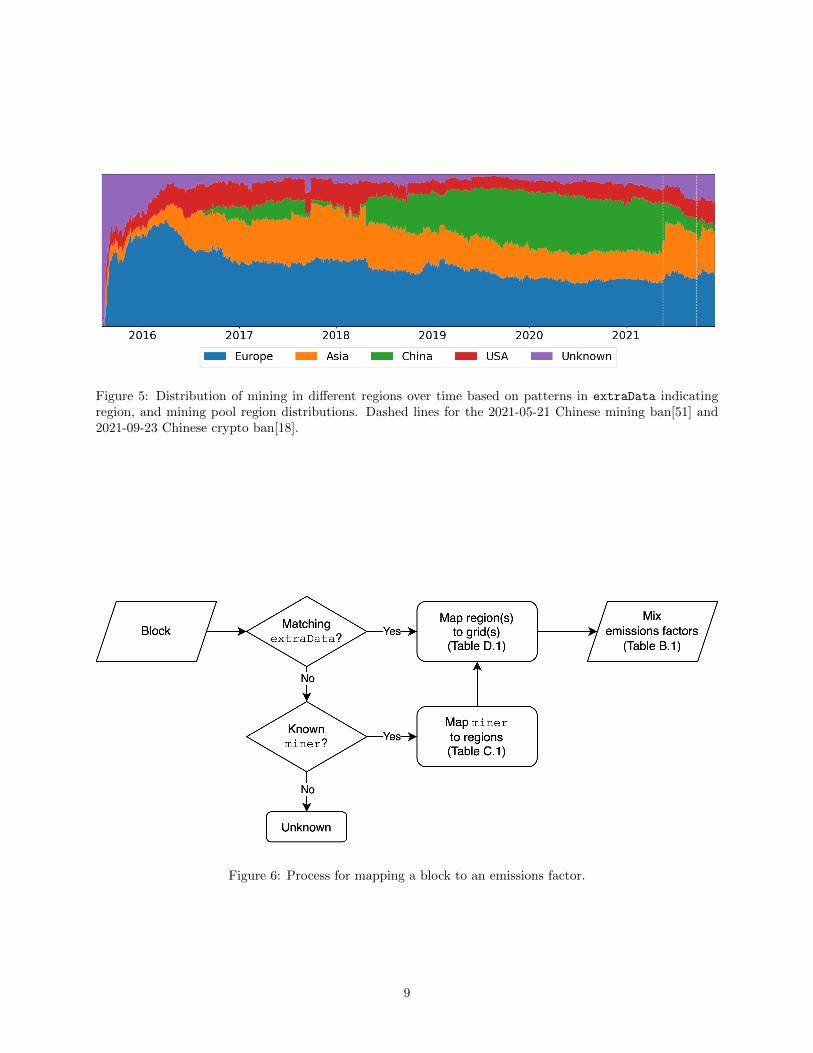
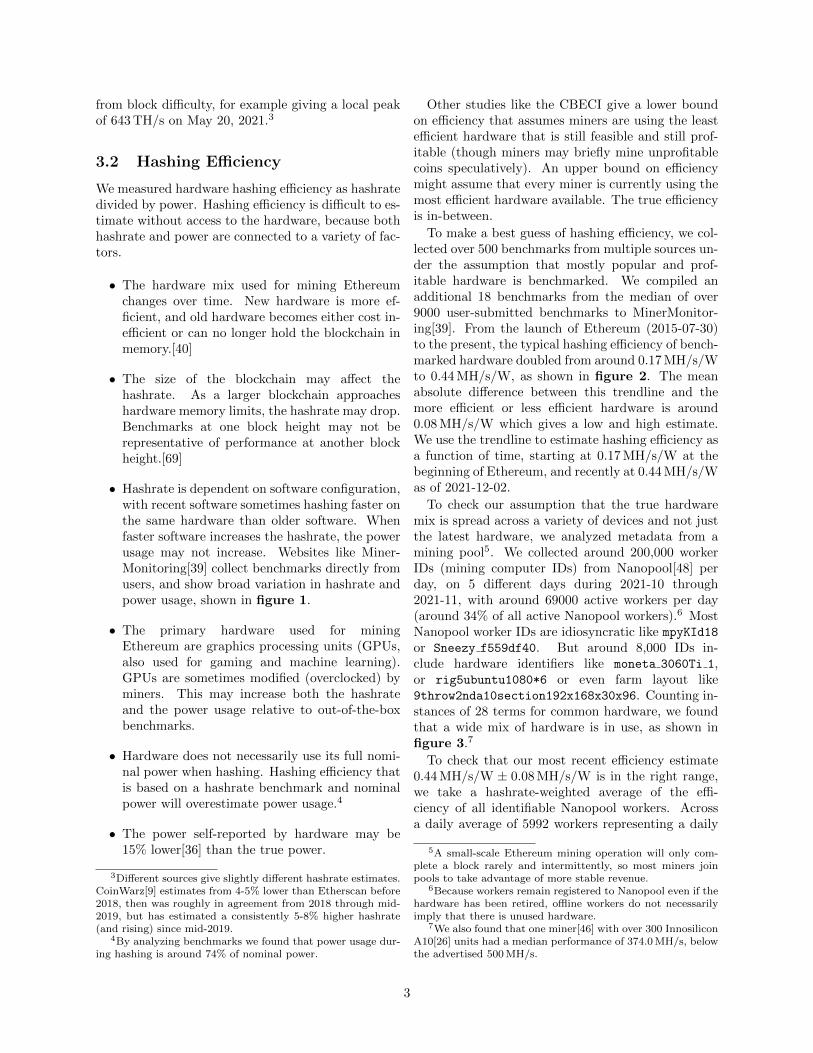
Figure 5: Distribution of mining in different regions over time based on patterns in extraData indicatingregion, and mining pool region distributions. Dashed lines for the 2021-05-21 Chinese mining ban[51] and2021-09-23 Chinese crypto ban[18].
Figure 6: Process for mapping a block to an emissions factor.
9

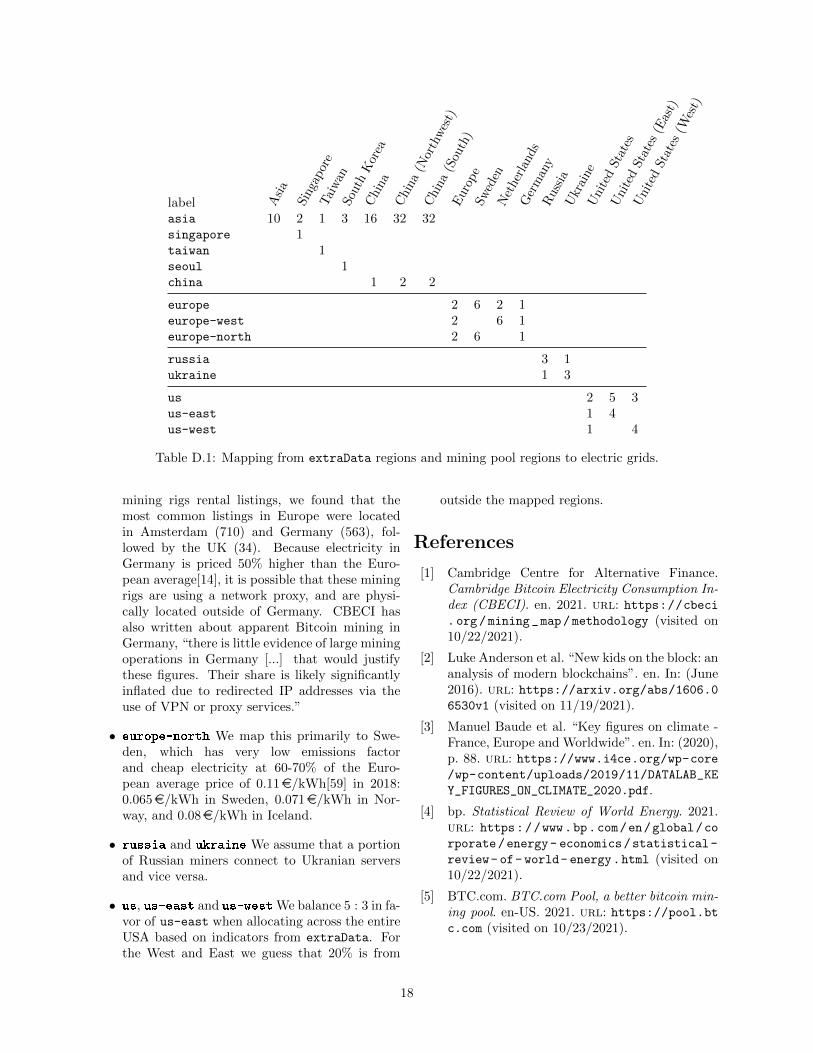
using table D.1 we treat the region as a mix of grids.For example we map the europe-west region to amix of the “Europe”, “Netherlands” and “Germany”grids. We compute the final emissions factor by tak-ing a weighted average across the mix of grids for thatyear. See Appendix D for details.
If a block cannot be mapped based on itsextraData we try to map it based on its mining pool.For example, Huobi Mining Pool is known to be oper-ating in a mix of Europe, Asia and the USA as shownin table C.1. So we map blocks mined by Huobi Min-ing Pool onto a mix of regions, europe, asia and us.Then we follow the same process as above to mapeurope to a mix of “Europe”, “Sweden”, etc., and us
to a mix of “United States”, “West Virginia” etc.After the 41% of blocks mapped with extraData,
an additional 50% of all blocks can be mapped basedon 60 mining pools. This leaves only 8% of blockswith a completely unknown origin. This process ofmapping each block is shown in figure 6, and theresulting region distribution over time is shown infigure 5.
4.3 Total Emissions
To compute a daily emissions factor in figure 7, wetake an average across the emissions factors of allmapped blocks for that day.11 Then to estimate to-tal daily emissions in figure 8, we multiply the emis-sions factor for that day by the energy used on thatday. This gives us an emissions estimate peaking at19 ktCO2 on 2021-12-02. Using the lower and higherparameter estimates for this day give 14 ktCO2 and27 ktCO2.
Krause and Tolaymat estimate between0.291 MtCO2 and 1.37 MtCO2 total for the pe-riod from 2016-01-01 through 2018-06-30. Weestimate between 1.7 MtCO2 and 4.3 MtCO2 with abest guess of 2.6 MtCO2. This discrepancy is due toan inappropriate methodology used by Krause andTolaymat. They compute a daily “energy-per-coin”,take the median of these values, then multiply thismedian by the total number of coins, and finallymultiply by an emissions factor. If we simplify theirmethodology by computing a daily “emissions-per-day” then summing, their numbers give us a lowerbound of 1.52 MtCO2 for 193 gCO2/kWh and anupper bound of 7.21 MtCO2 for 914 gCO2/kWh.
De Vries uses a fixed emissions factor of475 gCO2/kWh based on a location distribution ofBitcoin miners reported by Hileman and Rauchs[19].
11This daily emissions factor estimate is noisy for the firstthree weeks, so we replace that data with the median over thatperiod.
De Vries started providing annualized emissions es-timates around 2021-03-08 at 12.05 MtCO2, with amore recent estimate on 2021-10-08 at 36.41 MtCO2.Our estimate is less than half on 2021-03-08 at3.9 ktCO2, and around one quarter at 6.1 ktCO2 on2021-10-08. Our lower emissions estimate is partiallydue to our lower emissions factor estimate, but pri-marily due to our lower energy estimate.
Marro and Donno estimate 67.80 ktCO2e averagedaily emissions for the period 2021-04-29 through2021-05-05, while we estimate 14.1 ktCO2. Their es-timate may be treated as a kind of upper bound, be-cause it is a top-down estimate based on the assump-tion that miners spend all their revenue on hardwareand electricity with zero profit. This discrepancy mayalso be related to their low estimate of hardware effi-ciency at 0.17 MH/s/W while most recent hardwareperforms around 0.3 MH/s/W or better.
To date (2015-07-15 to 2021-12-06), we estimatethe Ethereum network has emitted between 9 MtCO2
and 19 MtCO2 with a best guess of 12 MtCO2.
5 Future Work
• Some emissions are not counted here, includingmanufacturing emissions and greenhouse gasesbeyond CO2. Marro and Donno estimate thataround 5% of hardware emissions over two yearscan be attributed to the hardware manufactur-ing. Large farms sometimes require building con-struction and employee transportation. Miningpools also have staff and emissions.
• The hardware overhead could be more accuratelyrepresented as a fixed power usage rather thana ratio of total energy use. As more power-ful GPUs are released that use more energy percard, the CPU does not also use proportionallymore energy.
• Estimating the contribution of each parameterto the energy and emissions estimates would helpfocus future work on the highest-contribution pa-rameters. For energy the largest source of uncer-tainty is efficiencyhashing and hardware mix, aswell as overhw . For emissions, both the emis-sions factors and region distribution are majorsources of uncertainty.
• Mining pool region distributions have changedover time. Some pools give additional hintsabout miner regions by block. For example,BTC.com reports[5] over 47,000 blocks minedacross 5 regions: 73% China, 22% EU, 5% USA,including a breakdown between “Shenzhen” and
10
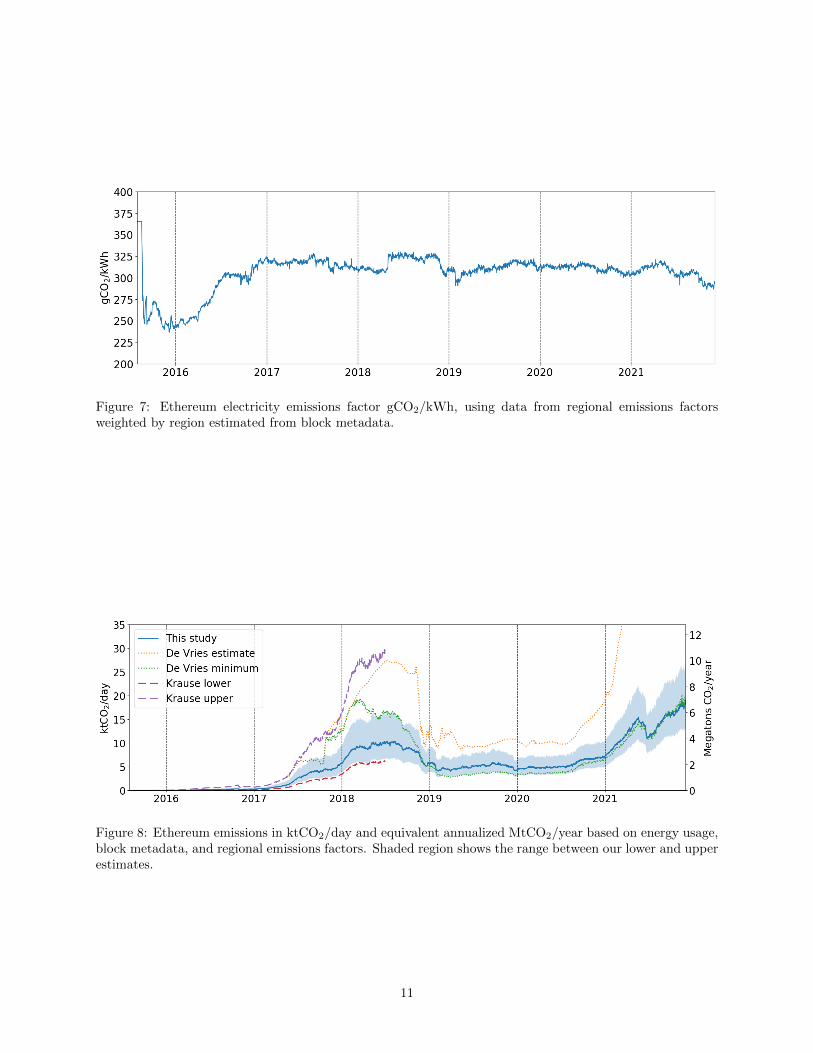
Figure 7: Ethereum electricity emissions factor gCO2/kWh, using data from regional emissions factorsweighted by region estimated from block metadata.
Figure 8: Ethereum emissions in ktCO2/day and equivalent annualized MtCO2/year based on energy usage,block metadata, and regional emissions factors. Shaded region shows the range between our lower and upperestimates.
11

“Beijing”. Working with mining pools may pro-vide additional location details. In particular,F2Pool jumped from providing around 8% of thehashrate to nearly 25% after the 2021-09-23 Chi-nese crypto ban[18]. This jump may come largefarms migrating out of China[22] to the USA,Europe, South American, or into Kazakhstan.Accurately identifying their location could signif-icantly change recent emissions factor estimates.
• Intra-year emissions factors would create a slightyearly “wobble” in the daily emissions estimate:peaking during China’s dry season when min-ing electricity is powered by more fossil fuels,and dropping in the wet season when mining ispowered by hydropower. This would refine andslightly lower the overall emissions for 2018, be-cause the majority of the mining during that yearhappened during the wet season.
• Because electricity is sometimes cheaper in off-peak hours, leading to more mining activity, an-alyzing the intra-day activity trends of a poolmay also reveal some information about wherethe users are located.
• A portion of the hashrate may rely on off-grid ac-cess to renewable energy, or on stranded energy.While there are hundreds[56] of Bitcoin farmsusing natural gas that would otherwise be flaredor vented, it is difficult to estimate the scale forEthereum.
• If a miner operates only when there is an en-ergy surplus from low-emissions sources, then itcould be argued that they are not creating amarginal emissions increase. While this is rare,there is at least one example: miners operatingin Yunnan, China around July 2018 would haveto use around 10 GW to exhaust the surplus hy-dropower[35].
• Energy terms such as grid loss lossgrid or hard-ware overhead overhw can vary significantly be-tween locations and types of miners. Theseterms also vary over time: for example, overhw
has likely decreased with the appearance oflarger farms and more powerful GPUs. As theseterms vary, so does the energy use, and also theemissions. We estimate overhw from Nanopool,but it could also be estimated from other poolsthat report per-miner or per-worker hashrate likeSoloPool[58], K1Pool[28], or in archived datafrom Weipool[70].
• The price of Ethereum influences the hashrate,and also the hashing efficiency. When the price
increases, miners will turn on older, less efficienthardware as it becomes profitable. If the pricecontinues to increase, some miners will use theirprofits to expand their operation. This impliesthat short-term increases in hashrate correspondto a decrease in hashing efficiency, while long-term price increases correspond to an increase inhashing efficiency.
• Geolocalized DNS activity associated with min-ing servers might indicate where miners arebased. When a worker connects to a min-ing pool, it has to translate a domain namelike eth.f2pool.com to an IP address like172.65.210.108. The worker will ask a DNSserver for this information, and some DNSservers keep request logs. OpenDNS requeststatistics can be accessed using Cisco UmbrellaInvestigate. We checked a list of 46 mining poolservers from 11 mining pools with Umbrella In-vestigate in May 2021. We found that 40% ofrequests originated from China, 15% from theUSA, 4% from Brazil, 3% from Indonesia, 3%from Russia, plus a long tail of additional lo-cations. Servers with asia in the domain namehad more requests from Australia, Vietnam, Ko-rea, and Japan. Servers with eu in the do-main name had more requests from Europeancountries. DNS lookups do not correspond tohashrate, and because lookups are locally cachedthey do not correspond worker count. Also, notall regions rely on the same mix of DNS servers.
• Hardware manufacturers like Nvidia, AMD,Linzhi, and Innosilicon may be able to providea more precise estimate or upper bound on ef-ficiency based on sales. Nvidia has reported$526M[32] in sales of crypto-specific GPUs, im-plying 28 TH/s based on the price and hashratereported by Hut 8[50]. A small hint regardingLinzhi is that over 500 units are identified inNanopool worker IDs, and Linzhi writes “Forpurchases of over 100 units, please contact us”.
• Our low and high estimates do not account foruncertainty in the regional distribution of min-ing. Emissions factors vary by more than an or-der of magnitude, from around 40 gCO2/kWhduring the west season in South China up to900 gCO2/kWh in parts of the USA. Givenour network emissions factor estimates from237 MtCO2 to 365 MtCO2, this would imply thatthe total emissions could be significantly higheror lower than our high and low estimates.
12

6 Conclusion
We estimate Ethereum energy use based on six pa-rameters: hashrate, efficiencyhashing , overhw , overdc ,lossgrid , efficiencypsu . These parameters are eithermeasured, estimated and checked on data, or bor-rowed from other studies. Our daily energy esti-mate generally matches studies by Gallersdorfer etal, Krause and Tolaymat, and de Vries, with the ex-ception of a recent increase by de Vries. To date(2015-07-15 to 2021-12-06), our best guess of the to-tal energy use of Ethereum is 40 TW h.
We estimate Ethereum emissions by mapping eachblock to a distribution of electric grids to computea weighted average of emissions factors. We mapthe blocks based on their extraData or their miningpool. We compute a daily emissions factor by aver-aging all mapped blocks. Finally, we estimate emis-sions by multiplying the daily energy use by the dailyemissions factor. Our daily emissions estimate gen-erally matches studies by Krause and Tolaymat, deVries (with the exception of the same recent increase),but not Marro and Donno. To date (2015-07-15 to2021-12-06), our best guess of the total emissions ofEthereum is 12 MtCO2.
Overall, we find that most previous top-down es-timates of Ethereum energy use and emissions areconsistent with our bottom-up estimate.
7 Acknowledgements
Thanks to Jonathan Koomey, Alex Taylor and Off-setra, Memo Akten, and Michel Rauchs for discus-sions and guidance; to Michael Auger for coordinat-ing exploration of DNS traffic with Cisco UmbrellaInvestigate; and to everyone who reviewed drafts:Dr. Keolu Fox, Emi Paternostro, Joanie Lemercier,Lia Coleman, Martial Geoffre-Rouland, Mateja Sela,Matt Aimonetti, Nao Tokui, Samantha Culp, andTom White. Thanks to Lauren McCarthy for lovingsupport and encouragement.
Appendix A GPU Count
Analyzing the hashrate distribution of Nanopoolworkers reveals a pattern shown in figure A.1:around 21% of workers have a hashrate under50 MH/s, and 31% of workers have a hashrate under100 MH/s. This range represents the single-GPU con-figuration (the fastest GPUs are around 100 MH/s).The next peak is around 150 MH/s, likely represent-ing the dual-GPU configuration, and the last peak ismuch wider around 550 MH/s likely representing 6×
GPU configurations. While there are many few-GPUworkers, workers with a hashrate under 100 MH/sonly represent 3% of the total hashrate, while work-ers with a hashrate between 100 MH/s and 350 MH/srepresent 22% of the total hashrate, and workers over350 MH/s represent the remaining 74%.
Appendix B Emissions Factors
An emissions factor is the ratio between CO2 emis-sions and energy production. It is most often ex-pressed as gCO2/kWh or kgCO2/MWh in a 0-1000range, or as tCO2/MWh in a 0-1 range. TheIPCC estimates[27] that the average emissions fac-tor is 961 gCO2/kWh for electricity generated bycoal plants, and 483 gCO2/kWh for gas plants, whilerenewables like wind and hydro emit less than10 gCO2/kWh[43] over their lifetime (due to con-struction and operation). An emissions factor can beused to estimate how much CO2 was emitted whilegenerating a given amount of power.
The IEA tracks and sells global emissions fac-tors[25], but does not allow them to be published,making any derived work impossible to openly audit.To make this work auditable, we have estimated his-torical emissions factors for multiple regions relevantto Ethereum mining. We have also had a third partycompare our emissions factors to the IEA emissionsfactors.
When an emissions factor is not directly availablefrom a governmental authority, it may be estimatedby:
• Dividing total electricity emissions statistics bytotal electricity generation statistics.
• Taking a weighted average of the emissions fac-tors for different energy sources in a grid (theenergy mix), in proportion to the electricity gen-erated by each source.
• Assuming that changes in emissions factors arerelatively smooth, we may fit a line and interpo-late between or extrapolate beyond known emis-sions factors.
Collecting and estimating emissions factors re-quires navigating ancient and byzantine energyagency websites, and searching for obscure presenta-tions that include a few well-researched data points.The latest data is often a few years old. Sometimesnumbers that initially look like electricity generationemissions factors turn out to actually include heatingin addition to electricity, or they are projected future
13

Figure A.1: Analysis of the hashrate distribution of around 70,000 active Nanopool workers per day over 4days.
Region 2015 2016 2017 2018 2019 2020 2021
Asia 666 651 638 623 609 595 581Singapore 422 423 421 420 408 409 406Taiwan 525 530 554 533 509 521 518South Korea 527 521 537 533 506 472 483China 650 627 623 613 598 580 570China (Northwest) 668 661 653 646 639 632 625China (South) 46 45 44 42 41 40 39Europe 313 302 301 288 253 231 224Sweden 10 10 10 11 10 9 9Netherlands 506 487 460 440 392 328 316Germany 448 445 413 404 344 311 294Russia 326 327 325 325 323 301 307Ukraine 372 400 337 342 342 333 317United States 467 419 431 408 401 386 370United States (East) 410 389 368 350 325 305 284United States (West) 534 510 495 492 446 437 417
Table B.1: Regional emissions factor estimates, in gCO2/kWh
14

emissions factors accounting for power plants underconstruction.
We use government-reported emissions factorswhere possible, augmented with historical energy mixstatistics, and some extrapolation and interpolationfor missing data. Of all our emissions factors, 38% aregovernment-reported, 24% are based on energy mixstatistics, 23% are interpolated, and 14% are pro-vided by non-governmental entities like the IEA.
Calculating regional emissions factors would be astraightforward process if every region had an electricgrid that was completely isolated from its neighbors.In reality, grids are often connected between countriesand states using a complex web of high voltage lines.These connections are managed by transmission sys-tem operators (TSOs). When electricity is purchased,it is usually bought within the scope of a TSO bound-ary. When the EPA gives an emissions factor of875 gCO2/kWh for the state of West Virginia in 2019,this is based on all the power plants operating in thestate rather than within the TSO boundary. WestVirginia is located in a RFCW TSO region, whichhas an emissions factor of 484 gCO2/kWh.
• Asia The IEA[23, p. 65] provides estimates for“gCO2/kWh of electricity” within “Non-OECDAsia (excluding China)” as 666 gCO2/kWh in2015 and 638 gCO2/kWh in 2017. Other yearsare interpolated and extrapolated. These emis-sions factors are designed to capture the presenceof crypto mining in Southeast Asian countrieslike Cambodia and Vietnam[54].
• China We use the IEA[24] estimates for China2015-2020, 2021 is extrapolated. We also cross-check these numbers against the EIA[64] whichestimates Chinese electric generation from fossilfuels during 2015-2019 slowly dropping from 72%to 67%. Under the assumption that the energymix within fossil fuels has stayed consistent, theEIA percentages match the IEA estimates within±1%.
• China (Northwest) Tao et al.[61] provides “re-vised electric power emission factors” for eachgrid region in China, approximating the com-plexities of emissions responsibilities implied byinterprovincial power dispatching. They esti-mate emissions factors for all six regions from2000-2015. We fit a line to these factors andpredict 2015-2021. These predictions mightbe cross-referenced against Chinese Ministry ofEcology and Environment (MEE) numbers forregional grid baseline emissions factors[74]. Butbecause Tao is accounting for energy import and
export, and the MEE does not, the numbersdo not match. As an example, the MEE esti-mates Northwest China at 892 gCO2/kWh dur-ing 2015-2017, while a line fit from Tao averages661 gCO2/kWh during that same period. In gen-eral, our emissions factors are low compared tothe MEE estimates. Our factors are comparableto Li et al.[33] which estimates 650 gCO2/kWhfor 2020 while we estimate 632 gCO2/kWh.
• China (South) We use the same methodologyas China (Northwest) but scale our predic-tions based on the energy mix in the wet sea-son. Models from Liu and Davidson[35] indicatethat in Yunnan during the wet seasons 2016-2019, coal only contributed roughly 4% to 6%of the total electricity generation. Given thatChinese electricity in 2017 was 70% fossil fu-els[64] and mostly coal, and that the 2017 emis-sions factor was 623 gCO2/kWh[23, p. 67] wecan estimate Chinese fossil fuels to emit roughly890 gCO2/kWh, similar to the 870 gCO2/kWhgiven by Ademe[3] or the 913 gCO2/kWh min-imum from the IPCC[27]. Assuming 5% coalin Yunnan during the wet season gives us anemissions factor of 5% × 890 gCO2/kWh =44 gCO2/kWh. Scaling the line fit from Taogives us a final result of 46 gCO2/kWh in 2015dropping to 39 gCO2/kWh in 2021. Thesefactors are designed to capture the very lowemissions associated with electricity generationin Sichuan and Yunnan from an abundanceof hydropower. These wet season numbersare lower than the annual 80 gCO2/kWh to200 gCO2/kWh range given by Li et al. for 2020in Sichuan, and much lower than the annual225 gCO2/kWh to 155 gCO2/kWh range givenby a line fit from Tao et al. over 2015-2021.Both Sichuan and Yunnan are part of larger TSOregions, the Central and Southern power grids,which have much higher emissions. We use localemissions instead of TSO-wide emissions becausethe low price of electricity in this region indicatesthat it is due to an inability to efficiently exportthe power.
• Europe The EEA[10] estimates “greenhousegas emission intensity of electricity genera-tion” for the European Union as declining from313 gCO2e/kWh in 2015 to 231 gCO2e/kWh in2020. While CO2e emissions cover more green-house gases than CO2, these numbers closelymatch the IEA[24]. We extrapolate for 2021.
• Germany, Netherlands and Sweden We use
15

the EEA[10] estimates for 2015 to 2020, andextrapolate for 2021. The national borders ofSweden matches their TSO borders (Svenskakraftnat), while the Netherlands TSO TenneTextends into Germany which is served by threeadditional TSOs[72].
• Russia BP[4] provides electricity generationstatistics for Russia including from oil, gas, coal,and total. According to the state-owned Russianenergy corporation Gazprom[17], emissions fac-tors are 400 gCO2/kWh for gas, 600 gCO2/kWhfor oil and 845 gCO2/kWh to 1020 gCO2/kWhfor coal. We weight the yearly electricity gener-ation statistics by these numbers, using the lowerend 845 gCO2/kWh for coal, and divide by thetotal generated electricity. For example, in 2018:
egas = 400 gCO2/kWh × 523 TW h
eoil = 600 gCO2/kWh × 7.9 TW h
ecoal = 845 gCO2/kWh × 176 TW h
fmix =egas + eoil + ecoal
1109 TW h= 327 gCO2/kWh
Similar to 325 gCO2/kWh estimated for 2018 byEnerdata[11], reported by Carbon Footprint[6]from the Climate Transparency Report[7]. Weapply this small scaling factor to the weightedestimates, and extrapolate to 2021. Thesenumbers are comparable and lower than theGazprom estimate 358 gCO2/kWh for the earlier2010-2016 period[17, p. 50]. This also matchesthe trend reported by the European Bank forReconstruction and Development[55], which pre-dicted that Russian emissions would remainnearly unchanged between 2009-2020. Finally,percentages derived from BP’s data give identi-cal results to the EIA energy mix percentages:both give 64% fossil fuels for 2018.
• Singapore We use the Energy Market Author-ity of the Singapore Government[12] data for2015-2019. 2020 and 2021 are extrapolated.
• South Korea We use the IEA[24] estimates forSouth Korea 2015-2020, 2021 is extrapolated.
• Taiwan We use the Taiwan Bureau of En-ergy 2020 Energy Statistics Handbook for 2015-2019[60, p. 17] and extrapolate for 2020 and2021.
• Ukraine We use the EIA fossil fuel percent-age estimate from 2010-2020. We then usetwo equally weighted datapoints from The Cli-mate Registry[62]: 392 gCO2/kWh in 2010 and450 gCO2/kWh in 2011. These datapoints im-ply between 860 gCO2/kWh to 941 gCO2/kWhfor fossil fuel based emissions in Ukraine. Thisgenerally matches other statistics[71][63] that re-port Ukraine’s fossil fuel energy mix around 80%coal and increasing since 2010. We extrapolatefor 2021.
• United States We use the EPA eGRID datafor 2018 and 2019[65]. We divide the totalemissions by the total generation across all re-gions. For example, in 2019 the US emit-ted 1.83 GtCO2 (short tons12) for 4.140 TW h,around 0.442 tCO2e/MWh (short tons), or401 gCO2/kWh. We can use the same tech-nique to estimate the emissions for 2016 usingthe eGRID 2016 Summary Tables[66]. For 2020we use EIA fossil fuel percentages. First we esti-mate an emissions factor for fossil fuels in 2019 as646 gCO2/kWh, given the 401 gCO2/kWh over-all emissions factor and 61% fossil fuels statistic.We multiply that by the 59% fossil fuels percent-age for 2020 to get 386 gCO2/kWh for 2020. Werepeat this for 2015 using 2016, and for 2017 us-ing 2016 and 2018. Finally, we extrapolate fromthis data to 2021.
• United States (West) and United States(East) Recent research[56] indicates that 80%Bitcoin mining in the USA happens in New York(NYUP), Kentucky (SRTV), Georgia (SRSO),Texas (ERCT) and Nebraska (MROW). We as-sume that Ethereum follows a similar pattern.We assign Nebraska and Texas as representingthe West, and the others for the East. We useEPA eGRID data for 2018 and 2019 and eGRID2016 Summary Tables for each of the correspond-ing TSO regions, and take the average across theregions. 2015, 2017, and 2020-2021 are extrapo-lated.
Appendix C Mining Regions
When the region of a block cannot be estimated fromits extraData field, we use the mining pool to esti-mate where it was mined. Some of the largest miningpools have multiple international servers, and oth-ers have fewer servers or have users that are geo-
12The EPA reports CO2 emissions in units of “short tons”equivalent to 2000 pounds, or around 907 kg
16

graphically concentrated. We map mining pools toone or more of five regions: asia, china, europe,russia, us. asia refers to mining pools that are usedbroadly across Asia (including China, Japan, SouthKorea, and throughout Southeast Asia), while china
is meant for pools used primarily by Chinese miners.
Miner europe us asia
2Miners 95 4 1Bw Pool 32 10 58Coinotron 92 8DwarfPool 84 12 4Ethermine 72 15 13F2Pool 23 10 67firepool 27 13 60Hiveon 85 14 1Huobi Mining Pool 49 25 26Nanopool 94 6PandaPool 24 11 65Spark Pool 20 10 70UUPool 6 4 90xnpool.cn 32 14 54zhizhu.top 24 9 67
Table C.1: An excerpt of mappings from mining poolsto regions based on data from Silva et al[57].
Pool region distribution estimates are based on:
• Block propagation delay During a one-monthperiod from 2019-04-01 to 2021-05-02, Silva etal[57] logged activity on the Ethereum networkusing four servers. The servers were located inPortugal, Czech Republic, Taiwan, and the USA.When a block is mined by a pool in China, theblock will first be reported to servers in Taiwanbefore it is reported to servers in the USA. Forexample, 94% of Nanopool-mined blocks arrivedin Portugal or Czech Republic before other re-gions, so we weight Nanopool as 94% europe.And 90% of UUPool-mined blocks arrived in Tai-wan before other regions, so we weight UUPoolas 90% asia. We map 15 pools this way.
• Mining Pool Stats[42] Regions for many cur-rent pools are listed on this tracking website.Sometimes the regions are overly general (e.g.“global”) and can be narrowed down.
• Language Website localization options can be aclue to the user base. For example xnpool onlyoffers a Chinese language interface.
• Server locations For example SpiderPoolonly offers servers in Hangzhou, Chengdu,
and Hohhot (eth.pool.zhizhu.top, eth-cd,eth-nmg). While F2Pool offers servers in China,North America, and Europe (eth.f2pool.com,eth-na, eth-eu).
Appendix D Region Mapping
In order to convert extraData regions and miningpool regions to emissions factors, we need to make aninformed guess. For each extraData region, whereare the miners located that are connecting to thatserver? And for each mining pool region, where arethe miners located that are using that mining pool?
• asia From looking at the extraData alone,Ethereum mining in Asia is dominated by usersconnecting to servers in China. Around 82% ofblocks mined by an Asian server were submittedby a Chinese server. Another 10% of blocks weresubmitted by a server indicating “asia” in theextraData. The remaining 3.5%, 2.2% and 1%of blocks were mined by servers indicating seoul,singapore or taiwan respectively. We assumethat users connecting to an asia server or anasia-based mining pool will follow this same dis-tribution. Within China we use a 2 : 2 : 1 ra-tio based on observations of Bitcoin by CBECIindicating that over the 12 month period from2020-07-01 to 2021-07-01, mining in the South-ern provinces of Sichuan and Yunnan made up42% of all Chinese mining activity, while min-ing in Xinjiang made up 36% and other regionsmade up 21%. This definition of asia is usefulbefore the 2021-05-21 ban in China, but futurework should update this definition to account forthe new mix.
• singapore, taiwan and seoul We map theseregions directly to their corresponding nationalgrid.
• china We use a 2 : 2 : 1 ratio between the South-ern and Northwestern provinces and China as awhole, same as used in asia.
• europe Under the assumption that most Eu-ropean mining happens in places with below-average electricity prices, like Sweden (and Nor-way, and Iceland), we map europe evenly be-tween these grids in a 6 : 1 ratio with Europe asa whole.
• europe-west We map this primarily to Nether-lands, based on statistics from cloud mining plat-form Mining Rig Rentals[41]. Scraping 2700
17
label Asi
a
Sing
apor
eTai
wan
Sout
hK
orea
Chi
naC
hina
(Nor
thw
est)
Chi
na(S
outh
)E
urop
eSw
eden
Net
herl
ands
Ger
man
yR
ussi
aU
krai
neU
nite
dSt
ates
Uni
ted
Stat
es(E
ast)
Uni
ted
Stat
es(W
est)
asia 10 2 1 3 16 32 32singapore 1taiwan 1seoul 1china 1 2 2
europe 2 6 2 1europe-west 2 6 1europe-north 2 6 1
russia 3 1ukraine 1 3
us 2 5 3us-east 1 4us-west 1 4
Table D.1: Mapping from extraData regions and mining pool regions to electric grids.
mining rigs rental listings, we found that themost common listings in Europe were locatedin Amsterdam (710) and Germany (563), fol-lowed by the UK (34). Because electricity inGermany is priced 50% higher than the Euro-pean average[14], it is possible that these miningrigs are using a network proxy, and are physi-cally located outside of Germany. CBECI hasalso written about apparent Bitcoin mining inGermany, “there is little evidence of large miningoperations in Germany [...] that would justifythese figures. Their share is likely significantlyinflated due to redirected IP addresses via theuse of VPN or proxy services.”
• europe-north We map this primarily to Swe-den, which has very low emissions factorand cheap electricity at 60-70% of the Euro-pean average price of 0.11e/kWh[59] in 2018:0.065e/kWh in Sweden, 0.071e/kWh in Nor-way, and 0.08e/kWh in Iceland.
• russia and ukraine We assume that a portionof Russian miners connect to Ukranian serversand vice versa.
• us, us-east and us-west We balance 5 : 3 in fa-vor of us-east when allocating across the entireUSA based on indicators from extraData. Forthe West and East we guess that 20% is from
outside the mapped regions.
References
[1] Cambridge Centre for Alternative Finance.Cambridge Bitcoin Electricity Consumption In-dex (CBECI). en. 2021. url: https://cbeci.org/mining_map/methodology (visited on10/22/2021).
[2] Luke Anderson et al. “New kids on the block: ananalysis of modern blockchains”. en. In: (June2016). url: https://arxiv.org/abs/1606.06530v1 (visited on 11/19/2021).
[3] Manuel Baude et al. “Key figures on climate -France, Europe and Worldwide”. en. In: (2020),p. 88. url: https://www.i4ce.org/wp-core/wp-content/uploads/2019/11/DATALAB_KE
Y_FIGURES_ON_CLIMATE_2020.pdf.
[4] bp. Statistical Review of World Energy. 2021.url: https://www.bp.com/en/global/co
rporate/energy- economics/statistical-
review- of- world- energy.html (visited on10/22/2021).
[5] BTC.com. BTC.com Pool, a better bitcoin min-ing pool. en-US. 2021. url: https://pool.btc.com (visited on 10/23/2021).
18

[6] Carbon Footprint. carbonfootprint.com - Inter-national Electricity Factors. July 2020. url: https://www.carbonfootprint.com/interna
tional_electricity_factors.html (visitedon 10/22/2021).
[7] Climate Transparency. Brown to Green Report2018: Russia. en-US. July 2018. url: https://www.climate-transparency.org/g20-cl
imate-performance/g20report2018 (visitedon 10/22/2021).
[8] CoinMarketCap. Cryptocurrency Prices,Charts And Market Capitalizations. en. 2021.url: https://coinmarketcap.com/ (visitedon 10/22/2021).
[9] CoinWarz. Ethereum Hashrate Chart. en. url:https://www.coinwarz.com/mining/ethere
um/hashrate-chart (visited on 10/31/2021).
[10] EEA. Greenhouse gas emission intensity ofelectricity generation. en. Data Visualization.June 2021. url: https://www.eea.europa.eu/data-and-maps/daviz/co2-emission-inte
nsity-8#tab-googlechartid_googlecharti
d_googlechartid_googlechartid_chart_11
111 (visited on 10/22/2021).
[11] enerdata. Market Data & CO2 Emissions —Energy Database — Multi Energy Approach.2021. url: https://www.enerdata.net/research/energy-market-data-co2-emission
s-database.html (visited on 10/22/2021).
[12] Energy Market Authority. Singapore EnergyStatistics — Energy Transformation. 2021.url: https://www.ema.gov.sg/singapore- energy- statistics/Ch02/index2 (visitedon 10/22/2021).
[13] etherscan.io. Ethereum Node Tracker — Ether-scan. en. 2021. url: http://etherscan.io/nodetracker (visited on 11/19/2021).
[14] eurostat. File:Electricity prices for householdconsumers, second half 2020 (EUR per kWh)v1.png. en. Apr. 2021. url: https://ec.europa.eu/eurostat/statistics-explained/i
ndex.php?title=File:Electricity_price
s_for_household_consumers,_second_hal
f_2020_(EUR_per_kWh)_v1.png (visited on10/22/2021).
[15] Frogi5. How much more electricity does a com-puter spend mining vs just being on and down-loading a game or something? Reddit Post.Dec. 2017. url: www.reddit.com/r/EtherMining/comments/7hpome/how_much_more_ele
ctricity_does_a_computer_spend/ (visitedon 10/30/2021).
[16] Ulrich Gallersdorfer, Lena Klaaßen, and Chris-tian Stoll. “Energy Consumption of Cryptocur-rencies Beyond Bitcoin”. In: Joule 4.9 (Sept.2020), pp. 1843–1846. issn: 2542-4351. doi: 10.1016/j.joule.2020.07.013. url: https://www.ncbi.nlm.nih.gov/pmc/articles
/PMC7402366/ (visited on 10/22/2021).
[17] Gazprom. “PJSC Gazprom Environmental Re-port 2019”. en. In: (2019), p. 86. url: https://www.gazprom.com/f/posts/72/802627/ga
zprom-environmental-report-2019-en.pdf.
[18] Eliza Gkritsi. China Tightens Crypto MiningCrackdown, Bans Trading. en. Section: Policy.Sept. 2021. url: https://www.coindesk.c
om/policy/2021/09/24/china- tightens-
crypto-mining-crackdown-bans-trading/
(visited on 10/29/2021).
[19] Garrick Hileman and Michel Rauchs. “2017Global Cryptocurrency Benchmarking Study”.en. In: SSRN Electronic Journal (2017). issn:1556-5068. doi: 10.2139/ssrn.2965436. url:http://www.ssrn.com/abstract=2965436
(visited on 10/22/2021).
[20] Hive OS. Hive OS Statistics. en. 2021. url: https://hiveos.farm/statistics/ (visited on11/15/2021).
[21] Hive OS. Wayback Machine. Apr. 2020. url:https://web.archive.org/web/2020041606
1413/https://api2.hiveos.farm/api/v2/h
ive/stats (visited on 11/15/2021).
[22] IBC Group. IBC Group to end Bitcoin andEthereum Mining in China, and Move Staff toUAE, Canada, USA, Kazakhstan, Iceland, andVarious South American Countries. en. 2021.url: https://www.prnewswire.com/news-releases/ibc-group-to-end-bitcoin-and-et
hereum-mining-in-china-and-move-staff-
to-uae-canada-usa-kazakhstan-iceland-a
nd-various-south-american-countries-30
1325485.html (visited on 11/18/2021).
[23] IEA. “CO2 emissions from fuel combustion2019 - Highlights”. en. In: (2019), p. 165. url:https://iea.blob.core.windows.net/asse
ts/eb3b2e8d-28e0-47fd-a8ba-160f7ed42bc
3/CO2_Emissions_from_Fuel_Combustion_2
019_Highlights.pdf.
[24] IEA. Development of CO2 emission intensityof electricity generation in selected countries,2000-2020. en-GB. 2020. url: https://www.iea.org/data-and-statistics/charts/deve
lopment-of-co2-emission-intensity-of-e
19

lectricity-generation-in-selected-coun
tries-2000-2020 (visited on 11/18/2021).
[25] IEA. Emissions Factors 2021 - Data product.en-GB. 2021. url: https://www.iea.org/data-and-statistics/data-product/emission
s-factors-2021 (visited on 10/23/2021).
[26] Innosilicon. INNOSILICON A10 Pro ETHMiner. 2021. url: https://www.innosilicon.com/html/a10pro-miner/index.html (vis-ited on 10/22/2021).
[27] IPCC. Annex II: Metrics & Methodology. In:Climate Change 2014: Mitigation of ClimateChange. 2014. url: https://www.ipcc.ch/report/ar5/wg3/metrics-and-methodology/
(visited on 10/22/2021).
[28] K1 Pool. Ethereum RBPPS+ Pool. 2021. url:https://k1pool.com/pool/eth/miners (vis-ited on 10/23/2021).
[29] Seoung Kyun Kim et al. “Measuring EthereumNetwork Peers”. In: Proceedings of the Inter-net Measurement Conference 2018. IMC ’18.New York, NY, USA: Association for Comput-ing Machinery, Oct. 2018, pp. 91–104. isbn:978-1-4503-5619-0. doi: 10.1145/3278532.3278542. url: https://doi.org/10.1145/3278532.3278542 (visited on 11/18/2021).
[30] Jonathan Koomey. Estimating Bitcoin Elec-tricity Use: A Beginner’s Guide. en-US. May2019. url: https://www.coincenter.org/estimating-bitcoin-electricity-use-a-beg
inners-guide/ (visited on 10/22/2021).
[31] Max J. Krause and Thabet Tolaymat. “Quan-tification of energy and carbon costs for miningcryptocurrencies”. en. In: Nature Sustain-ability 1.11 (Nov. 2018). Bandiera abtest: aCg type: Nature Research Journals Number:11 Primary atype: Research Publisher: NaturePublishing Group Subject term: Energy andsociety;Environmental impact Subject term id:energy-and-society;environmental-impact,pp. 711–718. issn: 2398-9629. doi: 10 . 1038
/s41893-018-0152-7. url: https://www.nature.com/articles/s41893- 018- 0152- 7
(visited on 10/22/2021).
[32] Kif Leswing. Nvidia crypto mining chip salesfell off a cliff this quarter. en. Section: Technol-ogy. Nov. 2021. url: https://www.cnbc.com/2021/11/17/nvidia-crypto-mining-chip-
sales-dropped-60percent-sequentially-i
n-q3.html (visited on 11/19/2021).
[33] Xin Li, Konstantinos J. Chalvatzis, and Dim-itrios Pappas. “Life cycle greenhouse gasemissions from power generation in China’sprovinces in 2020”. en. In: Applied Energy 223(Aug. 2018), pp. 93–102. issn: 0306-2619. doi:10.1016/j.apenergy.2018.04.040. url: https://www.sciencedirect.com/science/a
rticle/pii/S0306261918305981 (visited on11/19/2021).
[34] Linzhi. Linzhi Phoenix. en-US. 2020. url: https://linzhi.cn.com/shop/linzhi-phoenix
-2600mh-s/ (visited on 10/22/2021).
[35] Shuangquan Liu and Michael Davidson. ChinaTrading Power: Improving Environmental andEconomic Efficiency of Yunnan’s ElectricityMarket. en. 2021. url: https://www.belfe
rcenter.org/publication/china- trading
- power- improving- environmental- and- e
conomic-efficiency-yunnans-electricity
(visited on 10/22/2021).
[36] Mad Electron Engineering. How To MeasureAMD GPU Wattage On Mining Rigs. Apr.2021. url: https://www.youtube.com/watch?v=sbykCToI5ww (visited on 11/15/2021).
[37] MajeStyle1. In the last minutes,. . . RedditComment. Mar. 2021. url: www.reddit.com/r/EtherMining/comments/lwuhsd/nanopoo
l_exploit/gpj82g5/ (visited on 10/31/2021).
[38] Samuele Marro and Luca Donno. Green-NFT/Green NFTs - A Study on the Environ-mental Impact of Cryptoart. en. May 2021. url:https://github.com/lucadonnoh/GreenNFT
(visited on 10/22/2021).
[39] MinerMonitoring. GPU compare benchmark -ethash. en. 2021. url: https://minermonitoring.com (visited on 10/27/2021).
[40] minerstat. DAG size calculator and calendar.en. 2021. url: https://minerstat.com/dag-size-calculator (visited on 10/22/2021).
[41] Mining Rig Rentals. Dagger-Hashimoto(Ethash) Mining Rigs. 2021. url: https://www.miningrigrentals.com/rigs/hashimotos
(visited on 10/22/2021).
[42] MiningPoolStats. Ethereum (ETH) Ethash —Mining Pools. 2021. url: https : / / minin
gpoolstats . stream / ethereum (visited on10/22/2021).
20

[43] William Moomaw et al. “Annex II: Methodol-ogy. In: Special Report on Renewable EnergySources and Climate Change Mitigation.” en.In: (2012), p. 28. url: https://archive.ipcc.ch/report/srren/.
[44] Aris Mpitziopoulos. Best PSUs For CryptoMining: Reliable Power Supplies for Ethereum.en. Mar. 2021. url: https://www.tomshardware.com/best-picks/power-supplies-for-m
ining (visited on 10/22/2021).
[45] Aris Mpitziopoulos. What Do 80 PLUS Bronze,Silver, Gold & Titanium Signify? Apr. 2018.url: https://www.tomshardware.com/news/what-80-plus-levels-mean,36721.html
(visited on 10/22/2021).
[46] Nanopool. 0xa8b6... Account. 2021. url: https://eth.nanopool.org/account/0xa8b6dbdf
3987ed0fa0de309bff01518d9a5826bb (visitedon 11/16/2021).
[47] Nanopool. 0xd70d... Account. url: https://eth.nanopool.org/account/0xd70dbe949cb
deaa3a9d07541421771a4034a8042 (visited on10/31/2021).
[48] Nanopool. Nanopool — Ethereum. 2021. url:https : / / eth . nanopool . org/ (visited on10/28/2021).
[49] Our World In Data. Carbon intensity of energyproduction. 2019. url: https://ourworldin
data.org/grapher/co2- per- unit- energy
(visited on 10/23/2021).
[50] David Pan. Ethereum Miners MakeMultimillion-Dollar Bet on Upgrade De-lay. en. Section: Business. Aug. 2021. url:https://www.coindesk.com/business/2021
/08/12/ethereum-miners-make-multimilli
on-dollar-bet-on-upgrade-delay/ (visitedon 11/19/2021).
[51] Omkar Godbole and David Pan. Bitcoin Fallsas China Calls for Crackdown on Crypto Min-ing, Trading. en. Section: Markets. May 2021.url: https://www.coindesk.com/markets/2021/05/21/bitcoin-falls-as-china-calls
-for-crackdown-on-crypto-mining-tradin
g/ (visited on 11/01/2021).
[52] Rabid Mining. Ethereum Mining Still ProfitableOn 4GB Cards? 2021 — rx580 Power Con-sumption — rx 580 Hashrates. Jan. 2021. url:https://www.youtube.com/watch?v=lOZnu
VFhrSg (visited on 10/30/2021).
[53] Red Panda Mining. Testing Power Consump-tion For 6 x RX 580 4gb Mining Rig! Sept.2020. url: https://www.youtube.com/watch?v=8kH8t-Mhals (visited on 10/30/2021).
[54] Jamie Redman. Chinese Miners Are FindingRelocation Difficult in Southeast Asia – Min-ing Bitcoin News. en-US. May 2018. url: https://news.bitcoin.com/chinese-miners-ar
e-finding-relocation-difficult-in-sout
heast-asia/ (visited on 10/23/2021).
[55] Achim Schreider, Philipp Eckert, and AlexisBonneschky. “Development of the RussianElectricity Carbon Emission Factors for the Pe-riod 2010-2020”. In: Mar. 2011.
[56] MacKenzie Sigalos. Bitcoin miners and oil andgas execs mingled at a secretive meetup inHouston – here’s what they talked about. en.Section: Crypto Decoded. Sept. 2021. url: h
ttps://www.cnbc.com/2021/09/04/bitco
in- miners- oil- and- gas- execs- talk- ab
out- natural- gas- mining.html (visited on10/23/2021).
[57] Paulo Silva et al. “Impact of Geo-distributionand Mining Pools on Blockchains: A Studyof Ethereum”. In: arXiv:2005.06356 [cs] (May2020). arXiv: 2005.06356. url: http://arxiv.org/abs/2005.06356 (visited on 10/27/2021).
[58] SoloPool. Ethereum Solo Mining Pool -SoloPool.org - ETH. 2021. url: https : / /
eth . solopool . org / miners (visited on10/22/2021).
[59] Christoph Steitz and Jewkes Stephen. “Cryp-tocurrency miners seek cheap energy in Norwayand Sweden”. en. In: Reuters (Apr. 2018). url:https://www.reuters.com/article/us-cry
pto-currencies-nordics-energy-idUSKBN1
HH13L (visited on 10/22/2021).
[60] Taiwan Bureau of Energy. Energy StatisticsHandbook 2020. 2020. url: https://www.moeaboe.gov.tw/ECW_WEBPAGE/FlipBook/2020En
ergyStaHandBook / 2020EnergyStaHandBook .
pdf.
[61] Xueping Tao, Ping Wang, and Bangzhu Zhu.“Measuring the Interprovincial CO2 Emis-sions Considering Electric Power Dispatchingin China: From Production and ConsumptionPerspectives”. en. In: Sustainability 8.6 (June2016). Number: 6 Publisher: MultidisciplinaryDigital Publishing Institute, p. 506. doi: 10.3390/su8060506. url: https://www.mdpi.com/2071-1050/8/6/506 (visited on 10/22/2021).
21

[62] The Climate Registry. Default Emissions Fac-tors. 2021. url: https://www.theclimateregistry.org/wp-content/uploads/2021/05/2
021-Default-Emission-Factor-Document.p
df.
[63] The Shift Project. The Shift Data Portal. 2020.url: https://www.theshiftdataportal.org/ (visited on 10/23/2021).
[64] US EIA. International primary energy produc-tion and consumption. 2021. url: https://www.eia.gov/international/overview/world
(visited on 10/22/2021).
[65] US EPA. Data Explorer. en. Data and Tools.Mar. 2020. url: https://www.epa.gov/egrid/data-explorer (visited on 10/22/2021).
[66] US EPA. Download Data. en. Data and Tools.Aug. 2020. url: https://www.epa.gov/egrid/download-data (visited on 10/22/2021).
[67] Alex de Vries. Ethereum Energy ConsumptionIndex. en-US. 2021. url: https://digiconomist.net/ethereum- energy- consumption/
(visited on 10/24/2021).
[68] Alex de Vries et al. “The true costs of digi-tal currencies: Exploring impact beyond energyuse”. English. In: One Earth 4.6 (June 2021).Publisher: Elsevier, pp. 786–789. issn: 2590-3330, 2590-3322. doi: 10.1016/j.oneear.2021.05.009. url: https://www.cell.com/one-earth/abstract/S2590-3322(21)00290-6
(visited on 10/26/2021).
[69] Steve Walton. Ethereum Mining GPU Bench-mark. en-US. June 2017. url: https://www.techspot.com/article/1438-ethereum-mini
ng-gpu-benchmark/ (visited on 10/22/2021).
[70] Weipool. Weipool. June 2016. url: https://web.archive.org/web/20160630223659/http
://weipool.org/ (visited on 10/22/2021).
[71] Wikipedia contributors. Energy in Ukraine. en.Page Version ID: 1039901128. Aug. 2021. url:https://en.wikipedia.org/w/index.php?t
itle=Energy_in_Ukraine&oldid=103990112
8 (visited on 10/22/2021).
[72] Wikipedia contributors. European Network ofTransmission System Operators for Electricity.en. Page Version ID: 1036073884. July 2021.url: https://en.wikipedia.org/w/index.php?title=European_Network_of_Transmiss
ion_System_Operators_for_Electricity&o
ldid=1036073884 (visited on 10/22/2021).
[73] Jordan Wirfs-Brock. Lost In Transmission:How Much Electricity Disappears Between APower Plant And Your Plug? en-US. Nov.2015. url: http://insideenergy.org/201
5/11/06/lost- in- transmission- how- mu
ch- electricity- disappears- between- a-
power - plant - and - your - plug/ (visited on10/22/2021).
[74] Shengmin Yu. Baseline emission factors ofChina’s regional power grids for emission re-duction projects in 2018. Dec. 2020. url: https://www.mee.gov.cn/ywgz/ydqhbh/wsqtk
z/202012/t20201229_815384.shtml (visitedon 10/22/2021).
22