ethiopia family planning...
TRANSCRIPT

Ethiopia Family Planning
Landscape

FP situational landscape
Partner landscape
Plan activities & elements
Contents
2

Family Planning Situational Overview

CIA W
orld Factbook; Population R
eference Bureau – 2014 P
opulation Data S
heet
Population: 95.9 million (13th largest in the world, 2nd largest in Africa) 43.5% of the population is Ethiopian Orthodox, 33.9% is Muslim,
and 18.6 % is Protestant. Ethiopians are primarily rural, with only 19% of people living in
urban areas (Addis Ababa is the largest city, with 2.86 million people). The annual urbanization rate is 3.6%.
Life expectancy at birth is 62 for males and 65 for females. 44% of the population is under 15 years of age.
Economy and social development: GDP per capita is ~$1300 (USD PPP) 39% of the population lives below the poverty line Main economic sectors are industries, agriculture, and services
Geography: Landlocked country; imports most goods through Djibouti 9 Regions: Afar, Amhara, Benishangul-Gumuz, Gambela,
Harari, Oromia, Somali, Southern Nations, Nationalities and People’s Region (SNNP) and Tigray
2 Administrative Cities: Addis Ababa and Dire Dawa Healthcare System:
3 tiers: Primary (Primary hospital, health centre, health post); Secondary (General hospital); and Tertiary (Specialized hospital)
Country Overview: General Development Indicators
4

Ethiopian Central Statistics Agency; Population Reference Bureau; 2014 United Nations Department of Economic and Social Affairs; World Bank
Ethiopian Central Statistics Agency; Population Reference Bureau; United Nations Department of Economic and Social Affairs; World Bank
Current Country Context: Reproductive Health Indicators
Key health indicators
420
28
Maternal mortality
ratio
Under 5 mortality
rate
52 Infant
mortality rate
Reproductive health indicators
… are linked to demographic growth
4.1
2014 2024
2.1% ▪ Urban: 2.2 ▪ Rural: 4.5
Total fertility rate Population growth rate
Population projections, medium variant Population in millions of people
95.9 121.9 148.1 19.0 % urban 23.7 % urban 28.9 % urban
▪ Natural increase: 2.1%
▪ Net migration: -0.23
2034
5

HSTP, FP2020 Committments
Increase CPR from 42% (in 2014) to 55% in 2020
Reduce TFR from 4.1 (in 2014) to 3.0 in 2020
Reach 6.2 million additional women & adolescent girls with FP services
The Government of Ethiopia has outlined the following objectives to advance FP
Overall Objectives:
Financial Commitments
Program & Service Delivery Commitments: Ensure Family Planning Commodity Security
Increase uptake of long-acting reversible methods
Expand youth-friendly services, with a focus on adolescent girls
Scale up delivery of services to hardest to reach groups
Monitor availability of contraceptives
Increase the budget allocation for FP annually
OBJECTIVE
6
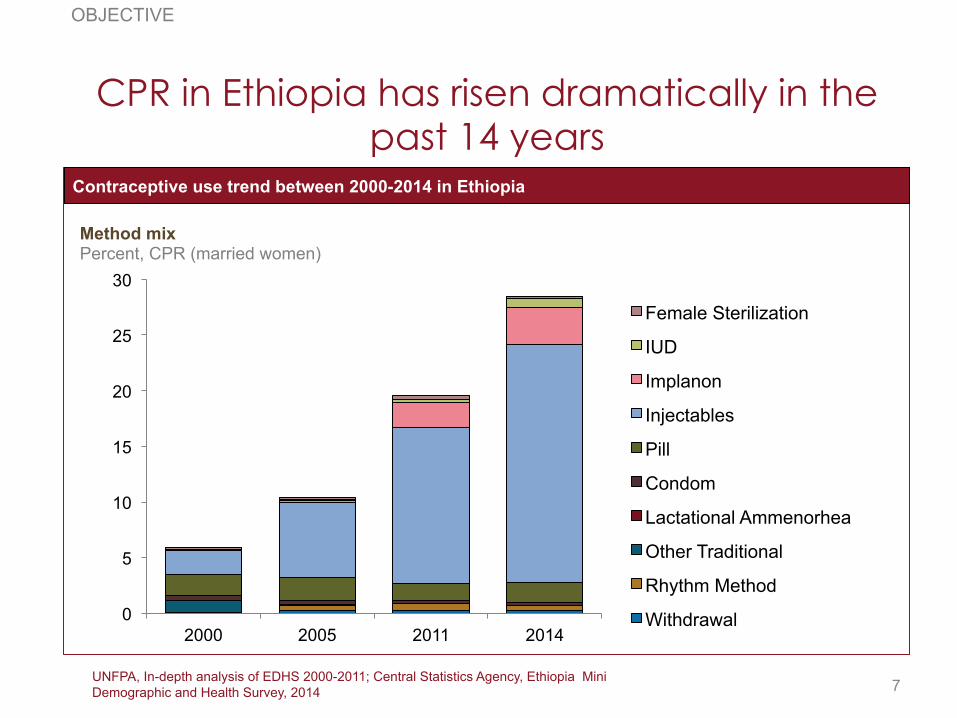
UNFPA, In-depth analysis of EDHS 2000-2011; Central Statistics Agency, Ethiopia Mini Demographic and Health Survey, 2014
CPR in Ethiopia has risen dramatically in the past 14 years
0
5
10
15
20
25
30
2000 2005 2011 2014
Female Sterilization
IUD
Implanon
Injectables
Pill
Condom
Lactational Ammenorhea
Other Traditional
Rhythm Method
Withdrawal
OBJECTIVE
Contraceptive use trend between 2000-2014 in Ethiopia
Method mix Percent, CPR (married women)
7

Total population and modern contraceptive users between 2000-2020 in Ethiopia
EDHS, 2000, 2005, 2011, mDHS 2014, Spectrum population projection
Still, CPR must increase significantly to reach Ethiopia’s FP objective of 55% CPR by 2020
0
2
4
6
8
10
12
14
16
18
2000
20
01
2002
20
03
2004
20
05
2006
20
07
2008
20
09
2010
20
11
2012
20
13
2014
20
15
2016
20
17
2018
20
19
2020
CPR Total
OBJECTIVE
To reach the 55% objective, 3 million additional married women will need access to FP by 2020
Number of married women of reproductive age, total and users of modern contraceptives Million
8

UNFPA, DHS 2000 – 2011 In-Depth Analysis
Limiting
Spacing
Filling existing demand is critical, but will not reach the 2020 objectives alone
Demand creation, access to limiting and spacing will all be key parts of FP scale-up
28.6 16.3
9
53.9 55
0
10
20
30
40
50
60
2011 CPR Unmet Need Potential CPR 2020 Objective
DEMAND
2020 Objective Compared to 2011 CPR and Unmet Need
2011 CPR and Unmet Need Percent, women (married)
9

Central Statistics Agency, Ethiopia Mini Demographic and Health Survey, 2014
Knowledge of contraceptive methods: 96% of women know at least one method, but
significantly less know LARM
96.3
73.8
87.2 92.9
71.8
38.4 38.6
52.1
Any Method Condom Pill Injectables Implants IUD Sterilization Any traditional method
5
Short- Acting Methods Long-Acting Methods
DEMAND
Knowledge of contraceptive method, 2014
Knowledge of contraception, by method type Percent, women (married)
10

Central Statistics Agency, Ethiopia Mini Demographic and Health Survey, 2014
Majority of contraceptive users in Ethiopia use short-acting methods, with 77% of
modern method users relying on injectables
DEMAND
Contraceptive use in Ethiopia, 2014
Modern method mix Percent, CPR (married women)
40.4
31.0
2.6 0.3
5.0 1.1 0.1
IUD Female Sterilisa-
tion
Implants Male Condom
Pill Injectables Any modern method
84% of Ethiopian women using modern methods rely on short-acting methods
11

30.3
20.3 21.5 15.8
11.6 7.8
1.5
2.4
1.5 5.1
9.8 15.8 19.9
13.7
Central Statistics Agency, Ethiopia 2011 Demographic & Health Survey
Younger women want to space pregnancies, and older women want to limit
35-39 30-34 25-29 20-24 15-19 40-44 45-49
Unmet need to space Unmet need to limit
Unmet need amongst married women of reproductive age by age group, 2011 Percent, women (married)
7.8 0.9
12.2 8.1
30.4
7.9
22.0
6 or more 5 4 3 2 1 0 children
Ideal number of children1
Percent, women (married)
1 Does not sum to 100% due to non-numerical answers and rounding
DEMAND
12
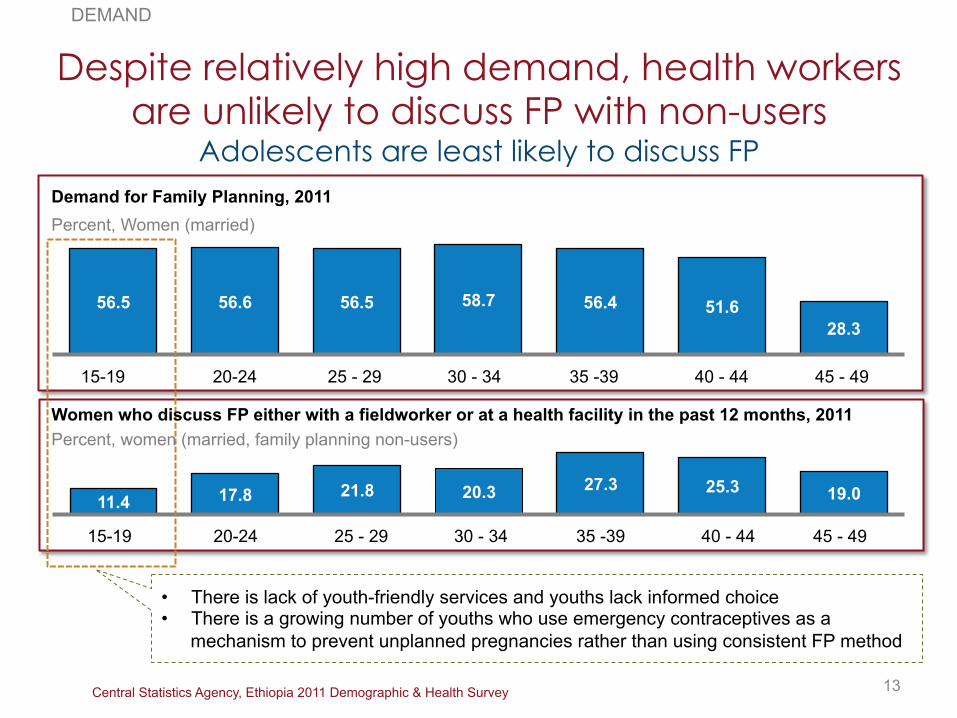
Central Statistics Agency, Ethiopia 2011 Demographic & Health Survey
Despite relatively high demand, health workers are unlikely to discuss FP with non-users
Adolescents are least likely to discuss FP
DEMAND
56.5 56.6 56.5 58.7 56.4 51.6 28.3
Demand for Family Planning, 2011 Percent, Women (married)
45 - 49 40 - 44 35 -39 30 - 34 25 - 29 20-24 15-19
11.4 17.8 21.8 20.3 27.3 25.3 19.0
45 - 49 40 - 44 35 -39 30 - 34 25 - 29 20-24 15-19
13
Percent, women (married, family planning non-users) Women who discuss FP either with a fieldworker or at a health facility in the past 12 months, 2011
• There is lack of youth-friendly services and youths lack informed choice • There is a growing number of youths who use emergency contraceptives as a
mechanism to prevent unplanned pregnancies rather than using consistent FP method
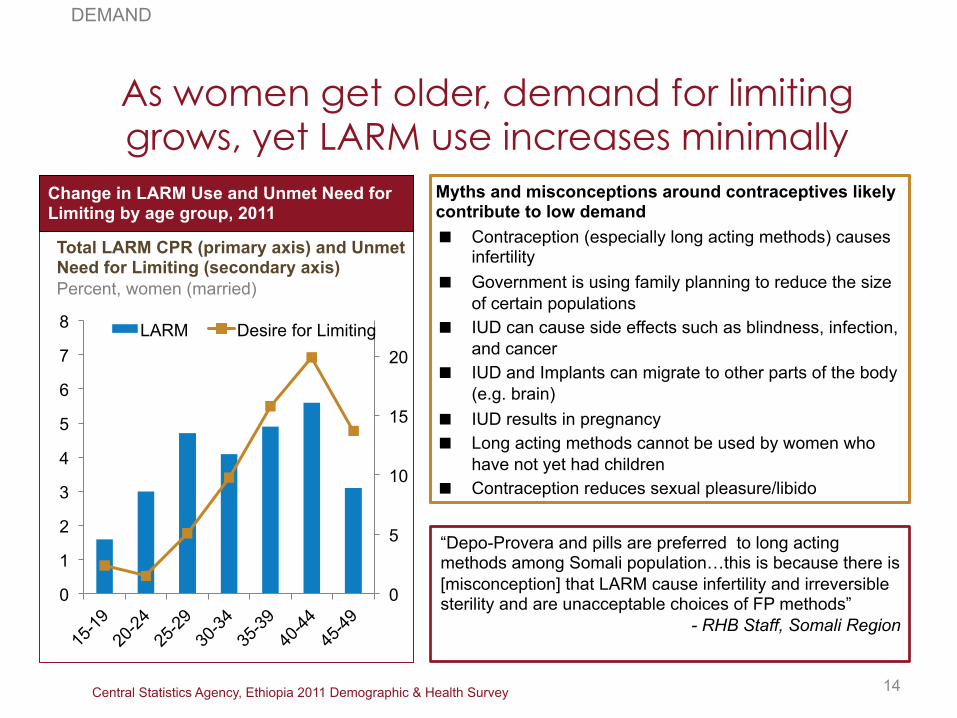
Central Statistics Agency, Ethiopia 2011 Demographic & Health Survey
As women get older, demand for limiting grows, yet LARM use increases minimally
0
5
10
15
20
0
1
2
3
4
5
6
7
8 LARM Desire for Limiting
DEMAND
Change in LARM Use and Unmet Need for Limiting by age group, 2011
Total LARM CPR (primary axis) and Unmet Need for Limiting (secondary axis) Percent, women (married)
14
Myths and misconceptions around contraceptives likely contribute to low demand Contraception (especially long acting methods) causes
infertility Government is using family planning to reduce the size
of certain populations IUD can cause side effects such as blindness, infection,
and cancer IUD and Implants can migrate to other parts of the body
(e.g. brain) IUD results in pregnancy Long acting methods cannot be used by women who
have not yet had children Contraception reduces sexual pleasure/libido
“Depo-Provera and pills are preferred to long acting methods among Somali population…this is because there is [misconception] that LARM cause infertility and irreversible sterility and are unacceptable choices of FP methods”
- RHB Staff, Somali Region

UNFPA, In-depth analysis of EDHS 2000-2011; Central Statistics Agency, Ethiopia Mini Demographic and Health Survey, 2014; Interviews with regional health bureaus
CPR varies significantly by region, but most saw growth over the last 14 years
0
10
20
30
40
50
60
70 2000 DHS 2005 DHS 2011 DHS 2014 MDHS
DEMAND
CPR Growth Trend between 2000-2014
CPR, by region Percent, women (married)
15
Regions have taken various FP approaches to increase demand Addis Ababa took a three-layered
IEC/BCC approach to create demand Several regions upgraded
infrastructure to provide privacy during counseling and service provision, improving quality
Benshangul-Gumuz RHB worked with religious leaders to improve acceptability of FP within the community
Dire-Dawa RHB expanded service provision at non-healthcare facilities, such as workplaces and schools to improve access
Oromia RHB noted effective coordination among partners as key to smooth program implementation

Central Statistics Agency, Ethiopia 2011 Demographic & Health Survey
FP use varies among religious groups Many religious leaders oppose use of Family Planning
Orthodox 47%
Protestant 22%
Catholic 1%
Muslim 28%
Traditional 1%
Other 1%
Religion in Ethiopia, 2011
Population Distribution, by Religion Percent, women (age 15-49)
18.5 15.8
12.0 11.9 7.6 5.8
3.6
2.9
3.9 1.7
1.2
0.9
1.0
1.1
0.7
3.7
0
5
10
15
20
25
Short Term Long Term Other
Contraceptive Use by Religion, 2011
Method Mix, by Religion Percent, women (age 15-49)
16
DEMAND

Central Statistics Agency, Ethiopia 2011 Demographic & Health Survey
Unmet need varies by religion IEC/BCC should respond to the varying religious
background
4.8 3.9 4.8 3.9 6.2 7.1 7.3
Average Orthodox Protestant Catholic Muslim Traditional Other
Total Fertility Rate by Religion, 2011
Average number of children
25.8 23.3 26.3 28.4 31.0 35.3 30.5
Average Orthodox Protestant Catholic Muslim Traditional Other
Unmet Need by Religion, 2011
Percent, women (married)
17
DEMAND

Central Statistics Agency, Ethiopia 2011 Demographic & Health Survey
Women’s role in decision making around their own reproductive health is critical to
successfully increasing FP uptake
18
FP Trends based on Women’s Empowerment, 2011
16.3 24.6
33.7
5.6 5.0
4.7
0 2-3 3
28.5 27.5 23.2
# household decisions in which women participate
In a male-dominated society, such as in the pastoralist regions, women have limited decision-making powers over contraceptive use
Women travel long distances to get FP services; they have great interest in using FP services, but would like to keep it a secret
The success of the three-layered BCC/IEC approach Addis Ababa City Administration shows how important it is to target individuals, families, facilities, and communities to increase FP uptake
CPR Percent, women (age 15-49)
Desired number of children women (age 15-49)
Unmet need Percent, women (age 15-49)
When women are empowered within their households and community: FP uptake increases and unmet need
decreases Desired number of children decreases

3rd level
2nd level
Primary Health Care Unit
(PHCU)
Health Sector Transformation Plan V (draft) Growth and Transformation Plan Annual Progress Report for FY 2012/13
Access has improved through PHCU, but LARM service delivery points are still lacking
19 Available in rural areas
SERVICE DELIVERY AND ACCESS
Steriliza-tion (f) IUDs
Injecta-bles Implants
Some HEWs are currently being trained to offer implanon insertion, however referral to the Health Centre is required for removal
Condoms (m) Pills
Steriliza-tion (m) Description
Health posts (HPs)
▪ Provides preventative services and promote health; limited curative and rehabilitative services
▪ Catchment pop: 3,000-5,000 (~5 HPs for one HC)
▪ 32,252 HEWs deployed in rural areas and 4,084 in urban areas in 2012/13
Zonal Hospital
▪ Provides sub-specialized referral services
▪ Catchment pop: 1-1.5 million
Specialized Hospital
▪ Provides specialized health services ▪ Catchment pop: 3.5– 5 million
▪ Organizes community for learning and cooperative action
▪ Volunteers within 0.5-1km distance form one-to-five networks
▪ One village has one health development teams of about 25-30 households with 5-6 networks
Health Development
Army
District Hospital
▪ Provides most health services and able to support referrals from HCs
▪ Catchment pop: 250,000
Health Centers (HCs)
▪ Promotes health, prevents diseases, and provide basic curative services
▪ First referral points for HPs ▪ Catchment pop: 15,000-25,000
16,048
Number of facilities, 2013
~2,026,474
3,100
▪ 2 Health Extension Workers
Typical staff/training
▪ Community-based volunteers
▪ Nurse ▪ Midwife ▪ Clinical officer ▪ General Medical
Officers
▪ Nurse ▪ Midwife ▪ Clinical officer
Methods offered, although not necessarily in stock or providers trained
▪ Nurse ▪ Midwife ▪ Clinical officer/
Medical Licentiate ▪ Specialized Doctors
(Obstetricians and Gynecologists)
1st level
Long-acting methods Short-acting methods
93.4% PHCU coverage in 2012/13
While most HEWs are female, In some regions, such as Afar, many of the HEWs are men, making it a barrier to FP service expansion, as women do not feel comfortable seeking information from men

1&2: Health and Health Indicators 2012; 3: MOH 2012 Health Facility List; 4: 2007 Census and 2011 National Statistics
HEW Program aims to increase access in rural areas, but their current distribution is not proportionate to population density
20
Pop density4, # per sq km
Health Facility3, # per mn pop
Nurse/ Midwife2, # per 10k pop
HEW1, # per 10k pop Region
1.0
3.0
3.7
3.9
3.9
4.1
4.4
4.6
4.6
6.1
8.9
SNNP
Affar
Oromia
Harari
Amhara
Tigray
Benishangul
Addis Ababa
Gambela
Somali
Dire Dawa 3.9
8.1
3.8
9.5
10.3
17.3
3.4
3.4
5.2
8.0
6.7
33.2
46.6
43.2
42.2
35.7
48.7
42.8
47.7
44.6
90.9
43.0
219
16
5
111
141
5,198
19
15
549
104
SERVICE DELIVERY & ACCESS
5,198
These sparsely populated regions need more HEWs
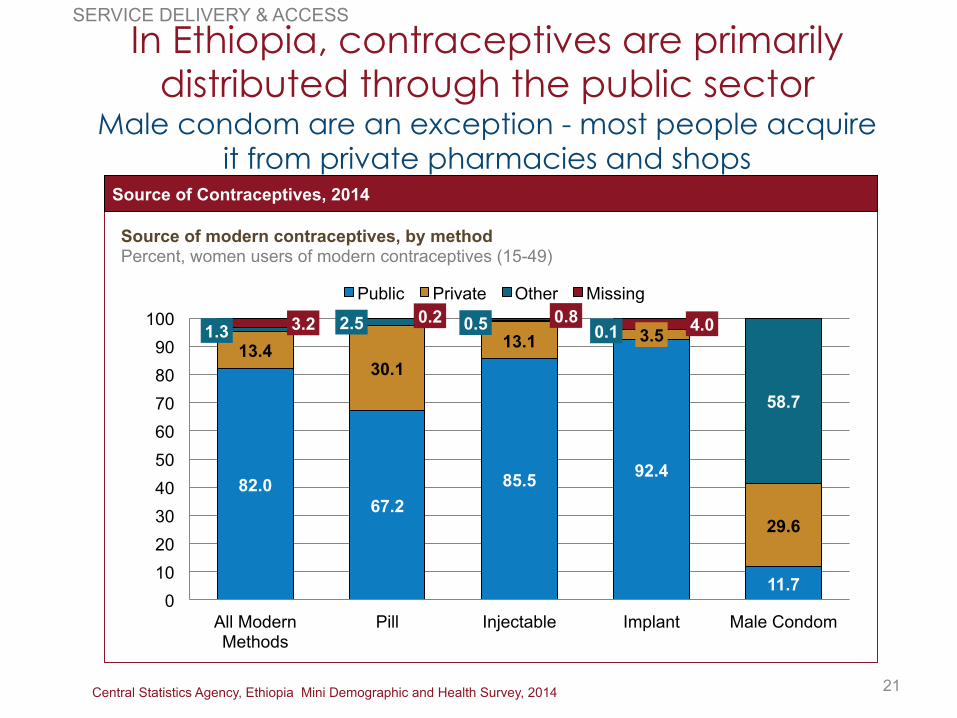
Central Statistics Agency, Ethiopia Mini Demographic and Health Survey, 2014
In Ethiopia, contraceptives are primarily distributed through the public sector
Male condom are an exception - most people acquire it from private pharmacies and shops
SERVICE DELIVERY & ACCESS
82.0 67.2
85.5 92.4
11.7
13.4 30.1
13.1 3.5
29.6
1.3 2.5 0.5 0.1
58.7
3.2 0.2 0.8 4.0
0 10 20 30 40 50 60 70 80 90
100
All Modern Methods
Pill Injectable Implant Male Condom
Public Private Other Missing
21
Source of Contraceptives, 2014
Source of modern contraceptives, by method Percent, women users of modern contraceptives (15-49)
Interview, PFSA, September 23, 2014; Growth and Transformation Plan Annual Performance Report
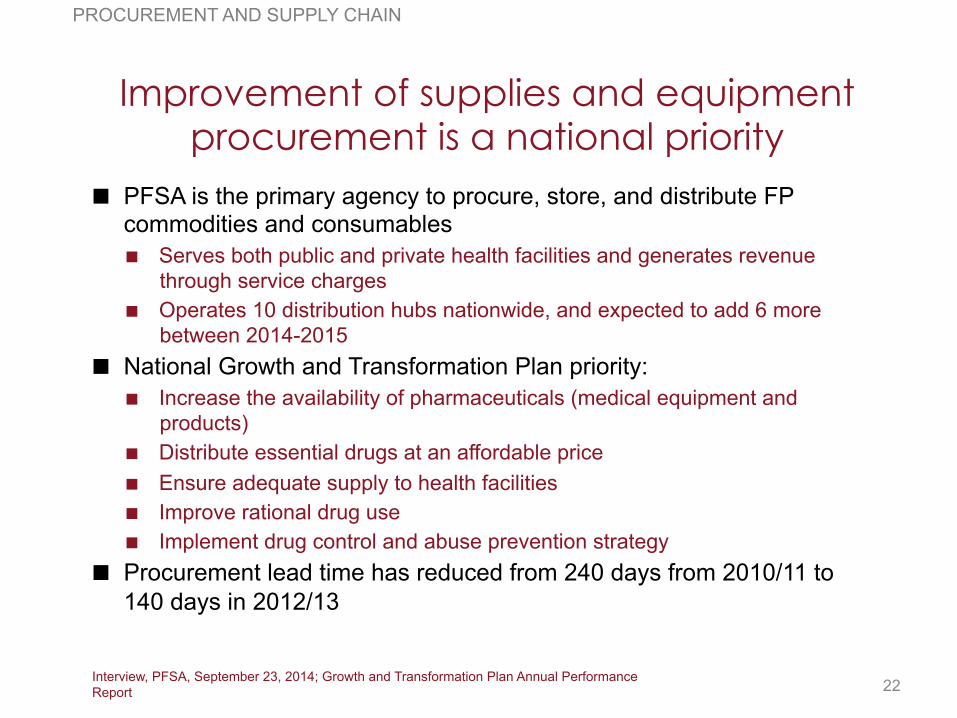
PFSA is the primary agency to procure, store, and distribute FP commodities and consumables Serves both public and private health facilities and generates revenue
through service charges Operates 10 distribution hubs nationwide, and expected to add 6 more
between 2014-2015 National Growth and Transformation Plan priority:
Increase the availability of pharmaceuticals (medical equipment and products)
Distribute essential drugs at an affordable price Ensure adequate supply to health facilities Improve rational drug use Implement drug control and abuse prevention strategy
Procurement lead time has reduced from 240 days from 2010/11 to 140 days in 2012/13
Improvement of supplies and equipment procurement is a national priority
PROCUREMENT AND SUPPLY CHAIN
22

JSI DELIVER Project Contraceptive Security Indicators Dashboard; JSI DELIVER Project, Health Logistics Quarterly, Ethiopia Vol 6. No 2.
All FP commodities were in-stock at the central level throughout FY2014 Less than 5% of the public health facilities had stock-outs of FP commodities
Majority of the stock-outs were seen in emerging regions
Health commodity management information system is being rolled out However, currently, distribution does not seem to align with need, effecting method choice In some districts, facilities rely on implementing partners to fill gaps in commodity supply Supply chain management system must be further strengthened
Stock-outs are less common, but they are still a challenge in the emerging regions
Availability of FP commodities in health facilities % of health facilities with commodity out of stock at time of Visit, April 2013 – March 2014
0.3 1.4 0.9 1.3
2.6
0.6 1.4 1.4
0.6
3.5
0.3
6.4
0.5 0.3
5.1
0.5
7.6
2.1 1.1
2.6
Injectables Pills Condoms Implants IUCD
Apr-Jun
Jul-Sep
Oct-Dec
Jan-Mar
PROCUREMENT AND SUPPLY CHAIN
23

FP is seen as a key policy objective, with FP targets included in many health and
national strategies and plans
POLICY AND ENVIRONMENT
“High fertility ranks second only to HIV/AIDS as the greatest perceived threat to individual and social well-being” Three broad strategies of FP: • Create acceptance and demand for FP, with special emphasis on populations rendered vulnerable by
geographic dispersion, gender, and wealth • Increase access and utilization of quality FP services, particularly for married and unmarried young
people and those who have reached desired family size • Delegate to the lowest service delivery level possible, the provision of all FP methods, especially long-
term and permanent methods, without compromising safety or quality of care
The National Reproductive Health Strategy, 2006-2015, is the guiding policy for FP
• Maternal and neonatal health one of the six strategic health areas of focus to improve equitable utilization with set targets for 2020 for CPR and TFR
The Health Sector Transformation Plan V (Draft)
• Increasing family planning services (CPR) is one of eight targets set for health • Highlights population and development as a key cross-cutting issue; notes that effective family planning
program is essential to improve all citizen’s living conditions while managing the capacity to develop and use natural resources
The Growth and Transformation Plan
24

Commitments made at July 2012 London Summit on Family Planning
At the London Summit on Family Planning, Ethiopia made significant commitments to
expand access to FP
POLICY AND ENVIRONMENT
Increase CPR from 29% (in 2011) to 69% in 2015 Reduce TFR from 4.8 (in 2011) to 4 in 2015 Reach 6.2 million additional women & adolescent girls with FP services
Overall Objectives:
Financial Commitments
Program & Service Delivery Commitments: Ensure Family Planning Commodity Security Increase uptake of long-acting reversible methods Expand youth-friendly services, with a focus on adolescent girls Scale up delivery of services to hardest to reach groups Monitor availability of contraceptives
Increase the budget allocation for FP annually
25

Demand: Should FP guidance/policies be developed specifically for married adolescents, unmarried women and youth to facilitate demand creation?
Access: How can long acting and permanent methods be prioritized while maintaining equitable access to all methods?
Supply chain: Procurement and Supply Chain by Private Health Sectors to Public Health Facilities
Health finance: Should insurance and/or out-of-pocket payment play a role in financing FP programs with a view for sustainability?
Coordination: How can coordination with the private sector support the governance and leadership of the FMOH in FP programs?
Yet, details that have programmatic effect have not been clarified
26
POLICY AND ENVIRONMENT

Ethiopia Federal Ministry of Health. April 2014. Ethiopia’s Fifth National Health Accounts 2010/2011
Health expenditure has increased, but yet to meet national target
FINANCING
Total Health Expenditure by Funding Source (million Birr)
Gov’t
Donor HH
Other 2% 31% 37% 31% 22%
39%
37%
1%
1%
16%
50%
34%
4.5
11.1
26.5
2004/05 2007/08 2011/12
Total health expenditure doubled between 2007/08 and 2011/12 primarily through donor support
However, the government’s share of total health expenditure has decreased More than half of the government contribution to health care is
from regional and local governments
Total health expenditure amounts to 5.4% of GDP, surpassing WHO recommendation of 5%
However, total government expenditure on health of Birr 4.1 billion is still only 5.6% of total government budget
HSDP-IV Health Finance Targets Increase per capita expenditure on health from US$16.1 to US
$32.2 Increase government expenditure on health budget as a
proportion of total budget from 5.6% to 15% Increase proportion of public health facilities retaining and
using their revenue from 20% to 100% Increase proportion of people enrolled in health insurance from
1% to 50% Increase health budget utilization rate to 90%
27

Ethiopia Federal Ministry of Health. April 2014. Ethiopia’s Fifth National Health Accounts 2010/2011
FP is heavily reliant on donor and out-of-pocket funding, and majority of funds is
used by the public sector
FINANCING
Total RH Health Expenditure: Birr 3.5 billion RH spending, which includes FP services, has remained static at 13% of Total Health Expenditure since 2007
Public
Rest of the World
Household
Private (non-HH)
Source of RH Funds
28%
3%
47%
21% Fed Gov’t
OOP
Management Agent of RH Funds
16%
3%
18%
31%
Rest of the World
NGO
3%
28%
Private
Non-Fed. Gov’t
Public Facilities
Other
User of RH Funds
15%
16%
12%
38%
Public Health
19%
Gov’t Admin
Private Facilities
28

Interview, PFSA, September 23, 2014; JSI DELIVER Project Contraceptive Security Indicators Dashboard; RHInterchange
Although basket fund procurement mechanism was established in 2006/07, various donors procure FP commodities through various mechanisms Global Fund procures commodity through PFSA, while UNFPA and social franchises procure by
themselves FP procurement has been volatile, but government financing has grown in recent years Distribution of drugs and medical equipment supplies to public health facilities:
2010/11: Birr 3.5 billion 2012/13: Birr 6.77 billion
Government ownership of FP procurement has increased, but fragmentation still exist
Contraceptive financing by
source Millions USD
12.8 20.9
9.5 16.6 21.4
13.5 (42%)
6.0
6.0
2.8 9.7
11.4 4.8 6.8 (21%)
3.0
3.5
3.6 9.3
29.2
8.5 9.5 (30%)
6.1
0.2
2.1 (6%)
2008 09 10 11 12 13 Average
Other
UNFPA
USAID
Government
21.8
36.5
16.1 19.0
57.1
34.8 32.0
29
FINANCING

Interviews with regions
Addis Ababa secured an ear-marked budget for FP programs in 2012 Budget to grow to Birr 3.3 million in 2015 Budget supports commodities and training
SNNPR also has a direct FP budget [hopefully get more details through
Mekonnen’s notes] Amhara also allocates a budget for FP
programs as part of the General Financing System for Reproductive Health Programs Budget used primarily for commodity
procurement
Regional resource mobilization for FP is critical to program sustainability
Most regions do not yet have a line item for FP
FINANCING
30
However, most regions still do not have their own ear-marked budget for FP programs Regional officials have many competing
priorities with FP programs & topic is controversial that prioritization of FP through budget line item is challenging
For regions with budgets, it is still insufficient, and budget line items for consumables must also be added to ensure consistent and high quality FP service delivery
Some successes… But many more challenges…

Regional Landscape Interviews, January 2015; Growth and Transformation Plan Annual Performance Report
HMIS available nationwide, but consistent data reporting is lacking, and data is not
always used in making decisions
HMIS indicators have been recently revised at the Federal level
At the regional level, data collection and use is frequently inadequate
There is low capacity for data analysis and use in decision making at the regional and woreda levels For example, Contraceptive Acceptance
Rate coverage was slow to increase in the first 3 years of the GTP, partly due to the information not appropriately recorded and reported through the HMIS
31
MONITORING, DATA, AND COORDINATION
69
87
75
97
Hospital Health Center
2012/13 2010/11
HMIS Performance at Facilities
Percent, Public Facilities with HMIS

Coordination between relevant ministries at Federal level is poor
Coordination between IPs, donors etc at federal level is also poor
Coordination at regional level between government sectors and the various actors including IPs is poor, regions don’t have a well functioning TWGs
Lack of adequate technical support from the MoH to the regional health bureaus
No FP focal person at regional health bureaus which is creating a challenge to facilitate FP activities including coordination at regional level
Federal and regional coordination
32

2005 and 2011 DHS; Growth and Transformation Plan
Private sector now provide approximately one third of all health service provision
NGOs and the national social marketing program have generated a quarter of total CYP
GTP highlights the potential contribution of the sector in pharmaceutical production and service provision
Yet, does not further delineate the specific role and services it should target or market segment that the private sector can be serving
Private sector is growing and actively providing services; key policies value the sector, but their role is yet to be defined
MONITORING, DATA, AND COORDINATION
27.0
10.6
20.3
30.2
13.1
3.5
29.6
Pill Injectables Implants Male Condom
2005 2011
33
FP obtained through private facilities, by method
Percent, women (married)

Partner Landscape

We interviewed 30+ organizations Organizations Names
Government
MOH Berhane Assefa
PFSA Yemaneberhan Tadesse
Pop. & Dev. Directorate Alula Sebhatu; Fikre Gesso
Organizations Names
NGOs
Abt Associates/ PHSP Tesfai Gabre-Kidan; Asfawossen
Addis Ababa U./ PMA2020 Assefa Seme; Solomon Shiferaw
CARE Sister Alemshet Mekonnen
DKT Dagnachew Alemayehu; Abdu Ebrahim; Dagmawit Girmay
DSW Marta; Tirsit Girshaw
EngenderHealth Jemal Kassaw
FHI 360/ PROGRESS Admassu ; Banchiamlak, Abner, Btelhem
Ipas Demeke Desta
Jhpiego Hannah Gibson; Alemnesh; Tigist
JSI/ DELIVER Paul Dowling; Woinshet Nigatu
JSI/ L10K Nebreed Fesseha; Meheret; Wuleta
Merck/MSD Tewodros Alemseged
MSI
Getachaw (Acting Director of Ops); Getachaw (Financial Analyst); Nils Gade
Pathfinder International Kidest Lulu
World Vision Etsub Brhanesilassie
Donors
Gates Foundation Monica Kerrigan; Clea Finkle
Packard Foundation Yemeserach Belayneh
UNFPA Muna Abdullah; Sufyan Abdulber; Beyeberu Assefa
USAID Elizabeth Haytmanek; Zewditu Kebede
WHO Luwam Teshome
CSOs
CORHA Dejene
Ethiopian Medical Assoc. Abiy; Yeneneh
Ethiopian Midwives Assoc. Mulatu Ayele; Meaza Semaw
Ethiopian Nurses Assoc. Asfaw Haileselassie
Ethiopian Public Health Assoc. Tesfa Demelew Taye
Ethiopian Soc. Ob/Gyn Dereje Negussie
Family Guidance Assoc. Ethiopia Genet; Desta; Haregewoin
Population, Health and Environment Consortium, Ethiopia (PHE)
Negash Teklu, Alem Mekonnen; Ahmed Mohammed
35

8 Major Priority Areas were Identified through Interviews
Demand Creation
Human Resources for Health
Service Delivery & Access
Procurement & Supply Chain
Leadership, Management & Coordination
Public-Private Partnerships
Financing
Data Demand and Information Use
36
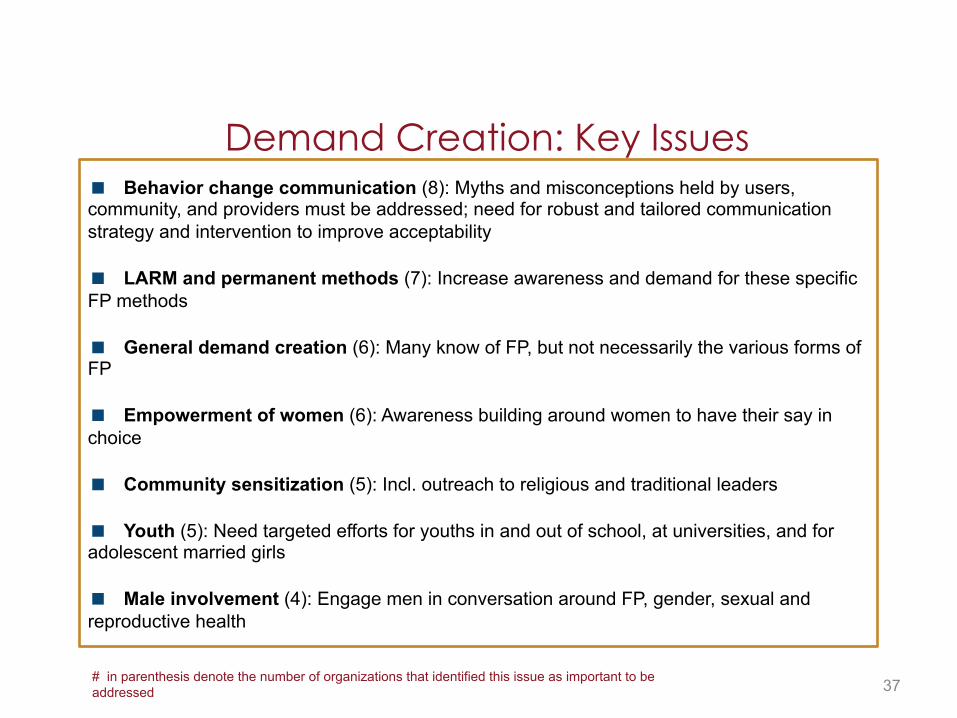
# in parenthesis denote the number of organizations that identified this issue as important to be addressed
Behavior change communication (8): Myths and misconceptions held by users, community, and providers must be addressed; need for robust and tailored communication strategy and intervention to improve acceptability
LARM and permanent methods (7): Increase awareness and demand for these specific FP methods
General demand creation (6): Many know of FP, but not necessarily the various forms of FP
Empowerment of women (6): Awareness building around women to have their say in choice
Community sensitization (5): Incl. outreach to religious and traditional leaders
Youth (5): Need targeted efforts for youths in and out of school, at universities, and for adolescent married girls
Male involvement (4): Engage men in conversation around FP, gender, sexual and reproductive health
Demand Creation: Key Issues
37

# in parenthesis denote the number of organizations that identified this issue as important to be addressed
Training and capacity building (11): Need for further increased pre- and in-service training, building in long-term and permanent methods into the training curriculums, and staffing each facility level with appropriately trained staff
Staff turnover (6): Need to understand why there is turnover and appropriately hire and assign staff to their positions
Human Resources for Health: Key Issues
38
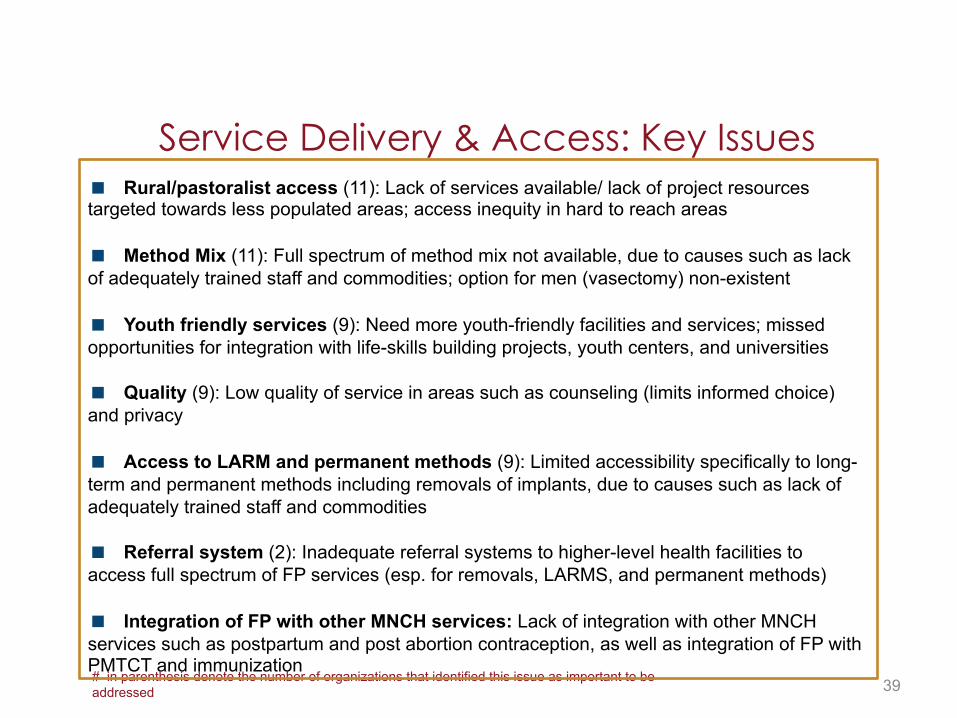
# in parenthesis denote the number of organizations that identified this issue as important to be addressed
Rural/pastoralist access (11): Lack of services available/ lack of project resources targeted towards less populated areas; access inequity in hard to reach areas
Method Mix (11): Full spectrum of method mix not available, due to causes such as lack of adequately trained staff and commodities; option for men (vasectomy) non-existent
Youth friendly services (9): Need more youth-friendly facilities and services; missed opportunities for integration with life-skills building projects, youth centers, and universities
Quality (9): Low quality of service in areas such as counseling (limits informed choice) and privacy
Access to LARM and permanent methods (9): Limited accessibility specifically to long-term and permanent methods including removals of implants, due to causes such as lack of adequately trained staff and commodities
Referral system (2): Inadequate referral systems to higher-level health facilities to access full spectrum of FP services (esp. for removals, LARMS, and permanent methods)
Integration of FP with other MNCH services: Lack of integration with other MNCH services such as postpartum and post abortion contraception, as well as integration of FP with PMTCT and immunization
Service Delivery & Access: Key Issues
39

# in parenthesis denote the number of organizations that identified this issue as important to be addressed
Distribution to health posts and HEWs (7): Geographical barriers and limited distribution mechanisms (e.g. only periodic drop-offs, rather than on demand) makes distribution challenging
Procurement (4): Need for streamlined procurement system and train staff so that facilities orders ahead of time to prevent stock-outs
Logistics Capacity (3): Not enough trained staff that can appropriately forecast use and procure at the facility level; lack of data and management capacity at the regional and national level to appropriately manage logistics
Procurement & Supply Chain: Key Issues
40

# in parenthesis denote the number of organizations that identified this issue as important to be addressed
Central-level coordination (8): Need for coordination within the government across various ministries (e.g. engagement of youth around FP with Ministry of Youth), and between government, donors, and partners (e.g. scheduled TWG meetings)
Coordination between government levels (6): While national-level FP commitment is strong, there is need for local-level ownership on FP initiative; need to build awareness around FP initiatives, need to focus building capacity of the leadership at all levels
Regional coordination (5): Similar to national FP TWG, platform for regional coordination for the government and partners to reduce duplication and eliminate gaps
Leadership, Management & Coordination: Key Issues
41

# in parenthesis denote the number of organizations that identified this issue as important to be addressed
Integration with national FP objectives (5): Private sector’s role in FP service provision unclear; segmenting the market and identifying where there could be a role for paid (subsidized) services
Enabling environment (3): Need for overarching strategy and direction to be established by the government on how to engage the private sector; more efforts needed for capacity building of private facilities, as well as monitoring and supervising private facilities
Improving accessibility (3): Unclear guidelines on what FP services could be provided through the private sector at each facility level
Public-Private Partnerships: Key Issues
42

# in parenthesis denote the number of organizations that identified this issue as important to be addressed
General Financing (9): Need to secure financing options for the long-term for the entire program, including more engagement and funding supported by the government for trainings and consumables necessary for FP service provision; consider covering FP service under the national health insurance scheme
Reproductive Health Commodity Security (8): Clear strategy to increase government funding towards RH commodity and supply and wean off of donor funding is necessary
Government line items for FP (7): Currently almost entirely donor dependent, and government should take ownership; limited number of regions have also delineated FP budget lines
Financing: Key Issues
43

# in parenthesis denote the number of organizations that identified this issue as important to be addressed
Monitoring capacity and data availability (4): HMIS is not fully functional at the facilities – information gaps are prevalent and interpretation of indicators vary from facility to facility; commodity availability data is only available at central-level, and facility-level data needs to be fed up to the central-level for better coordination and logistics management
Information on users (2): Lack of data around FP user’s reasons for selected method, reasons for discontinuation, etc.; need to invest more to understand target group (e.g. youth)
Research for program evidence building (2): Need to generate evidence around program effectiveness and identify most cost-effective programs
Data Demand and Information Use: Key Issues
44

www.healthpolicyproject.com
Thank You!
The Health Policy Project is a five-year cooperative agreement funded by the U.S. Agency for International Development under Agreement No. AID-OAA-A-10-00067, beginning September 30, 2010. The project’s HIV activities are supported by the U.S. President’s Emergency Plan for AIDS Relief (PEPFAR). It is implemented by Futures Group, in collaboration with Plan International USA, Futures Institute, Partners in Population and Development, Africa Regional Office (PPD ARO), Population Reference Bureau (PRB), RTI International, and the White Ribbon Alliance for Safe Motherhood (WRA).