ethiopia national quality infrastructure development in ethiopia...
TRANSCRIPT
Ethiopia National Quality Infrastructure Development in Ethiopia Concept Note
Application for Implementation Funding
Competitiveness Policy Evaluation Lab - ComPEL
Abstract (200 words) Low product quality – or inability to credibly signal high quality – may be a hindrance to firm
performance and exporting in developing countries. In this impact evaluation, we investigate
whether improving the “national quality infrastructure” (NQI) system in Ethiopia can promote
quality upgrading, firm growth, and exporting. The evaluation will take place in conjunction with the
World Bank-funded Ethiopia National Quality Infrastructure Development Project, which involves
capacity building in government agencies, procurement of testing equipment, and engagement with
the private sector. We propose two RCT designs. In the first, we offer priority access NQI services to
firms at the end of the domestic value chain in three priority sectors, and supplement this with
consulting on quality standards and improvement for a subset of firms. In the second, we look at the
whole value chain in the honey sector, and implement interventions at three levels: export
encouragement (priority access to NQI and consulting) for processors, mobile quality testing
equipment for traders, and agricultural extension services for farmers. This design allows us to test

2
ComPEL
Competitiveness Policy Evaluation Lab
hypotheses about interactions between access to NQI services and market failures further up the
supply chain that may limit access to high quality inputs.
3
ComPEL
Competitiveness Policy Evaluation Lab
Table of Contents Abstract (200 words) ..................................................................................................................................... 1
Table of Contents .......................................................................................................................................... 3
1. Background (0.5 - 1 page) ..................................................................................................................... 4
2. Intervention to be Evaluated (0.5 - 1 page) .......................................................................................... 5
3. Theory of Change (1 figure plus 1-2 paragraphs) ................................................................................. 6
4. Literature Review (1 page) .................................................................................................................... 5
5. Hypotheses and Evaluation Questions (0.5 page) ................................................................................ 9
6. Evaluation Design and Sampling Strategy (1-2 pages) ....................................................................... 10
6.1 Treatment and Control Groups ..................................................................................................... 12
6.2 Sample Size Calculations ............................................................................................................... 14
7. Data Collection (1 -2 pages) ................................................................................................................ 16
7.1 Quantitative Instruments .............................................................................................................. 16
7.2 Management of Data Quality ....................................................................................................... 19
7.3 Ethical Issues ................................................................................................................................. 19
7.4 Qualitative Instruments ................................................................................................................ 19
7.5 IE Implementation Monitoring System ......................................................................................... 19
8. Data Processing and Analysis (1-2 pages) ........................................................................................... 19
8.1 Data Coding, Entry, and Editing (optional) ................................................................................... 19
8.2 Model Specification for Quantitative Data Analysis ..................................................................... 20
9. Study Limitations and Risks (0.5 page) ............................................................................................... 21
10. Policy Relevance and Impact (1 page) ................................................................................................ 22
11. Dissemination Plan (0.5 page) ............................................................................................................ 23
12. Impact Evaluation and Related Teams ............................................................................................... 23
13. Budget ................................................................................................................................................. 24
14. Milestones, Deliverables, and Timeline .............................................................................................. 24
15. References .......................................................................................................................................... 25
16. Annexes............................................................................................................................................... 25
4
ComPEL
Competitiveness Policy Evaluation Lab
1. Background (0.5 - 1 page) Underdeveloped national quality infrastructure (NQI)1 in a developing country like Ethiopia may negatively affect a firm’s capability to explore commercial opportunities, to compete on global markets, and to participate in global value chains. Many firms face difficulties in demonstrating compliance with quality requirements and trade rules required by trading partners. Given the Ethiopian government’s strategic emphasis on the growth of light manufacturing, fostering product quality upgrading and awareness of and adherence to international product standards is crucial. However, complying with better product standards and quality practices is not a simple matter for many Ethiopian manufacturers. Many tests and certifications requested by buyers are not provided by any internationally recognized domestic institution, requiring firms to pay enormous costs to have tests done abroad if they want to comply. Additionally, some firms are uninformed about international quality expectations and standards, or may know about them but lack the expertise, and resources to adopt and implement them. Finally, compliance is often a function not just of the firm’s actions, but also of the quality of inputs available, which may be influenced by related market failures further up the supply chain.
In this impact evaluation, we propose to investigate whether improved access to internationally certified NQI services can improve firm performance and encourage exporting. We propose randomized controlled trial (RCT) designs that will enable us to analyze interactions between NQI services, which allow firms to credibly signal product quality to buyers, and other related constraints, such as knowledge about how to upgrade product quality and market failures in the domestic supply chain that affect input quality.
The main development challenges in the NQI in Ethiopia include the lack of adequate capacity to provide quality assurance services by the existing public institutions, inability to meet target market standards by industries, and prohibitive costs of compliance with international standards. While basic elements of the NQI system have been put in place in Ethiopia since its reform undertaken previously, the service delivery capacity of the NQI institutions is inadequate to support the competitiveness of industries. The NQI institutions lack capacity in human resources, the facility to ensure accurate measurement, well-equipped laboratories to meet industries’ demands, as well as coordination and collaboration with regulatory bodies to implement quality assurance services.
The development objective of the linked WBG project is to improve the delivery of quality assurance services to enterprises in targeted sectors: (i) leather and leather products; (ii) textile and garments; and (iii) agro-processed products. The proposed project will contribute to the achievement of the Government of Ethiopia’s growth strategy formulated within its second Growth and Transformation Plan (GTP II), which focuses on structural transformation from an agrarian to an industrialized economy. Improving the export sector is among the major targets of the Government in its strategy. In this regard, high attention has been given to increasing value-added exports by improving product quality, grading, and standards. The project will provide support to improve the delivery of quality assurance services supplied by the existing Ethiopian NQI institutions and increase demand from enterprises in the targeted sectors.
Setting up the QI system has been considered an effective tool for development, since a functioning QI helps increase competitiveness in manufacturing and service delivery in a context of rapid growth of global trade and value chains. This, in turn, increases productivity, helps create employment, and
1 QI is defined as an institutional framework that establishes and implements a number of interlinked activities among standardization, accreditation, metrology, and conformity assessment (testing, inspection, and certification).
5
ComPEL
Competitiveness Policy Evaluation Lab
encourages investment. However, the majority of previous QI projects, which were financed by the Bank and other donor agencies, was focused on the upgrading of the legislative framework and institutional capacity building of QI institutions and less focused on the creation of industry demand for QI services, resulting in sustainability challenges for QI institutions. The associated project of this IE was designed to address gaps in the supply and demand side of the QI services. Also, to the team’s knowledge, no concrete IE has been done with interventions related to QI services.
In the second evaluation design proposed below, we focus on the honey sector due to its economic importance, the relative simplicity of the production process and domestic supply chain, and the reported relevance of quality and accredited quality testing as a current constraint to exporting. Ethiopia is the world’s 10th largest honey producer, and the largest in Africa. 1.8 million households in Ethiopia are engaged in apiculture, and for smallholders earnings from beekeeping makes up nearly half of their total cash income. It is particularly important as a source of income for landless households or small landholders, and is a drought-resistant agricultural activity that is important across many regions of Ethiopia and around the world. Stakeholders in the honey sector in Ethiopia report that quality is a major constraint to exporting, and that the lack of accredited domestic testing services make it difficult to export to Europe and other places with mandatory legal standards for honey.
2. Intervention to be Evaluated (0.5 - 1 page) The proposed interventions take place within the establishment of the new Ethiopia National Quality Infrastructure (ENQI) agencies, as planned in the World Bank loan project. While there are four principal agencies, the two most relevant to this IE are the Ethiopia Conformity Assessment Enterprise (ECAE) and the National Metrology Institute of Ethiopia (NMIE). The former conducts product testing and certification, while the latter certifies the accuracy of machinery. In this concept note, two IE designs are proposed with the possibility of both taking place concurrently. The concept note proposes a pilot survey to fill in some of the knowledge gaps that will assist the team in deciding on the feasibility of each design. The survey would focus largely on firm demands for ENQI services and how much product testing acts as a barrier to their decision to export or improve quality.
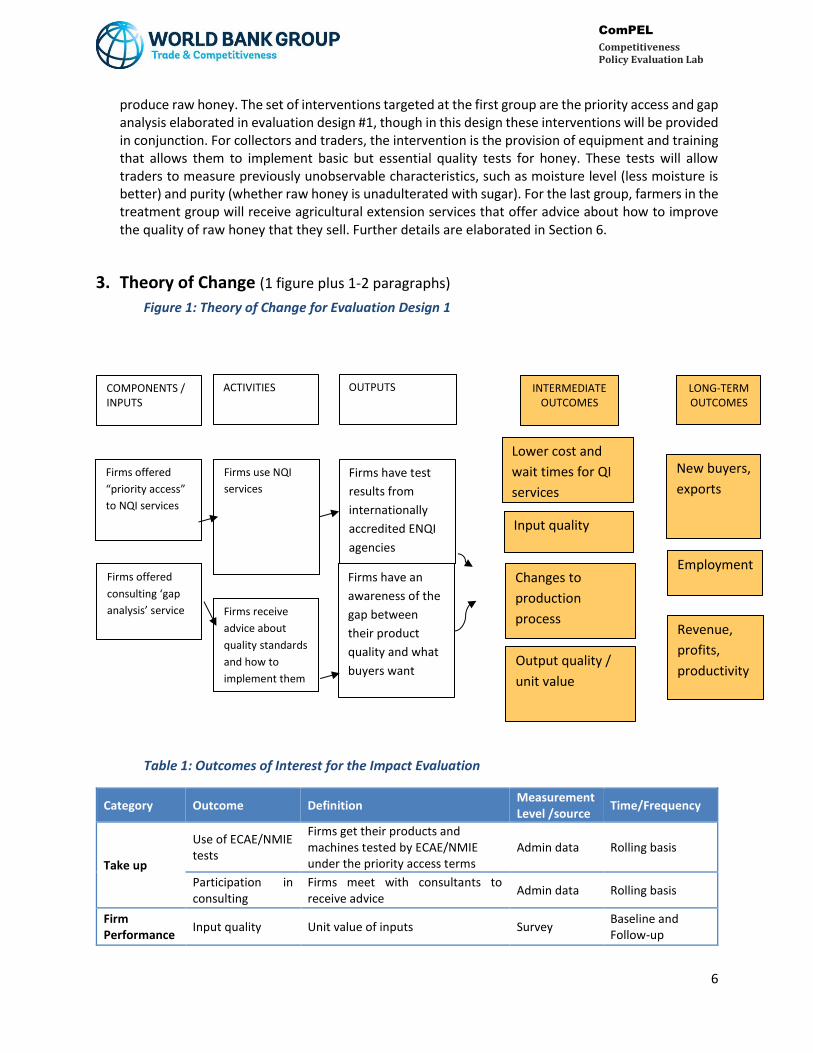
Details of the interventions are described in Section 6.1. For evaluation design #1, there are two interventions: (i) priority access to internationally recognized QI services in Ethiopia, where priority access is expected to mean lower prices and faster processing time; and (ii) provision of tailored “gap analysis” in which firms receive advice about mandatory standards and typical buyer expectation in destination markets of interest to the firm, an assessment of how their current products and production process compare to those requirements, and advice about what steps they could take to close that gap. The team’s hypothesis is that priority access will increase usage of QI services, induce product quality upgrading, and lead to improvements in firm performance (as measure by profits, productivity, and exporting). A supplementary hypothesis is that firms may lack not only the ability to signal quality to buyers, but also lack knowledge about quality standards or how to implement them. The consulting treatment allows us to test whether improved NQI services are more valuable in conjunction with an intervention that relaxes this constraint. This intervention targets manufacturing firms at the end of the domestic value chain in the government’s three priority sectors: agro-processing, leather and leather goods, and textiles and garments.
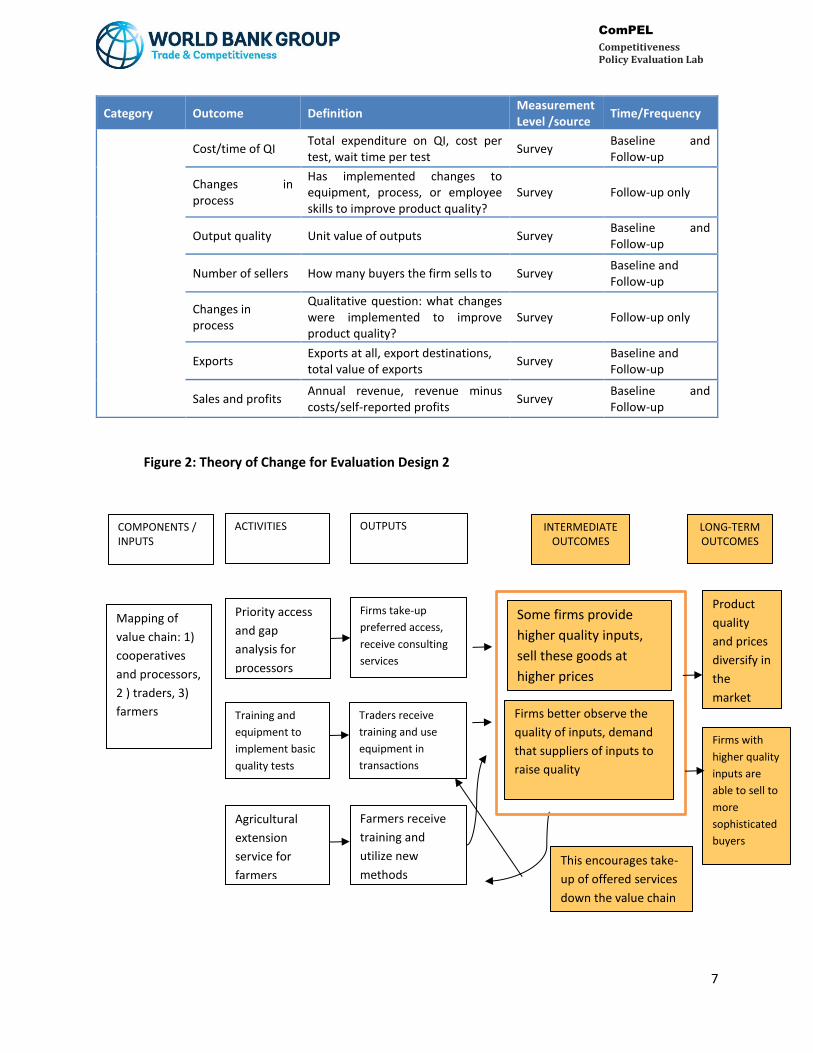
For evaluation design #2, there are three sets of interventions, each corresponding to each level of the value chain: 1) cooperatives and processing firms, 2) collectors and traders, and 3) farmers who
6
ComPEL
Competitiveness Policy Evaluation Lab
produce raw honey. The set of interventions targeted at the first group are the priority access and gap analysis elaborated in evaluation design #1, though in this design these interventions will be provided in conjunction. For collectors and traders, the intervention is the provision of equipment and training that allows them to implement basic but essential quality tests for honey. These tests will allow traders to measure previously unobservable characteristics, such as moisture level (less moisture is better) and purity (whether raw honey is unadulterated with sugar). For the last group, farmers in the treatment group will receive agricultural extension services that offer advice about how to improve the quality of raw honey that they sell. Further details are elaborated in Section 6.
3. Theory of Change (1 figure plus 1-2 paragraphs)
Table 1: Outcomes of Interest for the Impact Evaluation
Category Outcome Definition Measurement Level /source
Time/Frequency
Take up
Use of ECAE/NMIE tests
Firms get their products and machines tested by ECAE/NMIE under the priority access terms
Admin data Rolling basis
Participation in consulting
Firms meet with consultants to receive advice
Admin data Rolling basis
Firm Performance
Input quality Unit value of inputs Survey Baseline and Follow-up
LONG-TERM OUTCOMES
INTERMEDIATE OUTCOMES
OUTPUTS
Firms have test
results from
internationally
accredited ENQI
agencies
Input quality
ACTIVITIES
Firms use NQI
services
Firms receive
advice about
quality standards
and how to
implement them
Changes to
production
process
Firms have an
awareness of the
gap between
their product
quality and what
buyers want
COMPONENTS / INPUTS
Firms offered
“priority access”
to NQI services
Firms offered
consulting ‘gap
analysis’ service
Employment
New buyers,
exports
Output quality /
unit value
Figure 1: Theory of Change for Evaluation Design 1
Lower cost and
wait times for QI
services
Revenue,
profits,
productivity
7
ComPEL
Competitiveness Policy Evaluation Lab
Category Outcome Definition Measurement Level /source
Time/Frequency
Cost/time of QI Total expenditure on QI, cost per test, wait time per test
Survey Baseline and Follow-up
Changes in process
Has implemented changes to equipment, process, or employee skills to improve product quality?
Survey Follow-up only
Output quality Unit value of outputs Survey Baseline and Follow-up
Number of sellers How many buyers the firm sells to Survey Baseline and Follow-up
Changes in process
Qualitative question: what changes were implemented to improve product quality?
Survey Follow-up only
Exports Exports at all, export destinations, total value of exports
Survey Baseline and Follow-up
Sales and profits Annual revenue, revenue minus costs/self-reported profits
Survey Baseline and Follow-up
LONG-TERM OUTCOMES
INTERMEDIATE OUTCOMES
OUTPUTS
Firms take-up
preferred access,
receive consulting
services
ACTIVITIES
Priority access
and gap
analysis for
processors
Training and
equipment to
implement basic
quality tests
Agricultural
extension
service for
farmers
Traders receive
training and use
equipment in
transactions
Farmers receive
training and
utilize new
methods
COMPONENTS / INPUTS
Figure 2: Theory of Change for Evaluation Design 2
Mapping of
value chain: 1)
cooperatives
and processors,
2 ) traders, 3)
farmers Firms better observe the
quality of inputs, demand
that suppliers of inputs to
raise quality
This encourages take-
up of offered services
down the value chain
Some firms provide
higher quality inputs,
sell these goods at
higher prices
Product
quality
and prices
diversify in
the
market
Firms with
higher quality
inputs are
able to sell to
more
sophisticated
buyers
8
ComPEL
Competitiveness Policy Evaluation Lab
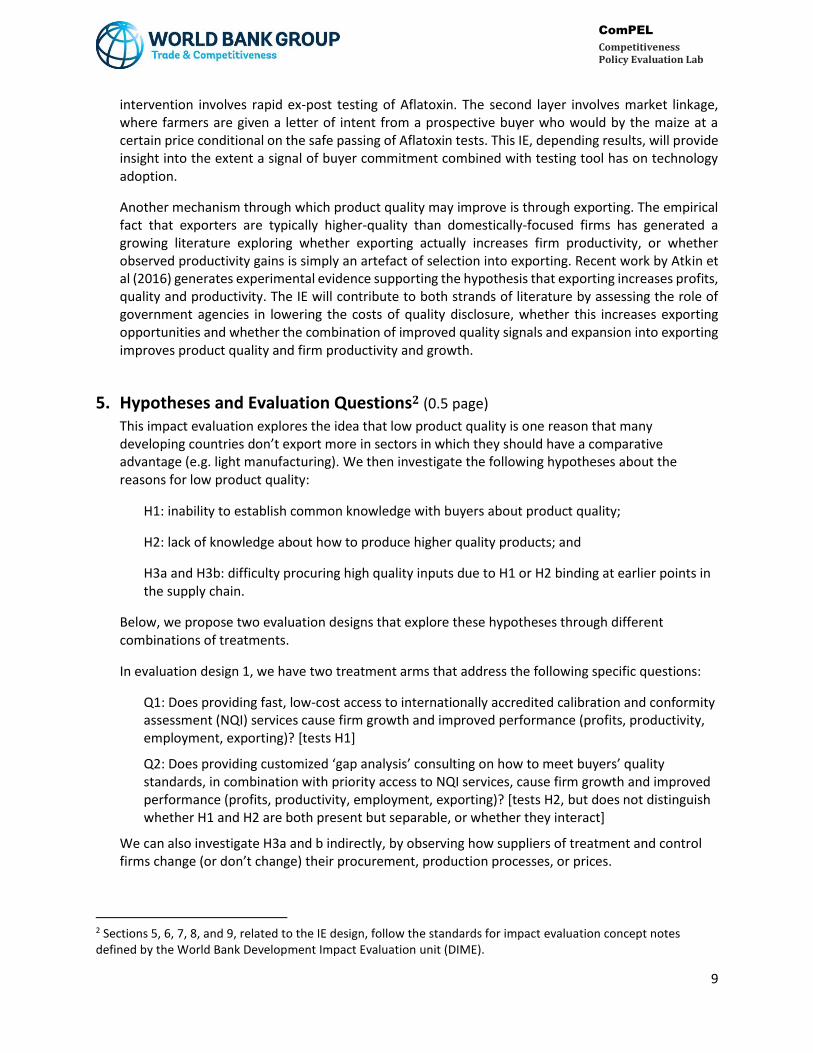
Table 2: Outcomes of Interest for the Impact Evaluation (IN ADDITION TO THOSE LISTED IN TABLE 1)
Category Outcome Definition Measurement Level /source
Time/Frequency
Take up
Use of testing equipment
Traders adopt the use of quality testing equipment
Survey Baseline and follow-up
Use of agricultural extension
Farmers participate in extension services
Survey Baseline and follow-up
Firm Performance
Use of quality tests Whether traders and farmers implement formal quality tests
Survey Baseline and Follow-up
Product quality
Honey produced (sold by farmers) and bought (by traders) have improved in quality, as measured by quality tools
Survey Baseline and Follow-up
Product price Prices diverge according to the quality of honey bought and sold
Survey Baseline and Follow-up
4. Literature Review (1 page) The impact evaluation links broadly to two strands of literature: (i) quality disclosure and signaling, and (ii) the impacts of exporting. On the former, there is a rich empirical and theoretical literature that explores the reasons and implications of voluntary and involuntary quality disclosure mechanisms for services (e.g. health, education, finance) and products (see Dranove & Jin, 2010 and Riley, 2004 for empirical and theoretical reviews). The literature focuses predominantly on the role of quality disclosure in a consumer-seller framework rather than from a business-to-business perspective. Theoretically, lowering the costs of disclosing quality may increase efficiency by improving sorting between buyer and supplier, inducing firms to increase quality and pushing low-quality suppliers out of the market. However, current empirical literature finds limited effects on quality improvements, potentially due to noisy signals.
A recent systematic review published by 3ie points to a growing literature on quality disclosure and signaling in the agricultural sphere (see Oya et al, 2017). The systematic review includes 43 impact evaluations on certification schemes, which are voluntary standards and the adoption of associated practices. The review, which focuses on low- and middle- income countries, find that certification schemes generally have negative effects on yield and positive effects on crop prices. This is largely due to the fact that crops under certification schemes require more attention, but are of higher quality. It is unclear, however, whether these schemes yield an increase in wage as there are high variation across studies, and the intensity of inputs required for crops balance out the higher prices. Overall, these schemes do not seem to significantly increase household income as well. One important distinction of certification schemes is that they are voluntary in nature and are often combined with capacity building training programs. The ENQI testing are often associated with buyer requirements and thus signal different measures of quality.
One related study that focuses on required product testing and linkage is currently in its implementation stage (see ATAI Research by Hoffman et al). The IE measures the adoption of two technologies that prevent toxic fungal contamination of Aflatoxin in maize crops. The first layer of
9
ComPEL
Competitiveness Policy Evaluation Lab
intervention involves rapid ex-post testing of Aflatoxin. The second layer involves market linkage, where farmers are given a letter of intent from a prospective buyer who would by the maize at a certain price conditional on the safe passing of Aflatoxin tests. This IE, depending results, will provide insight into the extent a signal of buyer commitment combined with testing tool has on technology adoption.
Another mechanism through which product quality may improve is through exporting. The empirical fact that exporters are typically higher-quality than domestically-focused firms has generated a growing literature exploring whether exporting actually increases firm productivity, or whether observed productivity gains is simply an artefact of selection into exporting. Recent work by Atkin et al (2016) generates experimental evidence supporting the hypothesis that exporting increases profits, quality and productivity. The IE will contribute to both strands of literature by assessing the role of government agencies in lowering the costs of quality disclosure, whether this increases exporting opportunities and whether the combination of improved quality signals and expansion into exporting improves product quality and firm productivity and growth.
5. Hypotheses and Evaluation Questions2 (0.5 page) This impact evaluation explores the idea that low product quality is one reason that many developing countries don’t export more in sectors in which they should have a comparative advantage (e.g. light manufacturing). We then investigate the following hypotheses about the reasons for low product quality:
H1: inability to establish common knowledge with buyers about product quality;
H2: lack of knowledge about how to produce higher quality products; and
H3a and H3b: difficulty procuring high quality inputs due to H1 or H2 binding at earlier points in the supply chain.
Below, we propose two evaluation designs that explore these hypotheses through different combinations of treatments.
In evaluation design 1, we have two treatment arms that address the following specific questions:
Q1: Does providing fast, low-cost access to internationally accredited calibration and conformity assessment (NQI) services cause firm growth and improved performance (profits, productivity, employment, exporting)? [tests H1]
Q2: Does providing customized ‘gap analysis’ consulting on how to meet buyers’ quality standards, in combination with priority access to NQI services, cause firm growth and improved performance (profits, productivity, employment, exporting)? [tests H2, but does not distinguish whether H1 and H2 are both present but separable, or whether they interact]
We can also investigate H3a and b indirectly, by observing how suppliers of treatment and control firms change (or don’t change) their procurement, production processes, or prices.
2 Sections 5, 6, 7, 8, and 9, related to the IE design, follow the standards for impact evaluation concept notes defined by the World Bank Development Impact Evaluation unit (DIME).
10
ComPEL
Competitiveness Policy Evaluation Lab
In evaluation design 2, we have three treatment arms that address the following specific questions:
Q1: Does providing fast, low-cost access to internationally accredited calibration and conformity assessment (NQI) services AND customized ‘gap analysis’ consulting on how to meet buyers’ quality standards cause firm growth and improved performance (profits, productivity, employment, exporting)? [tests H1 and/or H2, but does not distinguish between the two]
Q2: Does providing quality testing equipment to upstream traders increase the quality and price of intermediate inputs procured and supplied by these traders? [tests H3a]
Q3: Does providing technical assistance to farmers increase the quality and price of raw materials produced and supplied by these farmers? [tests H3b]
In design 2, we also test for interactions between H1/2 and H3a, and between H3b and H3a and H1/2. For instance, we are able to investigate the possibility that the answer to Q3 is yes, but only if the constraint in H3a is relaxed simultaneously so that farmers face increased demand for high quality product.
6. Evaluation Design and Sampling Strategy (1-2 pages) In this section, we present two designs for RCTs related to QI services. The first takes a wider approach, with interventions focused on firms at the “end” of the domestic value chain (potential exporters and firms closest to final consumers) across several broad sectors. The second takes a deeper, narrower approach focused on a single type of product, and proposes interventions at multiple points along the supply chain. These two approaches are not mutually exclusive and could potentially be combined, as discussed later in this concept note.
Evaluation Design #1
The population targeted by this evaluation will be medium- and large-scale manufacturers in the sectors prioritized by the associated World Bank program: leather and leather products, textiles and garments, and agro-processing. The intervention will consist of two treatments. In the first, firms will be offered information about and “priority access” to QI services, and in the second, customized consulting services (both described in more detail in Section 6.1).
Firms will be randomly assigned to one of three groups: control, priority access only, and priority access plus consulting. We expect that sample size constraints will prevent us from implementing a full cross-cutting design (with four groups), and since the goal of the IE is to measure the effects of access to QI services rather than consulting, we propose to forgo a “consulting only” treatment. Instead, this design allows us to investigate the possibility that QI services are important, but make a difference only in combination with an intervention that relaxes other related constraints.
Data from the Survey of Large and Medium Scale Manufacturing Industries conducted annually by the Central Statistics Agency shows 853 firms in these priority sectors in 2014 (the most recent year available), very broadly defined. However, because the survey does not provide identifying information for firms, we will compile a list of potential participants from other sources (e.g. industry institutes under the Ministry of Industry). This process is currently underway with support from the counterpart agencies. Furthermore, it may be appropriate to narrow the sample further in two ways: 1) leave out firms that are located sufficiently far away from the public QI institutions that “priority access” in terms of cost or time is unlikely to make any difference, and 2) leave out firms in sectors
11
ComPEL
Competitiveness Policy Evaluation Lab
that use QI services exclusively due to mandatory imported input testing requirements.3 Both of these issues will require further investigation in the pilot survey discussed in Section 7. Given these constraints, we assume for the purposes of power calculations that the sample frame of identifiable firms that can potentially benefit from expanded QI services will be 300.
The sample will be split equally among each of the control and two treatment groups. The randomization will be stratified by sector and exporter status. Although there could in theory be spillover effects via competition between treated and untreated firms, it is not practical given the sample size and the difficulty of defining competitive proximity to take a clustered randomization strategy. It seems unlikely that the experiment will have detectable effects on equilibrium prices in foreign markets. However, data collection will attempt to map out the identities of customers and suppliers so that direct competition over buyers or scarce inputs can at least be documented.
Evaluation Design #2
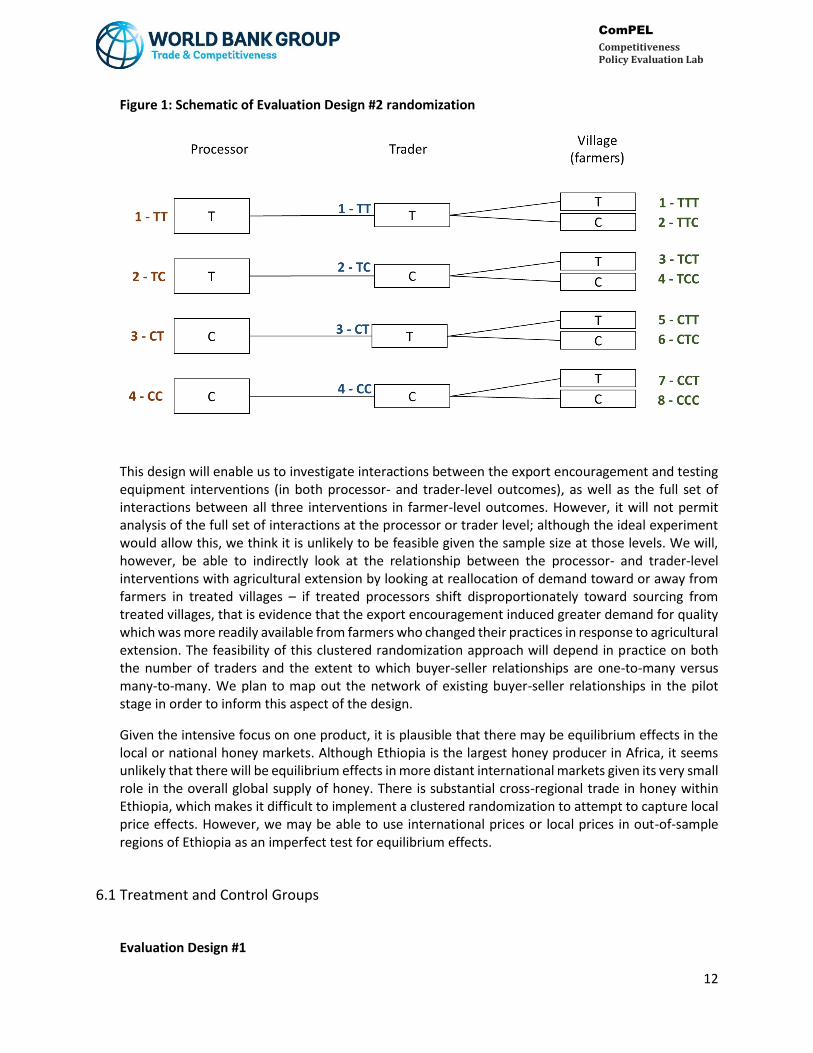
This evaluation will focus on Ethiopian honey production, and will include firms at several points along the value chain. The three main sets of agents included in the evaluation will be: 1) cooperatives and processing firms that produce a final product for consumption, 2) collectors and traders who purchase honey from farmers and resell to processors or retailers, and 3) farmers who produce raw honey.
One intervention will take place at each level of the supply chain, with agents at that level randomly assigned to either control or treatment. At the processor level, treatment group firms will receive “export encouragement” that combines the features of priority access to NQI services and gap analysis described in Evaluation Design 1. At the collector level, treatment group traders will receive equipment and training that enables them to implement basic, essential quality tests for honey in the field. At the farmer level, treatment group villages (including all farmers in the village) will receive agricultural extension services.
The sample will include all current honey processors and cooperatives producing final goods, all farmers in a random sample of villages with active apiculture in a subset of regions (to be identified), and all traders and collectors currently serving those villages at the time of the baseline survey. Depending on further information about the honey supply chain to be investigated through the pilot survey described in Section 7, it may also be necessary to collect data from other agents such as wholesalers or larger traders who do not purchase directly from the farm gate. We do not currently have sufficient information about the number of processors and traders in Ethiopia – in the power calculations below, we show the sample size that will be required to identify reasonable MDEs, and will need assess whether those can be met through further scoping and piloting. There are estimated to be 1.8 million households engaged in apiculture, widely spread across the country, and we do not expect power to be a constraint at the farmer level.
Our preliminary design involves clustering the randomization of traders by both processor and village, so that some processors and some villages have all (or a higher fraction) of the traders they dealt with at baseline assigned to treatment. This design is illustrated in Figure 1, below.
33 A related issue is that some sectors appear to procure QI services mainly or exclusively through channels other than the counterpart agencies – e.g. many leather firms use the laboratory at the Leather Industry Development Institute (LIDI). In finalizing the intervention strategy, we will need to decide whether the intention is to encourage firms to switch to the counterpart agencies. If not, it may make sense to either exclude these sectors or to expand the intervention to provide preferred access at these alternative QI service providers as well.
12
ComPEL
Competitiveness Policy Evaluation Lab
Figure 1: Schematic of Evaluation Design #2 randomization
This design will enable us to investigate interactions between the export encouragement and testing equipment interventions (in both processor- and trader-level outcomes), as well as the full set of interactions between all three interventions in farmer-level outcomes. However, it will not permit analysis of the full set of interactions at the processor or trader level; although the ideal experiment would allow this, we think it is unlikely to be feasible given the sample size at those levels. We will, however, be able to indirectly look at the relationship between the processor- and trader-level interventions with agricultural extension by looking at reallocation of demand toward or away from farmers in treated villages – if treated processors shift disproportionately toward sourcing from treated villages, that is evidence that the export encouragement induced greater demand for quality which was more readily available from farmers who changed their practices in response to agricultural extension. The feasibility of this clustered randomization approach will depend in practice on both the number of traders and the extent to which buyer-seller relationships are one-to-many versus many-to-many. We plan to map out the network of existing buyer-seller relationships in the pilot stage in order to inform this aspect of the design.
Given the intensive focus on one product, it is plausible that there may be equilibrium effects in the local or national honey markets. Although Ethiopia is the largest honey producer in Africa, it seems unlikely that there will be equilibrium effects in more distant international markets given its very small role in the overall global supply of honey. There is substantial cross-regional trade in honey within Ethiopia, which makes it difficult to implement a clustered randomization to attempt to capture local price effects. However, we may be able to use international prices or local prices in out-of-sample regions of Ethiopia as an imperfect test for equilibrium effects.
6.1 Treatment and Control Groups
Evaluation Design #1
13
ComPEL
Competitiveness Policy Evaluation Lab
Priority access – In this treatment arm, we will provide firms with information about and “priority access” to services offered by the public NQI institutions partnering with the Bank. Currently, the conformity assessment laboratory is not internationally accredited, and none of the four institutions post easily accessible lists of services and prices. This design assumes that by the time the impact evaluation begins, international accreditation will have been finalized, and a number of new services will become available due to equipment purchases and staff training. In practice, this intervention will consist of a) providing marketing-type materials to firms advertising the international accreditation and a full list of services, highlighting newly available ones; and b) providing a voucher valid for one year to pay lower prices (of a level TBD – possibly zero) and to jump the queue for all NQI services.4 These details will have to be confirmed with the NQI institution to ensure that their institutional capacity will be sufficient to implement them effectively.
Consulting – In this treatment arm, we will offer firms customized consulting services. The details of this treatment still need to be fleshed out based on the pilot survey and the availability of high-quality consultancy providers in Ethiopia. However, we expect that the core will be a tailored “gap analysis” in which firms receive advice about mandatory standards and typical buyer expectation in destination markets of interest to the firm, an assessment of how their current products and production process compare to those requirements, and advice about what steps they could take to close that gap. These will typically be export markets, but could include new domestic product lines or regions for firms that are not interested in exporting. Depending on pilot findings, this could be expanded to include actual introductions/matching with buyers, or technical assistance in implementing the recommendations about how to close the gap identified in the gap analysis.
Evaluation Design #2
Export encouragement (processors) – This treatment combines the main features of the priority access and consulting treatments described under Evaluation Design #1, above. Firms and collectives will receive a voucher valid for one year to pay lower prices and to jump the queue for a specified set of NQI conformity assessment and calibration services relevant to honey. They will also receive a customized “gap analysis” that provides information about standards and buyer expectation in destination markets of interest and advice about what steps they could take to close any gap between those and their current product features. As with Evaluation Design #1, this assumes that internationally accredited conformity assessment services relevant to honey become available in Ethiopia before the intervention begins. Initially limited capacity would be sufficient given the prioritization of a subset of firms.
Quality testing equipment and training (traders) – Treatment group traders will receive a package of testing equipment that enables them to conduct quality tests on honey in the field as they make collections at the farm gate. The exact equipment will depend on consultation with industry experts, but our understanding is that the equipment needed to conduct basic but essential tests
4 This creates the potential for a direct spillover – if treated firms jump the queue, they push untreated firms back in line. In theory, “control” firms might actually be “treated” with slower service. Our hope is that increased capacity at the NQI institutions will mean that everyone gets served at least as quickly as in the status quo. However, a more transparent mechanism might be to promise treatment group firms service within some specified period of time – we are not sure yet whether that is within the ability of the NQI institutions.

14
ComPEL
Competitiveness Policy Evaluation Lab
like that for the moisture level of honey is inexpensive and mobile. Traders will also receive training on how to implement these tests accurately and report the results clearly to buyers.
Agricultural extension services (farmers) – All farmers in treatment group villages will receive agricultural extension services aimed at helping them upgrade the quality and quantity of honey they produce. Whether these services take the form of village-wide ‘courses’, individual farm visits for customized advice, or both, will depend on consultation with organizations currently working in this area.
6.2 Sample Size Calculations
Table 2 shows minimum detectable effects for four outcomes under Evaluation Design #1. It uses panel
data from the Survey of Large and Medium Scale Manufacturing Industries to estimate baseline means
as well as the full covariance structure across years (except for recent use of QI, which is only available
for one year in the data). We assume data on 300 firms (after survey attrition) with 100 in each arm;
these power calculations compare each treatment arm against the control group individual (i.e. 100
firms in each group). The calculations assumes one baseline and four follow-up survey rounds, and uses
an ANCOVA specification with standard errors clustered at the firm level, as shown in Section 8.
Table 2: Minimum Detectable Effect (80% power, 5% significance level)
Recent use of
QI5 Unit value top product (birr)
Revenue (birr/month)
Exporting
Unit Level Firm Firm Firm Firm
Variable Mean 0.081 1,304 66,700,000 0.107
Variable SD
0.274 12,513 234,000,000 0.309
MDE (in SD) 0.35 0.40 0.10 0.18
MDE (as % of
reference mean) 1.18 3.82 0.36 0.51
Total number of clusters N/A N/A N/A N/A
Total number of
clusters per arm N/A N/A N/A N/A
Average number of firms per cluster N/A N/A N/A N/A
5 Calculation uses the variable “Does the firm have an internationally recognized quality certification for its main product?” as a proxy, due to lack of data on calibration and conformity assessment services in the CSA data. Data is taken from the 2013 survey, while the rest of the outcomes are taken from the 2014 survey.
15
ComPEL
Competitiveness Policy Evaluation Lab
Total number of firms 300 300 300 300
Total number of firms required for X% take-up
N/A N/A N/A N/A
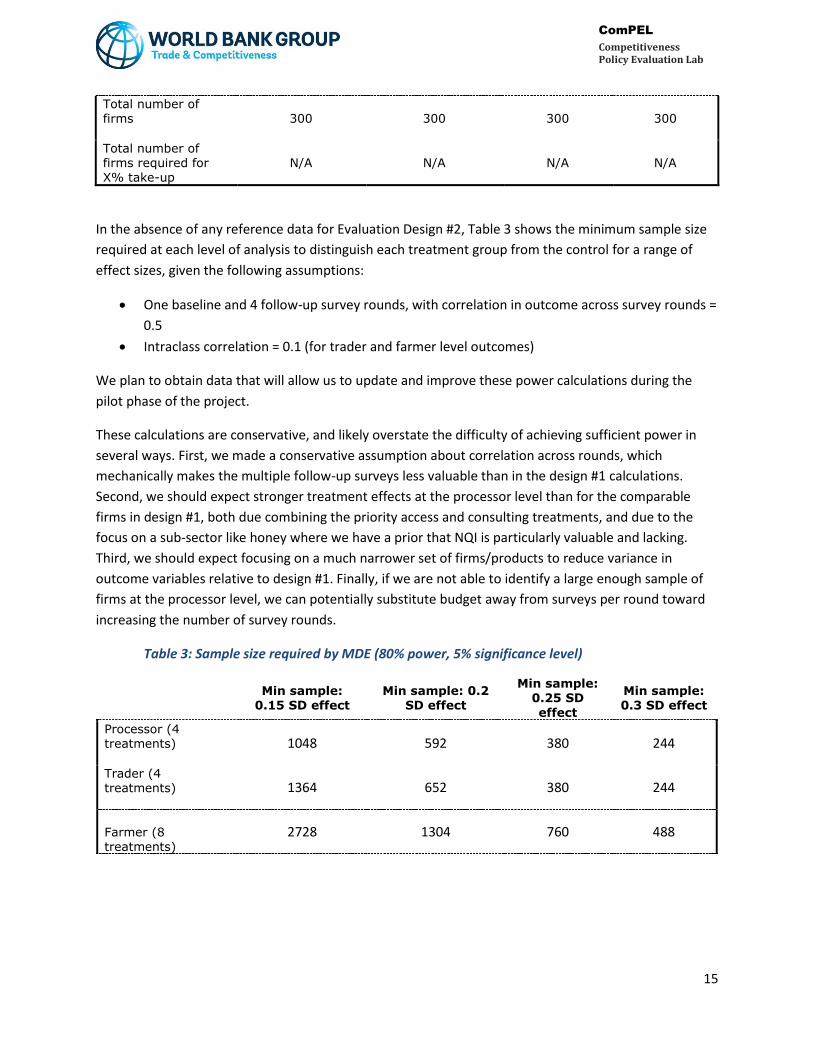
In the absence of any reference data for Evaluation Design #2, Table 3 shows the minimum sample size
required at each level of analysis to distinguish each treatment group from the control for a range of
effect sizes, given the following assumptions:
One baseline and 4 follow-up survey rounds, with correlation in outcome across survey rounds =
0.5
Intraclass correlation = 0.1 (for trader and farmer level outcomes)
We plan to obtain data that will allow us to update and improve these power calculations during the
pilot phase of the project.
These calculations are conservative, and likely overstate the difficulty of achieving sufficient power in
several ways. First, we made a conservative assumption about correlation across rounds, which
mechanically makes the multiple follow-up surveys less valuable than in the design #1 calculations.
Second, we should expect stronger treatment effects at the processor level than for the comparable
firms in design #1, both due combining the priority access and consulting treatments, and due to the
focus on a sub-sector like honey where we have a prior that NQI is particularly valuable and lacking.
Third, we should expect focusing on a much narrower set of firms/products to reduce variance in
outcome variables relative to design #1. Finally, if we are not able to identify a large enough sample of
firms at the processor level, we can potentially substitute budget away from surveys per round toward
increasing the number of survey rounds.
Table 3: Sample size required by MDE (80% power, 5% significance level)
Min sample:
0.15 SD effect Min sample: 0.2
SD effect
Min sample: 0.25 SD
effect
Min sample: 0.3 SD effect
Processor (4 treatments) 1048 592 380 244
Trader (4 treatments) 1364 652 380 244
Farmer (8 treatments)
2728 1304 760 488
16
ComPEL
Competitiveness Policy Evaluation Lab
7. Data Collection (1 -2 pages) This project will begin with a pilot survey intended to fill in some of the remaining knowledge gaps and
help finalize the design of the intervention, in conversation with the Ethiopian NQI institutions. This
process will also help us to determine which of the two evaluation designs (or both) is most feasible and
productive. We will then proceed with a baseline survey and 4 follow-up surveys conducted over a 2
year period following the beginning of the intervention, described in more detail below.
7.1 Quantitative Instruments
After a pilot survey, the quantitative data collection will take place through five rounds of surveys over a
2.5 year period. The timing of surveys will, realistically, depend on the timeline for the associated NQI
capacity building project; beginning the impact evaluation before international accreditation is finalized
and new services are in place would undermine the intervention and make it less likely to have any
impact on firms. Tentatively, the baseline survey will take place from February – June 2018. In July 2018,
firms will be randomized, and treatment firms will be informed about the services being offered to
them. The four follow-up surveys will take place 6, 12, 18, and 24 months after the beginning of the
intervention.
Pilot Survey
We plan to begin the IE with a pilot survey to gather information that will allow us to better tailor the
interventions and sample frame, improve the accuracy of power calculations and finalize the
experimental design, and assess the feasibility of both evaluation designs.
The pilot survey will tentatively take place in November – December 2017, and will aim to include 150
respondents representatively sampled from the planned sample frames for designs 1 and 2 in the
following way: 20 firms from each of the three target sectors for design 1 (i.e. agro-processing, leather,
and textile/garment), 20 honey processors/co-ops, 20 honey trader/collectors, and 50 honey-producing
households.
The survey will cover basic information on firms (age, size, products made, inputs used, etc) and map
out the form of buyer-seller relationships (e.g. exclusive sales to one buyer versus switching between
many), but will focus on product quality issues, e.g. use of QI services (internal, domestic, or
international) for inputs and outputs, costs of QI services, relevant parameters of quality for products
made, experience with buyer requirements and rejection of shipments, relationship between price and
quality for inputs and outputs, constraints in ability to source inputs, interest in exporting and
expansion, interest in new products/markets, and knowledge of steps required for quality upgrading.
Evaluation Design #1
In each round, we plan to survey all firms in the control and treatment groups, as well as a sample of
suppliers one step upstream. For instance, both leather products firms and tanneries would be in the
main sample, while hide traders who sell to those firms would be in the supplementary supplier sample.
17
ComPEL
Competitiveness Policy Evaluation Lab
We will measure the following outcomes in the main firm survey:
Use of QI services (type, frequency, time from request to fulfillment, and cost) from a)
counterpart agencies, and b) any other providers, both domestic and international.
Description of recommendations made by consultants, if applicable.
Firm descriptives: firm age, legal status, ownership status, number of employees, past
import/export experience, number of plants/locations, capital stock, vertical integration, access
to foreign exchange
Changes in products or processes: c) any internationally recognized certifications (e.g. ISO), d)
products added or dropped, e) new or altered equipment, f) changes to the production process
or internal/informal quality control measures, g) staff training, certification, or new roles.
Use of inputs: h) changes in suppliers (added, dropped, reallocated), i) new material inputs, j)
unit value of material inputs.
Outputs and sales: k) total production of main products (quantity and value), l) total sales
(quantity and value, by country including domestic). (If possible, we will include some 3rd party
product quality testing to obtain measures of output quality directly – however, this will have to
be piloted for feasibility given both the wide range of outputs included in the sample and
possible pushback from respondents.
Experience with buyers: m) changes in buyers (added, dropped, reallocated), n) buyer
requirements (tests, certifications, timing), o) had any shipments returned/rejected/received
with negative feedback.
In the supplementary supplier survey, we will measure a similar set of outcomes, making adjustment for
the different size, degree of formality, and production processes at that point in the value chain. This
will include use of QI services, if any, and description of any informal/internal testing or quality control
measures. We will also attempt to implement 3rd party quality testing as part of the survey, as above, if
possible, but this will likely need to focus on a subset of products with straightforward, field-
implementable tests.
Evaluation Design #2
Under this design, we will survey all treatment and control group firms at each level of the supply chain
in each survey round.
In the processor-level survey, we will measure all of the outcomes described above as part of evaluation
design #1. In addition, we will attempt to implement 3rd party product testing on the basic parameters
of honey and honey-product quality (e.g. color, purity, sugar, moisture) at the time of the survey in
order to have objective measures of product quality for firms that do not opt to use government
conformity assessment services. Re-allocation of input purchases toward or away from treated traders
and farmers is also an outcome of interest.
In the trader-level survey we will measure:
18
ComPEL
Competitiveness Policy Evaluation Lab
Trader descriptives: years experience, education, number of employees, equipment, sources of
working capital, ability (Raven test, numeracy), income from honey and other sources
Purchasing: areas/villages served, location (e.g. farmgate vs. market) and frequency of
purchases, product characteristics, quantities, prices, interlinkages in relationships with farmers
(credit/pre-payments, equipment, advice), method for assessment of quality at purchase point
Trading: extent of aggregate or separation of product across sources, method and cost of
transportation, storage methods and capacity, cost of storage, knowledge of purchase and sale
prices across locations, assessment of competition from other traders or other sources
Selling: identity and characteristics of buyers (e.g. retailer vs. processor) and details on typical
transactions per buyer (quantity, prices, product characteristics, frequency of sales), use of
quality testing at point of sale, interlinkages in relationships with buyers (credit/pre-payments,
equipment, advice).
Knowledge and self-perception: knowledge test on features of honey quality and best-practices
in storage and transportation, perception of buyer requirements and relationship between price
and quality, perception of challenges in market and reasoning behind quality/location sourcing
decisions.
3rd party measures of honey quality implemented by enumerators
In the farmer-level survey we will measure:
Farmer descriptives: years experience in honey, age, education, family composition, sources of
working capital, ability (Raven test, numeracy), income from honey and other sources,
consumption/asset ownership index, land ownership
Production: number and type of hives (traditional, transitional, modern), other equipment
owned, apiculture practices (food and water supply for bees, harvesting technique, etc), quality
testing methods used, storage methods and capacity, cost and quantity of inputs, quantity and
characteristics of outputs produced, number and timing of harvests per year
Sales: quantity and price outputs sold, timing of sales, identity of buyers, relationship with
buyers (repeated sales, interlinkages in credit, etc), location of sales (e.g. farmgate vs. market),
quality testing at point of sale, cost of transportation or storage to reach point of sale.
Knowledge and self-perception: knowledge test on features of honey quality and best-practices
in production and storage, perception of buyer requirements and relationship between price
and quality, knowledge of prices across buyers/points of sale, perception of challenges in
market and reasoning behind production quality and buyer identity decisions.
3rd party measures of honey quality implemented by enumerators
We will also implement a brief village-level assessment that records the size of the village, the number
of households engaged in apiculture, distance to main regional markets, road access, frequency of any
village market. Ideally, we will be able to merge this with existing public data sets that measure weather
(e.g. rainfall shocks during the experiment, seasonal variation), price index at nearest city, and effective
road distance to major cities.

19
ComPEL
Competitiveness Policy Evaluation Lab
7.2 Management of Data Quality
We intend to work with a local survey firm that has experience implementing nation-wide, electronic
data collection, if possible, with large firms. The PIs will be directly involved in survey piloting and
enumerator training to ensure that questions are consistently understood by both enumerators and
respondents. We will run daily “high frequency checks” to scan for internal inconsistency and
implausible values, which will be returned to the survey team for reconciliation and follow-up with
respondents. Independent auditors will return to the respondent for at least 10% of completed surveys
to check for fraud, consistency, and enumerator conduct.
Given the nature of the survey and the size of the firms, it may be best to include multiple respondents
within each firm, as there may not be a single individual whose expertise covers all the necessary topics
(e.g. both the production process and relationship with international buyers). This approach will need to
be piloted before it is finalized.
7.3 Ethical Issues
We expect this IE to require IRB approval at a US institution, as well as (possibly) in Ethiopia. Beyond the
usual informed consent and data privacy protection measures, we do not anticipate any unusual ethical
consideration or challenges.
7.4 Qualitative Instruments
Not applicable.
7.5 IE Implementation Monitoring System
To measure compliance with the treatment, we will combine data from three sources: administrative
data provided by the counterpart NQI agencies on provision of service,; reports from consultants
engaged to provide services (both gap analysis and agricultural extension), and self-reports by firms
through the surveys. We will measure the type of QI services used, the provider, the timing (both
frequency and time from request to fulfillment), and the outcome (if relevant, e.g. did or did not meet
the required standard). We will also track which firms/farmers chose to participate in the
consulting/training/agricultural extension offer, how many times and how long they met, and the
content of advice provided.
8. Data Processing and Analysis (1-2 pages)
8.1 Data Coding, Entry, and Editing (optional)
We intend to use electronic data collection, so that no data entry process will be necessary. We do not
expect to impute any missing data.
20
ComPEL
Competitiveness Policy Evaluation Lab
8.2 Model Specification for Quantitative Data Analysis
In order to maximize survey response rates, we will attempt to distance the data collection from both
the government agencies involved and the intervention, making it clear that the intervention is not
conditional on survey participation and that no identifiable data will be shared with the government.
Nonetheless, we expect firm skepticism about privacy and government involvement to be a major
challenge in obtaining accurate information.
We plan to register this IE under the AEA RCT Registry.
Evaluation Design 1
The randomization will be stratified by sector and prior exporting status, and we will check for balance
across firm age, number of employees, capital stock, previous year sales, interest in exporting (for non-
exporters), prior use of QI services, and possession of a current internationally recognized certification.
Our main specification will be ANCOVA and will estimate an intent-to-treat (ITT) measure of the effect of
offering treatment to a firm on a variety of outcomes:
𝑦𝑖𝑡 = 𝛼 + 𝛽1𝑡𝑟𝑒𝑎𝑡1𝑖𝑡 + 𝛽2𝑡𝑟𝑒𝑎𝑡2𝑖𝑡 + θ𝑦𝑖,𝑝𝑟𝑒 + μ𝑡 + 𝜀𝑖𝑡
where treat1 is a dummy equal to one if the firm is assigned to the priority access treatment, treat2 is a
dummy equal to one if the firm is assigned to the priority access plus consulting treatment, 𝑦𝑖,𝑝𝑟𝑒 is the
baseline level of the outcome variable, and μ𝑡 is a survey round fixed effect. The standard errors will be
clustered at the firm level. We may consider log transformations of financial outcome variables such as
unit values, sales, and profits.
We will also use a similar specification to look at outcomes at the supplier level (one step upstream from
treated firms), considering the fraction of firms with whom the supplier had a relationship at baseline
that are treated as an indirect treatment.
Evaluation Design 2
The randomization will be implemented as described in Section 6, with clustering of the trader-level
randomization by processor and village (as defined by relationships at the time of the baseline survey).
We will check for balance across the following variables measured at baseline:
Processors: firm age, number of employees, capital stock, previous year sales, interest in
exporting (for non-exporters), prior use of QI services, and possession of a current
internationally recognized certification.
Traders: years experience in honey trade, education, annual revenue, unit value of raw honey,
asset ownership (e.g. truck, measurement equipment)
Villages/farmers: household size, household income, years experience in apiculture, education,
annual production quantity, unit value of raw honey sold, village road connection, price index at
nearest city, number of households producing honey in village

21
ComPEL
Competitiveness Policy Evaluation Lab
At the processor level, our main specification will be ANCOVA and will estimate an intent-to-treat (ITT)
measure of the effect of treatment on a variety of outcomes:
𝑦𝑖𝑡 = 𝛼 + 𝛽1𝐸𝐸𝑡𝑟𝑒𝑎𝑡𝑖𝑡 + 𝛽2𝐸𝑄𝑡𝑟𝑒𝑎𝑡𝑖𝑡 + 𝛽3𝐸𝐸𝑖𝑡x𝐸𝑄𝑖𝑡 + θ𝑦𝑖,𝑝𝑟𝑒 + μ𝑡 + 𝜀𝑖𝑡
where 𝐸𝐸𝑡𝑟𝑒𝑎𝑡𝑖𝑡 is a dummy variables equal to one if the firm is in the treatment group, 𝐸𝑄𝑡𝑟𝑒𝑎𝑡𝑖𝑡 is
the intensity of treatment of traders connected to the firm at baseline, 𝐸𝐸𝑖𝑡x𝐸𝑄𝑖𝑡 is the interaction
between the two, 𝑦𝑖,𝑝𝑟𝑒 is the baseline level of the outcome variable, and μ𝑡 is a survey round fixed
effect. The standard errors will be clustered at the firm level. We may consider log transformations of
financial outcome variables such as unit values, sales, and profits.
At the trader level, our main specification will be the same as at the processor level, except that i in the
equation above denotes trader rather than processor, 𝐸𝑄𝑡𝑟𝑒𝑎𝑡𝑖𝑡 is a dummy variable equal to one if the
trader is in the treatment group, and 𝐸𝐸𝑡𝑟𝑒𝑎𝑡𝑖𝑡 is the intensity of treatment of processors to whom the
trader is connected at baseline. The standard errors will be clustered at the processor (not trader) level.
We may consider log transformations of financial outcome variables such as unit values, sales, and
profits.
At the farmer level, we will implement a similar ANCOVA ITT specification to that shown above at the
processor and trader level, but with the full set of interactions between the farmer-level treatment and
the intensity of treatment of traders and processors with whom the farmer was associated at the time
of the baseline. This yields eight effective treatment groups (23) as shown in Section 6. Tentatively, we
will cluster the standard errors at the processor level, but will need to revisit this depending on the
complexity of one-to-many versus many-to-many buyer/seller relationships.
9. Study Limitations and Risks (0.5 page)
Take-up. The first limitation is especially pertinent to evaluation #1. With the number of firms involved
in the target industries limited, the study design is sensitive to the level of firm take-up. At the moment
it is unclear how much firms value testing services, and whether time or cost of testing is a significant
barrier. The pilot survey will assist the team in determining the extent of the take-up concern. At the
same time, given that there are several parameters firms can request, the pilot survey will assist in
determining which tests are the most relevant for the target firms. This in turn will assist in increasing
the take-up rate.
Inability to meet sophisticated foreign buyer demands. Many exporters send samples abroad for testing
because the testing of certain sophisticated parameters are not available in Ethiopia. While the ECAE are
acquiring new testing equipment, there is uncertainty whether they will encompass all the testing
parameters demanded by firms. In that case, the desired effect of the intervention will be lessened as
firms would still send samples abroad for testing.
External validity. Limitations to external validity stem from several sources. First, on the intervention
side, the ENQI agencies are at their nascent stages and may be facing institutional learning curves. In
22
ComPEL
Competitiveness Policy Evaluation Lab
contrast to more established NQI agencies abroad, they may require more time and resources to
undergo testing. Furthermore, while the long term goal is for the private laboratory industry to take
over the testing functions, at the moment the ECAE and ENMI agencies will play an active role in the
testing market. NQI agencies in more sophisticated and mature markets may in fact play a larger
supervisory role instead. While the details are unclear, nearby countries such as Kenya and Tanzania
have a longer history of a QI infrastructure and may perform different roles as those in Ethiopia.
Another source of limitation comes from the industries selected. Different industries have different
levels of testing requirements. For example, the food processing industry naturally has more
requirements that are related to health. Thus, a firm’s use of QI services may depend on the
characteristics of the industry. In another example, the coffee industry in Ethiopia is not targeted by the
intervention as the firms involved have streamlined their process with buyers abroad in terms of quality
measurement and testing, and do not have high demand for national QI services.
10. Policy Relevance and Impact (1 page) Setting up the QI system has been considered an effective tool for development, since a functioning QI helps increase competitiveness in manufacturing and service delivery in a context of rapid growth of global trade and value chains. This, in turn, increases productivity, helps create employment, and encourages investment. However, the majority of previous QI projects, which were financed by the Bank and other donor agencies, was focused on the upgrading of the legislative framework and institutional capacity building of QI institutions and less focused on the creation of industry demand for QI services, resulting in sustainability challenges for QI institutions. The associated project of this IE was designed to address gaps in the supply and demand side of the QI services. Also, to the team’s knowledge, no concrete IE has been done with interventions (supply side, demand side, and spillover) related to QI services.
This IE is has strategic importance for Ethiopia, as the government has shown a strong commitment to upgrading QI by recognizing that a failure to meet standards and quality practices is one of the major prevailing issues in most of the Ethiopian manufacturing sector. While the project interventions are structured around three industries: Leather & Leather products; Textile & Garment; and Agro-processing, the findings from the IE will be applied to other industries, since the increase of the competitiveness of manufacturing is among the major targets of the Government of Ethiopia. The NQI Directorate of the Ministry of Science and Technology, which will be a focal point within the Government to support the quality issues for industries, will utilize the IE findings for the design of a similar program for scale-up. Furthermore, by taking into account the importance of the QI and increasing demands from the Bank’s clients on QI support, the T&C Global team is currently developing an analytical tool which provides an in-depth assessment of the QI system, including the effectiveness of a legal framework, technical regulatory regime, capacity of service providers (both public and private), etc. The evidence of the IE will contribute directly to the development of the tool.
Additionally, the IE will support the Ethiopian QI agencies with information on the impact of their work. Currently, feedback from the private sector to the QI agencies are conducted through discussions with industry associations and lead firms. In other words, there is no systematic way of collecting data on the benefits and costs of firms in using the QI services. The data and analysis from this IE will provide additional
23
ComPEL
Competitiveness Policy Evaluation Lab
information to the QI services on how the firms benefit from the services, and possibly whether certain activities and interventions by the QI services can have an amplified impact.
11. Dissemination Plan (0.5 page)
Given that the Ethiopian government has expressed interest in the impact evaluation, local
dissemination is a high priority. During the scoping mission in June 2017 a workshop was held with
relevant stakeholders within and outside the government. In the workshop, the frequency of
dissemination at key milestone moments (IE design, baseline, mid-line progress, end results) have been
outlined. These major dissemination activities will target a similar group of stakeholders, with the main
focus being the client partners of the larger WB loan program, including the ESA project coordinator,
directors of the four ENQI agencies, and the technical leads of each of them. At the same time, the
select key coordinators who have worked closely with the IE team will be informed regularly of the IE
progress and will be solicited for supported.
Since this impact evaluation can provide useful lessons for WBG, internal dissemination events will be
held, targeting both researchers and project managers. The lessons of this IE will be transmitted through
internal BBLs, workshops, and forums. Externally, the goal is for the IE to be published in peer reviewed
journals, and disseminated through relevant forums. At the conclusion of the impact evaluation,
technical reports as well as policy notes will be prepared for further dissemination as well.
12. Impact Evaluation and Related Teams Table 3: Impact Evaluation Team
Name Affiliation Role in IE team Email
Meredith Startz Yale University Principal Investigator [email protected]
Aidan Coville World Bank Group IE TTL – IE Coordinator [email protected]
Tommy Jungyul Kim World Bank Group Research Assistant [email protected]
TBD Field Coordinator
Table 4: Related World Bank Project Team (Project ID: P160279)
Name Title Role Email
Senidu Fanuel Senior Private Sector Specialist
Hiroyuki Tsuzaki Private Sector Specialist Co-TTL [email protected]
Wafa Aranki Senior Private Sector Specialist
Advisor to the team, experts in NQI
Welela Ketema Senior Private Sector Specialist
In charge of project implementation
24
ComPEL
Competitiveness Policy Evaluation Lab
Table 5: Country Counterparts
Name Title Agency Role Email
Getahun Mekuria Minister Ministry of
Science and
Technology
Decision maker
Wondwosen
Fisseha Kidanie Director, Project Coordinator
Ministry of
Science and
Technology
Day-to-day implementation
Endalew Mekonen
Director Ethiopian Standards Agency
Development of design
13. Budget Table 6: Impact Evaluation Budget Summary
Budget Summary
Budget Composition FY18 FY19 FY20 FY21 Total Cost
(USD)
% of total budget
Staff $8,000 $10,000 $8,000 $16,000 $42,000 5%
STC $42,000 $51,000 $56,000 $90,500 $239,500 26%
Data collection $180,000 $200,000 $200,000 $580,000 62%
Travel $18,000 $15,000 $14,000 $17,000 $64,000 7%
Conference arrangements
$600 $2,000 $2,600 0%
TOTAL $248,000 $276,600 $278,000 $125,500 $928,100 100%
Sources of Funds
ComPEL $198,000 $37,600 $235,600 25%
Project Budget $50,000 $50,000 5%
Regional Budget $0 0%
Other (specify) ______ $239,000 $278,000 $125,500 $642,500 69%
TOTAL BUDGET $248,000 $37,600 $278,000 $125,500 $928,100 100%
14. Milestones, Deliverables, and Timeline
See attached spreadsheet for details. Work is expected to begin in early FY18 and continue through
to the end of FY21.
25
ComPEL
Competitiveness Policy Evaluation Lab
15. References
Atkin, David, Amit K. Khandelwal, and Adam Osman. Exporting and firm performance: Evidence from a
randomized trial. No. w20690. National Bureau of Economic Research, 2014.
Dranove, David, and Ginger Zhe Jin. "Quality disclosure and certification: Theory and practice." Journal of
Economic Literature 48.4 (2010): 935-963.
Hoffman, Vivian, Erwin Bulte, Janneke Pieters, and Alexander Saak. “Integrating value chains to improve
food safety and increase smallholder incomes in Kenya.” Agricultural Technology Adoption Initiative
(ATAI) pilot study. Website
Oya, Carlos, Florain Schaefer, Dafni Skalidou, Catherine McCosker, and Laurenz Langer. “Effectiveness of
Agricultural Certification Schemes for Improving Socio-economic Outcomes in Low- and Middle-income
Countries.” 3ie Systematic review. June 2017
16. Annexes