ethiopia: pastoral community development project
TRANSCRIPT

Report No. 104210-ET
MARCH 30, 2016
ETHIOPIA
Pastoral Community Development
Project: Phases I and II

© 2016 International Bank for Reconstruction
and Development / The World Bank
1818 H Street NW
Washington DC 20433
Telephone: 202-473-1000
Internet: www.worldbank.org
This work is a product of the staff of The World
Bank with external contributions. The findings,
interpretations, and conclusions expressed in
this work do not necessarily reflect the views of
The World Bank, its Board of Executive
Directors, or the governments they represent.
The World Bank does not guarantee the
accuracy of the data included in this work. The
boundaries, colors, denominations, and other
information shown on any map in this work do
not imply any judgment on the part of The
World Bank concerning the legal status of any
territory or the endorsement of acceptance of
such boundaries.
RIGHTS AND PERMISSIONS
The material in this work is subject to copyright.
Because The World Bank encourages
dissemination of its knowledge, this work may be
reproduced, in whole or in part, for
noncommercial purposes as long as full
attribution to this work is given.
Any queries on rights and licenses, including
subsidiary rights, should be addressed to
World Bank Publications, The World Bank
Group, 1818 H Street NW, Washington, DC
20433, USA; fax: 202-522-2625; e-mail:

Report No. 104210-ET
PROJECT PERFORMANCE ASSESSMENT REPORT
FEDERAL DEMOCRATIC REPUBLIC OF ETHIOPIA
PASTORAL COMMUNITY DEVELOPMENT PROJECT PHASE I
(COFN-04500, IDAH0380, TF- 52888)
PASTORAL COMMUNITY DEVELOPMENT PROJECT PHASE II
(COFN-C1210, COFN-C1220, IDA-44580, IDA-H3950)
March 30, 2016
IEG Sustainable Development
Independent Evaluation Group
ii
Currency Equivalent
Currency Unit = Ethiopian Birr
USD 1.00 = Br 19 (Jan 2014)
2003 US$1.00 Br 8.55000032
2004 US$1.00 Br 8.69365037
2005 US$1.00 Br 8.72360031
2006 US$1.00 Br 8.79835034
2007 US$1.00 Br 9.20000018
2008 US$1.00 Br 9.92499975
Abbreviations and Acronyms
APL
CAP
CAS
CDD
CIF
DPCF
DPCP
DPSIP
EWR
EWRB
EWRD
EWS
FAO
FPCU
GDP
GNI
GTP
HDI
HICE
ICR
IDA
IEG
IFAD
IGA
M&E
MoA
MoFA
MST
MTR
NGO
PAD
PASDEP
PCDP I
PCDP II
PDO
PMU
Adaptable program loan
Community action plan
Country assistance strategy
Community-driven development
Community Investment Fund
Disaster Preparedness and Contingency Fund
Disaster Preparedness and Contingency Plan
Disaster Preparedness Strategic Investment Plan
Early warning and response
Early warning and response bureau
Early warning and response desk
Early warning system
Food and Agriculture Organization
Federal Project Coordination Unit
Gross domestic product
Gross national income
Growth and Transformation Plan
Human Development Index
Household, Income, Consumption, and Expenditure (survey)
Implementation Completion and Results Report
International Development Association
Independent Evaluation Group
International Fund for Agricultural Development
Income-generating activities
Monitoring and evaluation
Ministry of Agriculture
Ministry of Federal Affairs
Mobile support team
Mid-term review
Nongovernmental organization
Project appraisal document
Plan for Accelerated and Sustained Development Program
Pastoral Community Development Project – Phase I
Pastoral Community Development Project – Phase II
Project development objective
Project management unit

iii
PPAR
RUSACCO
SNNPR
WDC
Project Performance Assessment Report
Rural savings and credit cooperative
Southern Nations, Nationalities and People's Region
Woreda Development Committee
Glossary
Woreda District
Kebele A local community consisting of one or more villages
Fiscal Year
Government: July 8–July 7
Director-General, Independent Evaluation : Ms. Caroline Heider
Director, IEG Financial, Private Sector & Sustainable Development : Mr. Marvin Taylor-Dormond
Manager, IEG Sustainable Development (IEGSD) : Ms. Midori Makino
Task Manager, IEGSD : Ms. Lauren Kelly

v
Contents
Principal Ratings ............................................................................................................... vii
Key Staff Responsible...................................................................................................... viii
Preface................................................................................................................................. x
Executive Summary ........................................................................................................... xi
1. Background and Context................................................................................................. 1
2. The Pastoral Community Development Program ........................................................... 5
Beneficiaries and Targeting ............................................................................................ 6
Financing......................................................................................................................... 6
Implementation Arrangements........................................................................................ 7
3. Pastoral Community Development Project – Phase I ..................................................... 8
Relevance of Project Objectives ..................................................................................... 9
Relevance of Project Design ......................................................................................... 10
Implementation ............................................................................................................. 11
Achievement of Objectives ........................................................................................... 14
Objective (1): Establish effective models of public service delivery and investment .. 17
Objective (2): Establish effective models of disaster management in pastoral areas. .. 22
Efficiency ...................................................................................................................... 24
Outcome ........................................................................................................................ 25
Risk to Development Outcome ..................................................................................... 25
Bank Performance ......................................................................................................... 26
Borrower Performance .................................................................................................. 27
4. Pastoral Community Development Project – Phase II .................................................. 28
Relevance of Project Objectives ................................................................................... 28
Relevance of Project Design ......................................................................................... 28
Implementation ............................................................................................................. 31
Objective (1): Improve the livelihoods of beneficiary communities ............................ 34
Objective (2): Increase the pastoralist communities’ resilience to external shocks ..... 41
Efficiency ...................................................................................................................... 44
Outcome ........................................................................................................................ 45
Risk to Development Outcomes ................................................................................... 46
Bank Performance ......................................................................................................... 48
This report was report was prepared by Lauren Kelly, Task Team Leader, Kendra White and Inder Sud,
Consultants, IEG. It was peer and panel reviewed, respectively, by Marjory-Anne-Bromhead and Judy
Twigg, Consultants, IEG. Marie Charles and Vibhuti Narang Khanna provided administrative support.

vi
Borrower Performance .................................................................................................. 48
5. Lessons .......................................................................................................................... 49
Bibliography ..................................................................................................................... 51
Annex A: Basic Data Sheet for Ethiopia Pastoral Community Development Project Phase
I ......................................................................................................................................... 53
Annex B: Basic Data Sheet for the Ethiopia Pastoral Community Development Project
Phase II.............................................................................................................................. 56
Annex C: Survey Data Sources on Income, Poverty, and Welfare in Ethiopia ................ 59
Annex D: Methodology for the PPAR Fieldwork: Unit of Analysis, Sampling Frame,
Scope, and Tools ............................................................................................................... 63
Annex E: Semi-Structured Interview Tool ....................................................................... 66
Annex F: IEG Findings from Community Investment Fund Site Visits .......................... 71
Annex G: List of Persons Met .......................................................................................... 94
Annex H: Borrower Comments ........................................................................................ 97
Boxes
Box 1.1: Applying Livelihoods Analysis to Understand the Characteristics of Pastoral
Communities ....................................................................................................................... 4
Box 2.1. The Pastoral Community Development Program ................................................ 6
Box 3.1. Assessment of Income-Generating Activities Financed During Phase I of
the PCDP.......................................................................................................................... 21
Tables
Table 1.1. Select Human Development Indicators ............................................................. 2
Table 2.1. Project Costs by Component.............................................................................. 7
Table 3.1. Total Beneficiaries, 2003–08 ........................................................................... 18
Table 3.2. Status of Subprojects by Region at Project Closing (2003–08) ....................... 19
Table 3.3. Major IGA Activities under the CIF ................................................................ 20
Table 3.4. Status of Subprojects under the DPCF at Project Completion (2003–08) ....... 22
Table 4.1. Sequencing of Project Activities across the Three Phases .............................. 29
Table 4.2. Types of Rural Non-Farm Activities Engaged in by Loan Beneficiaries ........ 40
Table 4.3. Achievement of PDO Indicators Relating to Imroved Resilience ................... 41
Table 4.4. Construction of Cost Comparision .................................................................. 45
Figures
Figure 4.1. Amount of Capital Mobilized from Saving and Paid Capital by Region ....... 38
Figure 4.2. Cooperative Members Who Have Active Saving Account (N=29,527
members)........................................................................................................................... 39

vii
Principal Ratings
Ethiopia Pastoral Community Development Project, Phase I
(COFN-04500, IDAH0380, TF- 52888)
PCDP I ICR* ICR Review* PPAR
Outcome Moderately
satisfactory
Moderately
unsatisfactory
Moderately
unsatisfactory
Risk to development
outcome
Moderate Significant Significant
Bank performance Moderately
unsatisfactory
Unsatisfactory Moderately
unsatisfactory
Borrower performance Moderately
unsatisfactory
Unsatisfactory Moderately
unsatisfactory
* The Implementation Completion Report (ICR) is a self-evaluation by the responsible Bank department. The ICR
Review is an intermediate IEGWB product that seeks to independently verify the findings of the ICR.
Ethiopia Pastoral Community Development Project, Phase II
(COFN-C1210, COFN-C1220, IDA-44580, IDA-H3950)
PCDP II ICR* ICR Review* PPAR
Outcome Moderately
satisfactory
Moderately
satisfactory
Moderately
satisfactory
Risk to development
outcome
Significant Significant Significant
Bank performance Moderately
satisfactory
Moderately
satisfactory
Moderately
satisfactory
Borrower performance Satisfactory Moderately
satisfactory Satisfactory
* The Implementation Completion Report (ICR) is a self-evaluation by the responsible Bank department. The ICR
Review is an intermediate IEGWB product that seeks to independently verify the findings of the ICR.

viii
Key Staff Responsible
Ethiopia Pastoral Community Development Project, Phase I
(COFN-04500, IDAH0380, TF- 52888)
Project
PCDP I Task Manager/Leader
Division Chief/
Sector Director Country Director
Appraisal Daniel M. Sellen Karen Brooks Ishac Diwan
Completion Assaye Legesse Karen Mcconnell Brooks Kenichi Ohashi
Ethiopia Pastoral Community Development Project, Phase II
(COFN-C1210, COFN-C1220, IDA-44580, IDA-H3950)
Project
PCDP II Task Manager/Leader
Division Chief/
Sector Director Country Director
Appraisal Ingo Wiederhofer Karen Mcconnell Brooks Kenichi Ohashi
Completion Assaye Legesse Tijan M. Sallah/Juergen
Voegele
Guang Zhe Chen

ix
IEG Mission: Improving World Bank Group development results through excellence in evaluation.
About this Report
The Independent Evaluation Group assesses the programs and activities of the World Bank for two purposes: first, to ensure the integrity of the Bank’s self-evaluation process and to verify that the Bank’s work is producing the expected results, and second, to help develop improved directions, policies, and procedures through the dissemination of lessons drawn from experience. As part of this work, IEG annually assesses 20-25 percent of the Bank’s lending operations through field work. In selecting operations for assessment, preference is given to those that are innovative, large, or complex; those that are relevant to upcoming studies or country evaluations; those for which Executive Directors or Bank management have requested assessments; and those that are likely to generate important lessons.
To prepare a Project Performance Assessment Report (PPAR), IEG staff examine project files and other documents, visit the borrowing country to discuss the operation with the government, and other in-country stakeholders, and interview Bank staff and other donor agency staff both at headquarters and in local offices as appropriate.
Each PPAR is subject to internal IEG peer review, Panel review, and management approval. Once cleared internally, the PPAR is commented on by the responsible Bank department. The PPAR is also sent to the borrower for review. IEG incorporates both Bank and borrower comments as appropriate, and the borrowers' comments are attached to the document that is sent to the Bank's Board of Executive Directors. After an assessment report has been sent to the Board, it is disclosed to the public.
About the IEG Rating System for Public Sector Evaluations
IEG’s use of multiple evaluation methods offers both rigor and a necessary level of flexibility to adapt to lending instrument, project design, or sectoral approach. IEG evaluators all apply the same basic method to arrive at their project ratings. Following is the definition and rating scale used for each evaluation criterion (additional information is available on the IEG website: http://worldbank.org/ieg).
Outcome: The extent to which the operation’s major relevant objectives were achieved, or are expected to be achieved, efficiently. The rating has three dimensions: relevance, efficacy, and efficiency. Relevance includes relevance of objectives and relevance of design. Relevance of objectives is the extent to which the project’s objectives are consistent with the country’s current development priorities and with current Bank country and sectoral assistance strategies and corporate goals (expressed in Poverty Reduction Strategy Papers, Country Assistance Strategies, Sector Strategy Papers, and Operational Policies). Relevance of design is the extent to which the project’s design is consistent with the stated objectives. Efficacy is the extent to which the project’s objectives were achieved, or are expected to be achieved, taking into account their relative importance. Efficiency is the extent to which the project achieved, or is expected to achieve, a return higher than the opportunity cost of capital and benefits at least cost compared to alternatives. The efficiency dimension generally is not applied to adjustment operations. Possible ratings for Outcome: Highly Satisfactory, Satisfactory, Moderately Satisfactory, Moderately Unsatisfactory, Unsatisfactory, Highly Unsatisfactory.
Risk to Development Outcome: The risk, at the time of evaluation, that development outcomes (or expected outcomes) will not be maintained (or realized). Possible ratings for Risk to Development Outcome: High, Significant, Moderate, Negligible to Low, Not Evaluable.
Bank Performance: The extent to which services provided by the Bank ensured quality at entry of the operation and supported effective implementation through appropriate supervision (including ensuring adequate transition arrangements for regular operation of supported activities after loan/credit closing, toward the achievement of development outcomes. The rating has two dimensions: quality at entry and quality of supervision. Possible ratings for Bank Performance: Highly Satisfactory, Satisfactory, Moderately Satisfactory, Moderately Unsatisfactory, Unsatisfactory, Highly Unsatisfactory.
Borrower Performance: The extent to which the borrower (including the government and implementing agency or agencies) ensured quality of preparation and implementation, and complied with covenants and agreements, toward the achievement of development outcomes. The rating has two dimensions: government performance and implementing agency(ies) performance. Possible ratings for Borrower Performance: Highly Satisfactory, Satisfactory, Moderately Satisfactory, Moderately Unsatisfactory, Unsatisfactory, Highly Unsatisfactory.

x
Preface
This is a Project Performance Assessment Report (PPAR) of Phase I and II of the 3-phase,
15-year Ethiopia Pastoral Community Development Program (PCDP). The projects were
approved by the World Bank’s Executive Board on May 20, 2003, and May 5th, 2008,
respectively. Estimated costs for the first phase were US$59.96 million, including US$30
million of International Development Association (IDA) financing, US$20 million of
financing from the International Fund for Agricultural Development (IFAD), and US$5.96
million of borrower finance, with the remaining US$4 million expected to come from
community contributions. Ninety percent of PCDP I resources were disbursed 12 months
prior to closing. The total costs for the second phase were US$138.7 million, including
US$80 million of IDA financing, US$39 million contributed by IFAD, US$5 million of
borrower financing, and US$14.7 million provided by the beneficiary communities. One
hundred percent of PCDP II’s IDA funds were utilized.
This report was prepared by Lauren Kelly, Task Team Leader, Kendra White, Consultant,
and Inder Sud, Senior Consultant. The field team was led by Kathryn Steingraber, with
support from Ebrahim Jemal, Numery Mohammed, Mohammed Mussa, and Mohammed
Usman. The report was peer reviewed by Marjory-Anne Brodhead and panel reviewed by
Judy Twigg. Warm thanks to Marie Charles and Vibhuti Narang Khanna for administrative
support, Caroline McEuen for editorial assistance and Amen Dankul, of the Addis office, for
logistics and translation support. The team undertook a mission to Ethiopia between
September 23 and October 2, 2015; this was followed by an extended period of fieldwork.
This assessment was conducted in parallel to an evaluation of the second phase conducted by
the International Fund and Agriculture (IFAD), a co-financier of the project. It was
commissioned to provide input to the forthcoming Rural Non-Farm Macro Evaluation. The
projects offered an opportunity to look at the way the World Bank has targeted and assisted
some of Ethiopia’s most vulnerable populations, with a focus on pastoralism and livestock.
Methodology. This assessment used a mixed-methods approach, including a desk review of
documentation (Implementation Completion and Results Reports, Project Appraisal
Documents, legal and project files, the mid-term and end evaluation); interviews with Bank
and project staff and other stakeholders; data analysis; and beneficiary interviews. Prior to
the PPAR, IEG examined secondary data obtained from the Central Statistics Authority to
determine whether relevant Woreda level data had been collected over the project period. (A
summary of the data collection and analyses methods are provided in the annexes). Since
relevant, Woreda level data was not available, IEG designed and conducted a beneficiary
feedback tool using a small n approach to test the project’s theory of change and to learn about
project implementation across different geographic and sociocultural areas of the country.
IEG thanks the Bank country management and staff and the PCDP management team for
facilitating a highly collaborative and informative mission. Following standard IEG
procedures, a copy of the draft PPAR was sent to the relevant government officials and its
agencies for their review and feedback. Comments were received in the form of track
changes from the government, and are summarized in Annex H. of this report.
xi
Executive Summary
This is a Project Performance Assessment Review (PPAR) of Phases I and II of the 3-phase,
15-year Ethiopia Pastoral Community Development Program (PCDP). The projects were
approved by the World Bank’s Executive Board on May 20, 2003, and May 5th, 2008,
respectively.
Pastoralists comprise a significant part of Ethiopia’s population, accounting for some 12
million of the total population of about 92 million. Located largely in the eastern and
southern parts of the country, bordering Somalia in the east and Kenya in the south,
pastoralists are among the poorest Ethiopians. Livestock is their primary source of
livelihoods, although increasingly many traditional pastoral communities are adopting agro-
pastoral livelihoods in response to several natural and policy-induced constraints. Pastoralists
in Ethiopia have been economically, socially, and politically marginalized because they have
been given inadequate attention by policy makers in the past.
Although significant improvements have been achieved over the last decade, pastoralists face
daunting challenges, including (i) poor access to basic social services, (ii) weak government
institutions that are not well aligned with traditional systems, (iii) limited public participation
in local decision-making processes, (iv) dependence on extensive livestock production with
poorly developed support services and uneven access to markets, (v) vulnerability to
recurring droughts exacerbated by climate change, and (vi) increasing competition for natural
resource use and constrained mobility due to new settlements and large-scale development
schemes.
The Pastoral Community Development Program, Phase I
The Pastoral Community Development Program, approved by the Bank in 2003, was the
Bank’s first major intervention to support the development of pastoral areas. It envisaged
improving livelihoods of pastoralists on a sustainable basis while reducing their vulnerability
to cyclical climatic shocks. Phase I of the project, approved in 2003, sought to assist the
government “in establishing, within pastoral areas, effective and functional models of public
service delivery, investment and disaster management that address communities’ needs.”
The relevance of the objective of the first phase is rated substantial. The project
development objectives (PDOs) were relevant to the government strategies for alleviating
rural poverty and were supportive of its decentralization process. The first-phase objective
was clear and achievable; it responded to critical service delivery needs of some of Ethiopia’s
poorest citizens. The elevation of the disaster risk aim to the PDO statement was difficult to
achieve, however. It would have been better maintained as an important component of the
project, designed to achieve the broader service delivery aims of the first phase.
The relevance of design of PCDP Phase I is rated modest. The decision to proceed with a
three-phase adaptable program loan (APL) made sense. It recognized the lengthy process of
pastoral area development and that better integration of pastoral communities into the
national economy would be more likely to be achieved through a protracted approach. The
xii
program was built around the concept of community-driven development (CDD), the first
time this type of approach was implemented in Ethiopia, with a strong focus on
decentralization and community empowerment. It benefited from strong collaboration with
both the International Fund for Agricultural Development (IFAD) and the Food and
Agriculture Organization (FAO). The relevance of design was undermined, however, by
inattention to technical assistance and training of communities, especially in relation to the
development of small rural enterprises. Attention to gender was also noticeably lacking in
Phase I. The CDD approach required greater sensitization and awareness of how to roll this
type of programming out in pastoral areas.
The first phase objectives were only Modestly Achieved. Despite initial delays and
implementation difficulties, PCDP I trained a number of local government staff and
communities in the CDD approach, and significant outputs were produced under the
investment model that addressed critical service-delivery needs. However, most of these
investments failed, and other services, such as a disaster risk warning system, were not yet
implemented by the end of the first phase. The disaster risk management activities fell short
because of a lack of strategy to underpin the investments and weak implementation.
Efficiency is assessed to be modest for the first phase. PCDP I did not collect or assess the
economic or social rates of return of its investments, although an external assessment of the
income-generating activities did demonstrate that most of these investments ultimately failed.
Rushed disbursements toward the end of the project cycle undermined the economic rates of
return of the investment, and by project close, 25 percent of the subprojects initiated were not
completed, and 20 percent of the completed projects were not operational.
Bank performance is rated moderately unsatisfactory for PCDP I. The Phase I project
was adequately supported by sector work and was developed in close collaboration with
other donors and stakeholders. The Bank responded promptly to the government's request for
help at a critical time, when pastoral communities in Ethiopia were suffering from severe
climatic shocks. However, because of several shortcomings, quality at entry is rated
unsatisfactory. There was low importance given to structural and sector policy reforms for a
project of this nature, where decentralization and institutional development are critical to
successfully implementing an APL program. There were serious capacity constraints for
implementation, particularly at the woreda level, and risks of elite capture. At entry, the
government’s decentralization process was also just emerging. Supervision is rated
moderately unsatisfactory. There was not enough attention to the quality and continuity of
training, nor to the attitudes and needs of mobile support team members who were being
asked to move to and live with pastoral communities. There were also long gaps in
supervision missions. After the mid-term review (MTR), the quality and intensity of
supervision picked up substantially. Phase I also experienced some financial management
and procurement challenges, which would be expected from a project just starting up in very
remote areas.
Borrower performance is rated unsatisfactory for the first phase of PCDP. Government
performance and implementing agency performance are rated unsatisfactory. There was solid
government commitment throughout the first phase, with the Ministry of Federal Affairs
xiii
(MoFA) providing strong leadership in ensuring good project management and coordination
at the field level. However, a sudden shift of project responsibility from the Ministry of
Agriculture to MoFA implementation capacity hindered project start-up. The protracted
restructuring of institutions responsible for disaster preparedness and prevention hampered
performance of the pastoral risk management component. Poor cooperation between
government units held up implementation and delayed staff recruitment, and shortfalls in
budget and staffing constrained the effectiveness of the mobile outreach teams. Actual
counterpart financing was only 68 percent of the appraisal projection. The Federal Project
Coordination Unit (FPCU) experienced teething pains during the launch of the CDD
approach, as would be expected. However, the FPCU did not comply systematically with the
procedures in the operating manual: the sequencing and selection criteria for subproject
selection were not enforced, staff was not adequately trained, and coordination with partner
organizations was weak. There were also failures in the management and delivery of funds,
which resulted in hasty decisions, in some cases influenced by political pressure, and
financial commitments beyond the financial capacity of the project.
The overall outcome for PCDP I is rated moderately unsatisfactory.
Pastoral Community Development Project, Phase II
The objective of the second phase of the Pastoral Development Community Project,
approved in 2008, was to “increase pastoralist communities’ resilience to external shocks and
improve the livelihoods of Beneficiary Communities, thereby to contribute to overall poverty
alleviation in the territory of the Recipient.”
The relevance of the objectives of the second phase is rated substantial. The PDOs were
relevant to the government strategies for alleviating rural poverty and were supportive of the
government’s decentralization process. The second-phase objective lacked specificity,
however, with regard to the definition of livelihoods (defined as growth and stability of
incomes, access to social and public services, improved social relations and institutions, and
reduction of vulnerability in the project appraisal document). The objective was substantially
relevant to the needs of pastoral communities, but the addition of the broader poverty-
reduction aim was unrealistic with regard to the scope and nature of project design.
The design of the second phase gained relevance by making improvements to program
design, but is rated modest by this assessment, because of several shortcomings. The
income-generating activity model—focused on productive group assets—was replaced by a
community investment fund that offered a simpler menu of basic public goods that groups
could agree on and operate together more efficiently. Recognizing the need for access to
finance, a rural savings and lending model—with a strong gender focus—was added, in line
with the capacity and culture of the pastoral areas. However, Phase II design was undermined
by a lack of targeting and a differentiated design for agro-pastoralists versus mainly
nonsedentary herders, and a more nuanced understanding of constraints and behaviors across
the very different regions of Ethiopia’s lowlands. The causal chain was weakened by the lack
of an explanation of how the service delivery investments would lead to poverty reduction, in
light of the scope of the project in relation to the enormity of the project population’s needs.

xiv
The second phase objectives were substantially achieved. The project had significant
accomplishments in providing the essential social and economic livelihood services
demanded by the communities: basic education, water, access roads, and human and animal
health. Nevertheless, the metric used with regard to “access” versus “use” does not allow for
a full validation of the number of persons that actually benefited from the project-financed
infrastructure. Field visits conducted across four regions attested to the high level of
relevance and sustained use of this infrastructure, while recognizing the limitations noted by
the external assessment with regard to the lack of equipment and trained personnel. The rural
savings and lending groups promoted by the project were highly successful in mobilizing the
communities, notably women, to save and invest. However, reduction of vulnerabilities
through the disaster management activities was only modestly achieved. The early warning
systems supported by the project were undermined by an uncoordinated approach among
donors and the government: there are many different actors and systems involved, and,
critically, long response delays. The country was experiencing the worst drought since 1992
at the time of the IEG visit. Although various donor-supported early warning systems had
alerted the government to the pending crises, the response (at the federal level) did not
materialize within the parameters assigned by the project. Public investments, financed by
the project and designed to mitigate risks, seemed to differentiate little from other project
investments. The choice of assets and their strategic prioritization was also in question.
Efficiency of the second phase is rated substantial. PCDP II did not conduct an economic
or financial assessment of the investments made under the second phase. It missed an
opportunity, for example, to attempt to calculate some of the returns on investments made
during the first phase. There are attributable positive returns that can be linked to the rural
savings and lending groups, with regard to the accumulated savings, funds leveraged, and
related investments. Other, infrastructure-related aspects of the project are reported to have
lower costs compared with state-financed and -planned infrastructure investments.
Bank performance in the second phase of PCDP is rated moderately satisfactory.
Quality at entry is rated moderately satisfactory. Lessons learned from implementing the first
phase shaped improvements in the design and implementation arrangement of the second.
The addition of new components, such as the rural savings and lending groups that addressed
critical constraints reflects an awareness of the operating environment and continued learning
in this program. Attention to gender was significantly improved. Supervision is rated
moderately satisfactory.
Supervision and implementation support missions were conducted jointly with IFAD and
included technical experts who provided inputs on critical aspects of this project, including
gender, access to land, water and sanitation, safeguards, financial management, and
procurement. The mid-term review was comprehensive, and there was timely follow-up on
important issues such as the overhaul of the indicators in the results framework, which led to
formal proposals for the project's restructuring. Bank financial management and procurement
staff were actively involved i, and greater community ownership contributed to cost
effectiveness and transparency in the procurement process.

xv
Borrower performance of the second phase of PCDP is rated satisfactory. Government
and implementing agency performance is rated satisfactory. In the second phase, the roles of
government agencies involved in implementation were more clearly defined than in the first
phase. Considerable institutional capacity had been built, and there is evidence that the CDD
approach has been internalized by the government at different levels. MoFA provided
satisfactory support to the project. It was effective in handling the project's administration at
the central government level, it facilitated the mobilization of counterpart contributions at the
regional level, and it has provided strong leadership in ensuring good project management
and coordination at the field level. One area where government performance could have been
smoother was in its coordination with the Ministry of Agriculture and the Early Warning
Response Department. There were occasional lapses in the disbursement of central
government funds to the regions, with resulting delays in implementation. There were also
some weaknesses in the project's financial management and procurement, especially in the
earlier years. Capacity constraints at the woreda level and lack of familiarity with guidelines
and procedures led to poor handling of procurement, despite Bank efforts to conduct annual
procurement reviews, trainings, and clinics. Financial management was also weak.
Inadequate forward financial planning, insufficient management oversight, and weak
accountability systems led to delayed submission of statements of expenditure. But
significant improvements were made under PCDP II. The rural savings and lending groups
have received the required supervision and technical support under the Federal Cooperative
Agency, and reporting was generally of good quality, detailed, and submitted on time.
The overall outcome rating for PCDP II is moderately satisfactory.
Risk to development outcomes/risks to achieving the programmatic aims are rated
substantial. There is a substantial risk to sustaining the level of reduced vulnerability and
livelihood outcomes achieved in a non-project scenario, especially with regard to access to
critical service delivery in remote rural pastoral areas. While the project has dampened the
effects of crises by helping to build resilience through public investments and savings,
pastoralists continue to be exposed to cyclical shock, and many of the constraints that foster
this vulnerability were not addressed by the project design in either phase.
Overall, while the two projects assessed made a significant contribution to meeting critical
social and economic infrastructure needs, the link from investments to the desired high-level
outcomes at the programmatic level is unclear. The overall development objective for the
APL was to improve livelihoods (incomes and assets) of pastoralists on a sustainable basis
and reduce their vulnerability. But the thrust of the bulk of project interventions was toward
the provision of social infrastructure and some limited economic infrastructure. These
investments are critical to improve the well-being of the communities, and indeed are highly
appreciated by the beneficiaries, but it is difficult to establish the pathway from the
investments to the overall project objective of creating sustainable livelihoods. A sustainable
livelihood-centered approach would have required a much broader range of coordinated
investments, taking into account the combination of investments package needed to
significantly elevate livelihoods. Given the constraints and challenges of pastoralist
communities, a sustainable livelihood approach would be centered on water, improving

xvi
livestock production and marketing chains, rangeland management, and promoting
supplementary sources of income, including agriculture. PCDP interventions are far too
limited and incomplete to result in sustainable livelihoods for pastoralists. While PCDP III
expands the livelihood component by enhancing access to finance and helping pastoralists to
develop innovative, income-diversifying business activities and/or to strengthen existing
productive activities, these activities are still unlikely to be very significant in relation to the
broader strategic approach needed.
Lessons
High-Level Lessons on Program Strategy and Sequencing
Programmatic approaches that involve multiple projects over a long period of time are
more effective when they measure the extent to which overall programmatic objectives are
being met, in addition to assessing project outputs. A results framework is needed that
specifies not only the short-term objectives of each of the projects in the series, but also how
these link to the overall program objectives. Monitoring and evaluation systems should track
not only individual project accomplishments, but should also be designed to assess the
programmatic objectives, even if these can only be achieved over time.
Triggers for moving forward with successive phases of an adaptable program are more
effective when they take stock of the extent to which the project is meeting its overall
program aims. This stock-taking should promote mid-course correction based on lessons. A
rigorous independent impact assessment conducted after each phase can provide the more
accurate information needed to ensure that the program is phased well.
The Bank can use the body of knowledge gained through its successive project
interventions to help governments develop an informed sector strategy, especially in
difficult and uncertain areas such as pastoral development. While the Bank may choose to
proceed with project support, it is critical that in the absence of a clear approach, Bank
experience be used to support the development of such a strategy through dialogue and
continued engagement.
Project-Specific Lessons
Support for household or small rural income generating activities is more effective when
based on needs and capacity assessments and supported by business planning, training,
legal and technical assistance, and the supply of affordable finance. Group-executed
activities are complex. They require trust and cooperation among members of groups that, if
formed by the project, require time to build trust. The decision to support individual versus
group economic activity should be based on an understanding of social norms and economic
relationships.
Rural savings and credit groups can be successful when there is a strong sense of cohesion
in the community, when they have a predominant focus on women, and when they are
supported with adequate and sustained capacity-building support. Seed capital and clear
rules of the game were also found to be key ingredients in helping to ensure the success of
the rural savings and lending groups in Ethiopia.

xvii
When dealing with mobile pastoral communities, consideration should be given to
different service provision approaches such as mobile schools and health to supplement
the classic participatory local development model, which is better suited to sedentary
populations.
Marvin Taylor-Dormond
Director, Financial, Private Sector, and
Sustainable Development Department


1
1. Background and Context
Country Context
1.1 Ethiopia is a landlocked country in the Horn of Africa. It covers 1.1 million square
kilometers, and nearly half of this area is characterized by pastoralist lowlands. It has a wide
range of climates, soils, and vegetation, but it is also vulnerable to food and fuel terms-of-
trade shocks, as well as weather-related shocks. Ethiopia has the sixth-largest economy in
Sub-Saharan Africa, although this ranking is a product of its large population rather than high
per capita income. Ethiopia’s per capita income of US$500 in 2014 made it one of the
poorest countries in the world. With a population estimated at approximately 92 million in
2014 (EIU 2015), Ethiopia is the second-most populous country in Sub-Saharan Africa
(World Bank Group 2013). The rural population is estimated at 78 million, or 81 percent of
the total population. Population growth remains high, at 2 percent, and Ethiopia is expected
to reach a population of over 120 million by 2030.1
1.2 Ethiopia has a federal democratic government system, established in the early 1990s,
with nine autonomous states (regions) and two chartered cities. Decentralization of
governance to the regional and district (woreda) levels has been actively pursued, intensively
since 2003. The Ethiopian People’s Revolutionary Democratic Front has been in power in
Ethiopia since 1991. Its nine regions, based on ethno-linguistic communities, or kililoch, are:
Afar, Amhara, Benishangul-Gumuz, Gambela, Harari, Oromia, Somali, Southern Nations,
Nationalities and Peoples (SNNPR) Region, and Tigray. These regions are further subdivided
into 68 zones and 770 woredas, or districts, of which 670 are rural and 100 are urban. Each
woreda is composed of a number of kebeles (Amharic for “village”), or wards, which are the
smallest unit of local government in Ethiopia. Districts are governed by a Woreda Council,
whose members are directly elected to represent each kebele in the relevant district. Each
kebele consists of at least 500 families, or the equivalent of 3,500–4,000 persons. There is at
least one in every town with a population over 2,000. A Keftanya, or representative, has
jurisdiction over 6 to 12 kebeles World Bank Group 2013).
1.3 The country has experienced strong economic growth in the last decade—averaging
10.4 percent since 2004 (World Bank Group 2015). This has led to a significant improvement
in social and human development over the past decade (Table 1.1). Indeed, Ethiopia is
among the countries that have made the fastest progress on the Millennium Development
Goals over the past decade. Good progress has been achieved in universal primary education,
although the reduction of maternal mortality remains a key challenge (World Bank Group
2013). Despite the major economic and social improvements over the last decade, some 25
million Ethiopians currently remain trapped in poverty and vulnerability. With a Human
Development Index (HDI) of 0.435 in 2013, the country is still classified as a low human
development country, based on the United Nations Development Program’s (UNDP’s)
Human Development Index.
1 World Bank Group, World Development Indicators.

2
1.4 Sustained high economic growth has helped reduce overall poverty in both urban and
rural areas. Since 2005, 2.5 million people have been lifted out of poverty, and the share of
the population below the poverty line has fallen from 38.7 percent in 2004/05 to 29.6 percent
in 2010/11, using a national poverty line of US$0.6/day (World Bank Group 2013, p. 2), or
38.9 percent in 2005 to 36.7 percent in 2010, using US$1.25/day.2 Because of high
population growth, the absolute number of poor has remained unchanged over the past 15
years.
Table 1.1. Select Human Development Indicators
Ethiopia
2003/04
2014/15
available
GNI per capita (Atlas method, US$) 130 550
Poverty headcount ratio at national poverty line (% of population) 39 30a
Life expectancy at birth (years) 56 64b
Infant mortality (per 1,000 live births) 74 41
Access to electricity, rural (% of rural population) 5 8c
Improved sanitation facilities, rural (% of rural population with access 12 28
Improved water source, rural (% of rural population with access) 27 49
GINI Coefficient 30 34
Source: World Development Indicators.
a. Data only available for 2010. b. Data only available for 2013. c. Data only available for 2012.
1.5 While overall growth over the project period has had a positive effect on both urban
and rural areas in Ethiopia, parts of the lowlands inhabited primarily by pastoral and agro-
pastoral communities continue to be extremely vulnerable in the face of shocks. Climate
shocks, such as severe drought, are common in Ethiopia and often lead to poor or failed
harvests, unseasonal migration, and livestock deaths, which result in high levels of acute food
insecurity and loss of income. The 2015 droughts, for example, have been reported to be as
catastrophic as the droughts that befell Ethiopia in 1965–66, 1972–73, and 1984–85. The
hardest-hit areas are Ethiopia's eastern Afar and southern Somali regions, areas targeted by
the projects under review, while pastures and water resources are also unusually low in
central and eastern Oromo region and the northern Tigray and Amhara districts, all areas
where the population is predominately pastoral. Pastoral livelihoods are also challenged by a
deteriorating resource base that amplifies exposure to substantial environmental and climate
risks that affect food and water security, energy, and human health, among other matters.
Project Context
1.6 Pastoralism in Ethiopia relates both to an economic livelihood system that is
based primarily on extensive livestock production and to the characteristics of
2 World Development Indicators, April 2015.

3
communities that live in the arid and semi-arid lowlands of Ethiopia (Box 1.1).
Pastoralism is extensively practiced in the Afar and Somali regions, and in some zones of the
Oromia region, and in the SNNPR—areas that were targeted by the projects under review.
These lowlands include over 7 million people and 11 million animals. Pastoralists’ only
assets are their animals, but they diversify their livestock portfolios by breeding cows, goats,
camels, and sheep. Pastoralist households can be categorized into three groups: (i) the
comparatively wealthy, who hold substantial livestock assets; (ii) households with small
herds and flocks and who, to some extent, depend on cropping, petty trading, or sale of their
labor (“agro-pastoralists”); and (iii) those who are gradually abandoning pastoral livelihoods.
Pastoralist areas are characterized by constraints that include low levels of infrastructure
development and weak social services such as health and education, and pastoral
communities in Ethiopia are among the poorest and most neglected sections of the population
(World Bank Group 2013).
1.7 Livestock production plays an important role in the Ethiopian economy, and
livestock trade is a key element in the livelihood systems of the country’s pastoralists. At
the beginning of the Pastoral Community Development Program (PCDP) period, about 93
percent of Ethiopia’s pastoral area population depended directly on livestock for subsistence.
An increase in demand for livestock in both domestic and regional markets in neighboring
countries such as Somalia, Djibouti, Kenya, and the Sudan has been driving changes in
pastoralist livelihood systems. Most particularly, there has been an increase in
commercialization of livestock, which led to a consolidation of herds. While some pastoral
households have been able to improve their livestock-based livelihoods, others have been
unable to maintain their traditional livelihoods as viable undertakings.
1.8 A number of factors affect the success of pastoralists in their attempts to grow their
livestock production systems. The most important of these are access to good rangeland as
well as mobility, access to markets, access to services (such as animal health care), and
severity of climatic shocks. Pastoralists, who employ mobility as a key strategy for raising
livestock, are prone to periodic and unexpected climatic shocks, perhaps more than sedentary
farmers. Livestock dynamics in pastoral areas (especially in Afar and Somali) follow up-and-
down patterns. The livestock population collapses following droughts, but then revives with a
few good years. The livestock population in pastoral areas is therefore subject to sudden and
considerable variation, depending on the intensity and duration of droughts and rainfall
(USAID 2003).

4
Box 1.1: Applying Livelihoods Analysis to Understand the Characteristics of Pastoral
Communities
Livelihoods analysis aims to understand how people source, develop, and use assets within a
complex set of trends, shocks, and formal and informal policies and institutional settings. Such
analysis is commonly based on a livelihoods framework that categorizes assets in terms of five
main types of capital:
Human capital represents the skills, knowledge, ability to labor, and good health that enable
people to pursue different ways of making a living. In pastoral areas, formal education and health
services are often poorly developed, and literacy and health are low. However, pastoralists possess
rich indigenous knowledge on livestock health and production, and some communities have
traditional healers and traditional schools.
Social capital is the social resources people use to pursue different ways of making a living. It
includes networks, group membership, relationships of trust, and access to wider institutions of
society, including political institutions. The concept of reciprocity is important, as are the
exchanges that facilitate cooperation, reduce transaction costs, and safeguard the poor. Pastoralists
often have strong social capital at the community level, with complex systems of indigenous social
support based on the exchange of livestock.
Financial capital is the financial resources that people use to achieve livelihood objectives. It
relates to both production and consumption, and the availability of cash, which enables conversion
to other types of capital. In pastoralist communities, financial capital is based on the ownership of
livestock or access to livestock resources. People consume directly from livestock and sell
livestock and products. Markets are a crucial factor in the attainment of financial capital.
Natural capital is the natural resources people use to make a living, including soil, water,
vegetation, and wildlife, and encompassing access rights and land ownership. In general, pastoralist
areas are characterized by low rainfall with high spatial variability. It is this rainfall pattern that
largely determines the seasonal movement of pastoral herds and the seasonal variations in
production and markets.
Physical capital is the infrastructure and producer goods needed to support livelihoods. In pastoral
areas, the physical capital required to support production—including roads, information and
communications technology, other infrastructure, and markets—is poorly developed.
Access to and use of these different types of capital is determined by various factors:
Seasonality, including variations in rainfall, livestock production, and the terms of trade for
livestock and cereals.
Trends, such as global climatic trends, the increasing occurrence and severity of drought, the
growth of export markets for livestock, environmental change associated with bush encroachment,
private enclosure of rangeland, and human population growth.
Shocks, such as livestock disease epidemics and conflict. As drought becomes more regular and
predictable, it might be categorized as a seasonal factor rather than a shock.
n addition, pastoralist livelihoods are affected by various formal and informal norms, policies, and
institutions.
Source: IEG adaptation of Ethiopia 2008.

5
1.9 Humanitarian assistance in pastoral areas has been dominated by food aid since
emergency interventions began in the 1970s, and food aid provision has been based on the
objective of saving human lives. However, it is increasingly recognized that support provided
in response to recurrent droughts or floods should be part of a more systematically delivered
development assistance program that focuses on developing sustainable livelihoods and
enhancing resilience to recurrent shocks. In pastoral areas, livelihoods-based emergency
programming means protection of pastoral livestock in appropriate numbers and support to
the services and markets needed to assist in a rapid recovery.
1.10 Ethiopia has developed a formal policy for pastoral development that promotes
voluntary sedentarization, but there is not yet a well-articulated strategy to achieve the
policy objective. The 1995 constitution incorporated the issues of pastoralists for the first
time. It provided pastoralists with the right to free land grazing and to not be displaced from
their own lands against their wishes. It also formed a department in the Ministry of Federal
Affairs (MoFA) that coordinates and facilitates development in pastoral areas, and set up a
Pastoralist Affairs Standing Committee in the parliament, which oversees pastoral
development activities in the country. Pastoral development is included in national
development plans (2000–04 and 2005–09), the Plan for Accelerated and Sustained
Development to End Poverty (PASDEP 2005/06–2009/10), and the Growth and
Transformation Plan (GTP 2010–15), The GTP’s plan for pastoral development gives
priority to water development and sets ambitious targets of increasing combined export
earnings from live animals and meat exports from US$125 million in 2009/10 to US$1
billion in 2014/15. The GTP seeks to facilitate the voluntary transition of pastoralists toward
permanent settlement, particularly through the development of both small- and large-scale
irrigation infrastructure, improvement in human capital, development of market networks,
development of financial services, and investment in road infrastructure and communication
networks. However, there is no overarching, cohesive pastoral development strategy for the
country. Donors, while subscribing to the policy as long as sedentarization is truly voluntary,
have been cautious, owing to concerns that some settlement activities have not been
voluntary. There is also a high level of reputational risk associated with these activities
because of their high level of exposure by civil society.
2. The Pastoral Community Development Program
2.1 The 2003 approval of the Adaptable Program Loan (APL) for the PCDP was the
Bank’s first major intervention to support development of pastoral areas. It envisaged
improving the livelihoods of pastoralists on a sustainable basis while reducing their
vulnerability to the climatic shocks they have been experiencing with increasing regularity in
recent years. The underlying approach was to provide basic essential social services to
pastoral communities, help with diversification of income-generation activities, provide early
warning of impending disasters to allow ameliorative measures to be implemented, and
promote infrastructure and related investments to help cope with disasters. The program was
built around the concept of community-driven development (CDD). This was the first time
the approach was attempted in Ethiopia, with its emphasis on the importance of
decentralization and community empowerment. This was a considerable innovation for the
country. The 15-year, 3-phased program (currently in Phase III, as of November 2015)
covered a total of 55 pastoral and agro-pastoral woredas in communities in the Afar, Somali,

6
Oromia, Amhara, Tigray, and SNNP regions (Box 2.1). During the first phase, a total of 32
woredas in four regions (25 percent of total pastoral and agro-pastoral woredas) were reached
by the project. For the second phase, the number of woredas was raised to 57 (32 existing
and 25 new) in the same regions, including Afar (14 woredas), Somali (21 woredas), SNNP
(6 woredas), and Oromiya (14 woredas). This represents approximately 45 percent of
pastoral and agro-pastoral woredas in the country.
Beneficiaries and Targeting
2.2 The primary target population of the APL is the pastoral and agro-pastoral population
of Ethiopia living in the arid and semi-arid areas of the country, and reaches approximately
55 pastoral and agro-pastoral woredas of the Afar, Somali, Oromiya, and SNNP National
Regional States, representing approximately 45 percent of the pastoral and agro-pastoral
woredas in Ethiopia.
2.3 The APL did not use poverty targeting per se, although the pastoral areas are
generally recognized as among the poorest areas in the country. However, within the pastoral
areas the project documentation does not give an explanation as to how different woredas
within the pastoral areas, or how kebeles within a woreda, were selected. This was
presumably based on the assumption that the level of poverty is similar in all of them.
Unfortunately, there was not adequate poverty data available for pastoral areas to underpin
this assumption, so the evaluation cannot confirm the adequacy of the targeting approach.
Moreover, while the project did not have an explicit gender focus, women were active in the
project-supported rural savings and credit cooperatives (RUSACCOs).
Financing
2.4 PCDP I and II were financed by the World Bank, the International Fund for
Agricultural Development (IFAD), the government of Ethiopia, and beneficiary
communities. Phase I became effective in September 2003 and closed in December 2008.
Estimated project costs were US$59.96 million, including US$30 million of International
Development Association (IDA) grant financing, US$20 million of IFAD financing, and
US$5.96 million of borrower financing; the remaining US$4 million was expected to come
from community contributions. Ninet-four percent of PCDP I funds were disbursed 12
Box 2.1. The Pastoral Community Development Program
Duration: 2003–18 (15 years)
Implementation: 3 phases (2003–08, 2008–13, 2013–18)
Project intervention: Phase I in 32 woredas; Phase II in 55 woredas; Phase III in 113 woredas
Beneficiary communities: Phase I – 600,000; Phase II – 1,300,000Phase III – 2,600,000
Project budget: $408.9 million: Phase I – US$60m; Phase II – US$138.7m; Phase III –
US$210.2m
Source: IEG adaptation from project documentation
7
months before closing (XDR 21.6 million of XDR 22.0 million was disbursed at closing)
(World Bank Group 2008d).
2.5 Phase II became effective in October 2008 and closed in December 2013. The total
budget earmarked for the second phase of the project was US$138.7 million—US$80 million
was covered by the World Bank, US$39 million by IFAD, US$5 million by borrower
financing, and US$14.7 million by the beneficiary communities. One hundred percent of
PCDP II’s IDA funds were utilized (World Bank Group 2014).
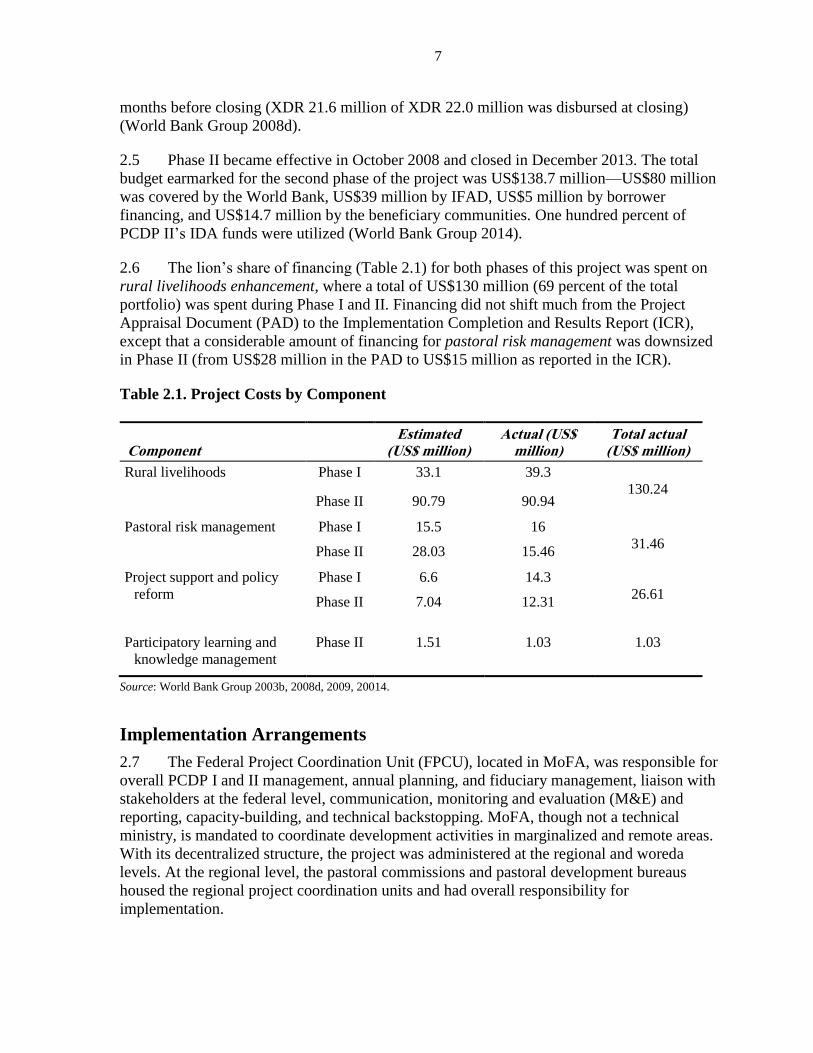
2.6 The lion’s share of financing (Table 2.1) for both phases of this project was spent on
rural livelihoods enhancement, where a total of US$130 million (69 percent of the total
portfolio) was spent during Phase I and II. Financing did not shift much from the Project
Appraisal Document (PAD) to the Implementation Completion and Results Report (ICR),
except that a considerable amount of financing for pastoral risk management was downsized
in Phase II (from US$28 million in the PAD to US$15 million as reported in the ICR).
Table 2.1. Project Costs by Component
Component Estimated
(US$ million) Actual (US$
million) Total actual
(US$ million)
Rural livelihoods Phase I 33.1 39.3
130.24 Phase II 90.79 90.94
Pastoral risk management Phase I 15.5 16
31.46 Phase II 28.03 15.46
Project support and policy
reform
Phase I 6.6 14.3
26.61 Phase II 7.04
12.31
Participatory learning and
knowledge management
Phase II 1.51 1.03 1.03
Source: World Bank Group 2003b, 2008d, 2009, 20014.
Implementation Arrangements
2.7 The Federal Project Coordination Unit (FPCU), located in MoFA, was responsible for
overall PCDP I and II management, annual planning, and fiduciary management, liaison with
stakeholders at the federal level, communication, monitoring and evaluation (M&E) and
reporting, capacity-building, and technical backstopping. MoFA, though not a technical
ministry, is mandated to coordinate development activities in marginalized and remote areas.
With its decentralized structure, the project was administered at the regional and woreda
levels. At the regional level, the pastoral commissions and pastoral development bureaus
housed the regional project coordination units and had overall responsibility for
implementation.

8
2.8 The Federal Cooperatives Agency, housed under the Ministry of Agriculture (MoA),
implemented the Rural Livelihoods Program through the regional cooperative promotion
bureaus and relevant woreda cooperative promotion desks. Mobile support teams (MSTs)
provided basic training and support to pastoral RUSACCOs at the community level in areas
where the promotion desks required support.
2.9 The early warning and response desks (EWRDs) of MoA managed the Pastoral Risk
Management Component under a Memorandum of Understanding with MoFA, and this
component was implemented by the regional early warning and response bureaus (EWRBs)
and woreda EWRDs. Early responses were financed through Disaster Early Response Grants,
which were administered at the regional level under a EWRD/EWRB management system
supported by regional project coordination units.
2.10 At the woreda level, the Woreda Development Committee (WDC)—comprised of the
heads of the offices of pastoral development for agriculture, water, education, health, rural
roads, small and micro enterprises, and cooperative promotion, as well as representatives of
nongovernmental organizations (NGOs) active in the woredas and of microfinance
institutions (if available), and chaired by the woreda administrator or his deputy—is
responsible for all woreda-level activities. At the kebele level, the Kebele Development
Council, comprised of the kebele chairman, community procurement member, development
agent, a teacher or school director, and the like, is responsible for all kebele-level activities.
2.11 There was a late change (at PCDP I appraisal) of the anticipated project-executing
agency from the MoA to MoFA, a change that had material implications since MoA was
more decentralized and experienced in pastoral development issues and participatory
approaches. MoFA was new, and, by its own admission, was more “an agency that pulls
federal resources to states” than a project implementing agency (World Bank Group 2009b,
p. 5).
3. Pastoral Community Development Project – Phase I
Objective, Activities, and Relevance of Objectives
3.1 Phase I’s Development Grant Agreement, approved in 2003, proposed to pursue the
program objectives by assisting the government “in establishing, within pastoral areas,
effective and functional models of public service delivery, investment and disaster
management that address communities’ needs.” (World Bank Group 2003a, p. 17). The PAD
further disaggregated this into three objectives: (1) build local capacity, (2) establish
effective models of public service delivery and investment, and (3) establish effective models
of disaster management in pastoral areas. While this evaluation assesses Phase I in terms of
the objectives as stated in the Development Grant Agreement, it also considers (but does not
rate) project support for capacity building. PCDP I emphasized capacity building and pilot
testing to set the stage for larger follow-on investments under the APL, although at the same
time it had an ambitious investment program goal of covering 32 woredas. There were
specific triggers that PCDP I had to meet before proceeding to follow up Phase II
investments.
9
3.2 PCDP Phase I largely set up the community-driven approach within the government’s
decentralization plan, delegating increased authority and responsibility and the relevant
mechanisms to the kebele (subdistrict) and woreda (district) levels, operating within the
regional government structure. This was to enable pastoralists to identify, design, and
implement community-driven micro-projects that reflected their development priorities.
Under the Sustainable Livelihoods Component, project activities included: (i) capacity
building, where MSTs would work with woreda administrations and their technical and
social support offices to train communities, using participatory learning and action tools to
formulate community action plans (CAPs) reflective of their development priorities, which
would then be amalgamated into woreda development plans; (ii) the Community Investment
Fund (CIF), that provided funding for community-prepared and WDC-appraised subprojects
and income-generating activities (IGAs); and (iii) support services, to finance infrastructure
investments and strengthen public service delivery at the regional and woreda levels.
3.3 The Pastoral Risk Management Component aimed to improve drought preparation
through steps to mitigate risk and reduce vulnerability. Project activities included: (i)
community-based early warning systems (EWSs), to build on ongoing efforts of the federal
Disaster Prevention and Preparedness Commission and NGOs to establish (at the woreda
level) the collection and analysis of basic household welfare data using a pastoral production
systems survey instrument; (ii) disaster contingency planning, to invest in capacity at the
woreda and regional levels to prepare disaster preparedness and contingency plans (DPCPs),
including both mitigation activities and rapid response activities, monitor local disaster
indicators, and manage disaster response funds; and (iii) a Disaster Preparedness and
Contingency Fund (DPCF), to provide the woredas with grants to finance activities identified
in their DPCPs.
3.4 The Project Support and Policy Reform Component aimed to provide operational
and training support to the FPCU in Addis Ababa and the regional project coordination units.
Activities included project support and coordination, M&E; and policy analysis and reform.
Relevance of Project Objectives
3.5 The relevance of objectives for PCDP I is rated substantial. The Phase I objectives
are relevant to the country’s national development plans. The government singled out
pastoral development as a key element of its Plan for Accelerated and Sustainable
Development to End Poverty, 2005–10. Pastoral development is included in national
development plans (2000–04 and 2005–09), the Plan for Accelerated and Sustained
Development to End Poverty (PASDEP 2005/06–2009/10), and the Growth and
Transformation Plan (GTP 2010–15).
3.6 PCDP I was implemented over three Country Assistance Strategy (CAS) cycles. The
FY03–05 CAS was based on Ethiopia's Sustainable Development and Poverty Reduction
Program (SDPRP, as the PRSP is known) and focused on: (i) fostering pro-poor growth; (ii)
enhancing human development outcomes by improving governance; and (iii) reducing
vulnerability. PCDP I (and II) were the main investment programs in the lowland areas in
promotion of the FY06–07 Interim Country Assistance Strategy objective of addressing
vulnerability and growth. The strategic objective in the FY08–11 CAS was consistent with

10
the PASDEP—that is, fostering economic growth to sustain the emerging economic take-off,
improving access to and quality of basic service delivery, and reducing vulnerability to help
improve the prospects for sustainability. Hence, the project objectives continued to be in line
with the Bank's strategic partnership with Ethiopia until PCDP I closed in December 2008.
3.7 Phase I’s objectives of "(i) establishing effective models of public service delivery
and investment; and (ii) establishing effective models of disaster management in pastoral
areas that address communities needs and reduce their vulnerability" were clear and
achievable, and they responded to critical service delivery needs of some of Ethiopia’s
poorest citizens. The elevation of the disaster risk management aim to the PDO statement
was more difficult to achieve, however, and would have been better maintained as an
important component of the project, designed to achieve the broader service delivery aims of
this first phase.
Relevance of Project Design
3.8 The relevance of design of Phase I is rated modest. Overall, PCDP I design
benefited from strong collaboration with both IFAD and the Food and Agriculture
Organization (FAO). The decision to proceed with a three-phase APL made sense. The
programmatic approach recognized the longevity of the effort and the need for a continued
engagement and a sustained response.
3.9 PCDP I was designed as a pilot to introduce new models of public service delivery to
better identify and address communities’ priority needs and to reduce their vulnerability. It
was the first time a CDD approach was piloted there; it deviated significantly from the way
that service delivery had been done in the country. The approach facilitated the effective
implementation of the community investment fund. It promoted participation of both men
and women in the preparation of the community action plans that were also intended to reach
the poorer and most vulnerable members of the communities. The CAPs were then reviewed
by WDCs, comprising representatives of the woreda administration, customary institutions,
and beneficiary communities, with the support of the MSTs.3 The Project Performance
Assessment Report (PPAR) mission learned that beneficiaries and Ethiopian regional
government officials appreciate the approach, and that there is interest in integrating this
style of engagement in other proposed projects in the country.
3.10 However, the project design did not fully articulate how the proposed CDD model
would work in the Ethiopian administrative context and in the context of reaching non-
sedentary citizens. It did not detail how the consultative process would work at the level of
the kebele (whose needs count?) not did it introduce accountability mechanisms capable of
tracking these expressed needs through the decision-making process through the kebele and
woreda council level discussions, back to the community. The external end-line assessment
(Loyya Consult, 2014)4 highlighted the role that the WDCs played in deciding on the
3 IEG desk review and field-level interviews. 4 IEG reviewed the quality of the end-line assessment to determine whether the reported findings were
acceptable. One of the limitations of the end-line assessment was that the assessment did not reveal its
sampling frame. Sixteen “sample woredas and kebeles were carefully selected by the regional PCUs in consultation with the federal PCUs” (Loyya Consult 2014, p. 9). the PMU. The only criteria reported was that

11
allocation of investments—a role that the WDC traditionally plays, for example. It would
have been useful for the end-line assessment to have weighed in on the difference that
community engagement made, separate from the additional benefits achieved due to project
funding.
3.11 valid
3.12 The IEG mission learned that the CDD process was congruous to the customary
community consultation process at the kebele level within the lowlands. However the design
of the first phase could have more relevantly placed the CDD process within the broader
process of administrative decentralization. While the consultative process was in line with
customary practices, the project introduced new and unfamiliar requirements in areas with
little history of project intervention. In areas characterized by civil unrest, for example, the
placement of a well can matter from the point of view of disputed territorial claims.
Likewise, in such areas, there is a strong propensity for local power brokers to distort
resource allocations to meet their own needs.
3.13 Several other design lessons have emerged form Phase I, including many that have
been integrated in the design of the second phase. The formulation of a group lending model
to encourage the development of small rural enterprises (the income generating activity
component) fell short of understanding the local business climate, capacity, and the
complexity of integrating economic activities into a group business model. At the time, there
was limited public sector support for nano and small rural enterprises, including a lack of
experience in generating concepts and ideas that could be competitive and sustained. Many
of the income generating activities in the first phase were not sustained, also because the
nano enterprises were not able to sustain the costs of operation and maintenance after project
end (MoFA 2008).
3.14 There was also a lack of a clear link between the project interventions and the
overarching program objective of promoting sustainable livelihoods of pastoralists. The basic
social and (limited) economic infrastructure that is provided under the projects, while
necessary, has, at best, only a tenuous link with sustainable livelihoods. The income-
generation components (through savings and credit) would no doubt help strengthen
livelihoods, but the scale is far too small to have any significant impact. Thus, it is difficult to
see the project interventions leading to improved livelihoods for pastoralists or to reducing
risk to any significant extent.
Implementation
3.15 Significant efforts were made early on in the implementation of Phase I, particularly
under the Sustainable Livelihoods Component, to set up the new CDD model. WDCs were
formed in all 10 first-year woredas. Woredas were actively reviewing community proposals
and approving projects (construction of schools, human and animal health posts, small-scale
the Woredas were selected "to get a good representation of project performance." In discussions with Lloya,
IEG learned that both insecure and remote areas were eliminated from the sample. Thus, it is reasonable to
assume that the effects reported are not representative of these areas, and that it is likely that, the results
reported do not represent the average.
12
irrigation, and the like) in early 2004, just seven months after project effectiveness. The CDD
approach appeared to be working well, and one implementation support mission5 noted a
shift from skepticism to satisfaction with the CDD process among government officials. By
the mid-term review (MTR) (conducted in June 2006), 2,057 CIF subprojects had been
initiated in 465 kebeles, and 47 percent were completed and were providing the required
services. Training and capacity building activities had been undertaken at all levels (for
example, on community consultation, awareness creation, and the preparation of community
action plans) to ensure that communities were able to select and implement subprojects, and
a pastoral EWS manual had been prepared and was operational.
3.16 However, there was a tendency for the project to disburse funds quickly, particularly
for IGAs, without regard to the speed with which pastoralists could cope, nor the sufficiency
of funds to complete and operationalize approved subprojects. At MTR, a large number of
IGAs were found to be unprofitable, with inadequate accounting and transparency of
earnings, undeveloped plans for use of income, and so on. The MTR recommended
undertaking a comprehensive reassessment of IGAs (Ethiopia, MoFA 2008) (hereafter
referred to as the IGA Assessment) to determine their financial and technical sustainability
(see the results of the IGA Assessment summarized in Box 4.1) (World Bank Group 2004).
The MTR mission also cautioned against being overambitious and advised the project to
complete ongoing CIF subprojects and make them operational before initiating new ones.
The MTR also warned that project design did not sufficiently address how the CDD process
might be institutionalized through continuous training and capacity building for communities
and other stakeholders, rather than remaining a one-off participatory rural appraisal and
participatory learning approach exercise. Continuous training, responsive to community
needs identified during implementation, was not being sufficiently addressed. This issue was
demonstrated by the MSTs: they were not “camping” with pastoralists for 10–15 days, as
proposed in the Project Implementation Manual, so community training activities were too
short. MSTs reportedly spent too little time with the communities to begin the CDD process
(World Bank Group 2006).
3.17 A year after the MTR (November 2007), supervision documentation reported concern
that there were insufficient resources for completion of all CIF approved subprojects because
more subprojects were approved in 2005/06 than could be financed within the APL I
financing envelope. These (329) community subprojects were still incomplete at project
closing, and they were to be implemented to fully operational under the subsequent phase.
3.18 The Pastoral Risk Management Component progressed more slowly throughout the
Phase I project cycle. Though discussions with communities were initiated on the
development of the EWS, it was reported that overall implementation progress of this
component was significantly lagging behind schedule at MTR. The EWS manual had been
developed, but the system was still not operational, and related woreda-level contingency
plans were not yet in place. Implementation delays were reportedly the result of a lack of
institutional ownership/unclear institutional arrangements (MoFA versus MoA) and
procurement delays (lack of an implementing partner).6
5 World Bank Group, PCDP I, ISM, Aide Memoire, November 15-30, 2004. 6 IEG review of PCDP I ISRs and Aide Memoires.

13
3.19 Despite the above-mentioned challenges faced by PCDP I, key triggers required to
move to the second phase were met, though several activities under these two components
seem to have been implemented in a rushed and ineffective manner between the MTR and
project closing in order to satisfy the Phase 1 triggers. By November 2007, six of the seven
triggers had been met satisfactorily, though the last trigger, a Government Pastoral Areas
Development Strategy, was still a work in progress.7
Safeguard Requirements and Compliance
3.20 For Phase I, the relevant safeguards identified at appraisal were: OP 4.01,
Environmental Assessment; OP 4.04, Natural Habitats; and OP 4.09, Pest Management. The
main issues were that the subprojects were not screened for potential adverse environmental
and social impacts (as per OP 4.01), a pest management plan for subprojects was not
developed for small-scale irrigation subprojects (as per OP 4.09), and a working definition
for the identification of natural habitats was not developed (as per OP 4.04). In sum, there is
evidence that the project did not comply with the World Bank’s operational policies.
Fiduciary Management and Procurement
3.21 PCDP I experienced the financial management and procurement challenges one
would expect from a project just starting up in very remote areas. It proved time-consuming
to collect statements of expenditures for all of the CIF subprojects, aggregate them at the
woreda level, and send them up the chain through the regional governments and to the
FPCU. Hasty project approvals resulted in rushed disbursement, which introduced fiduciary
challenges and difficulties for sectoral actors to provide the staff/equipment resources
necessary to ensure service delivery.8 In the first year, project management appeared
concerned with low disbursement rates and launched an aggressive campaign among
communities to use project resources. In this push for rapid disbursement, the perception
developed that all projects would be financed as long as they met the defined set of criteria.
No consideration was given to the balance available in the CIF when approving subproject
requests. Furthermore, no indicative annual budget ceilings were defined and provided for
the regional project coordination units and woredas. By the end of the fourth year of PCDP I,
about 91 percent of the available budget had been spent. This issue was not picked up until
the MTR. Some 25 percent of the subprojects could not be completed due to lack of funds,
and regions were advised to abandon projects with a low level of performance (IFAD 2008,
p. 29). The project also experienced weak procurement supervision (that is, limited
transparency in fund allocation, lack of accountability at the woreda level) because of
capacity constraints and general lack of familiarity with guidelines and procedures. This
affected implementation and raised some concerns about the appropriate (transparent) use of
resources toward realization of the agreed PDOs (World Bank Group 2009b, pp. 10–11).
Monitoring and Evaluation
3.22 M&E Design. Phase I M&E design, the responsibility of the FPCU, was weak.
PCDP I expenditure-linked key performance indicators appear to have focused
implementation efforts on maximizing the speed of fund disbursement, when the PDO was to
7 World Bank Group, PCDP I, ISM and PCDP II Identification Mission, Aide Memoire, November 2007. 8 IEG review of ISRs and Aide Memoires, and Country Director’s comments in ISR, March 26, 2008.

14
provide capacity building and establish effective models of public service delivery,
investment, and disaster management (IEG 2011). This may have affected quality and
efficiency, particularly given the commitment to a CDD approach that was new and needed
time and effort to take root in such traditional and disadvantaged communities. The first two
key performance indicators did not particularly encourage giving time to communities to
prioritize, plan, implement, and monitor their development activities in a learning-by-doing
manner. There was also no baseline established at the outset.
3.23 M&E Implementation. M&E implementation under Phase I was also weak. The
project envisaged a participatory monitoring system, but it was never implemented. The lack
of baseline indicators further weakened M&E implementation. Baseline surveys (without
control groups) of 25 woredas were conducted in the third year of PCDP, but there were no
follow-up surveys, making it difficult to assess project achievements. Both the learning and
accountability functions of M&E were neglected. The MTR observed that implementation
was too output-centered (World Bank Group 2006) and suggested the sorts of outcome
indicators that should be tracked, but the implementing agencies did not follow these
recommendations. Progress reports assessed outcomes by using national norms rather than
actual data (World Bank Group 2009b, p. 8).
3.24 Baseline surveys (without control groups) of 25 woredas were conducted in the third
year of PCDP, but there were no follow-up surveys, making it hard to assess project
achievements. and suggested the types of outcome indicators that should be tracked, but the
implementing agencies did not follow these recommendations The project did commission a
rather frank IGA Assessment (previously discussed in this report), which was quoted quite
extensively within the operational ICR, and the findings generated by this assessment, as
well as other design flaws discussed earlier, appear to have been taken into account during
the design and implementation of Phase II.
3.25 M&E Utilization. During Phase I, the learning and accountability functions of M&E
were neglected and, beyond the useful and necessary reports on disbursement progress, the
other data generated did not help inform management decisions during implementation. But
these design flaws were taken into account in the follow-on project.
3.26 M&E design, implementation, and utilization for PCDP I is rated negligible.
Achievement of Objectives
3.27 As a first step in conducting the PCDP (I and II) PPAR, IEG worked with MMA, a
local consulting firm in Addis, to determine whether relevant data existed to support an
assessment of the contribution of the projects to their stated objectives of (1) reducing
vulnerability and (2) enhancing pastoral livelihoods over the project period (2003–13). Data
were sought outside of the project’s reporting framework, since the data collected by the
project was limited to output indicators (number of schools built, number of wells
functioning, and the like). IEG and MMA utilized data collected by the Central Statistics
Authority and the Ministry of Finance and Economic Development, the two government
bodies responsible for undertaking periodic nationwide income, poverty, and welfare
surveys. After a comprehensive review, IEG determined that while comparable welfare data
were available at the national and regional levels, it was not available at the woreda level.

15
And, while the quality of data has improved over the project period, data had only recently
begun to be collected in nonsedentary or pastoral areas.
3.28 The ICR for PCDP I correctly notes that insufficient and conflicting data and several
outcome indicators that did not necessarily reflect the PDO made it a challenge to accurately
evaluate if PCDP I achieved its objectives. The government’s ICR states that “adequate and
reliable quantitative information from project woredas and regions was not available to
analyze the outcomes of project interventions.”9 Although several outputs were generated, as
indicated below, and a large population was covered, the evidence on outcomes in relation to
achievement of the PDO is weak.
3.29 This section attempts to assess achievement of objectives for Phase I by looking at the
PDO in two parts: (1) establishing effective models of public service delivery and investment
and (2) establishing effective models of disaster management in pastoral areas. It also
considers the extent to which the project built local capacity, since, according to the PAD,
this was a measure that would allow the project to achieve its objectives. However, since it is
not an explicit objective, it is not rated. This section is organized according to four types of
evidence to support achievement ratings for each PDO: ICR assessment of PDO and
intermediate indicators (June 2009), the IEG ICR Review (February 2011), additional
evidence generated through the Assessment of Income-Generating Activities commissioned
by MoFA (May 2008; it reviewed the performances of IGA projects financed under the CIF,
see Box 3.1), and IEG PPAR research and field work (August–October 2015).
Local Capacity Building
3.30 The CDD model was a critical innovation for the country, but attention to its
institutionalization and sustainability was insufficient. As stated above, building local
capacity was a critical means to achieve relevant and sustained public service delivery and
investment. Local capacity is also critical for ensuring an effective EWS that responds to
local needs.
3.31 The ICR, beneficiary assessments, and the IGA Assessment all point to a clear
conclusion that the CDD approach built capacity, created empowerment, and fostered a sense
of ownership of project activities by pastoral communities. The project was introduced at a
time when there were no real decentralized institutions or processes in place (Yilmaz and
Venugopal 2008), and there was limited capacity to decentralize, so PCDP was a true pioneer
of decentralization in Ethiopia. The project introduced an idea and laid important
groundwork for a process that would take a long time to become ingrained.
9 World Bank Group 2009, quoting government of Ethiopia ICR, p. 26.

16
3.32 MSTs worked with woreda administrations and their technical and social support
offices to train communities, using the CDD approach of participatory learning and action
tools to design local development projects. A number of community members and leaders
were trained in various disciplines (including needs assessment, project identification,
proposal preparation, project implementation and management, finance, and procurement
procedures), thereby creating increased local capacity compared with capacity levels prior to
the project. The ICR reports that a number of teachers and animal and human health workers
were trained, thus improving service delivery compared with the pre-project period, but no
information is provided on what kind of training was provided or its depth. IEG interviews
with Kebele Development Council members indicated that there is a strong perception that
the project increased their capacity in the following areas: prioritization, planning,
procurement, contracting, project management, M&E, and maintenance of infrastructure.
3.33 Before PCDP, the WDC was the administrative body that had the final decision on
how to allocate resources between kebeles. The PCDP project maintained this decision-
making structure, but the project introduced a mechanism that solicited input from the
kebeles, asking them to self-identify their most pressing needs. When interviewed by IEG,
the WDCs indicated that they used varying criteria to determine where to allocate project
resources. The criteria were not consistent across woredas, but included the following: WDC
knowledge about kebele needs and infrastructure gaps; population size of kebeles; presence
of other actors/projects (to avoid duplication of resources); distance between kebeles; and
accessibility of kebeles. At the kebele level, the Kebele Development Councils consistently
described a process for selecting community assets. They were trained in the CDD approach
by project staff, and then assisted in convening community meetings where community
members outlined needs in the community. A pairwise voting process then took place,
resulting in a list of community needs ranked by priority. In some cases, communities
reported making decisions based on knowledge of what other development agents
(government, NGOs) planned to fund. Interviews with community members not involved in
community leadership confirmed that, for the most part, the infrastructure selected matched
the community needs at the time. In a minority of cases there was discontent over the
location of some of the infrastructure, and in one village it was reported that only the elite
(village leadership) had access to irrigation schemes financed under the project.
3.34 Attention to the institutionalization and sustainability of the CDD model was
insufficient. Continuous training, responsive to community needs identified during
implementation, was not sufficiently addressed. The project did set up development
committees in 32 woredas and project management committees in 592 kebeles, but actual
capacity built is questionable. Beneficiaries indicated that “capacity building activity at the
community level remains weak as they still lack confidence to undertake procurement and
financial management, and most committees and local governments feel that they still have
to rely on external support to propose and execute projects" (World Bank Group 2009b, p.
15). For example, the IGA Assessment found the “low technical capacity of the target
community/beneficiaries and language barrier to fill the application form (Ethiopia, MoFA
2008, p. 17),” a significant challenge to the successful implementation of the grant
application process (Ethiopia, MoFA 2008).

17
3.35 The IEG field mission visited five woredas that were covered under Phase I of the
project and spoke to several regional and local project implementation staff with institutional
memory of Phase I . During interviews with regional-, woreda-, and kebele-level
governments, as well as direct project beneficiaries, IEG learned that the main challenges
during the first phase of PCDP were awareness creation, mobilization, and understanding on
the part of the communities (and in some cases the woredas). This impacted the
implementation of the project and in some cases caused delays. The project staff and
community members both reported that the MST members were key in resolving this issue,
spending extra time with communities and explaining the new process for community
decision making, the rationale behind requiring community contributions (in kind/cash), and
the responsibility and roles of both the woreda government and the community members.
While it was difficult to disentangle Phase I project impacts from Phase II impacts, all of the
meetings IEG held with Kebele Development Council members indicated that there is a
strong perception that the project increased capacity of the members in a number of areas
(discussed previously). Meetings with the WDC also reflect the perception that the project
provided capacity building for woreda-level officials, especially in project-specific topics,
roles of the WDC and community, procurement, and improving livelihoods. The WDC
members generally appreciated the training; some thought it was completely adequate, while
others indicated that there were some areas where further training and capacity building
would have been appreciated, including climate change variability, disaster reduction, water
harvesting, and natural resource management. Some WDCs indicated that more training for
communities would have been good and that they needed continuous training to account for
turnover on the WDC.
Objective (1): Establish effective models of public service delivery and
investment
3.36 Significant outputs were produced under the CIF (for example, community
development and action plans and subprojects such as the construction of schools), which
filled development gaps and helped to prevent pastoral communities from completely falling
off the map, but progress was constrained by procedural delays and inadequate capacity
development during the project period.
3.37 Activities under this component included, but were not limited to, water
development; construction and rehabilitation of schools and animal and human health
institutions; support for income-generating schemes; development of local support services;
road construction; and small-scale irrigation construction and rehabilitation works. Indicators
(number of community development plans approved, number of micro-investments and
subprojects approved and executed, and the like) were, for the most part, achieved, though a
number of intermediate indicators (such as literacy rates, access and use of mobile and
stationary health and education services) were not measured.
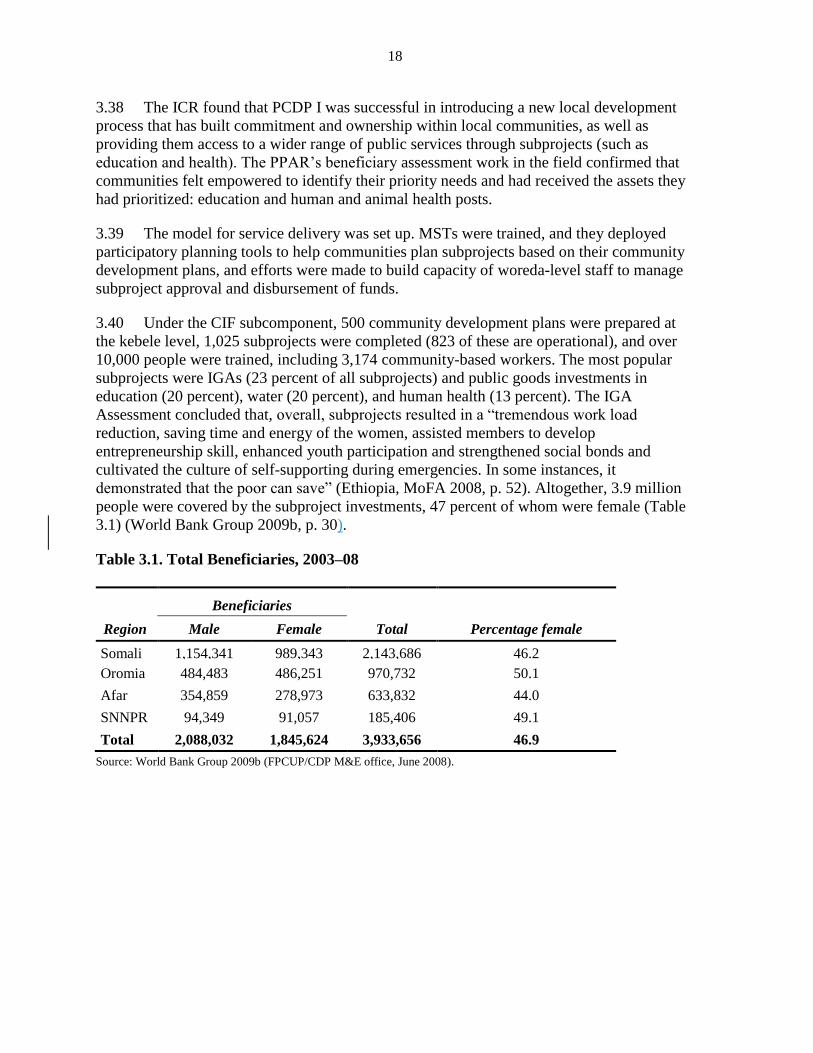
18
3.38 The ICR found that PCDP I was successful in introducing a new local development
process that has built commitment and ownership within local communities, as well as
providing them access to a wider range of public services through subprojects (such as
education and health). The PPAR’s beneficiary assessment work in the field confirmed that
communities felt empowered to identify their priority needs and had received the assets they
had prioritized: education and human and animal health posts.
3.39 The model for service delivery was set up. MSTs were trained, and they deployed
participatory planning tools to help communities plan subprojects based on their community
development plans, and efforts were made to build capacity of woreda-level staff to manage
subproject approval and disbursement of funds.
3.40 Under the CIF subcomponent, 500 community development plans were prepared at
the kebele level, 1,025 subprojects were completed (823 of these are operational), and over
10,000 people were trained, including 3,174 community-based workers. The most popular
subprojects were IGAs (23 percent of all subprojects) and public goods investments in
education (20 percent), water (20 percent), and human health (13 percent). The IGA
Assessment concluded that, overall, subprojects resulted in a “tremendous work load
reduction, saving time and energy of the women, assisted members to develop
entrepreneurship skill, enhanced youth participation and strengthened social bonds and
cultivated the culture of self-supporting during emergencies. In some instances, it
demonstrated that the poor can save” (Ethiopia, MoFA 2008, p. 52). Altogether, 3.9 million
people were covered by the subproject investments, 47 percent of whom were female (Table
3.1) (World Bank Group 2009b, p. 30).
Table 3.1. Total Beneficiaries, 2003–08
Region
Beneficiaries
Total Percentage female Male Female
Somali 1,154,341 989,343 2,143,686 46.2
Oromia 484,483 486,251 970,732 50.1
Afar 354,859 278,973 633,832 44.0
SNNPR 94,349 91,057 185,406 49.1
Total 2,088,032 1,845,624 3,933,656 46.9
Source: World Bank Group 2009b (FPCUP/CDP M&E office, June 2008).
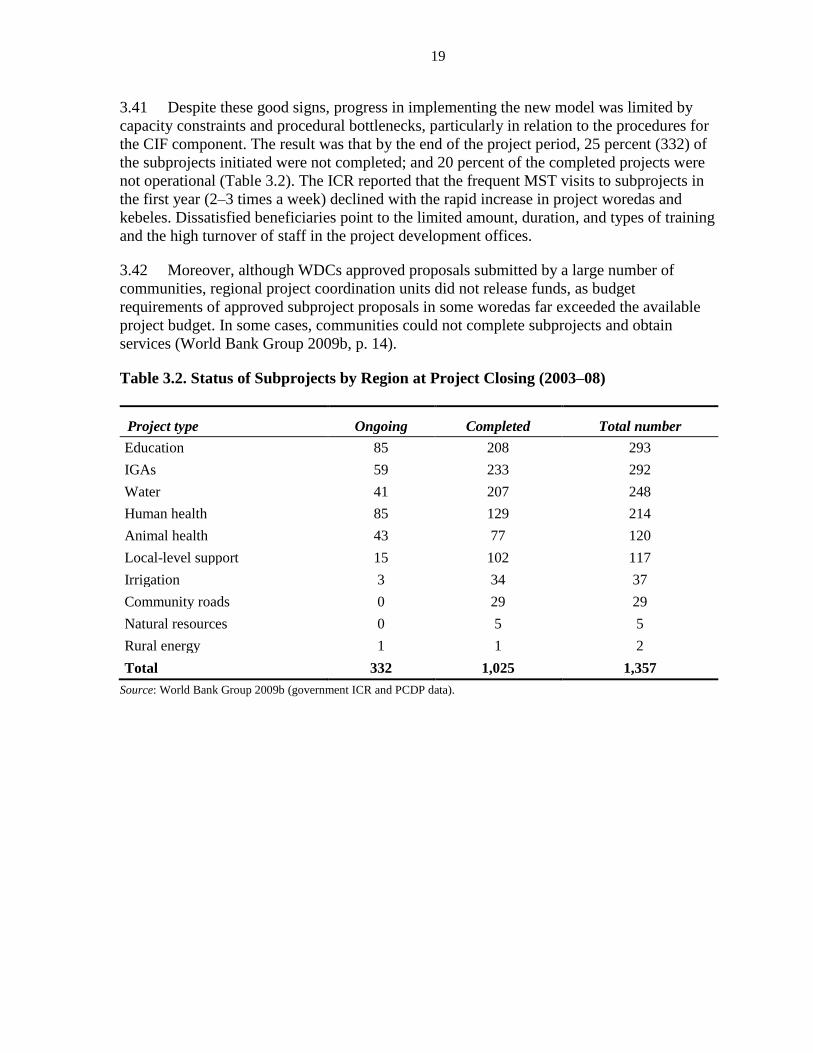
19
3.41 Despite these good signs, progress in implementing the new model was limited by
capacity constraints and procedural bottlenecks, particularly in relation to the procedures for
the CIF component. The result was that by the end of the project period, 25 percent (332) of
the subprojects initiated were not completed; and 20 percent of the completed projects were
not operational (Table 3.2). The ICR reported that the frequent MST visits to subprojects in
the first year (2–3 times a week) declined with the rapid increase in project woredas and
kebeles. Dissatisfied beneficiaries point to the limited amount, duration, and types of training
and the high turnover of staff in the project development offices.
3.42 Moreover, although WDCs approved proposals submitted by a large number of
communities, regional project coordination units did not release funds, as budget
requirements of approved subproject proposals in some woredas far exceeded the available
project budget. In some cases, communities could not complete subprojects and obtain
services (World Bank Group 2009b, p. 14).
Table 3.2. Status of Subprojects by Region at Project Closing (2003–08)
Project type Ongoing Completed Total number
Education 85 208 293
IGAs 59 233 292
Water 41 207 248
Human health 85 129 214
Animal health 43 77 120
Local-level support 15 102 117
Irrigation 3 34 37
Community roads 0 29 29
Natural resources 0 5 5
Rural energy 1 1 2
Total 332 1,025 1,357
Source: World Bank Group 2009b (government ICR and PCDP data).

20
3.43 A considerable portion of project support was directed toward IGAs, with the aim of
improving pastoralists’ livelihoods by raising their income and employment opportunities.
Financing was spent on the main business activities: grinding mills, shops, cafeterias, brick
production, and so on, which were run and owned collectively by groups or cooperatives and
were supposed to pay dividends to individual members, and petty trade, fattening, and
livestock trades that were managed and owned by individuals (Table 3.3). Though
performance varied widely among different types of business activities and project woredas,
the IGA Assessment provided evidence that profitability, growth, and sustainability of IGAs
were not sufficiently emphasized during implementation (see Box 3.1). As a result, a number
of IGAs were established that were not economically viable. The assessment reported quite
frankly that financial documents and statements were not available or limited to fragmented
and limited records: “52.5 percent of the sampled IGAs have no documents and
records…The unavailability of such financial documents and records made to determine the
profitability of the IGAs unlikely” (Ethiopia, MoFA 2008, p. 17). The assessment goes on to
say that: “the sustainability of 72 percent of the sampled IGAs is doubtful” (Ethiopia, MoFA
2008, p. 18). Discussions with communities during the IEG mission confirmed the
difficulties that could have been anticipated in attempting to develop collectively-owned, for-
profit enterprises.
Table 3.3. Major IGA Activities under the CIF
Business activities Percentage
Grinding mills 20
Services (video house, music band, tire repair, garage brick production, and cafeteria) 20
Livestock marketing and rearing 20
Petty trade 17.5
Fruit and vegetable production and marketing 7.5
Sanitation and hygiene, shower, toilets 7.5
Handcrafts 2.5
Wood work 2.5
Rental house 2.5
Total 100
Source: World Bank Group 2009 (government ICR and PCDP data).

21
Box 3.1. Assessment of Income-Generating Activities Financed During Phase I of the PCDP
In May 2008, the Ministry of Federal Affairs and the PCDP team undertook an assessment of the
performance of income-generating activities (IGAs) financed under PCDP I. The IGAs were
housed under the Community Investment Fund (CIF) (one of the subcomponents of the Sustainable
Livelihood Component of the PCDP I project). According to project reports, PCDP I assisted a
total of 441 IGAs, of which 105, 22, 308, and 6 are in the Somali, Afar, Oromia, and SNNPR
regions respectively. This assessment was done on a sample of 40 IGAs. Both qualitative and
quantitative information was generated and used for analysis to draw findings and lessons. The
sampled IGA groups were engaged in different activities (such as tire repair, cafeterias, grinding
mills, fruit and vegetable production and marketing, handcrafts, livestock marketing, and petty
trade).
Main Findings
Sustainability is a critical area of concern—the sustainability of 72 percent of IGAs is
doubtful. IGAs running petty trade and services are seen as potentially sustainable if the
required technical assistance is provided. However, there is a lack of demand for grinding
mills (some of the grinding mills are no longer operating).
Jobless youth and women, in particular, stressed the relevance of the IGAs to the
improvement of their livelihood in terms of generating additional income, creating self-
employment, and strengthening social bonds.
In all sampled IGAs, beneficiaries selected the type of activity based on their past
experience, but were not successful in expanding or diversifying their activities because of
lack of knowledge and technical capacity.
Over half of the sampled IGAs have no legal entity, while the rest are registered at their
respective Bureau of Cooperatives. Groups with legal status are vibrant, while those
operating without legal status are fragile.
The beneficiaries know the grant application and processing procedure well, but the
procedure itself is not very transparent. The challenge lies in the low technical capacity of
the target community/beneficiaries and the language barrier that makes it difficult to fill
out the application form. Moreover, with few exceptions, IGA groups interviewed
expressed that they do not know the amount of the grant they received from the project.
Financial documents and statements are either not available or limited to fragmented and
poor records, which makes it virtually impossible to conduct an assessment of the
profitability of the IGAs.
There is a demand for services, vegetables, handicrafts, livestock trading, and petty trade.
All sampled IGAs are well organized (that is, their management body), but 68 percent of
the sampled IGAs had not received any training on how to manage the IGAs. Moreover, a
large majority of members are illiterate and innumerate.
Of the sampled IGAs, only 35 percent are saving, while the rest have no savings
component.
Technical assistance, from the cooperative, PCDP, and sector offices, is minimal and
limited.

22
3.44 Furthermore, there were no operational manuals or guidelines on IGA operations, and
it is difficult to assess who the target beneficiaries were. This difficulty is compounded by the
intricate social system in pastoral society. The culture of sharing—for example, in the Afar
region, is unique to pastoral areas, which makes it difficult to decipher who is really poor,
and who is poor but perhaps a little better off.
3.45 Despite the problems, however, the project did serve its purpose of introducing—and,
to some extent, institutionalizing—the CDD approach as the new model of service delivery.
3.46 Achievement of this objective is rated substantial.
Objective (2): Establish effective models of disaster management in
pastoral areas.
3.47 A number of outputs were produced, albeit late in the project cycle, but there is little
evidence available on the effectiveness of the EWS model.
3.48 The indicator set for this PDO was met. One hundred percent of funds allocated for
the DPCF were used for approved subprojects (though 95 percent of the IDA allocation
under the CPCF disbursed, it was used mostly in response to emergencies and not based on
DPCPs). According to the ICR, 1,447 DPCF subprojects were executed, 387 (87 percent)
were completed, 363 (94 percent) were operational, and 60 subprojects were still ongoing at
project closing (Table 3.4). Activities supported under this fund included water development,
community road construction, natural resource development, and the like. A pastoral EWS
manual was prepared and initial investments were made to make it operational (World Bank
Group 2006). Disaster preparedness and contingency plans were prepared for 23 woredas,
and 447 disaster-preparedness subprojects were financed. These activities served as a good
starting point.
Table 3.4. Status of Subprojects under the DPCF at Project Completion (2003–08)
Project type Ongoing at project completion Completed Total
Water 44 221 265
Animal health 0 1 1
Local-level support 2 3 5
Income-generating activities 0 94 94
Irrigation 3 4 7
Community roads 9 43 52
About half of the IGAs interviewed reported that there is no monitoring of activities, either
by the sector office or members of the IGAs. Forty-two percent reported that they have
been visited by the PCDP or sector office.
Source: Ethiopia, MoFA 2008.

23
Project type Ongoing at project completion Completed Total
Natural resources 1 15 16
Restocking 0 3 3
Grain store 1 3 4
Total 60 387 447
Source: IEG adaptation from ICR, June 2009.
3.49 However, these interventions occurred late in the project and had less impact than
expected. The ICR correctly noted that the project "did not establish an effective model of
disaster management in pastoral areas due to the restructuring and subsequent lack of uptake
by the institution that was to carry out the component. The activities were therefore badly
sequenced with the planning mechanisms being completed only shortly before project
closing" (World Bank Group 2009b, p. 17). Because of this late and generally ineffective
implementation, several intermediate indicator targets (for example, timely delivery of
remote-sensed information to woredas, food security assessment applied in threatened areas,
implementation of disaster plans) were not achieved.
3.50 The DPCF was to finance activities identified in the woreda DPCP in the project
woredas. However, in the absence of woreda DPCPs and a manual of procedures for fund
use, the fund seems to have been implemented in an ad hoc manner. It was then decided that
the project would use the fund for projects based on local and traditional knowledge of
communities to reduce vulnerability to disaster and provide rapid reaction to crises in these
areas. Project activities were financed, but without following the procedures set out in the
Project Implementation Manual (World Bank Group 2009b, p. 33). Moreover, it is difficult
to discern the difference between financing of activities and subprojects under the CIF and
those under the DPCF, which are very similar (for example, IGAs or an animal health post
could be financed from either).
3.51 Performance may also have been affected by disruptions caused by the unexpected
institutional reorganization (of the Disaster Preparedness and Prevention Commission into
the Disaster Preparedness and Prevention Agency) and the reassignment of responsibilities
for disaster management. Later on, MoFA and the Federal Project Coordination Unit, in
cooperation with Regional Disaster Preparedness and Prevention Bureaus, took the lead to
manage the pastoral risk management component. The ICR reported that “the protracted
restructuring of the Disaster Prevention and Preparedness Commission (Federal) led to
unclear institutional arrangements and lack of leadership for the implementation of the
component, impairing the overall effectiveness of the component…Drought emergency
response was uneven, resource use was often not efficient. In the absence of a coherent,
overarching institutional framework, the various regions adopted different procedures, some
more successfully than others (World Bank Group 2009b, pp. 17, 32). Establishment of
mandates between the various government bodies, as well as with other donor institutions, on
issues such as early warning and contingency plans seems to have been a major grey area.

24
3.52 Overall, the IEG mission got the impression that the component was an “add-on” to
the project. It was not well prepared and there was insufficient information available about it.
The component was managed by MoA, apparently quite autonomously from the project
management unit (PMU), which limited MoFA’s ability to plan, prepare, and supervise it
effectively.
3.53 Achievement of this objective is rated negligible.
Efficiency
3.54 The IEG ICR Review of PCDP I noted that “the project could have sponsored an ex-
post estimate of a random stratified sample of subprojects. But this did not happen. ["The
project did not collect any comprehensive quantitative input/output/revenue data that would
enable the ICR to carry out the conventional analyses."] (World Bank Group 2009b, p. 17).
While the operational ICR noted that construction costs of health posts and schools compared
favorably with those of similar NGO-led initiatives, no quantitative data were provided to
support this statement. Actual project costs were as envisaged at appraisal, but there was
some shortfall in outputs. For example, 25 percent of the subprojects initiated were not
completed, and 20 percent of the completed projects were not operational (World Bank 229,
pp. 13, 36). Based on the lack of data, the significant number of subprojects that are
incomplete or not working, and the ICR's admission of poor financial management, the ICR
Review rated efficiency as modest.
3.55 Given the community-driven nature of PCDP subprojects, conventional calculations
of net present values and economic rates of return would likely carry little meaning, since the
benefits of the capacity-building components (support to communities and local governance)
cannot easily be quantified in monetary terms; the investment component cannot be known
ex ante, since it is demand-driven and defined in the course of the project; and many benefits
from anticipated investments would be difficult to quantify.
3.56 PCDP I was completed on time, in five years. Ninety-eight percent of PCDP I
resources were disbursed 12 months before the closing date. The main efficiency issue was
related to disbursements. PCDP I experienced low disbursement rates in the early years of
implementation, brought about by delays in submission of expenditure statements from
woredas to the regions, and upwards to the FPCU. Concerned with this low disbursement,
PCDP project management launched an aggressive campaign to use project resources. This
introduced some fiduciary challenges and difficulties for sectoral actors to provide the staff
and equipment necessary to ensure service delivery. Moreover, in this push for rapid
disbursement, the perception developed that all subprojects under the CIF would be financed,
as long as they met the defined set of criteria, but no consideration was given to the balance
available in the CIF when approving subproject requests. The result was that by the end of
the fourth year of PCDP I, about 91 percent of the available budget had been spent, and some
25 percent of the subprojects could not be completed because of lack of funds.
3.57 Efficiency of PCDP I is rated modest.
25
Outcome
3.58 Overall outcome for Phase I is rated moderately unsatisfactory. The objectives
were substantially relevant to the government strategies for alleviating rural poverty, as well
as supporting the government’s decentralization process. Project design, rated modest,
featured a CDD approach, which was a considerable innovation for the country. However,
there were a number of shortcomings, such as a poorly designed income-generating
subcomponent and a lack of a clear link between project interventions and the objective of
promoting sustainable livelihoods. Progress made against the first objective, of establishing
effective models of public service delivery and investment, was substantial. Significant
outputs were produced under the CIF that filled development gaps and helped to prevent
pastoral communities from completely falling off the map. The second objective, of
establishing effective models of disaster management, is rated negligible. A number of
outputs were produced, but there is little evidence available on the effectiveness of the early
warning system model. Efficiency is rated modest, because the project did not collect any
data that could have been used to conduct an assessment of the economic or social rates of
return of its investments and to implementation efficiency losses experienced early on in the
project cycle.
RISK TO DEVELOPMENT OUTCOME
3.59 The main risks to development outcomes are related to livelihoods and vulnerability,
both of which, for both project phases, are associated with sustainable service delivery and
exogenous factors such as the shocks created by droughts and climate change.
3.60 Risk associated with livelihoods is significant. The responsibility assumed by
communities throughout both project phases—from the selection of investments, to their
implementation, to operations and maintenance, and the requirement of a mandatory
community contribution—provide a reason for optimism about their sustainability. Barring
the aforementioned human and financial resource constraints that may emerge, it is likely
that communities will remain committed to the operation and maintenance of their assets.
The knowledge and experience communities have gained in project management has been
immense. Beneficiaries feel that the basic infrastructure and services developed by the
project belong to them and that they are ready to protect and maintain them for proper
utilization. Certainly more investments are needed in such a resource-constrained
environment, but the broader country focus on local government development through
several large national programs increases the chances of success (of the CDD/CIF activities).
3.61 Risks associated with vulnerability are significant. IEG acknowledges other
intervening factors that may impede or enhance the effects of the project, such as external
shocks (climatic, epidemic, or macroeconomic), interventions from other national projects,
and overall changes in the macro-environment. Weak evidence of effective implementation
of the early warning system under the Disaster Risk Management Component may pose a
risk to decreasing vulnerability on a sustainable basis.
3.62 Risk to development outcome for PCDP I is rated significant.

26
Bank Performance
3.63 PCDP I had important objectives, and managed to deliver much-needed social and
economic infrastructure to pastoral communities based on a CDD approach. Project
objectives were developed in close collaboration with other donors and stakeholders, and
they were highly relevant to the country’s national development plans, the Bank’s own
strategies for the country, and community (beneficiary) needs. The decision to proceed
through a three-phased program was the right choice, the CDD model was an innovative
design approach, and project activities were appropriately sequenced.
3.64 Quality at entry for Phase I. The project objectives were adequately supported by
sector work and were developed in close collaboration with other donors and stakeholders.
The Bank responded promptly to the government's request for help in reducing the
information gap on pastoral development (IEG 2011). Studies were conducted jointly with
IFAD and FAO. Project proposals were discussed in stakeholder workshops (World Bank
Group 2009b, p. 4). At the same time, in its quality-at-entry assessment, the Quality
Assurance Group identified four shortcomings: (i) the low importance given to structural and
sector policy reforms in a project of this nature, where decentralization and institutional
development are critical to successfully implementing an APL program; (ii) the serious
capacity constraints for implementation, particularly at the woreda level, and that the project
had not yet worked out the operational details to address these constraints; (iii) the risks of
elite capture; and (iv) the government’s lack of the instruments or the experience needed to
guarantee success in decentralization of decision making (World Bank Group 2009b, p. 22).
The ICR also refers to the inadequate provision for M&E, an aspect of design for which the
Bank was responsible.
3.65 Moreover, as previously discussed, inadequate attention was given to training staff in
CDD; the livelihoods component (IGAs) for Phase I was poorly designed; there was lack of
clarity on the design of the EWS for both phases; and, perhaps more important, the results
framework of both projects was deficient, and as a result did not allow a considered
assessment of the program objectives. There were no indicators developed for measuring and
assessing “sustainable livelihoods” or “vulnerability.” While recognizing the difficulty of
quantifying these concepts and that these may well be achievable in the long-term only, an
attempt should have been made to establish even proxy indicators and to put monitoring
place that—at least toward the latter half of the program—would have allowed an assessment
of whether the program was meeting its objectives.
3.66 Quality at entry for PCDP I is rated unsatisfactory.
3.67 Quality of supervision for Phase I. Initially, there were long gaps in PCDP I
supervision missions—there was a gap of eight months between the second (November
2004) and third supervision missions (July/August 2005), and one year between the third and
the MTR (in June/July 2006). After the MTR, however, the quality and intensity of
supervision picked up considerably. The ICR candidly reported on a number of supervision
issues, including the failure to follow up on problems identified during supervision missions,
the persistence in focusing on disbursement progress rather than development impact, the
lack of follow-up on the project's remedies to limit procurement problems and misallocation

27
of funds, and the lack of attention to environmental assessment. There was also evidence that
the project did not comply with the World Bank’s safeguards policies. After the MTR,
however, reporting became more candid. The increased quality and intensity of supervision is
also reflected in the marked increase in the budget for supervision.
3.68 Quality of supervision for PCDP I is rated moderately unsatisfactory.
3.69 The overall rating of Bank performance in PCDP I is rated moderately
unsatisfactory.
BORROWER PERFORMANCE
3.70 Government performance for Phase I. Government has demonstrated a strong
commitment to pastoral communities and to decentralization throughout both phases.
However, there were shortcomings before and during Phase I project implementation. First,
without providing advance notice to the Bank, the government shifted responsibility for the
project from MoA to MoFA. This sudden shift disrupted the building of implementation
capacity, hindering project start-up. Second, the protracted restructuring of the institutions
responsible for disaster preparedness and prevention hampered performance of the Pastoral
Risk Management Component. Third, poor cooperation between government units held up
implementation and delayed staff recruitment. Fourth, the mobile outreach teams were
hamstrung by shortfalls in budget and staffing. Fifth, government collaboration with
NGOs—a key part of project design—was weak (World Bank Group 2009b, p. 22). Finally,
government counterpart funding was only 68 percent of the appraisal projection (World Bank
Group 2009b, p. 25).
3.71 Government performance for Phase I is rated unsatisfactory.
3.72 Implementing Agency Performance for Phase I. FPCU project teams were
carrying out a project using an approach that is naturally intensive in its use of personnel and
complex in the nature of relationships required for successful implementation. They are also
working in very remote areas under quite challenging circumstances.
3.73 However, the FPCU did not systematically comply with procedures in the operating
manual: the sequencing and selection criteria for subproject selection were not enforced, staff
was not adequately trained, and coordination with partner organizations was weak. "There
were also clear failures in the management and delivery of funds, leading to cases of
misprocurement. This resulted in hasty decisions, in some cases influenced by political
pressure, and financial commitments beyond the funds available for the project" (World
Bank Group 2009b, p. 23).
3.74 Implementing agency performance for Phase I is rated unsatisfactory.
3.75 The overall rating of borrower performance in PCDP I is rated moderately
unsatisfactory.

28
4. Pastoral Community Development Project – Phase II
Objectives, Activities, and Relevance of Objectives
4.1 The objective of the second phase of the PCDP, approved in 2008, was to “increase
pastoralist communities’ resilience to external shocks and improve the livelihoods of
Beneficiary Communities, thereby to contribute to overall poverty alleviation in the territory
of the Recipient.”
4.2 The components of Phase II were largely the same as Phase I, except that under the
CIF, the subcomponent of IGAs was replaced with a subcomponent supporting the
establishment of RUSACCOs in beneficiary communities; and a Participatory Learning and
Knowledge Management Component was added.
Relevance of Project Objectives
4.3 The relevance of the objectives of the second phase is rated substantial. PCDP II
was the main investment program in the lowland areas intended to promote the FY06–07
Interim Country Assistance Strategy objective of addressing vulnerability and growth in
Ethiopia. The strategic objective in the Bank's CAS for Ethiopia for FY08–11 was consistent
with PASDEP; that is, fostering economic growth in order to sustain the emerging economic
take-off, improving access to and quality of basic service delivery, and reducing Ethiopia’s
vulnerability to help improve prospects for sustainability. The second pillar of the Bank’s
Country Partnership Strategy for FY13–16 is geared toward “enhancing resilience and
reducing vulnerabilities,” which includes the improved risk management and delivery of
social services, the core of the PCDP II. Hence, the PDOs continued to be relevant to the
Bank's strategic partnership with Ethiopia until PCDP II closed in December 2013.
4.4 The second-phase objective lacked specificity, however, with regard to the definition
of livelihoods (defined in the PAD as growth and stability of incomes, access to social and
public services, improved social relations and institutions, and reduction of vulnerability).
The objective was substantially relevant to the needs of pastoral communities, but the
addition of the broader poverty-reduction aim was unrealistic with regard to the scope and
nature of project design.
Relevance of Project Design
4.5 The relevance of design of Phase II is rated modest. Phase II project design
benefited from lessons learned from Phase I. Based on the government-commissioned IGA
Assessment (discussed in some detail in the efficacy section), the project’s course was
corrected under Phase II and the IGA concept was dropped. The project also introduced the
RUSACCO model in Phase II, modeled after pilots tested through an IFAD rural finance
project. RUSACCOs promoted the use of savings and credit to finance IGAs, predominantly
by women. It appropriately left business decisions to individuals, depending on their
capability, with the members of the group vested in ensuring success. The decision to drop
the IGA concept, coupled with the introduction of the RUSACCO model, continuing
investments in public goods through the CIF, the importance assigned to the development of

29
an EWS, and the sequencing of project activities, substantially increased the relevance of
design of Phase II as compared to Phase I.
4.6 The design of the project management structure continued to work well to ensure
effective implementation of project activities. While centrally coordinated by MoFA, it also
incorporated the MoA and the Federal Cooperative Agency to implement specific
components in line with their mandates and specialization. It also delegated responsibilities
to regional governments to approve and finance CIFs, disaster preparedness investment
programs, and emergency early responses. WDCs were mandated for the selection of
beneficiary kebeles and in approving CIFs. Kebele Development Committees were
empowered in identifying priority needs, procurement of goods, and implementation of
subprojects.
4.7 Another substantially relevant design feature was the importance assigned to the
development of the early warning systems that directly address the project objective of
increasing resilience to shocks and protecting livelihoods. The design featured support for
Early Warning and Response Bureaus and Woreda Early Warning and Response Desks that
were designed to collect and analyze basic household-welfare data to identify the early onset
of disasters at the woreda level. This, together with the subsequent preparation of disaster
preparedness investment programs and coordination of pastoral risk management in the
central and regional project coordinating units, was a relevant design feature. However, there
were weaknesses in implementation, which are discussed later in this report.
4.8 The sequencing of activities across all three phases was also reasonable (Table 4.1),
lending itself to learning and critical course correction, which was, for the most part, done in
a timely manner (for example, the decision to move from IGAs in PCDP I to RUSACCOs in
PCDP II).
Table 4.1. Sequencing of Project Activities across the Three Phases
Phase Objectives Basic features
PCDP-I
2003 –
2008
Target one-third of pastoral and agro-pastoral woredas for
community development.
Identification and piloting of
Community-based processes
and institutional mechanisms
Establish and test a Community Investment Fund (CIF).
Establish and pilot community-based pastoral risk
management mechanisms.
Support further definition of the government’s pastoral
development strategy.
PCDP-II
2008-
2013
Target up to two-thirds of pastoral and agro-pastoral
woredas for community development (note that funding for
PCDP II only allowed targeting of half the pastoral and
agro-pastoral woredas).
Expansion of community
development and pastoral risk
management systems
Enhance pastoral livelihoods (through expansion of credit
and savings cooperative systems to pastoral areas).
Expand community-based pastoral risk management

30
Phase Objectives Basic features
mechanisms to all pastoral and agro-pastoral woredas.
Expand pastoral development networking.
PCDP-
III
2013-
2018
Target most pastoral and agro-pastoral woredas for
community development and work on institutionalizing the
interventions.
Full geographic scale-up;
consolidation and
institutionalization of
community development
approaches
Deepen CDD approaches and support pastoralists’ income-
generating activities more holistically.
Expand knowledge generation and dissemination and
internal learning at all levels.
Sources: World Bank Group 2014 and IEG adaptation from project documentation.
4.9 However, there were several shortcomings in design. It was centered on the provision
of social infrastructure and some limited economic infrastructure. As such, the project made
a significant contribution to meeting some of the critical social and economic infrastructure
needs of pastoralist communities and introducing some new and innovative concepts for
delivery of services and credit, but the link from investments to the desired outcomes is
unclear. These investments are critical to improving the well-being of the communities, and
indeed highly appreciated by the beneficiaries, but it is difficult to establish the pathway from
the investments to the overall project objective of creating sustainable livelihoods. A
sustainable livelihood–centered approach would have required a much broader range of
coordinated investments, taking into account the package of investments needed to
significantly elevate livelihoods. Given the constraints and challenges of pastoralist
communities, a sustainable livelihood approach would be centered on water, improving
livestock production and marketing chains, rangeland management, and promoting
supplementary sources of income, including agriculture. PCDP interventions are far too
limited and incomplete to result in sustainable livelihoods for pastoralists. While PCDP III
expands the livelihood component by enhancing access to finance and helping pastoralists to
develop innovative, income-diversifying business activities and/or to strengthen existing
productive activities, these activities are still not likely to be very significant in relation to the
broader strategic approach needed.
4.10 Another shortcoming of design is that more could have been done to consider the
needs of the mobile populations. PCDP design focused primarily on settled agro-pastoralists.
Recognizing that many agro-pastoralists are impoverished, the inclusion of this group was
necessary. However, more could have been done to understand and meet the needs of the
mobile population.
4.11 Project design could also have been enhanced by considering the different
socioeconomic groups within the region. The target region is large geographically, with 12
million people, and economically diverse. The PCDP II appraisal document summarizes the
characteristics of the different regions. The document does not, however, articulate the extent
to which project design addresses the socioeconomic needs within the different regions or the
lessons learned in this regard during the evolution of the program. There is no reference to

31
quantified data on, for example, the proportion of the population that is largely settled, or the
proportion that is partly mobile and partly settled, or the proportion that is mostly still
mobile. PCDP does have a knowledge and learning component, and over the 15-year period
of the program, more in-depth social assessments (not just social safeguard assessments)
would have been helpful to inform project design.
4.12 Moreover, the geography-specific issues of livestock productivity, value chains and
marketing, and competition for natural resources were not a major focus of the operation.
The project supports small-scale irrigation (be used for fodder as well as food crops) as well
as animal health points, but the bulk of funding appears to have been for classic community
fund investments, such as water supply, schools, health posts, and rural roads.
Implementation
4.13 Phase II implementation went more smoothly than implementation of Phase I. While
both phases encountered implementation challenges created by low capacity, remote and
difficult access areas, and security issues, the project, during its first phase, had developed
significant experience and capacity in decentralization and CDD, which could be transferred
to the second phase. For example, the FPCU team had more implementation experience with
CDD, and the team remained intact, so team members were well aware of the
implementation challenges of a project intended to deliver services and set up systems in
remote, neglected pastoral areas. Also, substantial capacity had been built at the woreda,
kebele, and community levels under PCDP I, which facilitated the expansion of coverage
from 32 to 55 woredas. PCDP II took a more cautious and pragmatic approach, aiming not to
repeat the operational mistakes made during the first phase, including rushing
implementation of activities without proper capacity building and community consultations
World Bank Group 2009a).
4.14 Perhaps the most critical change from PCDP I to II was the shift from IGAs to
RUSACCOs under the Rural Livelihoods Program. Although the idea was to immediately
start the establishment of pastoral savings and credit cooperatives, PCDP II spent the first
year building awareness and capacity at all levels and recruiting and training staff at the
woreda level. Moreover, care was taken to not rush to disburse seed money until the
sustainability of the financial and management aspects of the established RUSACCOs was
ensured (World Bank Group 2011).
4.15 The project registered promising implementation progress in most of its intervention
areas, and the performance rating of the project during the MTR was satisfactory. The
disbursement rate of the project was at 50 percent and, with no disbursement lag, was also
progressing well. Ninety-three percent of community subprojects were providing the required
services, and a total of 300 RUSACCOs had been established (with a majority of women
members). The MTR also reported that the EWS was functioning well (World Bank Group
2011).
4.16 However, there were a few implementation issues that required responses from the
project team, and the project underwent a level II restructuring in December 2011 to address:
lagging preparation of statements of expenditure, which reflected capacity constraints leading
to construction delays in the CIF projects; security issues limiting implementation in some

32
woredas; and the need to make some adjustments to the results framework to better measure
the PDOs. A number of adjustments were made. For example, the first tranche payment of 30
percent was raised to 50 percent if the kebele was more remote, and the community cash
contribution was held at 5 percent, rather than moving up a progressively increasing scale (5–
7–10 percent). These measures helped to reduce delays in processing replenishments (World
Bank Group 2014).
4.17 Despite the implementation challenges mentioned above, PCDP II met key triggers
required for moving the project to its third phase, APL FY13–18 (ongoing).
Safeguard Requirements and Compliance
4.18 For Phase II, three safeguards policies were triggered: OP/BP 4.01, Environmental
Assessment; OP/BP 4.09, Pest Management; and OP/BP 7.50, Project on International Water
Ways. Attention was brought to OP/BP4.01 because PCDP II began to implement Disaster
Preparedness Strategic Investment Plan (DPSIP) subprojects such as small-scale irrigation
and infrastructure without first screening for environmental effects.
4.19 According to PPAR mission interviews, the Bank discovered the error quickly and
course-corrected. An Environmental and Social Management Framework for community
subprojects was prepared that specified subproject screening procedures. The framework also
included training and capacity-building requirements at the federal, regional, and woreda
levels to support effective implementation. Projects on international waterways, BP7.50, was
triggered because of the small-scale irrigation investments along international waterways.
Riparian notification was given to the governments of Kenya and Somalia for PCDP II
investments (World Bank Group 2014, pp. 13–14).
4.20 Project documentation shows evidence of active involvement of Bank safeguards
technical staff in supervision missions. This was confirmed by interviews with relevant
country office staff and the PMU. The Bank has also made considerable efforts to train
federal-, regional- and woreda-level safeguard staff. According to the ICR, the World Bank
complied with all three triggered policies under Phase II.
Fiduciary Management and Procurement
4.21 Financial management and procurement improved under Phase II. Project
documentation shows evidence of active involvement of Bank financial management and
procurement staff in supervision missions. Considerable training and capacity-building
efforts had been made in the previous phase, and this was continued under the second phase.
This new capacity created greater community ownership and contributed to cost-
effectiveness and transparency in the procurement process. Procurement by communities was
a positive step in capacity building, as they gained experience in procuring skilled labor and
building materials for CIF subprojects. PCDP III highlights the issue of low salaries of
woreda staff and, specifically, the lack of recognition in Ethiopia of procurement as a valid
profession, which leads to frequent staff turnover.

33
Monitoring and Evaluation
4.22 Under Phase II, the FPCU set up a sound reporting structure that allowed detailed
tracking of physical progress of the project. Financial transactions were also well
documented, even if the flow of data was slow because of the large number of statements of
expenditure. Using community data-gatherers for the EWS was a successful design element
and worked well in practice, because communities reported that they felt empowered to
better track the risk of drought and to address it in advance. The main weakness was that the
original M&E framework PDO outcome indicators were inappropriate for the measurement
of the PDOs and, regardless, most of the PDOs could not be measured. Three out of five
original PDO indicators were dropped and replaced during the project's restructuring in
December 2011, and, at the same time, eight more PDO indicators were added.
4.23 M&E implementation improved considerably under Phase II. More than 80 percent of
early warning monthly reports and quarterly early warning bulletins (national and regional)
were produced and disseminated by the Early Warning and Response Department and the
MoA (the target was 80 percent). The quality of project reporting was high. The reports were
thorough, and they closely tracked a very large number of project activities.
4.24 M&E utilization substantially improved during Phase II. "PCDP II has built robust
results and M&E frameworks with clearer objectives, measurable indicators, and provisions
for M&E” (World Bank Group 2009b, p. 11). The second phase was reviewed after
completion through an end evaluation commissioned to external consultants by MoFA,
followed by the operational ICR. The external consultants produced a report with a
considerable amount of interesting material about the project’s performance, best practices,
and lessons learned. To supplement the information obtained from the survey, the end
evaluation used a substantial amount of information from the project's Phase II monitoring
system. It is not clear from the ICR, however, how much of the information collected during
implementation was used to course correct during the project.
4.25 In addition, in each region, the regional project coordination units produced films to
document and advertise PCDP II activities. The films feature stakeholder interviews, project
personnel, and project investments. Most prominent are the stakeholders’ testimonials of how
the project has positively affected their lives. These testimonials and success stories have
greatly contributed to the visibility of PCDP II, and as a result, the Pastoral Standing
Committee in the Ethiopian Parliament considers PCDP a flagship program in pastoral areas.
4.26 IEG found that the both ICRs produced by operations and the external assessments
were candid and useful. The main overall weakness with the PCDP I and II M&E system was
that no indicators were established or monitored for the overall objectives of the APL:
building resilience and sustainable livelihoods.
4.27 M&E design, implementation, and utilization for PCDP II is rated substantial, with
shortcomings.

34
Achievement of Objectives
4.28 This section attempts to assess achievement of objectives for Phase II by looking at
the PDO in two parts: (1) improved livelihoods and (2) increased resilience. This section
reviews the underlying evidence provided by the ICR and the end evaluation (Loyya Consult,
January 2014) in order to validate the reported results. It is supplemented by interviews with
the PMU, meetings with relevant government officials, and evidence collected by IEG in 9e
woredas (13 kebeles), where information was gathered from interviews with 52 Woreda
Development Council members, 137 Kebele Development Council members, 105 direct
project beneficiaries (39 men, 66 women), and 34 members of rural savings and credit
cooperatives.
4.29 As a first step in assessing the outcomes of Phase II, IEG reviewed the quality of, and
results reported by, an end evaluation commissioned by the project. The Phase II end
evaluation exhibited some weaknesses, which IEG took into account in deciding how to use
the evaluation’s material to validate results.
4.30 The end evaluation visited 16 of the 55 woredas. These visits included 176 focus
group discussions in 80 project kebeles (2,640 persons) and 873 household interviews. The
team also visited 130 micro-projects, but the end evaluation does not provide any information
on results associated with these specific site visits, nor does it provide the criteria for
selecting the sites. The end evaluation team told IEG that certain areas that were insecure or
that required too much travel time were eliminated from site visits in consultation with the
PMU. This may have produced a bias, or an overestimation of results, and should have been
disclosed in the end evaluation’s methodology and factored into the overall assessment
4.31 As discussed in more detail below, results reported as “improved access” were
determined by an estimation of the population size within a certain distance from the asset,
not the actual use of the assets, their quality, or their ability to be sustained.
Objective (1): Improve the livelihoods of beneficiary communities
4.32 Activities related to the provision of social services (such as the building of schools
and health posts) and economic services (savings and loan groups) were appropriate and
highly aligned with community needs and requests, though it is difficult to ascertain how
these small outputs contribute to improved livelihoods on a larger scale and in the longer
term.
The Community Investment Fund (CIF)
4.33 PCDP II built on the experience of PCDP I and continued to ensure active community
participation in the design, implementation, and oversight and management of public goods
funded from the CIF. The projects selected were a part of the CAPs prepared by the
communities according to their own development priorities. They also identified, budgeted,
and implemented subprojects that were financed as grants through the CIF subcomponent
(Loyya Consult 2014). This subcomponent financed subprojects including, but not limited to,
water supply, small-scale irrigation, healthcare, education, and rangeland management. The
idea was that selected communities would receive a series of three successive CIF projects
before “graduating” from PCDP.

35
4.34 The CIF projects made up the vast majority of project financing. Total planned
financing for the CIF under PCDP II was US$93.4 million (US$14.7 million from
beneficiaries/US$51.9 million from the Bank). Actual was US$90.94 million (World Bank
Group 2014, p. 31). By project close, the ICR reported that 3,123 of the 3,401 planned
subprojects were completed, representing 92 percent. Of these, 94 percent of the completed
projects are functional (World Bank 2014, p. 22).
4.35 The end evaluation and the ICR provide information on the outputs achieved, as
measured by the delivery of goods and the reported number of persons who have gained
access to the services (as measured by an estimation of the population size within a certain
distance from a given asset). As shown below (regarding animal health posts), using area
estimation is an insufficient measure to record the realistic level or rate of access achieved.
Access to Water. Between 562 (World Bank Group 2014, pp. 20, 32) and 568 water
points (Loyya Consult 2014, p. ix) were built by the project. Between 1.1 (end
evaluation) and 1.2 million (ICR) people are reported to have gained improved access
to potable water (no target was established for this goal). However, the end evaluation
surveys also estimate that 25 percent of the sampled survey population did not have
adequate access to water at project close (Loyya Consult 2014, p. 19). Factoring in
the overestimation that may have occurred through sampling bias, adequate access to
water would have been provided to about 825,000 to 900,000 beneficiaries. The
output data collected did not include data on water quality. Open wells and
unprotected springs in Ethiopia are at risk of bacterial and natural contamination (for
example, fluoride is an issue in the Rift Valley). Nevertheless, the ability of the
project to extend potable water services to hundreds of thousands of remote rural
pastoral communities is noteworthy and was adequately achieved by the project.
Access to Primary Education. According to the ICR, 810 schools were constructed
(World Bank Group 2014, p. 32). However, the end evaluation notes that 138 of the
810 schools were nonfunctioning at project close, or 17 percent of the total schools
completed (Loyya Consult 2014, p. 13). The ICR reported that net enrollment, a
result of the newly constructed schools, was 73,784 (31,704 female) (World Bank
Group 2014, p. 32), and the end evaluation reported that the drop-out rate decreased
by 53 percent (Loyya Consult 2014, p. 21). However, it was unclear whether the
estimated number of persons reported as receiving improved access can be associated
with the 672 schools that were functioning at project close, or the 810 completed.
While class size would be extremely large at, on average, 91 persons per constructed
school, the estimations in rural Ethiopia are feasible.
IEG’s interview at the Ministry of Education revealed some shortcomings in the way
that the school construction component was implemented. Ethiopia has a universal
education policy for primary education. The government is allocating 25 percent of
the annual budget toward education. In rural areas, including the pastoral areas, the
government offers alternative basic education. IEG’s interview at the Ministry of
Education revealed that in nonsedentary, pastoral areas, education facilities should be
mobile, and that the government currently finances mobile schools in areas where
basic services are not yet being sustainably provided. The Bank’s contribution to
36
supporting primary education is noted, and the decreased drop-out rates can be
associated with both the reduced travel time to school and the quality of the
infrastructure. As noted by the Ministry of Education, decreased drop-out rates would
have been likely for children within grades one to four, but between grades five to
eight, school construction would not have been a very influential factor in families’
decisions to withdraw their children from school when the children are of working
age. For girls in secondary school, however, distance matters most where there is a
fear of “bride snatching” in deep, remote pastoral areas. Schools that are closer to
home diminish family fears that their daughter’s commute will make her unsafe. In all
areas, urban and rural, schools are not built to standard; they lack water points, first
aid, and proper hygienic facilities for girls (especially as they reach puberty). The
PCDP results reporting did not report on these quality features; however, the IEG
mission learned that a parallel project—the WASH program—is addressing this in
321 woredas, including some pastoral areas.
Animal Health Posts. There were 373 animal health posts planned; 295 were
completed, and of these, only 230 were reported to be functional at project end,
representing 60 percent of the planned animal health posts. According to the ICR,
some 2.3 million livestock benefited from increased access to health facilities.
However, using area estimation is an insufficient measure to record the realistic level
or rate of access that was achieved. In this example, each animal health post would
have had to effectively serve 10,000 animals.
Human Health Posts. There were 400 human health posts planned. Of these, 338
were completed, but only 294 were functional, representing 73 percent of the planned
human health posts, by project end. The ICR reported that 757,648 people gained
access to health facilities. The end evaluation reported that in some regions, such as
Afar and SNNPR, there was a lack of skilled practitioners and drugs available at the
facilities. Even so, to have achieved the level of access reported, each human health
facility constructed would need to be able and equipped to support an average of
2,577 persons.
Rural Roads. The ICR reported that the project constructed 158 (of 160 planned)
functioning portions of rural road, equaling 1,394 kilometers of road constructed, or
an average of 9 kilometers constructed per area. The ICR also reported that 364,900
people gained access to improved road connectivity—rural roads—compared with a
target of 200,000.
Small-Scale Irrigation. It is less clear how many people have benefited from other
goods, such as irrigation services. The project financed 158 irrigation projects (World
Bank Group 2014, p. 32), which covered a total of 3,468 hectares of land. The ICR
reports that 43,574 households enjoyed improved access to small-scale irrigation.
However, this estimate would imply that the average land holding per household is 13
hectares of land, which is quite large for poor rural households in Ethiopia.

37
4.36 IEG supplemented this analysis by gathering community and beneficiary perceptions
about the relevance and utility of the community investments provided by the project.
Feedback was obtained by beneficiaries within three of the four covered regions and in
woredas covered during both phases (see Annex D for methodology). IEG found that in all
kebeles treated by the project and visited by IEG, communities received at least one CIF
asset. All of the assets visited by the field mission were functional. The infrastructure was
operational and, in most cases, there was adequate equipment (medical supplies, vaccines,
books, desks, and the like). This is a surprisingly positive finding, since many projects of a
similar nature often experience significant operation and maintenance issues after
completion. Interviews revealed that there appears to be a strong commitment to
decentralization and active involvement of communities in project selection and completion,
and that the requirement of a community contribution may be responsible for the high level
of functionality under PCDP. The PMU staff also indicated that they seek clear commitment
to operation and maintenance from kebele and woreda administrations before committing to
a project.
4.37 Perceptions gathered from the beneficiary feedback module reveal that the assets
chosen were grounded in the needs of the communities. The beneficiary interviews provided
a rich set of qualitative feedback that supported the validation of the project-reported results.
When asked about the most significant impact of the project, beneficiaries offered the
following responses:
Easier access to animal health (specific impacts include reduced animal mortality, more
vaccinations, increased herd size)
Increased number of students in schools, improved quality of school facilities (including
closer proximity and reduced travel time)
Decrease in illiteracy, which benefits the household since children are able to help their
families conduct daily transactions
Improved human health (specific impacts include reductions in maternal mortality and
more vaccinations, HIV testing, and family planning); Increased health because of
improved water.
More security because of reduced distance traveled by women and children to and from
school and water sources
Increased access to irrigation and corresponding improvement in income
Changes in lifestyle due to health and sanitation training from the MST—for example,
not allowing animals to sleep in human-occupied dwellings
Rural Savings and Credit Cooperatives
4.38 PCDP II also made a significant contribution to establishing and supporting
RUSACCOs. The shift from IGAs in PCDP I to RUSACCOs under PCDP II was the right
choice, and the RUSACCOs generally functioned much better than the IGAs under PCDP I.
The PPAR mission found that RUSACCO groups were well informed and well organized,
with good record keeping. RUSACCO members also reported learning about savings and
lending and bookkeeping.

38
4.39 The main value added of the PCDP RUSACCO model (compared with other rural
savings and loan programs) was the 100,000 Birr (approximately US$5,000) in seed money
that the project provided, and the technical support and training received from the MSTs. The
end evaluation reported that 448 RUSACCOs created under the project were able to generate
20.39 million Birr (US$944,000) saving and 6.00 million Birr (approximately US$283,000)
share capital. On average, each RUSACCO has mobilized approximately 58,906 Birr
(US$2,779) in the project period. The performance of RUSACCOs in mobilizing saving and
share capital was, however, substantially different from region to region. RUSACCOs in the
Somali region mobilized the most, but those in Afar did the least (Figure 4.1). Neither the
ICR nor the end evaluation offers an explanation for this difference.
Figure 4.1. Amount of Capital Mobilized from Saving and Paid Capital by Region
Source: Adapted by IEG from Loyya Consult 2014 (computed from secondary data).
4.40 PCDP II made efforts to include women in the establishment of RUSACCOs. All
RUSACCOs interviewed by IEG were of mixed gender, with the exception of one all-female
RUSACCO in the Afar region. IEG found that both women and men were accessing and using
loans from the RUSACCOs. There were some reports of women having to ask approval to
take a loan, but the women also reported greatly benefiting from the bookkeeping and financial
skills training they received as RUSACCO members and carrying that training into their
households.
0 2 4 6 8 10
Somali
Afar
Oromiya
SNNPR
Millions of Birr
Reg
ion
Somali Afar Oromiya SNNPR
share Capital (milln Birr) 3.18 0.61 1.81 0.34
Saving (in Millions of Birr) 7.66 2.22 7.68 2.83
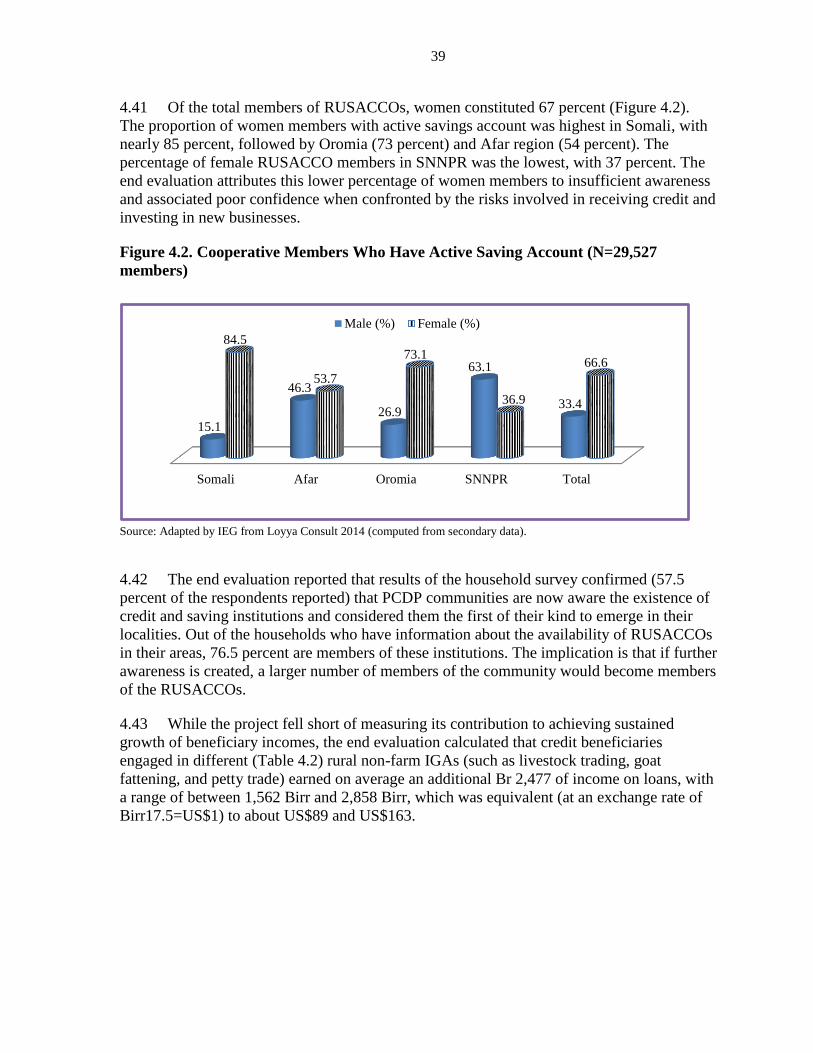
39
4.41 Of the total members of RUSACCOs, women constituted 67 percent (Figure 4.2).
The proportion of women members with active savings account was highest in Somali, with
nearly 85 percent, followed by Oromia (73 percent) and Afar region (54 percent). The
percentage of female RUSACCO members in SNNPR was the lowest, with 37 percent. The
end evaluation attributes this lower percentage of women members to insufficient awareness
and associated poor confidence when confronted by the risks involved in receiving credit and
investing in new businesses.
Figure 4.2. Cooperative Members Who Have Active Saving Account (N=29,527
members)
Source: Adapted by IEG from Loyya Consult 2014 (computed from secondary data).
4.42 The end evaluation reported that results of the household survey confirmed (57.5
percent of the respondents reported) that PCDP communities are now aware the existence of
credit and saving institutions and considered them the first of their kind to emerge in their
localities. Out of the households who have information about the availability of RUSACCOs
in their areas, 76.5 percent are members of these institutions. The implication is that if further
awareness is created, a larger number of members of the community would become members
of the RUSACCOs.
4.43 While the project fell short of measuring its contribution to achieving sustained
growth of beneficiary incomes, the end evaluation calculated that credit beneficiaries
engaged in different (Table 4.2) rural non-farm IGAs (such as livestock trading, goat
fattening, and petty trade) earned on average an additional Br 2,477 of income on loans, with
a range of between 1,562 Birr and 2,858 Birr, which was equivalent (at an exchange rate of
Birr17.5=US$1) to about US$89 and US$163.
Somali Afar Oromia SNNPR Total
15.1
46.3
26.9
63.1
33.4
84.5
53.7
73.1
36.9
66.6
Male (%) Female (%)

40
Table 4.2. Types of Rural Non-Farm Activities Engaged in by Loan Beneficiaries
Activities % (N=
316)
Engage in petty trade 23.7
Engage in goat rearing 17.1
Engage in livestock/Oxen fattening 17.1
Engage in livestock trading 13.0
Engage in cattle rearing 5.4
Use the loan to purchase consumable goods 3.2
Petty trade & goat rearing 2.5
Petty trade and livestock fattening 1.9
Livestock rearing and trading 1.9
Other (such as brick production, transport provision using motorbike, mobile charging
services, petroleum trading, and the like)
14.2
Total 100
Source: Loyya Consult 2014 (computed from household survey).
4.44 IEG interviewed members of seven RUSACCOs created between 2010 and 2012. The
interviews confirmed many of the findings from the end evaluation. Loans were mainly used
for such IGAs as livestock fattening, petty-trading (handicrafts, milk products, dates), the
establishment of a small business (cell phone charging, restaurant, tea room), and growing
crops. Only one group indicated that they used the loan for a social welfare activity (for
example, a funeral). When asked whether they deplete their savings during a shock or crisis,
all RUSACCO members interviewed indicated that their savings were secure, and that if they
had to tap into their savings stock they would replenish it as soon as they were able. Profits
from the loans were reportedly invested in the purchase of additional livestock, although
women reported using the profits to pay for school materials, fees, or clothing, or better food
for their families. In some villages, there were other (non-PCDP) rural savings and loan
groups present, but project beneficiaries interviewed indicated that they preferred the PCDP
model because of the seed capital provided. The IEG team was able to visit the offices of
most of the RUSACCO groups and found that the offices were well equipped with
notebooks, lock boxes, and (in some cases) public displays of the funds and loans.
4.45 The project used loan repayment a results indicator. The target was that 95 percent of
the saving and credit groups would repay the loan they received, with less than 5 percent of
payments overdue by 30 days. According to the end evaluation, repayment was 100 percent
for the mature loans, and no defaults were recorded (Loyya Consult 2014, pp. 32–33).
4.46 Overall, the PPAR mission found that PCDP is very popular with villagers, who see
its investments in community assets as a means to a better life, particularly the building of
classrooms. After education, the communities’ priority has been water for humans and
livestock, followed by health posts. At the conclusion of PCDP II, 32 woredas were treated
by the program. From project data received from regional project staff, IEG learned that not

41
all kebeles were treated within a woreda, and that treated woredas received between one and
six subprojects. Interestingly, there was no significant variation in subproject choice,
implementation arrangement, or community commitment across the four project regions,
despite cultural and geographic diversity.
4.47 Worthwhile as the investments under CIF and RUSACCOs were, the question
remains as to the extent to which these could be considered to have created sustainable
livelihoods for pastoralists. Investments in roads open up possibilities of improved market
access, access to animal health can increase yields, and access to credit helped some
community members (particularly women) to augment incomes. But the project fell short of
developing these linkages or set any monitoring indicators for sustainable income. In the
PPAR mission’s view, the components were far too small to have made a significant impact.
So while lauding the effectiveness of CIF investments, the impact on sustainable livelihoods
is considered marginal.
4.48 Achievement of this objective is rated substantial.
Objective (2): Increase the pastoralist communities’ resilience to external
shocks
4.49 Critical pastoral risk management activities (EWS system development, financing of
wells, roads and irrigation) have been put in place, but there is little evidence of the
effectiveness of PCDP’s EWS to influence disaster response at the federal level or how each
of the individual investments under this objective contribute to a larger disaster management
agenda.
4.50 According to the ICR, this PDO was partially achieved (Table 4.3). All four of the
project regions prepared comprehensive DPSIPs, meeting the target of four, and 89 percent
of approved DPSIP subprojects were completed each year, exceeding the target of 80
percent.
Table 4.3. Achievement of PDO Indicators Relating to Imroved Resilience
PDO Indicator Result
Percentage of Disaster Early Response
Grant-financed early response activities
within one month after request is
officially submitted up on pastoral area
EWS identifying change from “normal”
conditions
Achieved (100% actual, 80% target)
Early warning information on disaster
risks available for all pastoral and agro-
pastoral woredas
Almost achieved (122 compared with 126 target,
96.8%)
70% of community members satisfied
with timeliness, quantity and quality of
disaster early response
Dropped-(however the project end-term evaluation
reported 75.7% of households reported that early
warning response was provided to community in a
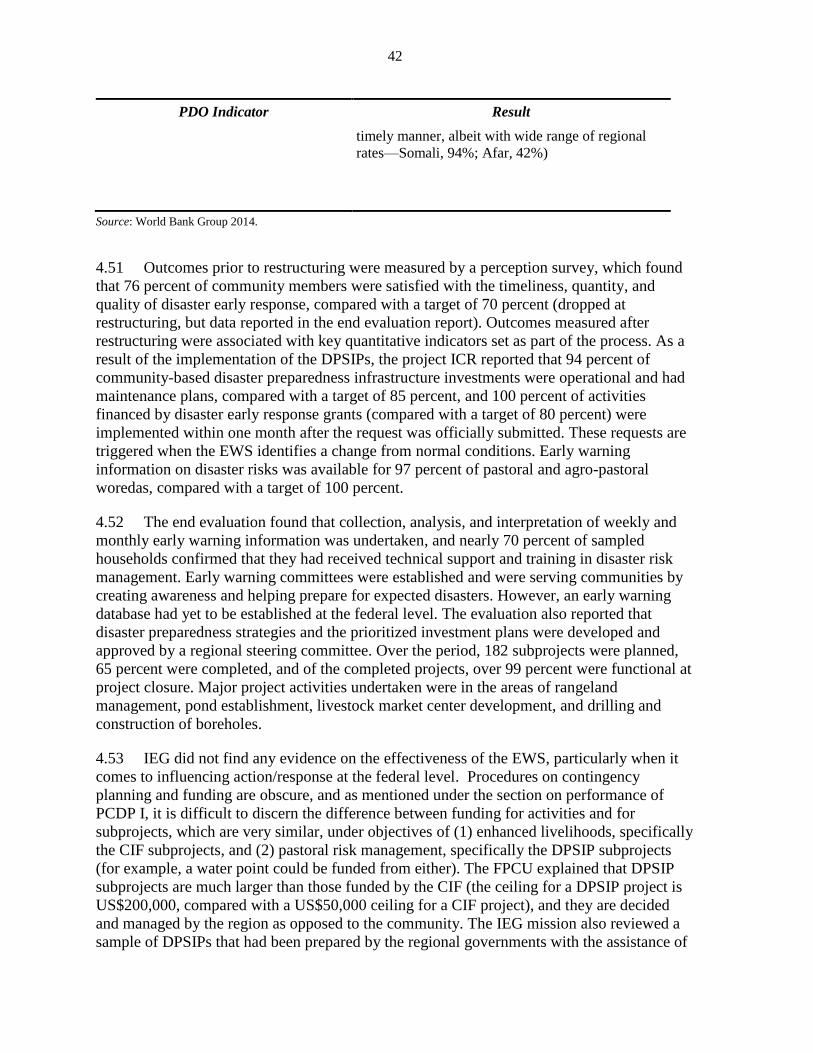
42
PDO Indicator Result
timely manner, albeit with wide range of regional
rates—Somali, 94%; Afar, 42%)
Source: World Bank Group 2014.
4.51 Outcomes prior to restructuring were measured by a perception survey, which found
that 76 percent of community members were satisfied with the timeliness, quantity, and
quality of disaster early response, compared with a target of 70 percent (dropped at
restructuring, but data reported in the end evaluation report). Outcomes measured after
restructuring were associated with key quantitative indicators set as part of the process. As a
result of the implementation of the DPSIPs, the project ICR reported that 94 percent of
community-based disaster preparedness infrastructure investments were operational and had
maintenance plans, compared with a target of 85 percent, and 100 percent of activities
financed by disaster early response grants (compared with a target of 80 percent) were
implemented within one month after the request was officially submitted. These requests are
triggered when the EWS identifies a change from normal conditions. Early warning
information on disaster risks was available for 97 percent of pastoral and agro-pastoral
woredas, compared with a target of 100 percent.
4.52 The end evaluation found that collection, analysis, and interpretation of weekly and
monthly early warning information was undertaken, and nearly 70 percent of sampled
households confirmed that they had received technical support and training in disaster risk
management. Early warning committees were established and were serving communities by
creating awareness and helping prepare for expected disasters. However, an early warning
database had yet to be established at the federal level. The evaluation also reported that
disaster preparedness strategies and the prioritized investment plans were developed and
approved by a regional steering committee. Over the period, 182 subprojects were planned,
65 percent were completed, and of the completed projects, over 99 percent were functional at
project closure. Major project activities undertaken were in the areas of rangeland
management, pond establishment, livestock market center development, and drilling and
construction of boreholes.
4.53 IEG did not find any evidence on the effectiveness of the EWS, particularly when it
comes to influencing action/response at the federal level. Procedures on contingency
planning and funding are obscure, and as mentioned under the section on performance of
PCDP I, it is difficult to discern the difference between funding for activities and for
subprojects, which are very similar, under objectives of (1) enhanced livelihoods, specifically
the CIF subprojects, and (2) pastoral risk management, specifically the DPSIP subprojects
(for example, a water point could be funded from either). The FPCU explained that DPSIP
subprojects are much larger than those funded by the CIF (the ceiling for a DPSIP project is
US$200,000, compared with a US$50,000 ceiling for a CIF project), and they are decided
and managed by the region as opposed to the community. The IEG mission also reviewed a
sample of DPSIPs that had been prepared by the regional governments with the assistance of

43
consultants. These appeared more to be a wish list of investments than a program that was
based on a rigorous analysis of disaster risks, measures to deal with these, and choices among
alternatives. There was also no analysis of the financing options and how the investments
would be sustained.
4.54 Regarding EWS, the PPAR mission also found that there is an uncoordinated
approach among donors and government regarding the disaster mitigation agenda in the
country. Moreover, there are no clear guidelines for how EWS data is validated and used.
There are many different actors and systems involved and seemingly long response delays. In
fact, while IEG learned that various donors’ EWSs had alerted the government to the current
drought facing the country in early 2015, the response (at the federal level) had still not
materialized while the IEG mission was in the country. Other donors reported that their
disaster preparedness plans were not being used for decision making.
4.55 PCDP support to the government’s EWS program was generally appreciated,
especially among WDC officials. The financing from the project provided vehicles, durable
mobile phones, and other equipment to help government officials transmit information about
ground conditions. In every community that IEG visited, it was reported that community
members received training on how to report information to the government and how to
identify and address human and animal health concerns. The consensus was that the system
supported by the project to transmit information upward to relevant staff was generally
useful. It was also reported that the incentive to collect the data under the project helped
ensure a better and timelier collection and transmission of data.
4.56 The lowlands of Ethiopia were experiencing very severe drought during the time of
the IEG field mission (September–October 2015), and this allowed the field team to use a
real-life scenario to better understand how the community needs were met during a time of
severe climate shock. Most communities visited (see Annex D for methodology) indicated
that they had reported their needs to the WDC. In some, but not all, kebeles, beneficiaries
reported that there was some government response, including: information on how to respond
to disasters and maintain productivity; medicines for animal disease; animal feed/cattle
forage; construction of a culvert to divert rainwater; food to handle migration prompted by
the drought; and water brought in on trucks. A few villages also reported receiving assistance
from donors (such as food aid from the World Food Program, or a deep well from Oxfam).
The general sentiment among communities was that the government did what it could, but it
wasn’t enough to meet the vast need of the communities facing climate shock. A few
communities reported that the government response came months too late. This led to loss of
livestock (especially goats and cattle), food scarcity, and increased time spent searching for
water. One community reported learning to save to mitigate the impact of natural disaster
through the PCDP. Overall, however, it was difficult to separate the impact of the EWS
component per se from many other existing EWS mechanisms supported by other donors.

44
4.57 Finally, as for PCDP I, the issue of insufficient oversight of this component by the
PMU continued to persist in PCDP II. The IEG mission did not find any critical review of
components either by the PMU or the Bank for this component.
4.58 Achievement of this objective is rated modest.
Efficiency
4.59 For PCDP II, the IEG ICR Review rated efficiency as modest. The appraisal
document (Annex 10) concluded that a calculation of economic benefits generated by the
project was of limited value because of the multiple anticipated spillover effects among the
project’s activities. In line with this conclusion, the main text of the appraisal document made
no estimate of a rate of return, but stated that the project was expected to have significant
economic and social benefits in the four project areas. The ICR did not provide an estimate
of the rate of return, but stated that "the only relevant income generating data for economic
efficiency was that additional income from RUSACCO loans averaged Br 2,477" (World
Bank Group 2014, para. 75), without indicating the rate of return that these additional
incomes represented. The ICR concluded its assessment of efficiency by listing four
alternative ways of evaluating the project's efficiency: (a) percentage of funds used—100
percent of IDA credits and grants were used and 100 percent of IDA and IFAD financing; (b)
percentage of output targets met—substantial, according to the ICR; (c) superior quality of
construction of project infrastructure—for example, PCDP II human health posts cost 42
percent less than government/NGO-financed health posts for comparable construction; for
primary schools, grades one to four, the PCDP II costs were 57 percent less; and for animal
health posts, 43 percent less; and (d) timely completion of the project—no extensions of the
closing date (World Bank Group 2014, para. 76–79). The IEG ICR Review found the
analysis of efficiency in the ICR to be partial and inadequate and less comprehensive than in
the appraisal document.
4.60 Given the community-driven nature of PCDP subprojects, conventional calculations
of net present values and economic rates of return would likely carry little meaning, because
benefits of the capacity-building components (support to communities and local governance)
cannot easily be quantified in monetary terms; the investment component cannot be known
ex ante, since it is demand-driven and defined in the course of the project; and many benefits
from anticipated investments would be difficult to quantify. However, for community
investments, it would have been worthwhile, as suggested by the ICR Review of PCDP II, to
calculate a social rate of return on the assets provided by the CIF investments after a decade
of lending for community infrastructure. For example, the benefits of education could have
been measured 10 years after the construction of schools.
4.61 In the absence of sound economic analysis, the IEG team assesses overall project
efficiency across two dimensions: (i) implementation and (ii) cost effectiveness.
4.62 Implementation, efficiency losses due to disbursement pressures: PCDP II was
completed on time, in five years. One hundred percent of PCDP II IDA credits and grants
were used.
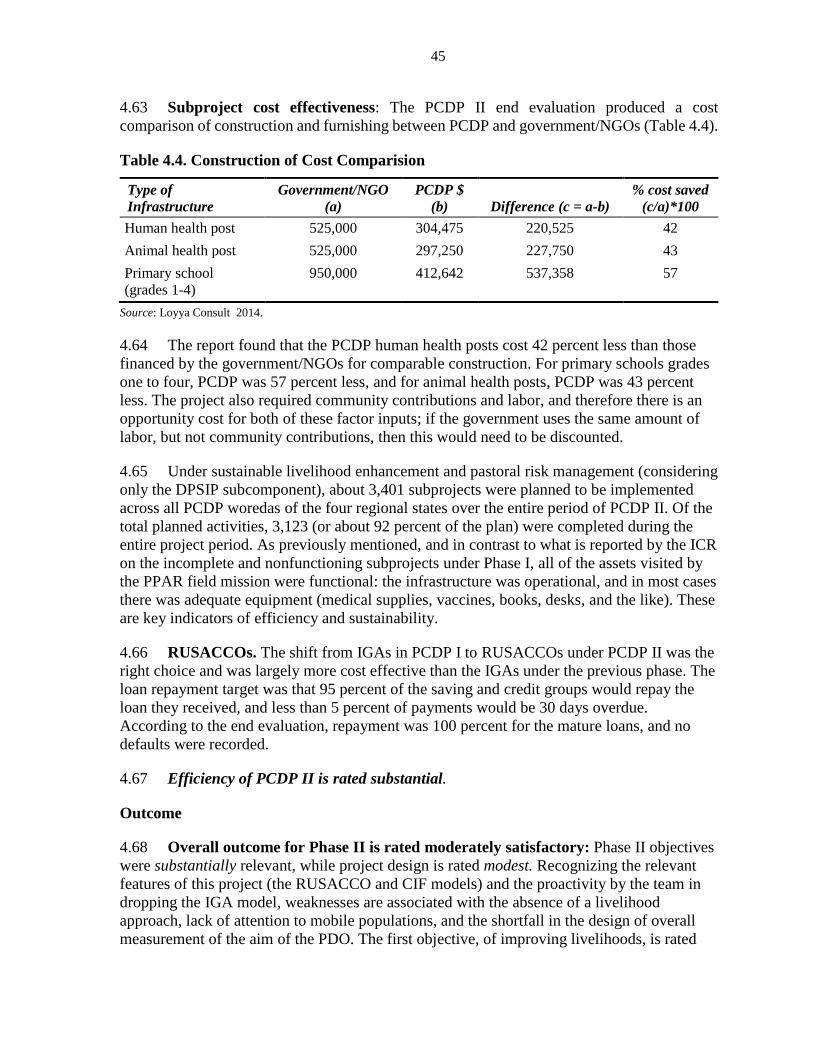
45
4.63 Subproject cost effectiveness: The PCDP II end evaluation produced a cost
comparison of construction and furnishing between PCDP and government/NGOs (Table 4.4).
Table 4.4. Construction of Cost Comparision
Type of
Infrastructure
Government/NGO
(a)
PCDP $
(b) Difference (c = a-b)
% cost saved
(c/a)*100
Human health post 525,000 304,475 220,525 42
Animal health post 525,000 297,250 227,750 43
Primary school
(grades 1-4)
950,000 412,642 537,358 57
Source: Loyya Consult 2014.
4.64 The report found that the PCDP human health posts cost 42 percent less than those
financed by the government/NGOs for comparable construction. For primary schools grades
one to four, PCDP was 57 percent less, and for animal health posts, PCDP was 43 percent
less. The project also required community contributions and labor, and therefore there is an
opportunity cost for both of these factor inputs; if the government uses the same amount of
labor, but not community contributions, then this would need to be discounted.
4.65 Under sustainable livelihood enhancement and pastoral risk management (considering
only the DPSIP subcomponent), about 3,401 subprojects were planned to be implemented
across all PCDP woredas of the four regional states over the entire period of PCDP II. Of the
total planned activities, 3,123 (or about 92 percent of the plan) were completed during the
entire project period. As previously mentioned, and in contrast to what is reported by the ICR
on the incomplete and nonfunctioning subprojects under Phase I, all of the assets visited by
the PPAR field mission were functional: the infrastructure was operational, and in most cases
there was adequate equipment (medical supplies, vaccines, books, desks, and the like). These
are key indicators of efficiency and sustainability.
4.66 RUSACCOs. The shift from IGAs in PCDP I to RUSACCOs under PCDP II was the
right choice and was largely more cost effective than the IGAs under the previous phase. The
loan repayment target was that 95 percent of the saving and credit groups would repay the
loan they received, and less than 5 percent of payments would be 30 days overdue.
According to the end evaluation, repayment was 100 percent for the mature loans, and no
defaults were recorded.
4.67 Efficiency of PCDP II is rated substantial.
Outcome
4.68 Overall outcome for Phase II is rated moderately satisfactory: Phase II objectives
were substantially relevant, while project design is rated modest. Recognizing the relevant
features of this project (the RUSACCO and CIF models) and the proactivity by the team in
dropping the IGA model, weaknesses are associated with the absence of a livelihood
approach, lack of attention to mobile populations, and the shortfall in the design of overall
measurement of the aim of the PDO. The first objective, of improving livelihoods, is rated

46
substantial. The second objective, of increasing resilience, is rated modest. Critical pastoral
risk management activities have been put in place, but there is little evidence of the
effectiveness of the EWS to influence disaster response at the federal level or how each of
the individual investments under this objective contribute to a larger disaster management
agenda. Efficiency is rated substantial. The IEG field visit validated the functioning of the
assets and their potential to generate a sustained rate of return: all assets randomly visited by
IEG and financed under both phases were operational at the time of the IEG mission. This
ratio of functioning assets—sustained over several years—is rare for CDD projects supported
by the Bank. There are also attributable positive returns that can be linked to the RUSACCOs
with regard to savings, the amount of funds leveraged, and the related investments. Other
aspects of the projects, relating to the infrastructure constructed to reduce vulnerability, are
reported to have lower costs compared with state planning. These are all key indicators of
efficiency and sustainability.
Risk to Development Outcomes
Risk to Sustaining the Development Outcomes of PCDP II
4.69 The main risks to development outcomes are related to livelihoods and vulnerability,
both of which are associated with sustainable service delivery and exogenous factors such as
the shocks created by droughts and climate change.
4.70 Risk associated with livelihoods is significant. The responsibility taken by the
communities throughout both project phases, from the selection of investments, to their
implementation, to operations and maintenance, and the requirement of a mandatory
community contribution, provide a reason for optimism about their sustainability. Barring the
aforementioned human and financial resource constraints that may emerge, it is likely that
communities will remain committed to the operation and maintenance of their assets. The
knowledge and experience gained in project management by the communities as a whole has
been immense. Beneficiaries feel that the basic infrastructure and services developed by the
project belong to them and they are ready to protect and maintain them for proper utilization.
Certainly more investments are needed in a resource-constrained environment, but the
broader country focus on local government development through several large national
programs increases the chances of success (of the CDD/CIF activities).
4.71 However, an issue cited by virtually all members of communities visited by the IEG
mission was concern that CIF investments will stop after the completion of PCDP. They
correctly pointed out that while the investments that have been made are certainly useful,
these are just the very basic investments and there is a need for many more follow-up
investments. As an example, while schools provided under PCDP now allow students to
attend up to eighth grade, there is no reasonably accessible place for students to attend high
school. Similarly, an important next step would be to increase water access to more
acceptable standards. Unfortunately, with a highly dispersed population in pastoral areas, the
feasibility of providing the next level of services is unclear, pointing once again to the need
to have a pastoral development strategy going forward.

47
4.72 In Phase II, the established RUSACCOs also demonstrate good potential for
sustainable local-level entrepreneurship and increased household incomes. As previously
mentioned, when IEG asked beneficiaries whether they deplete their savings during a shock
or crisis, all RUSACCO members interviewed indicated that their savings were secure, and
that if they had to tap into their savings stock, they would replenish it as soon as they were
able. However, these groups require continual further monitoring and technical support in
order to scale up their IGAs to increase household incomes, and not stagnate. The substantial
IFAD support for rural finance helps ensure the sustainability and scaling up of the rural
savings/investment cooperatives.
4.73 Risks associated with vulnerability are significant: IEG acknowledges other
intervening factors that may impede or enhance the effects of the project, such as external
shocks (climatic, epidemic, or macroeconomic), interventions from other national projects,
and overall changes in the macro-environment. Weak evidence of effective implementation
of the EWS under the Disaster Risk Management Component of both Phase I and II may
pose a risk to decreasing vulnerability on a sustainable basis.
Risks to Achieving the Overall Programmatic Outcomes
4.74 The programmatic approach over a long term, supported by a series of projects, was
appropriate, given the complexity of the issues and the need for learning and mid-course
correction, but the results framework for each of the projects was not appropriately conceived
to allow this. Indeed, the program seems to have been conceived as a service delivery
program with emphasis on new approaches to service delivery (CDD). It lacked a strong
analytical underpinning at the outset. Triggers for follow-on projects were all related to
physical progress rather than to the program objectives.
4.75 The programmatic design also suffered from lack of a clear and accepted strategy for
the development of pastoral areas. Even if the strategy were to be limited to providing
essential services, in keeping with the thrust of PCDP, the feasibility of reaching the entire
population of scattered and mobile pastoralists with basic services is unclear. The PCDP
series would have provided services to only half of the pastoral population. Moreover, the
level of services that has been provided is still far short of what would be considered as a
basic essential package. The inability, or perhaps unwillingness, of donors, including the
Bank, to ascribe to the government policy of voluntary settlement has hindered the
formulation of a strategy for pastoral development.
4.76 The World Bank–financed Regional Pastoral Livelihoods Resilience Project,
approved in 2014, appears to be a much more appropriate design for resilience and
livelihoods, and it was a step in the right direction to deal with resilience and livelihood
issues of pastoralists. The regional dimension, involving multiple countries, is also
appropriate given the movement of some pastoralists across national boundaries. The Bank
should build on it to move toward helping government develop a strategy that covers all
pastoral areas in the country.
4.77 Risk to development outcome for PCDP II is rated significant.

48
Bank Performance
4.78 Quality at entry for Phase II: The Bank used its experience from the first PCDP to
improve PCDP II. The substantially improved performance of the RUSACCOs as compared
to the IGAs attests to the benefit of an improved design. The design of these cooperatives
addressed a financing gap and featured access to finance for pastoral women. The design of
the project management structure also worked well to ensure effective implementation of
project activities. However, the design of the project's results framework in the PAD—
linking the project's inputs and outputs to outcomes—was inadequate. Most indicators were
inappropriate and needed extensive overhaul during the MTR. The ICR also noted the less
than optimal participation of women in community activities in relation to the community
action plans (measured as 16 percent by the end evaluation). There were also minor
shortcomings in the financial management arrangements because of the reliance on
statements of expenditures, which for a remote project such as PCDP II were cumbersome to
administer (IEG 2015).
4.79 Quality at entry for PCDP II is rated moderately satisfactory.
4.80 Quality of supervision for Phase II. Overall quality of supervision improved from
Phase I to Phase II. Both phases were supervised from the Ethiopia country office at regular
intervals. Supervision and implementation support missions for both phases were conducted
jointly with IFAD and included the participation of technical experts who provided inputs on
critical aspects of this project, including gender, access to land, water and sanitation,
safeguards, financial management, and procurement. The Bank effectively used experience
from PCDP I to improve supervision performance in the second phase. PCDP II supervision
missions were conducted much more regularly. The MTR was comprehensive, and there was
timely follow up on important issues such as the overhaul of the indicators in the results
framework, which led to formal proposals for the project's restructuring. The quality of
project reporting was high. The reports were thorough and closely tracked a very large
number of project activities. The Bank established good working relations with the
government, the federal and regional project coordinating units, and the co-financier (IFAD).
It is also noted that the project team was recognized by the Region (a vice presidential award)
for excellent work in supervising PCDP II. Project documentation shows evidence of active
involvement of Bank safeguards technical staff in supervision missions. This was confirmed
by interviews with relevant country office staff and the PMU. The Bank has also made
considerable efforts to train federal-, regional-, and woreda-level safeguard staff. However,
neither in the MTR nor during the process of recognition for the vice president’s award was
there any discussion on how the project accomplishments were contributing to the overall
APL objectives of sustainable livelihoods and risk reduction.
4.81 Quality of supervision for PCDP II is rated moderately satisfactory.
4.82 The overall rating of Bank Performance in PCDP II is rated moderately satisfactory.
Borrower Performance
4.83 Government performance for Phase II: The situation improved significantly with
PCDP II. Roles of the different agencies were more clearly defined, considerable institutional

49
capacity had been built, and there is evidence that the CDD approach has been internalized
by the government at different levels and is being applied to other programs.10 MoFA
provided satisfactory support to the project on the basis that it was effective in the handling
the project's administration at the central-government level. The ministry also supported the
project's management effectively and facilitated the mobilization of counterpart contributions
at the regional level. One area where the ICR stated that government performance could have
been smoother was in its coordination with the Ministry of Agriculture and Rural
Development and the Early Warning Response Department, because there were occasional
lapses in the disbursement of central government funds to the regions and resulting delays in
implementation (World Bank Group 2014, para. 95).
4.84 Overall, MoFA has provided strong leadership in ensuring good project management
and coordination at the field level, and the project receives full support from the level of the
state minister (as the IEG mission witnessed).
4.85 Government performance for Phase II is rated satisfactory.
4.86 Implementing agency performance for Phase II: The IEG field team was highly
impressed by the staff of the PMU and FPCUs. The Pastoral Standing Committee in the
Ethiopian Parliament (responsible for the supervision of the budget implementation of
special support by the federal government to the pastoralists) considers PCDP as a flagship
program in pastoral areas and would like to see it continue past Phase III.11
4.87 However, there were weaknesses in the project's financial management and
procurement, especially in the earlier years. Capacity constraints at the woreda level (that is
poor record keeping) and the lack of familiarity with guidelines and procedures led to poor
handling of procurement, despite Bank efforts to conduct annual procurement reviews,
trainings, and clinics.12 Financial management was also weak. Inadequate forward financial
planning, insufficient management oversight, and weak accountability systems led to delayed
submission of statements of expenditure (World Bank Group 2014). But improvements were
made under PCDP II. RUSACCOs have received the required supervision and technical
support under the Federal Cooperative Agency, and MoA has managed the Disaster Risk
Component reasonably well, under a Memorandum of Understanding with MoFA. Reporting
was generally of good quality, detailed, and submitted on time.
4.88 Implementing agency performance for Phase II is rated satisfactory.
4.89 The overall rating of borrower performance in PCDP II is rated satisfactory.
5. Lessons
High-level lessons on program strategy and sequencing
10 IEG interview with State Minister of MoFA. 11 IEG interview with the Pastoral Affairs Standing Committee. 12 PPAR mission interviews.
50
Programmatic approaches that involve multiple projects over a long period of time are
more effective when, in addition to assessing project outputs, they measure the extent to
which overall programmatic objectives are being met. There is a need to have a results
framework that specifies not only the short-term objectives of each of the projects in the
series but also how these link to the overall program objectives. M&E systems should track
not only individual project accomplishments but should also be designed to assess the
programmatic objectives, even if these can only be achieved over time.
Triggers for moving forward with successive phases of an adaptable program are more
effective when they take stock of the extent to which the project is meeting its overall
program aims. This stock-taking should promote mid-course correction based on lessons. A
rigorous independent impact assessment conducted after each phase can provide the more
accurate information needed to ensure that the program is well phased.
The Bank can use the body of knowledge gained through its successive project
interventions to help governments develop an informed sector strategy, especially in
difficult and uncertain areas such as pastoral development. While the Bank may choose to
proceed with project support, it is critical that in the absence of a clear approach, Bank
experience be used to support the development of such a strategy through dialogue and
continued engagement.
Project-specific lessons
Support for household or small rural income generating activities is more effective when
based on needs and capacity assessments and supported by business planning, training,
legal and technical assistance, and the supply of affordable finance. Group-executed
activities are complex, because they require strong trust and cooperation among members
who, if the group is formed by the project, require time to build trust. The decision to
support individual versus group economic activity should be based on an understanding of
existing social norms and economic relationships.
Rural savings and credit groups can be successful when there is a strong sense of cohesion
in the community, when they have a predominant focus on women, and when they are
supported with adequate and sustained capacity-building support. Seed capital, and clear
rules of the game, were also found to be key ingredients in helping to ensure the success of
the rural savings and lending groups in Ethiopia.
When dealing with mobile pastoral communities, consideration should be given to
different service provision approaches such as mobile schools and health to supplement
the “classic” participatory local development model, which is better suited to sedentary
populations.

51
Bibliography
EIU (Economist Intelligence Unit). 2015. “Ethiopia Country Report.” London.
country.eiu.com/ethiopia.
Ethiopia, Ministry of Agriculture and Rural Development. 2008. National Guidelines for Livestock
Relief Interventions in Pastoralist Areas of Ethiopia. Addis Ababa
Ethiopia, Ministry of Finance and Economic Development. 2006. “Ethiopia: Building on Progress. A
Plan for Accelerated and Sustained Development to End Poverty (PASDEP), 2005/06–2009/10.”
Volume I: Main Text. Addis Ababa.
http://siteresources.worldbank.org/INTETHIOPIA/Resources/PASDEP_Final_English.pdf.
———. 2010. “Growth and Transformation Plan: 2010/11–2014/15.” Volume I: Main Text. Addis
Ababa.
Ethiopia, Ministry of Federal Affairs. 2008. “Final Report on Assessment of Income Generating
Activities Financed During Phase I of the PCDP.” Addis Ababa.
IEG (Independent Evaluation Group, World Bank Group). “IEG ICR Review, PCDP I.” World Bank,
Washington, DC.
———. 2015. “IEG ICR Review of PCDP II.” 2011. Report ICRR 14742. World Bank,
Washington, DC.
IFAD (International Fund for Agricultural Development). 2008.“Ethiopia—Country Program
Evaluation.” Rome
Loyya Consult. 2014. “Pastoral Community Development Project II—End Term Evaluation.” March
14, 2014, Loyya Consult for the Ministry of Federal Affairs. Addis Ababa.
White, Howard, and Daniel Phillips. 2012. “Addressing Attribution of Cause and Effect in Small
Impact Evaluations: Towards an Integrated Framework.” International Initiative for Impact
Evaluation Working Paper 15. New Delhi.
World Bank Group. 2003. “Project Appraisal Document on a Proposed Grant in the Amount of SDR
22.0 Million (US$30.0 Million equivalent) to the Federal Democratic Republic of Ethiopia for
the Pastoral Community Development Project in Support of the First Phase of the Pastoral
Community Development Program, April 22, 2003.” PAD 25227-ET. World Bank, Washington,
DC.
———. 2008a. “Country Assistance Strategy for the Federal Democratic Republic of Ethiopia, April
2, 2008.” Report 43051. World Bank, Washington, DC.
———. 2008b. Ethiopia Pastoral Community Development Project II Concept Note, January 2008.
———. 2008c. “Financing Agreement, C4458 and H395 Conformed” (PCDP II). Jonathan David
Pavluk, author. World Bank, Washington, DC.
———. 2008d. “Project Appraisal Document on a Proposed Credit in the Amount of SDR 14.2
Million (US$23.4 Million equivalent) and a Proposed Grant in the Amount of SDR 34.4 Million
(US$56.6 Million equivalent) to the Federal Democratic Republic of Ethiopia for a Pastoral
Community Development Project II, May 5, 2008.” Report 43472. World Bank, Washington,
———. 2009b. “Implementation Completion and Results Report, Pastoral Community Development
Project, Phase I, June 26, 2009.” ICR 886. World Bank, Washington, DC.
———. 2011. Pastoral Community Development Project—II, Mid Term Performance Report, Oct.
9/2008—May 8/2011, Ministry of Federal Affairs, May 2011.

52
———. 2012. “Ethiopia—Country Partnership Strategy.” Report 71884. World Bank, Washington,
DC.
———. 2013. “Project Appraisal Document on a Proposed Credit in the Amount of SDR 71.8
Million (US$110 Million equivalent) to the Federal Democratic Republic of Ethiopia for a
Pastoral Community Development Project III, November 15, 2013.” PAD 568. World Bank,
Washington, DC.
———. 2014. “Implementation Completion and Results Report, Pastoral Community Development
Project, Phase II, October 20, 2014.” ICR 3064. World Bank, Washington, DC.
———.2015. Ethiopia Systematic Country Diagnostic (SCD), Concept Note, May 11, 2015.
———. Various years a. Aide-Memoires and Supervision Reports from the operations portal. World
Bank, Washington, DC.
Various years b. http://data.worldbank.org/data-catalog/world-development-indicators
———. “Grant Agreement for PCDP I.” Washington, DC.
USAID (U.S. Agency for International Development. 2003. Risk and Vulnerability in Ethiopia:
Learning from the Past, Responding to the Present, Preparing for the Future. Sue Lautze, Yacob
Aklilu, Angela Raven-Roberts, Helen Young, Girma Kebede, and Jennifer Leaning, authors.
Washington, DC: USAID.
Yilmaz, Serdar, and, Varsha Venugopal. 2008. “Local Government Discretion and Accountability in
Ethiopia.” International Studies Program Working Paper 08-38. Atlanta, GA, Andrew Young
School of Policy Studies, Georgia State University.

53
Annex A: Basic Data Sheet for Ethiopia Pastoral
Community Development Project Phase I
Key Project Data (amounts in US$ million)
Appraisal
Estimate
Actual or
current estimate
Actual as % of
appraisal estimate
Total project costs 60.0 59.6 99.33
Loan amount 30.0 31.9 106.33
Co-financing 20.0 21.1 105.5
Cumulative Estimated and Actual Disbursements
FY04 FY05 FY06 FY07 FY08
Appraisal estimate (US$M) 3.0 7.0 13.0 21.0 30.00
Actual (US$M) 2.63 8.16 22.26 30.98 31.70
Actual as % of appraisal 87.6 116.5 171.2 147.5 105.6
Date of final disbursement: 12/24/2008
Project Dates for the Ethiopia Pastoral Community Development Project Phase I
Original Actual
Initiating memorandum 11/06/2001 04/16/2002
Negotiations 03/17/2003 03/26/2003
Board approval 02/06/2003 05/20/2003
Signing 06/12/2003
Effectiveness 09/30/2003 09/30/2003
Closing date 12/31/2008 12/31/2008

54
Staff Time and Cost
Stage of project cycle Staff time and cost (Bank budget only)
Lending Number of staff weeks
US$ thousands (including
travel and consultant’s costs)
FY02 18.93 73.45
FY03 40.44 147.70
Total: 59.37 221.15
Supervision/ICR
FY04 30.89 69.84
FY05 35.76 39.30
FY06 36.60 81.55
FY07 39.81 81.35
FY08 39.40 131.42
FY09 47.55 167.97
Total: 230.01 571.43
Task Team Members
Name Title Unit
Lending
Daniel Sellen Task Team Leader (TTL), Appraisal AFTR2
Assaye Legesse Sr. Agr. Economist, TTL (2003 on) AFTR1
Christine Cornelius Program Coordinator AFTR1
Joseph Toledano Agri. Services Specialist AFTR1
Rahel Lulu Team Assistant AFTAR
Graeme Donovan Agricultural Economist AFTR1
Robin Mearns Peer reviewer EASRD
Tjaar Schillhorn Peer reviewer ECSSD
Cees De Haan Peer reviewer ARD
Solange Alliali Country Lawyer LEGAF
Samuel Haile Selassie Sr. Procurement Specialist AFC06
Eshetu Yimer Financial Management Specialist AFC06
Steve Gaginis Disbursement Officer LOAG2
Tesfalem Gebreiyesus Procurement Specialist AFTPC
Supervision/ICR
Assaye Legesse Sr. Agri. Economist,
TTL, 2003-10/06 and Dec. 2008
AFTAR
Azeb Fissha Consultant AFTAR

55
Name Title Unit
Abiy Admassu
Temechew
Procurement Analyst AFTPC
Basma Ammari E T Consultant AFTRL
Christine E. Cornelius Program Coordinator AFTAR
Edeltraut Gilgan-Hunt Environmental Specialist AFTEN
Eshetu Yimer Sr. Financial Management Specialist AFTFM
Eyerusalem Fasika Research Analyst AFTP2
Garry A. Smith Consultant ECSSD
Ingo Wiederhofer Sr. Operations Officer,
TTL 10/06-11/2008
EASSO
Ingrid Pierre Mollard Consultant AFTAR
J. R. Deep Ford Sr. Economist FAO
Jean Charles Amon Kra Sr Financial Management Specialist AFTFM
Malathi Jayawickrama Operations Officer (ICR, TTL) AFTAR
Mulat Negash Tegegn Consultant AFTFM
Rahel Lulu Program Assistant AFCE3
Richard Olowo Sr Procurement Spec. AFTPC
Samik Sundar Das Senior Rural Development Specialist SASDA
Serigne Omar Fye Consultant AFTH1
Samuel Haile Selassie Sr. Procurement Spec EAPCO
Sarah G. Michael Social Development Spec. AFTCS
Tafesse Freminatos
Abrham
Financial Management Specialist AFTFM
Tesfaye Bekalu Wondem E T Consultant AFTU1
Wendy Schreiber Ayres Consultant AFTFP

56
Annex B: Basic Data Sheet for the Ethiopia Pastoral
Community Development Project Phase II
Key Project Data (amounts in US$ million)
Appraisal
estimate
Actual or
current estimate
Actual as % of
appraisal estimate
Total project costs 133.25 119.74 89.86
Loan amount 80.00 74.52 93.15
Co-financing 33.54 37.35 111.3
Cumulative Estimated and Actual Disbursements
FY09 FY10 FY11 FY12 FY13 FY14 FY15
Appraisal estimate (US$M) 16.0 32.0 48.0 64.0 80.0 80.0 80.0
Actual (US$M) 10 18.8 36.9 50.36 61.8 74.5 74.3
Actual as % of appraisal 62.5 58.75 76.87 78.6 77.25 93.12 92.87
Date of final disbursement: 5/20/2014
Project Dates for the Ethiopia Pastoral Community Development Project Phase II
Original Actual
Initiating memorandum 10/18/2007 01/28/2008
Negotiations 03/04/2008 04/21/2008
Board approval 04/29/2008 05/29/2008
Signing 06/30/2008 06/13/2008
Effectiveness 10/09/2008 10/09/2008
Closing date 12/31/2013 12/31/2013
Staff Time and Cost
Stage of project cycle Staff time and cost (Bank budget only)
Lending Number of staff weeks
US$ thousands (including
travel and consultant costs)
FY08 20.3 172.38
Total: 20.3 172.38
Supervision/ICR
FY09 29.2 53,498.02
FY10 45.9 55,030.91
FY11 52.7 141,027.62
FY12 15.2 74,994.27
FY13 14.3 85,840.65
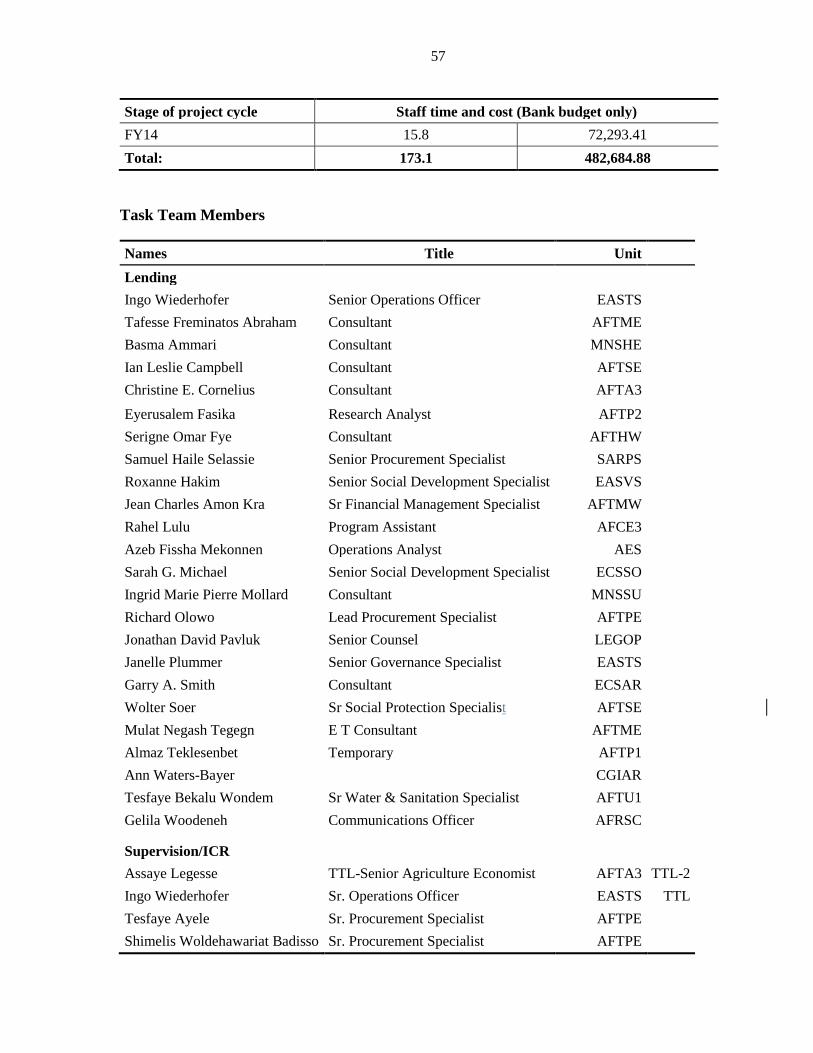
57
Stage of project cycle Staff time and cost (Bank budget only)
FY14 15.8 72,293.41
Total: 173.1 482,684.88
Task Team Members
Names Title Unit
Lending
Ingo Wiederhofer Senior Operations Officer EASTS
Tafesse Freminatos Abraham Consultant AFTME
Basma Ammari Consultant MNSHE
Ian Leslie Campbell Consultant AFTSE
Christine E. Cornelius Consultant AFTA3
Eyerusalem Fasika Research Analyst AFTP2
Serigne Omar Fye Consultant AFTHW
Samuel Haile Selassie Senior Procurement Specialist SARPS
Roxanne Hakim Senior Social Development Specialist EASVS
Jean Charles Amon Kra Sr Financial Management Specialist AFTMW
Rahel Lulu Program Assistant AFCE3
Azeb Fissha Mekonnen Operations Analyst AES
Sarah G. Michael Senior Social Development Specialist ECSSO
Ingrid Marie Pierre Mollard Consultant MNSSU
Richard Olowo Lead Procurement Specialist AFTPE
Jonathan David Pavluk Senior Counsel LEGOP
Janelle Plummer Senior Governance Specialist EASTS
Garry A. Smith Consultant ECSAR
Wolter Soer Sr Social Protection Specialist AFTSE
Mulat Negash Tegegn E T Consultant AFTME
Almaz Teklesenbet Temporary AFTP1
Ann Waters-Bayer CGIAR
Tesfaye Bekalu Wondem Sr Water & Sanitation Specialist AFTU1
Gelila Woodeneh Communications Officer AFRSC
Supervision/ICR
Assaye Legesse TTL-Senior Agriculture Economist AFTA3 TTL-2
Ingo Wiederhofer Sr. Operations Officer EASTS TTL
Tesfaye Ayele Sr. Procurement Specialist AFTPE
Shimelis Woldehawariat Badisso Sr. Procurement Specialist AFTPE

58
Names Title Unit
Edward Felix Dwumfour Sr. Environmental Specialist AFTN3
Eyerusalem Fasika Research Analyst AFTP2
Mohamed Osman Hussein E T Consultant AFTA3
Tesfahiwot Dillnessa Team Assistant AFCE3
Azeb Fissha Mekonnen Operations Analyst AES
Esayas Nigatu Consultant AFTA1
Yasmin Tayyab Senior Social Development Specialist AFTCS
Meron Tadesse Techane Financial Management Specialist AFTME
Richard Carroll Sr. Evaluation Specialist AFTA3
59
Annex C: Survey Data Sources on Income, Poverty, and
Welfare in Ethiopia
As a first step in conducting the PCDP (I and II) Project Performance Assessment, IEG
worked with MMA, a local consulting firm in Addis, to determine whether relevant data
existed to support an assessment of the contribution of the projects to their stated objectives
of (1) reducing vulnerability and (2) enhancing pastoral livelihoods over the project period
(2003–13). Data were sought outside the project’s reporting framework, since the data
collected by the project was limited to output indicators (number of schools built, number of
wells functioning, and the like). IEG and MMA utilized data collected by the Central
Statistics Authority and the Ministry of Finance and Economic Development, the two
government bodies responsible for undertaking periodic nationwide income, poverty, and
welfare surveys. A summary of the data sources examined and their relevance for assessing
the contribution of the project toward its stated objectives is included below.
Overall, IEG found that there is a lack of systematic and comparable data being collected to
understand the change in welfare over time of Ethiopia’s pastoral communities. IEG found
that available data sources have excluded nonsedentary areas. IEG also found that the data
collected on welfare over time were made available at the regional—not the woreda (district)
or kebele (village association)—level, so it could not support an assessment of the project’s
relative contribution to reducing vulnerability or enhancing livelihoods over time.
Data Sources, Methodological Constraints, and Overall Findings
Household income, consumption, and expenditure (HICE). The Central Statistical
Agency designs and undertakes surveys of household income, consumption, and expenditure
(HICE) every five years. The HICE overlaps with the project period. IEG was able to obtain
data from the 1995/1996, 1999/2000, 2004/2005, and the 2010/2011 surveys. The surveys
provide a snapshot of the change in poverty headcount—at the regional level—for points in
time that correspond to the project periods (Table C.1). In analyzing the data, IEG found that
it is only partially relevant for developing an understanding of the welfare of Ethiopia’s
pastoral populations, since the data collected for the Afar and Somali regions do not include
the pastoral (nonsedentary) areas, and the pastoral woredas in Oromia and SNNP are few in
number and the data IEG was able to obtain are not disaggregated at the woreda level. (In the
Oromiya region, there are 33 pastoral and agro-pastoral woredas of a total 265 woredas; in
the SNNP region, there are 12 pastoral and agro-pastoral woredas of a total of 135 woredas).
Nevertheless, the data are able to demonstrate that while overall poverty has declined, rural
poverty in Somali has not declined over the past 20 years, and has decreased only slightly in
Oromia over the same period. Rural poverty in Afar has declined by 10 percent since 1995,
but Afar remained the poorest region as of 2010/2011, with some 36 percent of the
population living in poverty, as recorded by the 2010/2011 survey.

60
Table C.1: Regional Poverty Trends in Ethiopia
1995/96 1999/00 2004/05 2010/11
Region Rural Urban Total Rural Urban Total Rural Urban Total Rural Urban Total
Tigray 0.579 0.457 0.561 0.616 0.607 0.614 0.51 0.367 0.485 0.365 0.137 0.318
Afar 0.518 - 0.331 0.68 0.268 0.56 0.429 0.279 0.366 0.411 0.237 0.361
Amhara 0.567 0.373 0.543 0.429 0.311 0.418 0.404 0.378 0.401 0.307 0.292 0.305
Oromia 0.347 0.276 0.34 0.404 0.359 0.399 0.372 0.346 0.37 0.293 0.248 0.287
Somale 0.346 - 0.309 0.441 0.261 0.379 0.452 0.353 0.419 0.351 0.231 0.328
B.B.G 0.476 0.345 0.468 0.558 0.289 0.54 0.458 0.345 0.445 0.301 0.213 0.289
SNNP 0.565 0.459 0.558 0.517 0.402 0.509 0.382 0.383 0.382 0.3 0.258 0.296
Gamb 0.418 0.244 0.343 0.546 0.384 0.505 n.a. n.a. n.a. 0.325 0.307 0.32
Harari 0.133 0.291 0.22 0.149 0.35 0.258 0.206 0.326 0.27 0.105 0.117 0.111
AA 0.404 0.3 0.302 0.271 0.362 0.361 0.299 0.326 0.325 ... 0.281 0.281
DD 0.366 0.246 0.295 0.332 0.331 0.331 0.398 0.329 0.352 0.142 0.349 0.283
Total 0.475 0.332 0.455 0.454 0.369 0.442 0.393 0.351 0.387 0.304 0.257 0.296
Source: HICE surveys of 1995/96, 1999/00, 2004/05, and 2010/11.
Note: n.a. = not available.
Regional comparisons of food poverty tell a different story, but because of the data
collection limitations mentioned above, analysis of pastoral welfare using this metric is also
limited.
Table C.2: Regional Food Poverty Trends
1995/96 1999/00 2004/05 2010/11
Region Rural Urban Total Rural Urban Total Rural Urban Total Rural Urban Total
Tigray 0.675 0.501 0.649 0.517 0.647 0.537 0.48 0.412 0.468 0.402 0.249 0.371
Afar 0.521 0 0.333 0.635 0.289 0.534 0.436 0.331 0.392 0.339 0.281 0.322
Amhara 0.607 0.343 0.574 0.323 0.354 0.325 0.391 0.361 0.388 0.446 0.28 0.425
Oromia 0.427 0.345 0.419 0.367 0.491 0.38 0.371 0.352 0.369 0.333 0.317 0.331
Somale 0.432 0 0.384 0.469 0.342 0.425 0.439 0.346 0.409 0.289 0.171 0.267
B.G 0.612 0.271 0.592 0.562 0.409 0.552 0.459 0.334 0.444 0.365 0.261 0.351
SNNP 0.521 0.463 0.517 0.548 0.541 0.547 0.369 0.379 0.37 0.258 0.271 0.259
Gambela 0.329 0.192 0.283 0.618 0.433 0.572 n.a. n.a. n.a. 0.24 0.302 0.26
Harari 0.163 0.28 0.227 0.155 0.477 0.328 0.184 0.308 0.251 0.043 0.049 0.046
AA 0.387 0.365 0.366 0.359 0.478 0.475 0.316 0.324 0.324 ... 0.261 0.261
DD 0.308 0.38 0.351 0.253 0.285 0.276 0.384 0.326 0.345 0.137 0.254 0.217
Total 0.516 0.365 0.495 0.411 0.467 0.419 0.385 0.353 0.38 0.347 0.279 0.336
Source: HICE survey of 1995/96, 1999/00, 2004/05, and 2010/11.
Note: n.a. = not available.

61
A third metric demonstrates average caloric consumption patterns at the regional level over
time. Here again, analysis of pastoral welfare using this metric is limited since the sources of
calories are highland based, while the pastoral regions have livestock products as sources of
calories, but not categorized in the percentage distributions. Overall, the HICE shows that since
1999/2000, daily per capita gross calorie levels have increased by 11 percent. The majority of
this growth comes from urban areas, which have grown about 34.5 percent since 1999/2000.
Rural calorie levels have also increased, but at a lesser rate (8.2 percent since 1999/2000). The
Afar and Somali regions are among the lowest in daily calorie intake, 2,364 and 2,330 calories,
respectively, which is explained by the fact that their calorie intake is mainly from livestock
products and not from cereals. By 2010/11, daily calorie intake per capita was the highest in
SNNP (2,788).
Table C.3: Regional Daily per Capita Intake Over Time
1999/2000 2004/05 2010/11 Region Gross calories Gross calories Gross calories Net calories All Rural Urban All Rural Urban All Rural Urban All Rural Urban
Tigray 2,045 2,124 1,646 Afar 1,743 1,617 2,337 Amhara 2,155 2,197 1,801
Oromia 2,257 2,344 1,588 Somalia 1,960 2,002 1,869
Benshangul- 2,245 2,273 1,911 Gumuz
SNNP 2,359 2,401 1,821 Gambela 2,177 2,285 1,809
Harari 1,967 2,304 1,730 Addis Abeba 1,829 2,117 1,824 Dire Dawa 1,876 2,198 1,761 Total 2,211 2,292 1,738
2,093 2,116 1,987 1,873 1,861 1,890 ,2058 2,067 1,966 2,440 2,470 2,173 2,205 2,196 2,225 2,099 2,113 1,993
2,728 2,770 2,272 N/A N/A N/A
2,247 2,586 1,955 1,989 2,369 1,984 1,990 2,255 1,861 2,353 2,397 2,073
2,340 2,333 2,370 2,364 2,352 2,392 1,995 2,176 2,332 2,475 2,501 2,307 2,330 2,342 2,277 2,573 2,572 2,578
2,288 2,814 2,567 2,660 2,824 2,310 2,515 2,739 2,267 2,237 N/A 2,237 2,363 2,649 2,227 2,455 2,479 2,337
2,302 2,294 2,330 2,318 2,303 2,357 2,145 2,124 2,293 2,406 2,429 2,252 2,298 2,311 2,241 2,487 2,485 2,498
2,654 2,676 2,463 2,524 2,663 2,228 2,478 2,709 2,222 2,195 N/A 2,195 2,322 2,612 2,185 2,380 2,400 2,283
Note: n.a. = not available.
Regional Finance and Economic Development Bureaus. The bureaus undertake
socioeconomic and other surveys in their respective regions. However, the surveys often lack
comprehensiveness and quality in looking at the poverty levels, income, and welfare of
households. The socioeconomic baseline survey report conducted by the Afar Bureau in
2009/10 was conducted with the participation of five sector bureaus in the region. The survey
covered all woredas in the region and data were presented by woreda for the following
sectors: economic activities; demographic characteristics; food availability and access;
education; water, sanitation, and hygiene; and access to public utilities and infrastructure
(grazing reserves, water, animal health, and the like).
The Ethiopian Socioeconomic Survey was implemented in collaboration with the Word
Bank Living Standards Measurement Study team as part of the Integrated Surveys on
Agriculture Program. The survey is a nationally representative look at 5,500 households in
rural and urban areas. The first wave was implemented in 2011–12, and the second wave in
2013–14. The results are disaggregated by location: region and place of residence, including
rural areas, small towns, and large towns.

62
Well-being and ill-being dynamics in Ethiopia. The University of Oxford and Mokoro
LTD (a consulting firm) have been conducting socioeconomic panel surveys in 15
communities, including 2 agro-pastoral communities in Oromiya, since 1994. The surveys
have been financed by different donors, including the World Bank, the U.K. Department for
International Development, and the Dutch Embassy, among others. The surveys have found
that modernization efforts have resulted in improved economic prospects, changes in
lifestyle, increased service provision, and improved equality. Both drought-prone and
growth-potential communities have seen economic growth driven predominantly by
improved agricultural productivity.
Data Quality
In the past, surveys have often been biased toward accessible woredas/kebeles. But in the
last few years, the situation has begun to change. There is increased attention to
representativeness, partly because the regions are asking for this, but also because the road
systems have improved and communication technology has made remote areas more
accessible. This is true for data collected in the PCDP and other similar programs in pastoral
regions, pastoral and agro-pastoral areas, where remote and non-remote woredas are
covered—the advantage is that the pastoral areas are flat and accessible by road.

63
Annex D: Methodology for the PPAR Fieldwork: Unit of
Analysis, Sampling Frame, Scope, and Tools
This project performance assessment seeks to validate the relevance, efficiency, and
effectiveness of the reported results of the Pastoral Community Development Project (Phases
I and II) in Ethiopia. In order to gauge the effectiveness, sustainability, and relevance of
design, IEG employed several assessment tools to validate project results, including a
community infrastructure asset verification tool, focus group discussions across different
stakeholder groups, site visits, focus groups, and semi-structured groups and one-on-one
interviews.
Sampling Frame/Unit of Analysis
Woreda and Kebele Selection. The unit of analysis is the woreda, because this was the
targeted administrative unit. PCDP Phase I directly treated 32 of Ethiopia’s 670 rural
woredas in the Afar, Somali, SNNPR, and Oromia regions. Project documentation indicates
that Phase II treated the 32 Phase I woredas and an additional 23 woredas in the same
regions, for a total of 55 woredas. IEG selected a sample of woredas for field visits based on
the following criteria:
1. IEG eliminated all woredas where the mission was not permitted to travel based on
security concerns. According to the World Bank/UN Security Report, all areas deemed a
level 4 (substantial) security level were eliminated. These include 10 woredas in the
Somali region in the following zones: Doolo, Korahe, Jarar, Shaballe, and Nogob.
2. IEG did not visit the five woredas treated in SNNPR, owing to the low level of project
financing in these areas and logistics constraints.
3. IEG learned that nine woredas were dropped at the MTR of Phase II, reportedly for either
poor performance or because they graduated out of the project; one of these woredas
(Afambo) was visited to understand why the project was not successful; the remaining
eight were dropped from the sample.
4. Both Phase I and Phase II woredas were sampled. IEG sampled equally across regions,
although more of the project activities took place in the Somali region. The mission was
unable to visit more woredas in Somali because of the security constraints mentioned
above.
5. Woredas were selected by livelihood system (sedentary, agro-pastoral, and pastoral) and
remoteness to ensure broad coverage of livelihood systems and inclusion of both
relatively remote and distant woredas.

64
Project coverage
Sample for IEG fieldwork PCDP I PCDP II
32 woredas/1,357 MPs
Somali: 14 (43%)
Afar: 9 (28%)
Oromia: 6 (19%)
SNNPR: 2 (6%)
Amhara: 1 (3%)
55 woredas/ (2,556 MPs13)
Somali: 21 (38%)
Afar: 14 (25%)
Oromia: 14 (25%)
SNNPR: 6 (11%)
9 woredas
Somali: 3
Afar: 3
Oromia: 3
SNNPR: 0
Kebeles were selected randomly after eliminating those that were very far from the woreda
capital and difficult to reach within the time constraints of the field mission. It is
acknowledged that this may lead to some overestimation of project effects, as the kebeles
that are easier to reach potentially received more support from the MSTs.
Table D1: Sample Composition of Woredas by Livelihood Classification and Remoteness
and Project Phases
Woreda Kebele(s)
Somali
Erer (not remote, pastoral, Phase II) Hurso, German
Shinile (not remote, pastoral, PhasesI & II) Godley, Baraq
Jijiga (not remote, sedentary, Phases I & II) Harew
Oromia
Seweyna (remote, pastoral/agro-pastoral, Phases I & II) Adeele
Meda Welabu (remote, agro-pastoral, Phase II) Karju, Hora Kore
Mieso (not remote, Phase II) Hargiti, Kenterii
Afar
Dubti (not remote, pastoral/sedentary, Phases I & II) Magenta, Gumerdale
Chiafra (remote, pastoral/agro-pastoral) Gergera, Daru
Afambo (remote, agro-pastoral/pastoral) Mego
Evaluation Tools
Structured Interviews were convened in 9 woredas (13 kebeles) to triangulate perceptions
within and between key stakeholder groups, including: Woreda Development Councils,
Kebele Development Councils, and direct project beneficiaries (community members not
involved in community leadership). See Annex E for the semi-structured interview tool. IEG
met with 52 members of Woreda Development Councils, 137 members of Kebele
Development Councils, 105 direct project beneficiaries (39 men, 66 women), and 34
members of rural savings and credit cooperatives.
13 Figure represents completed MPs reported in end line evaluation.

65
The purpose of these structured interviews was to understand perceptions held by different
project stakeholders on the following topics: level of community participation in selection of
project infrastructure; experience with a newly introduced local development planning
process (CDD); community contributions (in-cash/in-kind) to project infrastructure; impact
of the project on service delivery; value added of project support for the EWS; and impacts
of the project (specifically RUSACCOs) on income generation.
The IEG team also conducted interviews with MST members (project staff) and the Regional
Project Management Unit in each region visited.
CIF site visits were conducted to learn lessons about the contribution of the collective assets
to community welfare in randomly chosen kebeles. A nonrepresentative sample, this
component was implemented as a learning protocol to better understand issues pertaining to
the access and durability and operations and maintenance of assets provided under Phase I
and II (with a focus on kebeles that were treated twice). (See Annex F.)
Limitations
The evaluation team was unable to cover areas where there were security concerns. This
may lead to an overestimation of project impact, because it is possible that these areas were
also more challenging to manage during project implementation (however, project staff in
these areas indicated they were able to work safely).
Because of the size of the project area, the amount of travel time required, and the limited
timeframe of the evaluation mission, the most remote areas were not covered by the
evaluation. Again, this may lead to an overestimation of project impacts, since one of the
challenges during implementation was getting project support to remote areas.

66
Annex E: Semi-Structured Interview Tool
Semi-Structured Interview Tool—Woreda Development Council
Ethics Statement: All interviewees were informed of the role of IEG, and that this work
related to an objectives-based evaluation of two phases of PCDP. The evaluation approach
was described, and participants were informed that stakeholders at multiple levels were being
interviewed and information was therefore being triangulated. Interviewees were also
informed that nothing that they said would be directly attributed to them – anonymity would
be maintained. Participants were also informed how to access the report once it is finalized.
Community Infrastructure Selection and Maintenance
1. How did you decide which kebeles would get the project? How did you decide which
infrastructure items would be constructed in each kebele?
a. How did you manage to avoid resource duplication? For example, if there are
NGOs or other development partners doing similar work.
2. Did you have any transparency/accountability measures under PCDP? Do you still
use them?
3. How much did communities contribute to the CIF projects? Any issues with
community contributions?
4. How are these facilities maintained? Who provides staffing and costing for operation
and maintenance?
Community-Driven/Participatory Development Approach
1. How has PCDP affected service delivery in this woreda? Did PCDP have any
influence/change?
a. Have there been any spillover effects in terms of changing the way the
woredas work with other development partners?
b. Have there been any spillover effects in terms of how they utilize financing
from the government for service delivery?
2. How did you plan and implement government projects prior to PCDP?
How was PCDP similar and different?
3. What were the challenges you faced in implementing PCDP?
4. Did they receive training? (Do they feel they received adequate training in order to
successfully implement PCDP?) (Record specific training information)
5. What would be needed to enhance capacity building for woredas? What could we
have done better?
6. (If not previously mentioned) How did PCDP empower communities?

67
Early Warning System
7. Can you give us an overview of the EWS system— how does the information travel?
How many disaster-reduction systems are in the woreda?
8. Have you received training on how to collect and compile data for the EWS?
9. Was the information you received useful? If so, how does it prepare you to support
kebeles during difficult times?
Semi-Structured Interview Tool—Kebele Development Council
Ethics Statement: All interviewees were informed of the role of IEG, and that this work is
related to an objectives-based evaluation of two phases of PCDP. The evaluation approach
was described, participants were informed that stakeholders at multiple levels were being
interviewed, and that information was therefore being triangulated. Interviewees were also
informed that nothing that they said would be directly attributed to them—anonymity will be
maintained. Participants were also informed how to access the report once it is finalized.
*Record basic data/info on kebele, including livelihood system*
Community Infrastructure Selection and Maintenance
1. What was your experience with PCDP? (Probe on the application and decision-
making process if needed).
2. Were you able to contribute the required amount to the projects (both in kind and
in cash)?
3. Who maintains the infrastructure? Any issues with staffing or supplies?
Community-Driven/Participatory Development Approach
1. What has been the main impact of PCDP? (Probe for whether the service delivery
process has changed.)
2. Have there been any spillover effects in terms of changing the way the kebeles work
with other development partners?
3. Have there been any spillover effects in terms of how they utilize financing from the
government for service delivery?
4. How did you plan and implement government projects prior to PCDP?
5. How was PCDP similar and different?
6. What were the challenges you faced in implementing PCDP?
7. Did they receive training; if so, was it adequate?
8. What would be needed to enhance capacity building at the kebele level?
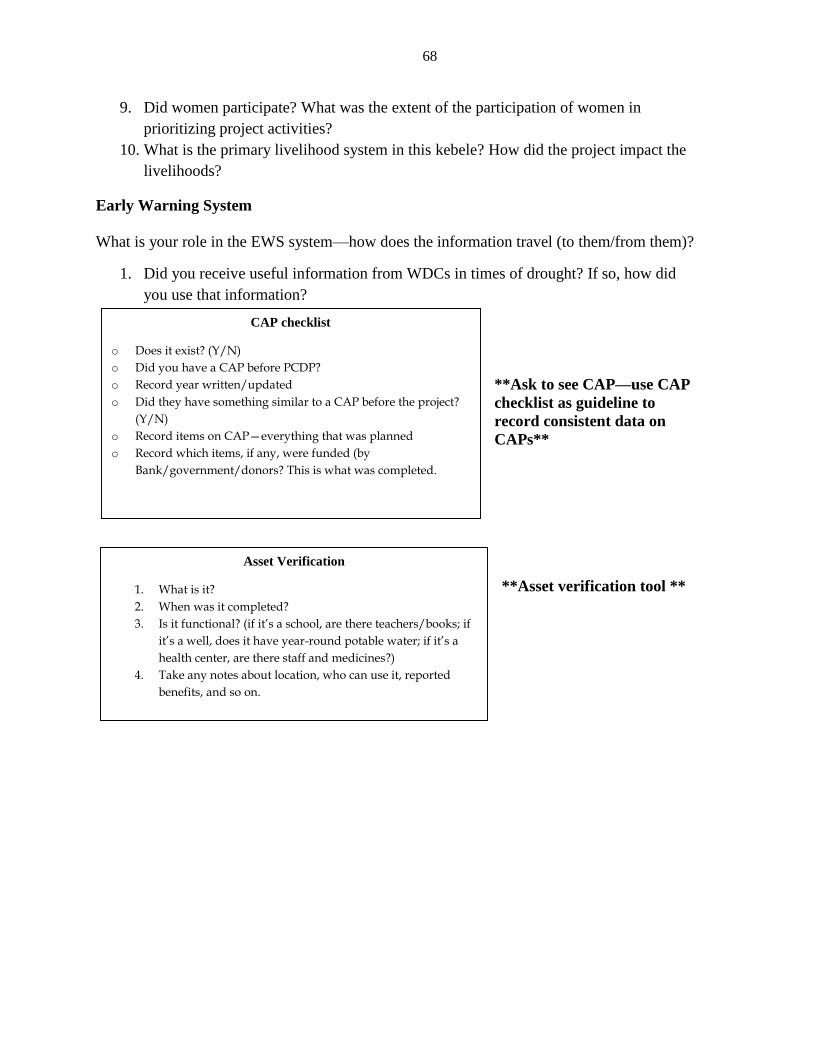
68
9. Did women participate? What was the extent of the participation of women in
prioritizing project activities?
10. What is the primary livelihood system in this kebele? How did the project impact the
livelihoods?
Early Warning System
What is your role in the EWS system—how does the information travel (to them/from them)?
1. Did you receive useful information from WDCs in times of drought? If so, how did
you use that information?
**Ask to see CAP—use CAP
checklist as guideline to
record consistent data on
CAPs**
**Asset verification tool **
Asset Verification
1. What is it?
2. When was it completed?
3. Is it functional? (if it’s a school, are there teachers/books; if
it’s a well, does it have year-round potable water; if it’s a
health center, are there staff and medicines?)
4. Take any notes about location, who can use it, reported
benefits, and so on.
CAP checklist
o Does it exist? (Y/N)
o Did you have a CAP before PCDP?
o Record year written/updated
o Did they have something similar to a CAP before the project?
(Y/N)
o Record items on CAP—everything that was planned
o Record which items, if any, were funded (by
Bank/government/donors? This is what was completed.

69
Semi-Structured Interview—Direct Beneficiaries (Non–Kebele Development Council)
Preface: All interviewees were informed of the role of IEG, and that this work is related to
an objectives-based evaluation of two phases of PCDP. The evaluation approach was
described, participants were informed that stakeholders at multiple levels were being
interviewed, and that information was therefore being triangulated. Interviewees were also
informed that nothing that they said would be directly attributed to them—anonymity will be
maintained. Participants were also informed how to access the report once it is finalized.
Community Infrastructure Selection
1. Did they participate in creating the CAP (if relevant?)
2. Did they ask for the CIF asset (if relevant)?
3. How has this asset (name asset) helped? Record responses individually.
CDD
Do they know PCDP? (Y/N)
1. Did they attend community meetings prior to PCDP? (Y/N) Did they attend meetings
for PCDP? (Y/N) (Were there community meetings arranged?)
2. Did PCDP impact how village development decisions are made? (Y/N) If so, how?
EWS
1. Did you participate in training related to EWS?
IMPACT
1. Has there been any change in livelihoods or income? If so, what do you attribute it
to? RUSACCO/CIF
Semi-Structured Interview—RUSACCOs
Preface: All interviewees were informed of the role of IEG, and that this work is related to
an objectives-based evaluation of two phases of PCDP. The evaluation approach was
described, participants were informed that stakeholders at multiple levels were being
interviewed, and that information was therefore being triangulated. Interviewees were also
informed that nothing that they said would be directly attributed to them—anonymity will be
maintained. Participants were also informed how to access the report once it is finalized.
Group Formation
1. When was the group formed?
2. How many members? Has this changed over time?
3. How often does the group meet?
4. How is the group leader selected?
5. What are group membership requirements?

70
Savings and Lending
1. What was the total savings of the group at the start? What is the current total savings
of the group?
2. Does the group lend to each other? Rates?
3. What happens if someone cannot repay?
4. Do you have access to commercial banks? If so, what are the rates?
5. Is anyone borrowing from other sources?
Impact
1. Did you receive training under RUSACCO?
2. What do they borrow for?
3. Do they deplete their savings during droughts or other crises?
4. Have there been any other impacts of participation in RUSACCOs?
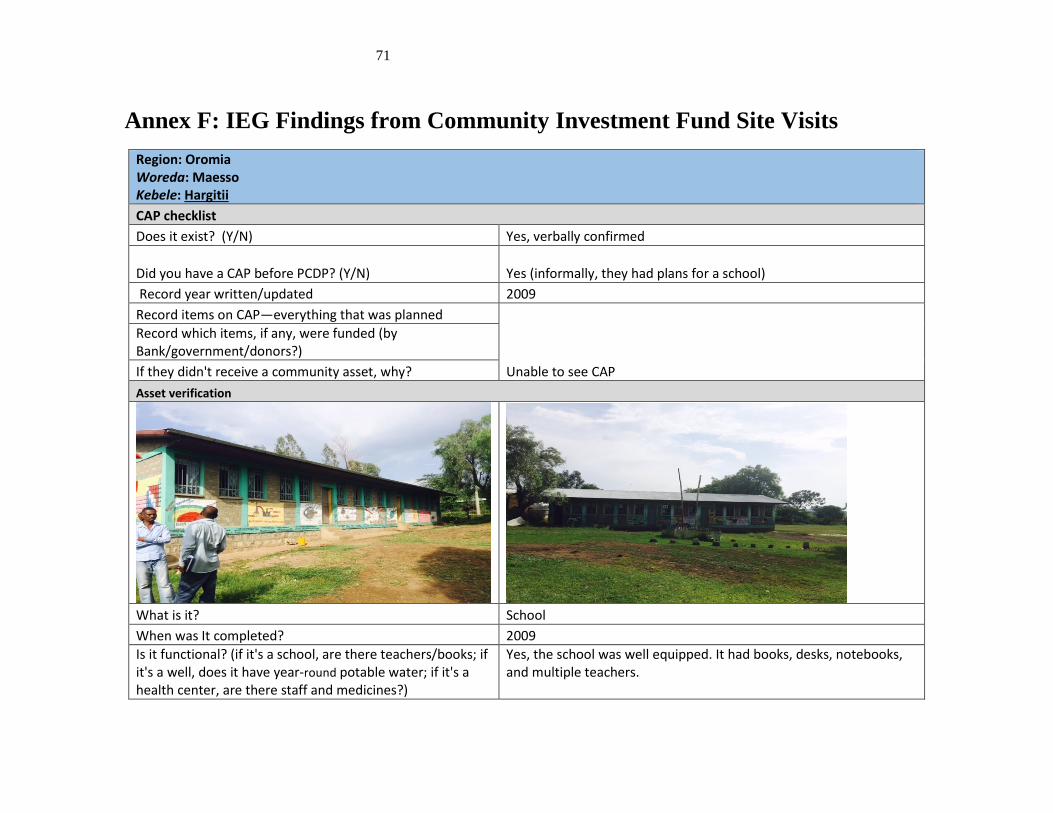
71
Annex F: IEG Findings from Community Investment Fund Site Visits
Region: Oromia Woreda: Maesso Kebele: Hargitii
CAP checklist
Does it exist? (Y/N) Yes, verbally confirmed
Did you have a CAP before PCDP? (Y/N) Yes (informally, they had plans for a school)
Record year written/updated 2009
Record items on CAP—everything that was planned
Unable to see CAP
Record which items, if any, were funded (by Bank/government/donors?)
If they didn't receive a community asset, why?
Asset verification
What is it? School
When was It completed? 2009
Is it functional? (if it's a school, are there teachers/books; if it's a well, does it have year-round potable water; if it's a health center, are there staff and medicines?)
Yes, the school was well equipped. It had books, desks, notebooks, and multiple teachers.

72
Take any notes about location, who can use it, reported benefits, and so on.
The school was located in the center of the main kebele, next to the other school (not financed by the project)
Region: Oromia Woreda: Maesso Kebele: Kenterii
CAP checklist
Does it exist? (Y/N) Yes, verbally confirmed
Did you have a CAP before PCDP? (Y/N) No
Record year written/updated 2008
Record items on CAP—everything that was planned Unable to see CAP
Record which items if any were funded (by Bank/government/donors?)
If they didn't receive a community asset, why?
Asset verification
What is it? Small-scale irrigation
When was It completed? 2010
Is it functional? (if it's a school, are there teachers/books; if it's a well, does it have year-round potable water; if it’s a health center, are there staff and medicines?)
Community reported that it was functional, but IEG was unable to visit; it is located 9 kilometers by foot from the kebele.
Take any notes about location, who can use it, reported benefits, etc.
In the Kebele Development Council meeting they mentioned that the headwork was far away. Only about 50 percent of the village has access to land irrigation by the small-scale irrigation.
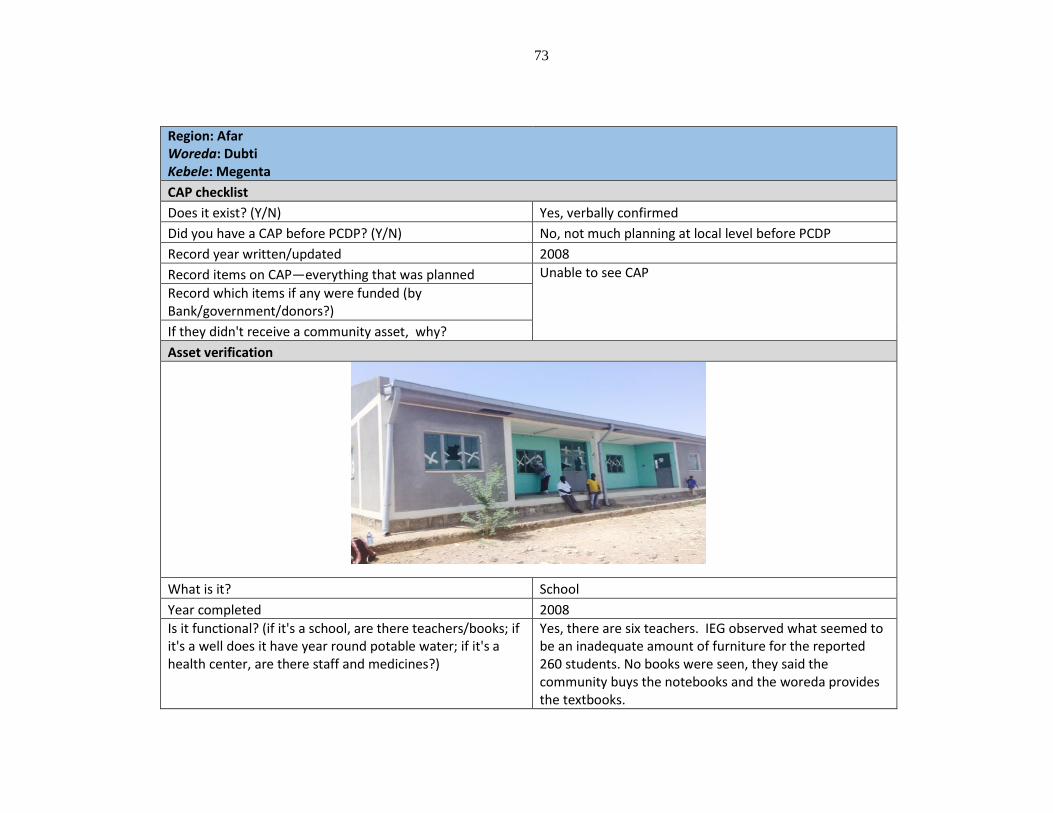
73
Region: Afar Woreda: Dubti Kebele: Megenta
CAP checklist
Does it exist? (Y/N) Yes, verbally confirmed
Did you have a CAP before PCDP? (Y/N) No, not much planning at local level before PCDP
Record year written/updated 2008
Record items on CAP—everything that was planned Unable to see CAP
Record which items if any were funded (by Bank/government/donors?)
If they didn't receive a community asset, why?
Asset verification
What is it? School
Year completed 2008
Is it functional? (if it's a school, are there teachers/books; if it's a well does it have year round potable water; if it's a health center, are there staff and medicines?)
Yes, there are six teachers. IEG observed what seemed to be an inadequate amount of furniture for the reported 260 students. No books were seen, they said the community buys the notebooks and the woreda provides the textbooks.

74
Take any notes about location, who can use it, reported benefits, and the like.
The school is accessible to everyone; it is near the community. Currently, 260 students are enrolled—community reported intention to enroll more students.
What is it? School
When was it completed? 2008
Is it functional? (if it's a school, are there teachers/books; if it's a well, does it have year-round potable water; if it' a health center, are there staff and medicines?)
Yes, they reported it was functional, but locked; we could not see inside; some broken windows.
Take any notes about location, who can use it, reported benefits, etc.
It was close to the first school that was constructed.

75
What is it? Human health post
When completed 2008
Is it functional? (if it's a school, are there teachers/books; if it's a well, does it have year-round potable water; if it's a health center, are there staff and medicines?)
Yes, the health post was functional; medicines observed include: malaria, diarrhea, worms, ear infections, antibiotics, vaccinations (no cold storage), and contraceptives.
Take any notes about location, who can use it, reported benefits, etc.
It is located along the road to get into the main kebele. Community reported that anyone can use it. There were mixed reports about adequacy of staffing and medicines— some said there was enough, others reported shortages (especially of medications that were reportedly only available in the first half of the month).
Gumerdale sub-Kebele
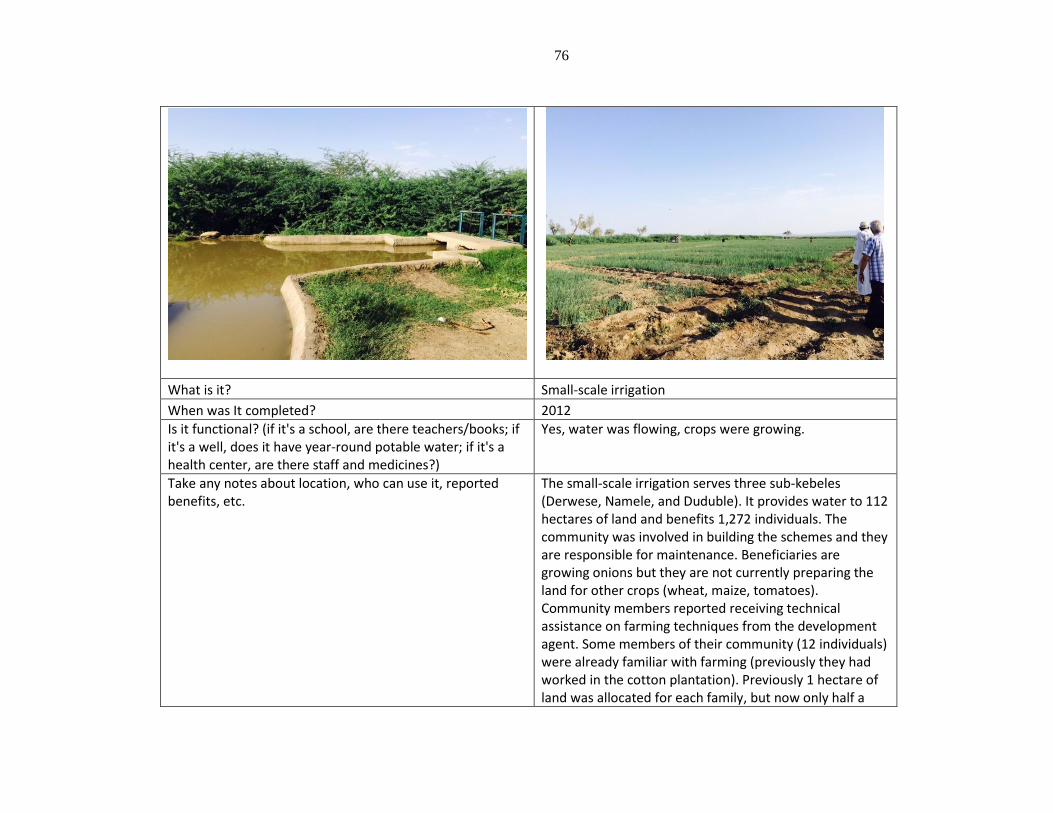
76
What is it? Small-scale irrigation
When was It completed? 2012
Is it functional? (if it's a school, are there teachers/books; if it's a well, does it have year-round potable water; if it's a health center, are there staff and medicines?)
Yes, water was flowing, crops were growing.
Take any notes about location, who can use it, reported benefits, etc.
The small-scale irrigation serves three sub-kebeles (Derwese, Namele, and Duduble). It provides water to 112 hectares of land and benefits 1,272 individuals. The community was involved in building the schemes and they are responsible for maintenance. Beneficiaries are growing onions but they are not currently preparing the land for other crops (wheat, maize, tomatoes). Community members reported receiving technical assistance on farming techniques from the development agent. Some members of their community (12 individuals) were already familiar with farming (previously they had worked in the cotton plantation). Previously 1 hectare of land was allocated for each family, but now only half a

77
Region: Afar Woreda: Chiafra Kebele: Deregera
CAP checklist
Does it exist? (Y/N) Yes, verbally confirmed
Did you have a CAP before PCDP? (Y/N) No
Record year written/updated
Did they have something similar to a CAP before the project? (Y/N)
No
Record items on CAP—everything that was planned. We weren’t able to see the CAP, but according to the Kebele Development Council meeting, they had requested the following: RUSACCO, water, health, education, and small-scale irrigation. The project financed water and education (but they were told the rest was too expensive). The government later provided a health center that was not operational at the time of IEG’s visit.
Record which items, if any, were funded (by Bank/government/donors?)
If they didn't receive a community asset, why?
Asset verification
hectare is allocated. Each plot produces a yield worth 50,000–60,000 Birr, but this varies with price fluctuations. Previously they could only farm for 6 months, but now they can farm for 12 months, for both seasons.
The irrigation scheme is located next to a sugar cane plantation – they were relocated to the land they currently occupy after construction of the government sugar cane plantation three years ago.
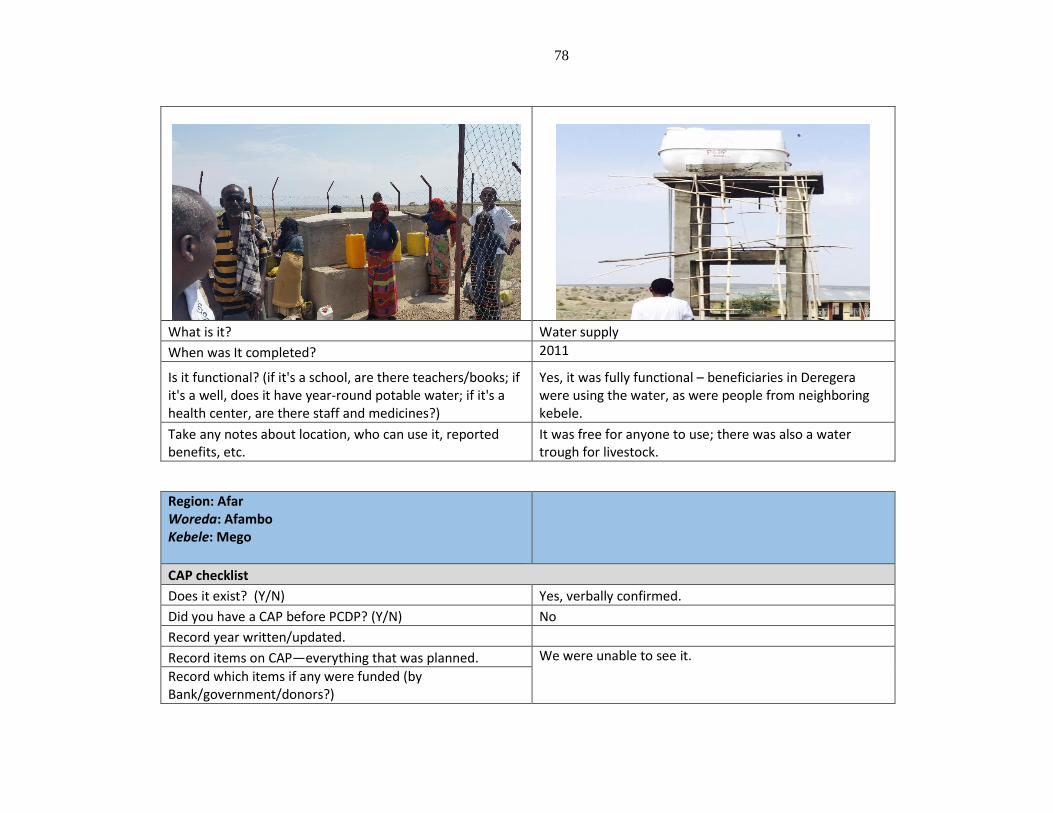
78
What is it? Water supply
When was It completed? 2011
Is it functional? (if it's a school, are there teachers/books; if it's a well, does it have year-round potable water; if it's a health center, are there staff and medicines?)
Yes, it was fully functional – beneficiaries in Deregera were using the water, as were people from neighboring kebele.
Take any notes about location, who can use it, reported benefits, etc.
It was free for anyone to use; there was also a water trough for livestock.
Region: Afar Woreda: Afambo Kebele: Mego
CAP checklist
Does it exist? (Y/N) Yes, verbally confirmed.
Did you have a CAP before PCDP? (Y/N) No
Record year written/updated.
Record items on CAP—everything that was planned. We were unable to see it.
Record which items if any were funded (by Bank/government/donors?)

79
If they didn't receive a community asset, why?
Asset verification # 1
What is it? Community road
When was It completed? 2003
Is it functional? (if it's a school, are there teachers/books; if it's a well, does it have year-round potable water; if it's a health center, are there staff and medicines?)
Yes, and it is in a very good condition
Take any notes about location, who can use it, reported benefits, etc.
It has given access to the community; community was inaccessible by motor vehicle before the road was constructed.
What is it? Vet post
When was it completed? 2003
Is it functional? (if it's a school, are there teachers/books; if it's a well, does it have year-round potable water; if it's a health center, are there staff and medicines?)
Yes, they have 2 individuals supervising it, the vet and his secretary (there are a total of 10 veterinary professionals for the entire woreda)
Take any notes about location, who can use it, reported benefits, etc.
Animals are brought to the vet post; they treat around 100 animals per week. They have had one major disease outbreak the whole year.
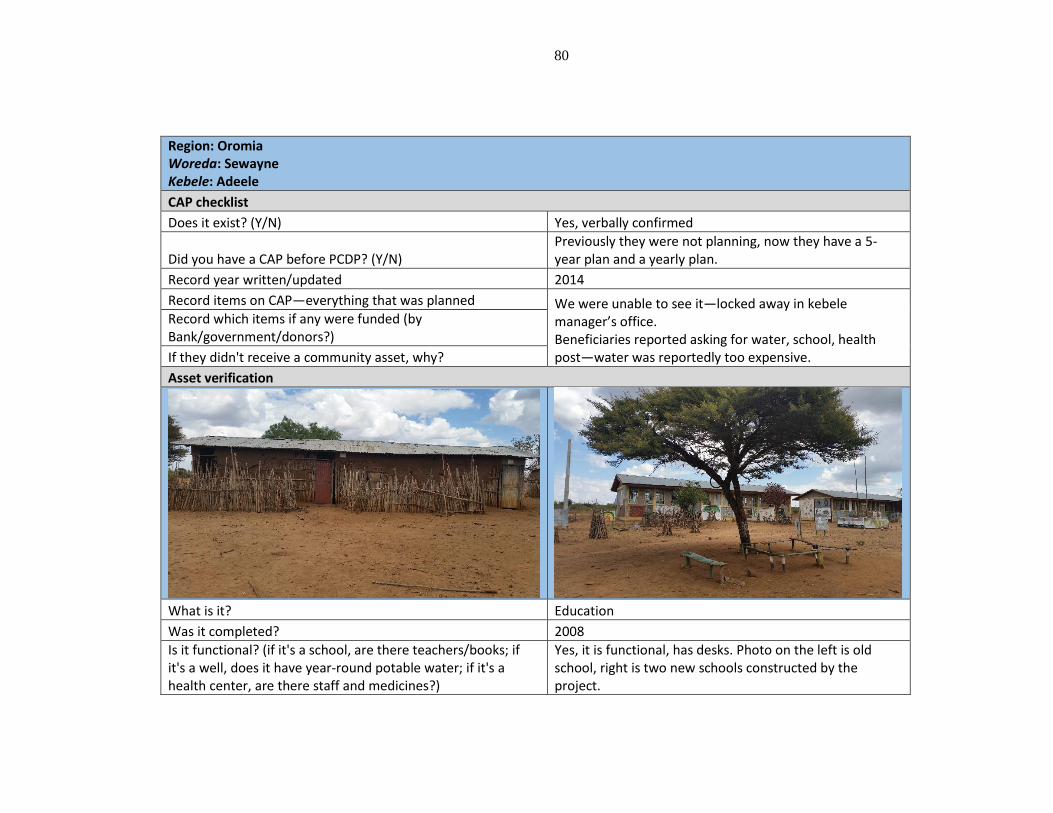
80
Region: Oromia Woreda: Sewayne Kebele: Adeele
CAP checklist
Does it exist? (Y/N) Yes, verbally confirmed
Did you have a CAP before PCDP? (Y/N) Previously they were not planning, now they have a 5-year plan and a yearly plan.
Record year written/updated 2014
Record items on CAP—everything that was planned We were unable to see it—locked away in kebele manager’s office. Beneficiaries reported asking for water, school, health post—water was reportedly too expensive.
Record which items if any were funded (by Bank/government/donors?)
If they didn't receive a community asset, why?
Asset verification
What is it? Education
Was it completed? 2008
Is it functional? (if it's a school, are there teachers/books; if it's a well, does it have year-round potable water; if it's a health center, are there staff and medicines?)
Yes, it is functional, has desks. Photo on the left is old school, right is two new schools constructed by the project.

81
Take any notes about location, who can use it, reported benefits, etc.
Located in the center of kebele, seems well used and well kept up—painted, etc. No children/teachers because it was a weekend.
Region: Oromia Woreda: Meda Walabu Kebele: Karju
CAP checklist
Does it exist? (Y/N) Yes, saw a copy
Did you have a CAP before PCDP? (Y/N) Previously they were not planning, now they have a 5-year plan and a yearly plan.
Record year written/updated 2014
Record items on CAP—everything that was planned Yes, saw CAP Beneficiaries reported asking for water, school, health post—water was reportedly too expensive. From the project they received school and health post.
Record which items if any were funded (by Bank/government/donors?)
If they didn't receive a community asset, why?

82
Region: Oromia Woreda: Meda Walabu Kebele: Karju
Asset verification
What is it? Education
When was it completed? 2012
Is it functional? (if it's a school, are there teachers/books; if it's a well, does it have year-round potable water; if it's a health center, are there staff and medicines?)
Yes, it is functional, has desks, books, and (reportedly) enough teachers.
Take any notes about location, who can use it, reported benefits, etc.
Well maintained, beneficiaries reported increased enrollment.
Region: Oromia Woreda: Meda Walabu Kebele: Hora Kore
CAP checklist
Does it exist? (Y/N) Yes, verbally confirmed
Did you have a CAP before PCDP? (Y/N) No
Record year written/updated
Record items on CAP—everything that was planned

83
Region: Oromia Woreda: Meda Walabu Kebele: Hora Kore
Record which items if any were funded (by Bank/government/donors?)
We were unable to see it—locked away. Reportedly asked for school and community health, water, and power. Received school and community health infrastructure from the project. They reported being told that water and power were not covered as they exceeded the budget ceiling.
If they didn't receive a community asset, why?
Asset verification
What is it? Health post
When was it completed? 2012
Is it functional? (if it's a school, are there teachers/books; if it's a well, does it have year-round potable water; if it's a health center, are there staff and medicines?)
Beneficiaries reported that it had adequate staffing and supplies, water tank was operational, didn’t see any medications because facility was locked (it was a weekend)
Take any notes about location, who can use it, reported benefits, etc.
Well maintained, beneficiaries reported easier access to health care.

84
Region: Somali Woreda: Erer Kebele: Hurso
CAP checklist
Does it exist? (Y/N) Yes, verbally confirmed
Did you have a CAP before PCDP? (Y/N) No
Record year written/updated
Record items on CAP—everything that was planned They said they had two CAPs, one for each round of the project (didn't see either). On the first they wanted human health post, which they received; school; animal health; and water supply. The second CAP was two years later and they wanted water, school (which they received), and animal health. They didn't use the CAP to finance anything else; they were told they could only have one infrastructure from each. They reported using CAP to suggest that the government provide them with water (which they received).
Record which items if any were funded (by Bank/government/donors?)
If they didn't receive a community asset, why?
Asset verification

85
Region: Somali Woreda: Erer Kebele: Hurso
What is it? School
When was it completed? 2012
Is it functional? (if it's a school, are there teachers/books; if it's a well, does it have year-round potable water; if it's a health center, are there staff and medicines?)
Yes, viewed the classroom being used. There were adequate desks and there was a teacher.
Take any notes about location, who can use it, reported benefits, etc.
Located near cluster of other schools, very large http://www.salongerard.com/ and many students were using. This school dealt with overflow.

86
Region: Somali Woreda: Erer Kebele: German
CAP checklist
Does it exist? (Y/N) Yes, verbally confirmed
Did you have a CAP before PCDP? (Y/N) No
Record year written/updated 2010, then updated for PCDP II
Record items on CAP—everything that was planned They asked for and received irrigation and animal health post, irrigation for agro-pastoralists and animal health for the pastoralists. They reported that without the animal health post, their animals would have died. This would have led to less milk and meat.
Record which items if any were funded (by Bank/government/donors?)
If they didn't receive a community asset, why?
Asset verification
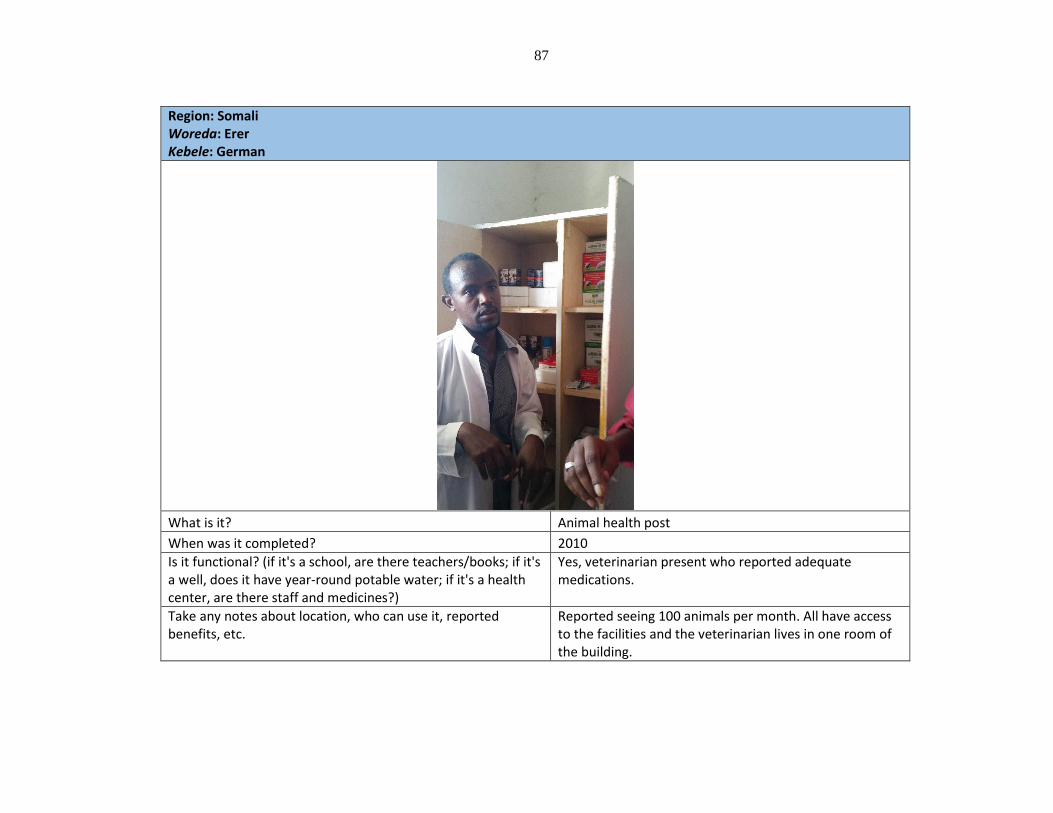
87
Region: Somali Woreda: Erer Kebele: German
What is it? Animal health post
When was it completed? 2010
Is it functional? (if it's a school, are there teachers/books; if it's a well, does it have year-round potable water; if it's a health center, are there staff and medicines?)
Yes, veterinarian present who reported adequate medications.
Take any notes about location, who can use it, reported benefits, etc.
Reported seeing 100 animals per month. All have access to the facilities and the veterinarian lives in one room of the building.

88
Region: Somali Woreda: Erer Kebele: German
What is it? School
When was it completed? 2012
Is it functional? (if it's a school, are there teachers/books; if it's a well, does it have year-round potable water; if it's a health center, are there staff and medicines?)
Teachers present, desks in school. This school is for grades 1 – 5.
Take any notes about location, who can use it, reported benefits, etc.
Lack of water at school and in kebele is problematic. Students are taken out of school to get water; this impacts attendance and ultimately enrollment.
Region: Somali Woreda: Shinile Kebele: Godley
CAP checklist
Does it exist? (Y/N) Yes, verbally confirmed
Did you have a CAP before PCDP? (Y/N) No
Record year written/updated CAP for PCDP I, then another in 2009 for PCDP II
Record items on CAP—everything that was planned On the first CAP they asked for human health post (which they received), school, animal health, and water supply.

89
Region: Somali Woreda: Shinile Kebele: Godley
Record which items if any were funded (by Bank/government/donors?)
On the second CAP they asked for school (which they received), water, and animal health. They were told by the project staff that they could only have one asset.
If they didn't receive a community asset, why?
Asset Verification
k What is it? Human health post (Kalabad)
When was it completed? 2007
Is it functional? (if it's a school, are there teachers/books; if it's a well, does it have year-round potable water; if it's a health center, are there staff and medicines?)
Yes, health worker was present (lives on site). Medicine and cold storage (powered by petrol) financed by another project.

90
Region: Somali Woreda: Shinile Kebele: Godley
Take any notes about location, who can use it, reported benefits, etc.
Reported that they see about 30 people a month, they deal mostly with preventative care. Since construction of this facility, another larger health clinic has opened nearby and they deal with issues that can’t be handled by the human health post.
Region: Somali Woreda: Shinile Kebele: Baraq
CAP checklist
Does it exist? (Y/N) Yes, verbally confirmed
Did you have a CAP before PCDP? (Y/N) No
Record year written/updated First CAP was created in 2007, unclear if it was updated
Record items on CAP—everything that was planned Didn’t see CAP, but they reported that they asked for irrigation, water supply, and a school (received water supply and a school).
Record which items if any were funded (by Bank/government/donors?)
If they didn't receive a community asset, why?
Asset verification

91
Region: Somali Woreda: Shinile Kebele: Baraq
What is it? Irrigation
When was it completed? 2008
Is it functional? (if it's a school, are there teachers/books; if it's a well, does it have year-round potable water; if it's a health center, are there staff and medicines?)
Yes, it is functional
Take any notes about location, who can use it, reported benefits, etc.
They reported that everyone in the kebele has access to the irrigation. Previously there was an earthen canal and much of the water was lost. This project transformed their ability to farm.

92
Region: Somali Woreda: Jijiga Kebele: Harew
CAP checklist
Does it exist? (Y/N) Yes
Did you have a CAP before PCDP? (Y/N) No
Record year written/updated First CAP was created in 2008, they graduated from PCDP so there is no more CAP—the CAP was seen as directly related to the project, not an ongoing activity.
Record items on CAP—everything that was planned CAP included plans for two schools (in different sub-kebeles), a human health post, and a water birka. These projects were all completed. The requested projects that were not supplied include the following: natural resource management, RUSACCO, water supply, and a health
Record which items if any were funded (by Bank/government/donors?)

93
Region: Somali Woreda: Jijiga Kebele: Harew
If they didn't receive a community asset, why? center. They reported that they built schools using lessons learned from PCDP.
Asset verification
What is it? School
When was it completed? 2009
Is it functional? (if it's a school, are there teachers/books; if it's a well, does it have year-round potable water; if it's a health center, are there staff and medicines?)
Yes, it is functional, there are teachers, desks and books.
Take any notes about location, who can use it, reported benefits, etc.
The main benefit of the school is a marked increase in literacy, and this contributes to household well-being, as children are able to help their illiterate parents. The main limitation of this school is that there is no water, which limits attendance and puts an extra work burden on mothers, who fetch water for the school.

94
Annex G: List of Persons Met
No Name Organization Title
World Bank
1 Andrew Goodland World Bank Sector Leader, SDN, Addis
Country Office,
2 Assaye Legesse World Bank TTL, PCDP Phase I, Senior
Agriculture Economist
3 Teklu Tesfaye World Bank TTL, PCDP Phase II, Senior
Agriculture Economist
4 Asferachew Abate World Bank Environmental Specialist
5 Ingo Widerhofer World Bank Former TTL, PCDP
6 Chukwudi H.
Okafor
World Bank Senior Social Development
Specialist
7 Esayas Nigatu World Bank Livestock Specialist
8 Shimelis
Woldehawariat
World Bank Senior Procurement Specialist
Government of Ethiopia
9 H.E Mulugeta
Wuletaw
State Minister Ministry of Federal Affairs
10 Fisseha Abera
Ministry of Finance & Economic
Development
Director, International Financial
Institution Cooperative
Directorate
11 Seid Omer Ministry of Federal Affairs PCDP project coordinator
12 Soloman Keberde Ministry of Federal Affairs Sr. Independent Auditor
13 Ahmed Adem Ministry of Federal Affairs CDSP, Sr. Officer

95
14 Hailu Kassaye Ministry of Federal Affairs PME Sr. Officer
15 Gerbre Terefe Ministry of Federal Affairs Environmental and Social
Safeguards Sr. Specialist
16 Rigut Beyene Ministry of Federal Affairs Admin and general Sr. Officer
17 Ahmed Bedru Ministry of Federal Affairs Sr. MIS Officer
18 Aweke Tefere Ministry of Federal Affairs Sr. Procurement Officer
19 Tekalign
Aschalew
Ministry of Federal Affairs Sr. Finance Officer
20 H.E. Mohammad
Yusuf
Ministry of Federal Affairs Chairperson
21 H.E. Lijalem
Wolde
Pastoral Affairs Standing
Committee
Vice Chair
22 H.E.Dagnew
Belete
Pastoral Affairs Standing
Committee
Member
23 H.E.Hussen
Gelgelo
Pastoral Affairs Standing
Committee
Member
24 H.E. Eskender
Adeba
Pastoral Affairs Standing
Committee
Member
25 Usman Surrur Federal Cooperative Agency Director General
Academia/Research/Semi-Autonomous Agencies/Evaluation
26 Mr. Jeremy Lind Institute of Development Studies
(IDS) at the University of
Sussex/Centre for Civil Society at
the London School of Economics
Research Fellow/Associate
27 Professor Jon Unruh McGill University Associate Professor, Department
of Geography

96
28 Beyene Tadesse Lloya Consult Managing Director/Manager End-
Line Assessment
29 Barry Shapiro International Livestock Research
Institute Senior Program Development
Advisor
30 Mr. Roger Slade ________ Independent Consultant
31 Mirafe Marcos Agriculture Transformation Agency Chief of Staff
32 Laketch Mikael Agriculture Transformation Agency Senior Director, Cross-Cutting
Initiatives
UN and Bilateral Agencies
33 John Aylieff World Food Program Representative and Country
Director
34 Samir Wanmali World Food Program Deputy Area Coordinator
35 Mesfin Tesfaye World Food Program Procurement & Partnership
Officer
36 Amadou Allahoury Food and Agriculture Organization Country Representative
37 Gedlu Mekonnen Food and Agriculture Organization Animal Health Officer
38 Gary Robbins USAID Office Chief, Economic Growth
and Transformation/Ethiopia
39 Dubale Admasu USAID Pastoralist and Livestock
Programs Coordinator
NGOs
40 Michelle Winthrop Farm Africa Director of Programs
41 Melissa Himes CARE Program Manager

97
Annex H: Borrower Comments
From: Seid Omer [mailto:[email protected]] Sent: Saturday, March 19, 2016 6:57 AM To: Lauren Kelly Cc: Vibhuti Narang Khanna; Midori Makino; Kaydaki Gezahegn Subject: Sending of comments on draft assessment report
Dear Lauren,
Attach here with I send comments on the draft assessment report through track change. The
comments are developed after thoroughly discussed with our state minister Your excellency
Ato Kaydaki Gezahegn. I hope that you will consider our detail comments in the final
version of the report.
With regards
Seid, PCDP Project Coordinator
Comments on the IEG draft project performance assessment report
Ethiopia Pastoral Community Development Project Phase 1-Principal Ratings (page viii) Outcome
PPAR rating- (BC) Moderately satisfactory is a fair rating for PCDP I as there are tangible outcomes
from the implementation of the project under PCDP I.
Ethiopia Pastoral Community Development Project Phase II- Principal Ratings (page viii) Outcome
PPAR rating- (BC) The rating for outcome has to be satisfactory due to the following reasons:
1. Almost all outcome indicators achieved
2. All component objectives are meet as per the plan
3. All the eight triggers are meet
4. Beneficiaries for each of the sub projects (water, education SSI, animal health post, human health
post, etc) are quantified using outcome indicaters that demonstrates the success/outcome of the project
Ethiopia Pastoral Community Development Project Phase II- Bank Performance PPAR- (BC) There
was a strong support and supervision from the side of the bank and hence this rating seams not fair.
On page xiv of the Executive Summary- “and constrained mobility due to new settlements and large
scale development schemes” – (BC) Please omit this paragraph as this is not a key challenge at
present. Because pastoralist themselves has got benefit from this program.
The Relevance of Design of PCDP Phase I is rated as Modest – (BC) We are not clear why relevance
of design of PCDP phase I is rated as modest. This is because PCDP as a program is designed for 15
years that is splitted in to three phases with a set of objectives to be achieved every phase. On top of
achieving the set objectives, Phase I establish a base for proper implementation and scaling up of
activities for the other two phases.
On page xv under The overall outcome for PCDP I is rated as Moderately Unsatisfactory- (BC)
Despite some limitations mentioned above, PCDP I in total benefited 600,000 pastoralist and agro
pastoralists in its five years program by constructing 1,412 different economic and social
infrastructures. Given that the approach is new in the country and capacity limitations at district and
community level, the achieved outcome can be considered as good. Therefore, the rating has to be
updated to moderately satisfactory.

98
On page xvi- Pastoral Community Development Project, Phase II- under the relevance of objectives
of the second phase are rated as substantial (last line of the paragraph)- however the addition of the
broader poverty reduction aim, was unrealistic with regard to the scope and nature of project design-
(BC)- There is a need to differentiate the development objective of each phase (PCDP I, II &II) and
the over all objective of the 15 years program. In the case of PCDP II the point is that it will
contribute for the over all poverty reduction aim of the country.
The design of the second phase gained relevance by making improvements to program design, but is
rated Modest by this assessment, due to several shortcomings – (BC) where are the shortcomings?
The income generating activity model- focused on productive group assets ± was replaced by a
Community Investment Fund that offered a simpler menu of basic public goods that groups could
agree (BC)- Sorry this doesnt represent PCDP II. Please revise this sentence
However, phase II design was undermined by a lack of targeting and a differentiated design for agro-
pastoralists versus mainly non-sedentary herders, and a more nuanced understanding of constraints and
behaviors across very different- (BC) This is not true. The community consultation process includes
the pastoralists, agro pastoralists and drop outs, and then the identified sub projects addressed the
needs of all these groups. For example, most of the RuSACCo members are dropouts, when we built
water and animal health post that means we address the interests of the pastoralists. Rangeland
development also address the problem of pastoralists. Small scale irrigation serves agro pastoralists.
With all the above justification, the rating of modest and analysis has to be revised.
On page xvii under Efficacy- objective of increasing external shocks was only modestly met.(BC) -
This rating and the analysis below has to be seen again for the following reasons:
1. Under PCDP II we manage to complete 191 medium size subprojects that contributes in reducing
vulnerability for external shocks
2. The project in collaboration with federal EWRD established early warning system in all the 129
pastoral woredas that enabled to collect the required information.
3. We manage to provide the required response with in a month time as indicated in the result frame
work
However, reducing vulnerabilities through the disaster management activities was only modestly
achieved (BC)- See comments above and also refer our five year project performance report
The early warning systems supported by the project were undermined by uncoordinated approach
amongst donors and government (BC)- This is not correct analysis:
1. The system is with a donor/government coordination unit at federal & regional level
2. Even the Government effort at present is very good. the response is also very productive at the time
of PCDP II and then after.
Public Investments, financed by the project and designed to mitigate disaster risks, seemed to
differentiate little from other investments made by the project; the choice of asset and their strategic
prioritization was also in question (BC)- What does this mean? Even the 191 DPSIP sub projects are
selected from the DRR plan which was indorsed and approved by the respective regional steering
committees.
On page xvii-The overall outcome Rating for PCDP II is Moderately Satisfactory- (BC) Based on the
over all performance of the project stated above, the gained benefit, achieving of the set objectives,
meeting of the set result framework indicators and triggers; the rating has to be satisfactory. In other
words, from the over all performance of PCDP II, we are not convinced your rating of moderately
satisfactory.
Bank performance in the second phase of PCDP is rated Moderately Satisfactory. (BC) - From the
justification stated below the rating seams not fair.
On page xviii under Risk to Development Outcomes Risks to Achieving the Programmatic Aims is
rated Substantial- While the project has dampened the effects of crises, by helping to build
resilience through public investments and savings, pastoralists continue to be exposed to cyclical
shock and many of the constraints that underline this were not addressed by the project design in either
phase (BC)- This analysis has to be seen from the perspective of project coverage. Under PCDP II,
we cover only 55 of the 145 pastoral/agro pastoral woredas. Even the project is not expected to solve
all problems exist in the pastoral areas.

99
Overall, while the two projects assessed made a significant contribution to meeting critical, social and
economic infrastructure needs, the link from investments (BC)- It is not time to evaluate the impact of
the 15 years program.
On page xviii (Last paragraph) The overall development objective for the APL was to improve
livelihoods (incomes and assets) of pastoralists on a sustainable basis and reduce vulnerability of
pastoralists. But the thrust of the bulk of project interventions was on the provision of social
infrastructure and some limited economic infrastructure. These investments are critical to improve
the well-being of the communities and indeed highly appreciated by the beneficiaries, but it is
difficult to establish the pathway from the investments to the overall project objective of creating
sustainable livelihoods. A sustainable livelihood-centered approach would have required a much
broader range of coordinated investments (BC)- It is too early to make this kind of generalization at
this point at least due to the following reasons:
1. The 15 years program not yet completed and at the time of your assessment, we start PCDP III
2. The sub projects are selected by the community themselves as we are following the CDD approach.
Even with this context, a significant number of economic infrastructure build under PCDP I and Ii;
and the figure is expected to increase significantly in the last phase (PCDP III).
3. Based on the lessons from PCDP II, more emphasis is given for livelihood activities under PCDP
III. Even we establish one bigger livelihood component under PCDP III
On page xix (3rd line) water, improving livestock production and marketing chains, rangeland
management, and promoting supplementary sources of income, including agriculture (BC)- The
project develop a significant number of water sub projects, livestock market, range land development
and other supplementary source of income. Please refer our PCDP five year project performance
report.
While PCDP III expands the livelihood component by enhancing access to finance and helping
pastoralists to develop innovative, income diversifying business activities and/or strengthen existing
productive activities, these activities are still not likely to be very significant in relation to a needed
broader strategic approach (BC)- What does this mean? This is not clear.
On page xix- under Lessons- Programmatic approaches that involve multiple projects over a long
period of time are more effective when in addition to assessing project outputs, they measure the extent
to which overall programmatic objectives are being met.(BC)- This is what we are doing under the
PCDP 15 year program.
Page xix under
Lessons (fourth line)- There is a need to have a results framework that specifies not only the short-
term objectives of each of the projects in the series but alsohow these link to the overall program
objectives. Monitoring and evaluation systems should track not only individual project
accomplishments but should be designed to assess the programmatic objectives, even if these can
only be achieved over time. (BC)- Technically how is it possible to develop result frame work for 15
years program that split in to three phases? O fcourse the objective for the 15 year program is clearly
stated in PCDP III PAD for which each of the three phases contribute.
Under page 5, in paragraph 1.10 (line 2) but there is not yet a well-articulated strategy to achieve the
policy objective (BC)- There is a clear strategy as indicated in GTP I & II. Under GTP I, it is
indicated as a short term and long term syrategy
Under page 5 in paragraph 1.10 (last 4 lines)- However, there is no overarching, cohesive pastoral
development strategy for the country. (BC)- See the above comment.
Chapter 2 of page 5 – 55 pastoral (BC)- The 15 years program will cover the whole 145 pastoral/agro
pastoral woredas
Page 5 -For the second phase the number of woredas was raised to 57 (BC)- the actual is 55
Page 5- 32 existing and 25 new (BC)- the actual is 23
Paragraph 2.3 page 6 - However, within the pastoral areas the project documentation does not give
an explanation as to how different woredas within the pastoral areas, or how kebeles within a woreda,
were selected.(BC) - No this is not true. In the project implementation manual (PIM) clear criteria set
for the selection of project woredas and kebeles. Accordingly, the woredas are selected by the
respective regions and the kebele by the respective woredas, based on the set criteria in the IPM.
Please refer the PIM.

100
Page 7 in paragraph 2.5- One hundred percent of PCDP II¶V IDA funds (BC)- The project also utilize
100% of IFAD fund.
Page 8 in paragraph 2.9 Pastoral Risk Management component under a Memorandum of
Understanding (MoU) (BC)- No, they manage only one sub component- Pastoral Early Warning and
Response sub component. The other sub component... Disaster Preparedness Strategic Investment
Plans(DPSIP) sub component is managed by the respective pastoral bureau/commission. please refer
the five year project performance report.
Page 8 in paragraph 2.10 Kebele Development Council (KDC) (BC)- Replace it by committee
Page 8 in paragraph 2.10 Procurement (BC) replace it by representative
Page 10 in paragraph 3.8 The Relevance of Design Phase 1 is rated as Modest.(BC) Based on the
analysis below why it is modest?
Page 11 in paragraph 3.10 The extent to which kebele councils truly reflected inputs from all
members of the community was still unclear. (BC) The role of kebele development committee (KDC) is
appraising sub projects identified and prioritized by the community. The WDC then approve the sub
projects that came from different kebeles. We are not, therefore, clear where the problem is.
Page 11 in paragraph 3.13. Another major shortcoming of the project (and program) design is a lack of
a clear link between the project interventions and the overarching program of objective of
promoting sustainable livelihoods of pastoralists. (BC) This analysis seams not correct due to the
following reasons:
1. In principle livelihood in its concept also includes the provision of social services.
2. the main livelihood system in pastoral area is livestock. The project addresses the pastoral people
through the construction of animal health post, rangeland development, forage development, water
development, etc. All these interventions address the livelihood issues of the pastoralist
3. On top of that through the establishment of saving and credit association, the project creates
financial service that helps the pastoralists to improve their income.
4. The project follows a CDD approach that gives a room for the community to identify their own
problems and prioritize their interventions.
All the above justification has to be seen that helps you to consider your analysis.
Page 12 (1st line) Thus, it is difficult to see the project interventions resulting in improving livelihoods
of pastoralists or reducing risk to any significant extent.(BC) Please consider the above analysis
Page 15 in paragraph 3.26 PCDP (I and II) (BC) Please omit PCDP II from here as they vary in terms
of performance in achieving objectives.
Page 15 in paragraph 3.28 (last line) However, since it is not an explicit objective, it is not rated. (BC)
Why? Because PCDP I contributes in empowering community and woreda to better manage local
development.
In paragraph 3.29 institutionalization and sustainability was insufficient (BC) The instutionalization
and sustainability issues has to be seen at the end of PCDP III when the 15 years program evaluated.
Therefore, it is very difficult to say in sufficient at this point.For sure PCDP I contributes a lot in
building local capacity.
Page 17 paragraph 3.33 Attention to the institutionalization and sustainability of the CDD model
was insufficient.(BC) Please omit this statement based on the above comment.
Page 25 Outcome in paragraph 3.56 Overall Outcome for Phase I is rated Moderately Unsatisfactory.
(BCC) Based the overall performance of PCDP I the rating has to be moderately satisfactory.
Page 28 paragraph 4.4 however the addition of the broader poverty reduction aim was unrealistic with
regard to the scope and nature of project design. (BC) The issue here is that PCDP II will contribute
for the broader country program of reducing poverty, which is of course the case.
Page 29 – Relevance of Project Design in paragraph 4.5 is rated Modest. (BC) Based on the analysis in
the paragraphs below, the rating has to be changed from modest to substantial. Because a significant
change is made based on the lessons from phase I.
Paragraph 4.5 model in Phase II, The project also introduced the RUSACCO modeled after pilots
tested through an IFAD rural finance project. (BC) Under PCDP II P Pastoral Risk Management
Component also restructured under two sub components, 1)Disaster Preparedness Strategic
Investment Program (DPSIP), and 2) Pastoral Early Warning and Response Program.

101
Sub projects supported by DPSIP is different from CIF in terms of size, implementation arrangement
and instructional arrangement (see the details from PCDP II five year performance report.
Paragraph 4.6 in line 5 DPIPs (BC) Replace it by DPSIP.
Paragraph 4.9 in line 5 but the link from investments to the desired outcomes is unclear
(BC) what does this mean?
Paragraph 4.9 Given the constraints and challenges of pastoralist communities, a
sustainable livelihood approach would be centered on water, improving livestock
production and marketing chains, rangeland management, and promoting supplementary
sources of income, including agriculture. (BC) The project address all these issues under
PCDP II and we do not see any gap in this context.
Paragraph 4.9 on page 11 need broader strategic approach (BC) What do you mean by needed
border strategic approach. After all PCDP is attempting to address the needs of the pastoral
community by providing social and economic services, and also addressing problems on
livestock, to a certain extent on market, pasture development, water development, etc
As an approach PCDP interventions are prioritized by the community themselves.
Paragraph 4.10 Another shortcoming of design is that more could have been done to consider
the needs of the mobile populations. PCDP design focused primarily on settled agro-
pastoralist.Recognizing that many agro-pastoralists are impoverished, the inclusion of this
group was necessary. However, more could have been done to understand and meet the needs
of the mobile population. (BC) This is not true. The community consultation process includes
the pastoralists, agro pastoralists and drop outs, and then the identified sub projects
addressed the needs of all these groups. For example, most of the RuSACCo members are
dropouts, when we built water and animal health post that means we address the interests of
the pastoralists. Rangeland development also address the problem of pastoralists. Small scale
irrigation serves agro pastoralists
Paragraph 4.11 The document does not, however, articulate the extent to which project design
addresses the socio-economic needs within the different regions, and what the lessons learned
are in this regard during the evolution of the program. There is no reference to quantified data
on, for example, the proportion of the population that is largely settled, or the proportion that
is partly mobile and partly settled, or the proportion that is mostly still mobile.(BC) This kind
of generalization is very difficult. From our experience, with in one kebele there could be pure
pastoralist and also at the same time agro pastoralist. The type of intervention in a particular
kebele will, therefore, be depends on the nature of the kebele. This kind of issues is usually
addressed at the time of community consultation.On top of that, it is possible to get the
proportion of pastoralist and agro pastoralist from the respective regions.
Paragraph 4.12 The project does support small scale irrigation (BC) What does it mean? We
manage to construct and make functional about 171 small scale irrigation sub projects under
PCDP II. On top of that as we are following the CDD approach, it is up to the community to
decide on the type of intervention. This analysis really contradicts with the philosophy of the
CDD approach.
Paragraph 4.23 on page 33 Ministry of Agriculture and Rural Development (BC) Rural
Development should be deleted.
Paragraph 4.26 on page 34 The main overall weakness with the PCDP I and II M&E system
was that no indicators were established or monitored for the overall objectives of the APL:
building resilience and sustainable livelihood. (BC) Technically the impact of the 15 year
program will be evaluated by external consultants, for which we start the process to recruit
consulting firm. As stated in the PCDP III PAD and PIM, the 15 years program objective is
set and indicators to measure it clearly stated. Please refer the two documents.
If need be, we can send the ToR and proposal for the plan impact assessment.
Paragraph 4.27 Monitoring and Evaluation Design, Implementation and Utilization for PCDP
II is rated Substantial with shortcomings (BC) Based on the above justification please omit
this word shortcomings.
Page 36 Community Investment Fund (BC) Please update the number of completed and
functional sub projects from the final project performance report. All the completed projects
became functional until the end of January, 2015 (when IFAD fund commpleted).

102
Paragraph 4.36 under bullet point access to Water (no target was established for this goal)
(BC) The target in the result framework is 450,000 people.
Paragraph 4.51 last line, So while lauding the effectiveness of CIF investments, the mission
assesses that their impact on livelihoods is marginal. (BC) What does this mean? How much
do you expect and how much we achieved. This conclusion seams lack of evidence.
Objective 2: Achievement of Objective is rated as Modest (BC) We dis agree on this rating as
the justification below needs revision
Paragraph 4.53 Critical pastoral risk management activities (EWS system development,
financing of deep wells, access roads and irrigation schemes) have been put in place, but there
is little (BC) Please make a separate analysis for the two sub components (DPSIP and
PEWR) Secondly, up date the figure based on the final project performance report.
Paragraph 4.56 on page 45 it is difficult to discern the difference between funding for
activities and subprojects, which are very similar, under objectives (1) enhanced livelihoods,
specifically the CIF subprojects, and (2) pastoral risk management, specifically the DPSIP
subprojects (for example, a water point could be funded from either) (BC) As there is
variation between sub projects supported by CIF and DPSIP, we have a reservation on this
analysis. Please reconsider this.
The IEG mission also reviewed a sample of DPSIPs that had been prepared by the regional
governments with the assistance of consultants. These appeared more to be a (BC) the same
comment above.
Paragraph 4.60 on page 46 Finally, as for PCDP I, the issue of insufficient oversight of this
component by the PMU continued to persist in PCDP II as well. The IEG mission did not
find any critical review of components either by the PMU or the Bank for this component.
(BC) This doesn't reflect facts on the ground. There is a big variation in terms of planned
activities and performance between PCDP I and II.
Paragraph 4.71 Overall Outcome for Phase II is rated Moderately Satisfactory. (BC) Based on
the outcome gained under PCDP II this rating has to be improved to satisfactory.
Paragraph 4.71 weaknesses are associated with a lack of a livelihood approach, lack of
attention to mobile populations, and the shortfall in the design of overall measurement of
the aim of the PDO.(BC) Based on the justification we give earlier these list of weakness can
not be considered as weakness under PCDP II.
Paragraph 4.71 These are all key indicators of efficiency and sustainability. (BC) Given all
these justifications, the rating has to be satisfactory.
Paragraph 4.77 on page 49 . Indeed, the program seems to have been conceived as a service
delivery program with emphasis on new approaches to service delivery (CDD). It lacked a
strong analytical underpinning at the outset. (BC) Please consider improvements under PCDP
III when you are discussing the program issue.
Paragraph 4.77 on page 49 Triggers for follow-on projects were all related to physical
progress rather than to the program objectives.(BC) All the eight triggers are not related to
physical progress. Please revisit again.
Paragraph 4.78 The programmatic design also suffered from lack of a clear and accepted
strategy for the development of pastoral areas.(BC) We dis agree on this argument . please
revisit again, as your argument contradict with the philosophy of CDD approach, where
community will identify their own problems from their vast experience.
Paragraph 4.78 Moreover, the level of services that has been inability, or perhaps
unwillingness, of donors including the Bank to ascribe to the Government policy of voluntary
settlement has hindered the formulation of a strategy for pastoral development.(BC) This
statement is not clear.
Paragraph 4.79 The World Bank financed Regional Pastoral Livelihoods Resilience Project
(RPLRP), approved in 2014, appears to be a much more appropriate design for resilience and
livelihoods (BC) There are two contradictory issues here. On the one hand it is stated that the
pastoral risk management component under PCDP is not working well, and on the other
hand, the resilience project is considered as appropriate for pastoral area. For your
information the resilience project is a continuation of pastoral risk management component
under PCDP II.

103
Paragraph 4.80 on page 50 Risk to development outcome for PCDP II is rated Significant.
(BC) Need to be revisited
Paragraph 4.82 Quality of Supervision for Phase II is rated Moderately Satisfactory.(BC)
The quality of supervision and technical support under PCDP II was good.
Chapter 5 under Lessons Programmatic approaches that involve multiple projects over a long
period of time are more effective when in addition to assessing project outputs, they measure
the extent to which overall programmatic objectives are being met. (BC) This is what we are
doing under the PCDP 15 year program.
Chapter 5 under Lessons There is a need to have a results framework that specifies not only
the short-term objectives of each of the projects in the series but also how these link to the
overall program objectives. Monitoring and evaluation systems should track not only
individual project accomplishments but should be designed to assess the programmatic
objectives, even if these can only be achieved over time. (BC) Technically how is it possible
to develop result frame work for 15 years program that split in to three phases? fcourse the
objective for the 15 year program is clearly stated in PCDP III PAD for which each of the
three phases contribute.