ethiopian development research institute · ethiopian development research institute addis ababa,...
TRANSCRIPT
Research Report 31
Alebel B. Weldesilassie, Getnet Alemu, Tibebu Sado and Habtemariam Kasa
Ethiopian Development Research Institute
Addis Ababa, Ethiopia
November 2017
Building Resilience in Vulnerable Areas of
Rural Ethiopia: Status, Gaps, Opportunities
and Strategic Options
ii
This is an Executive Summary of the Comprehensive Baseline Situational Analyses. The project has been funded by EU−Delegation to Ethiopia.
iii
THE ETHIOPIAN DEVELOPMENT RESEARCH INSTITUTE
RESEARCH REPORTS
About EDRI Founded in August 1999 as a semi-autonomous government development research institute, EDRI’s
primary mission is to conduct quality research on the development of the Ethiopian economy and
disseminate the results to key stakeholders within and outside of Ethiopia. EDRI is sponsored by the
Ethiopian government, ACBF, UNDP, IDRC-TTI and IFPRI/ESSP. For more information, as well as other
publications by EDRI staff and its affiliates, go to http://www.edri.org.et
Ethiopian Development Research Institute (EDRI) P.O.Box 2479 Tel: 251115506068 Fax: 251115505588 Email: [email protected] Website: http://www.edri.org.et
ABOUT THESE RESEARCH REPORTS The Ethiopian Development Research Institute (EDRI) Research Reports contain research materials from EDRI and/or its partners. They are circulated in order to stimulate discussion and critical comment. The opinions are those of the authors and do not necessarily reflect that of EDRI’s, their home institutions’ or supporting organizations’. Comments may be forwarded directly to the author(s) respective addresses.
Report citation: Alebel B. Weldesilassie, Getnet Alemu,Tibebu Sado and Habtemariam Kasa, 2017. Building Resilience in Vulnerable Areas of Rural Ethiopia: Status, Gaps, Opportunities and Strategic Options. EDRI Research
Report 31. Addis Ababa: Ethiopian Development Research Institute.
About the Author(s)
Alebel Bayrau Weldesilassie, Research Team Leader and Research Fellow at EDRI; [email protected] Getnet Alemu, Director, Institute of Development and Policy Research at AAU; [email protected] Habtemariam Kassa Belay, Scientist, Forests and Livelihoods Research Portfolio and Head of CIFOR; [email protected] Tibebu Benyam, Senior Technical Lead, Primary Health Care Transformation Initiative of YGHLI; [email protected]
Building Resilience in Vulnerable Areas of Rural Ethiopia:
Status, Gaps, Opportunities and Strategic Options
Alebel B. Weldesilassie, Getnet Alemu, Tibebu Sado and Habtemariam Kasa
Ethiopian Development Research Institute
(EDRI)
Copyright © 2017 Ethiopian Development Research Institute. All rights reserved. Sections of this material may be reproduced for
personal and not-for-profit use without the express written permission of but with acknowledgment to EDRI. To reproduce the
material contained herein for profit or commercial use requires express written permission. To obtain permission, please contact
Jemal Mohammed via [email protected]
1
Contents Acronyms………………………………………………………………………………………………………..3 Abstract………………………………………………………………………………………………………….4 1. Introduction…………………………………………………………………………………………….1 2. Methodology……………………………………………………………………………………………3
2.1 Conceptual Framework ......................................................................................................................... 3 2.2 Data ....................................................................................................................................................... 4 2.3 Survey Instruments ................................................................................................................................ 4 2.4 Analyses ................................................................................................................................................ 5 2.5 Limitation .............................................................................................................................................. 5
3. Baseline Situation of the Vulnerable Communities…………………………………………….6 3.1 Basic Context ......................................................................................................................................... 6
3.1.1 Demographics ................................................................................................................................... 6 3.1.2 Access to Basic Social Services .......................................................................................................... 7 3.1.3 Access to Public Services and Basic Infrastructure ......................................................................... 10
3.2 Livelihood Profile ................................................................................................................................. 11 3.2.1 Livelihood System ........................................................................................................................... 11 3.2.2 Livelihood Assets ............................................................................................................................ 12 3.2.3 Crop Production, Productivity and Technology Use ....................................................................... 13 3.2.4 Livestock Production, Productivity and Technology Use ................................................................ 14 3.2.5 Food and Water Security Status ..................................................................................................... 14 3.2.6 Major Risk Factors to Livelihoods and Coping Mechanisms ........................................................... 14 3.2.7 Wealth Status of Community and Perceptions of Inequality.......................................................... 15 3.2.8 Gender Dimensions of Rural Livelihoods ........................................................................................ 16 3.2.9 Key Driving Factors ......................................................................................................................... 16
3.3 Health and Nutrition ........................................................................................................................... 16 3.3.1 Trends and Status in Health and Nutrition Service Delivery ........................................................... 17 3.3.2 Trends and Status in Health and Nutrition Service Utilization ....................................................... 17 3.3.3 Trends in Morbidity and Mortality ................................................................................................. 20 3.3.4 Gender Dimension of Health and Nutrition .................................................................................... 22 3.3.5 Key Driving Factors ......................................................................................................................... 23
3.4 Natural Resource and Disaster Risk Management .............................................................................. 23 3.4.1 The Status and Trend of NRs in the Clusters................................................................................... 24 3.4.2 Major Drivers of Change and Key Challenges ................................................................................. 32
3.5 Policy and Institutional Aspects of Resilience ...................................................................................... 34 4. Gaps and Opportunities for Resilience Building………………………………………………36
4.1 Gaps and Opportunities in Livelihood ................................................................................................. 36 4.2 Gaps and Opportunities in Health and Nutrition ................................................................................ 37 4.3 Gaps and Opportunities in NR and DRM ............................................................................................. 38 4.4 Policy and Institutional Gaps and Opportunities ................................................................................. 40
5. Strategic Option for Building Resilience………………………………………………………..50 6. Further Research…………………………………………………………………………………….55 References……………………………………………………………………………………………………..56
2
List of Tables TABLE 1: POPULATION BY SEX IN CLUSTER AREAS (2016 PROJECTION) ........................................................ 6 TABLE 2: ACCESS TO BASIC SOCIAL FACILITIES (SCHOOL, HEALTH AND WATER SUPPLY) ................................. 8 TABLE 3: ACCESS TO BASIC RURAL FACILITIES IN CLUSTER AREAS (NUMBER AND PERCENTAGE OF VILLAGES BY
DISTANCE TO FACILITIES).................................................................................................................... 9 TABLE 4: ACCESS TO BASIC INFRASTRUCTURE IN CLUSTER AREAS ............................................................. 11 TABLE 5: LAND USE PATTERNS (% OF TOTAL) IN CLUSTER AREAS ............................................................... 13 TABLE 6: LIVESTOCK POPULATION BY CLUSTER IN 2014/15 ....................................................................... 14 TABLE 7: AVAILABILITY OF ESSENTIAL DRUGS AND SUPPLIES AT THE GEOGRAPHICAL CLUSTERS IN 2016 ...... 17 TABLE 8: CAR, SBA, AND IMMUNIZATION IN CLUSTER AREAS ..................................................................... 18 TABLE 9: MAJOR LAND USE CATEGORIES IN SELECTED WOREDAS IN 2003 AND 2013 (HECTARES) ............... 26 TABLE 10: IMPORTANCE OF DISASTER RISKS, LOSSES AND VULNERABILITY FACTORS IN THE CLUSTERS ........ 29 TABLE 11: GAPS AND OPPORTUNITIES FOR BUILDING RESILIENCE IN CLUSTER AREAS .................................. 42
List of Figures FIGURE 1: SHARE OF POPULATION BY AGE GROUP (BASED ON CSA PROJECTION FOR THE YEAR 2016).......... 7 FIGURE 2: TRENDS IN WASTING BASED ON REGIONAL FIGURES, 2011-2014 ................................................ 21 FIGURE 3: TRENDS IN STUNTING BASED ON REGIONAL FIGURES, 2011-2014 .............................................. 21 FIGURE 4: NATIONAL TREND IN EARLY CHILDHOOD MORTALITY 2000-2014 ................................................. 22
3
Acronyms
BEmONC Basic Emergency Obstetric and New-born Care CBHI Community Based Health Insurance CBO Community Based Organizations CBN Community Based Nutrition CCI Complementary Community Infrastructure CMAM Community Management of Acute Malnutrition CPD Continuing Professional Development DRM Disaster Risk Management EDRI Ethiopian Development Research Institute EEPRI Ethiopian Economic Policy Research Institute EIAR Ethiopian Institute of Agricultural Research EU European Union EU RESET European Union Resilience Building program in Ethiopia FANC Focused Antenatal Care FEFO First Expire First Out FFW Food for Work FIFO First In First Out GDP Gross Domestic Production GoE Government of Ethiopia GO Government Organization HABP Household Asset Building Program HDA Health Development Army HEP Health Extension Program HIV Human Immuno-deficiency Virus ICCM Integrated Community Case Management IFPRI International Food Policy research Institute ILRI International Livestock Research Institute IWMI International Water Management Institute IMNCI Integrated Management of Now-born and Childhood Illnesses IPLS Integrated Pharmaceutical Logistic System IUCD Intrauterine Contraceptive Device IYCF Infant and Young Child Feeding LARC Long Acting Reversible Contraception MAM Moderate Acute Malnutrition MI Micro Insurance NRM Natural Resource Management NGO Non-Government Organization ODF Open Defecation Free ORS Oral Rehydration Salt OTP Oral Therapeutic Program PMTCT Prevention of Mother to Child Transmission PSNP Productive Safety Net Program SAM Severe Acute Malnutrition SBA Skilled Birth Attendant SC Stabilization Centre SCM Supply Chain Management SLM Sustainable Land Management SNNPR Southern Nations, Nationalities and Peoples Region TVET Technical and Vocational Education and Training WASH Water, Sanitation and Hygiene
4
Abstract
Despite the successive remarkable economic growth achieved in Ethiopia since 2005/6, the vulnerability of Ethiopia's rural population to drought induced crisis situations still prevails, affecting around 12 million resource poor food insecure small holder farmers, agro-pastoralists and pastoralists. Towards overcoming this development problem, different concerned stakeholders including the government of Ethiopia (GoE) and its development partners have been implementing various interventions. However, poverty, malnutrition and vulnerability to crises still remain high in the country. The implication is that dealing with the root causes of vulnerabilities, rather than with their consequences, and working towards achieving long term food security at household level in Ethiopia are still a huge and complex task. Supporting resilience building is a long-term undertaking that requires strategies and programs designed to jointly address a set of multi-sectorial causes in order to generate multiple benefits. In this regard, development partners like EU has launched a resilience building program called EU-RESET in Ethiopia. The program is designed based on four cornerstones for building resilience including improving the provision of basic services, support to livelihoods, safety nets, and disaster risk reduction. Besides, it adopts a geographically-focused approach that covers most vulnerable cluster areas in five regional states of Ethiopia. With the aim of identifying feasible interventions to build resilience in vulnerable rural areas of the country, a detail situation analyses is made in a sample of these cluster areas. The study mainly uses detail field level qualitative data, supplemented by secondary quantitative data. We also made detail review of country’s policy and literature related to vulnerability and resilience. This report contains an executive summary of the analyses and, based on the findings of the situation analyses, proposed intervention options to build the resilience of vulnerable communities. Since the geographical areas covered in the study can represent almost all vulnerable rural areas of the country, the findings and intervention options suggested by the study can also be an input for policy makers and development partners to design interventions to build resilience in similar areas, with some adoptions to the specific features of their intervention areas. The study can also contribute to the limited empirical evidence on resilience building in vulnerable part of developing countries, particularly in Sub Saharan African countries.
1
1. Introduction
Ethiopia has achieved significant economic development during the past ten years including
a steady increase of production in the agriculture sector. During the past ten years, the
annual GDP growth has registered a steady increase of annual average 10% with poverty
rate reduced from 40% to 29% and significant increase of access to basic services (Heath,
potable water supply, education, etc). However, the vulnerability of Ethiopia's rural
population to drought induced crisis situations still prevails affecting around 12 million
resource poor food insecure small holder farmers, agro-pastoralists and pastoralists1.
Towards this, various interventions have been implemented to overcome the vulnerability of
Ethiopia’s rural population by different concerned stakeholders including the government of
Ethiopia (GoE), regional organizations such as IGAD and donors (EU) since the past 10
years. For instance, the humanitarian needs are often well covered through the annual
emergency relief food aid appeal mechanism, which covered on average 3.5 million people
per year for one decade. Another intervention since 2005 is the Productive Safety Net
Programme, which has provided an important safety net for around 7 million chronically food
insecure rural households. Besides, the GoE under its Growth and Transformation Plan is
committed to achieve national food sufficiency by doubling agricultural production through
intensified small holder production system. The recently issued GoE - Disaster Risk
Management Strategic Program and Investment Framework (DRM-SPIF) envisions a future
where, disaster risk is prevented, mitigated and forecast to enable effective response.
Besides, based on the IGAD Drought Resilience and Sustainability Initiative (IDDRSI)
framework, the GoE has developed a Country Program Paper (CPP) as strategy and
framework for resilience actions in Ethiopia in 2012. At regional levels, IGAD put in place the
Drought Disaster Resilience and Sustainability Initiative (IDDRSI) as a framework to provide
a roadmap for ending drought emergencies in the IGAD region.
However, poverty, malnutrition and vulnerability to crises still remain high in the country.
Though poverty has decreased, 29% of the total population are still absolute poor, with an
estimated 46% of the rural population are still vulnerable to absolute poverty, of these, nearly
half still live in areas not covered by transfers from the PSNP. Besides, though malnutrition
has decreased, it still remains high, with 44.4% of children stunted, 28.7% of children
underweight and 9.7% of children wasted; and 27% of women underweight. This shows that
1 We thank the EU – Delegation to Ethiopia for funding this research.
2
in Ethiopia, the main concern is to build the resilience of the most vulnerable people and
communities to the impacts of shocks, in particular drought.
The implication is that not only that dealing with the vulnerabilities and root causes of crises
has become the priority rather than dealing only with their consequences but also that
achieving long term food security in Ethiopia is still a huge and complex task. This task
requires coordinated approaches to tackle the whole range of risks and stress factors that
induce crises, and address the structural causes of vulnerability with effective packages of
short and long term interventions. Supporting resilience building is a long-term undertaking
that requires strategies and programmes designed to jointly address a set of multi-sectorial
causes in order to generate multiple benefits. This concept is embedded in EU’s resilience
approach to its external development assistance to Ethiopia. With the aim of simultaneously
tackling the whole range of key risks and stress factors that induce crises and addressing
the structural causes of vulnerability, EU has launched an innovative initiative called RESET
that brings together at operational level ECHO and the EU Delegation in Ethiopia in a
tangible LRRD process2. The RESET approach is based on the premise that chronic
humanitarian and longer term needs and recurrent food insecurity, mainly - but not only -
caused by drought can be more efficiently addressed via a longer term resilience approach,
with better synergies and complementarities between the two EU financing instruments, the
EU ECHO humanitarian rapid responses and the EU DEVCO recovery and long term
resilience building interventions. The objective of the EU RESET program is to build the
resilience and expand the coping capacities of the most vulnerable populations in the
country. The concept of RESET is based on four cornerstones for building resilience
including improving the provision of basic services, support to livelihoods, safety nets, and
disaster risk reduction. These pillars are complemented by other areas of support such as
natural resource management, sustainable land management, climate change adaptation
and social protection. The EU RESET programme is following a geographically-focused
approach whereby currently eight clusters of woredas are selected in highly food insecure
and drought prone areas. The eight clusters cover 41 woredas and more than 2.5 million
people spread across five regions (Somali, Oromia, Afar, Amhara and SNNPR)3. The
2 EU has launched initiatives such as "Supporting Horn of Africa Resilience – SHARE'' (Euro 275 million) to
advance food security, sustainable agriculture and resilience in the Horn of Africa and address drought resilience through a combined humanitarian and development approach. The strategic objective of the EU SHARE program is to contribute towards averting the underlying causes of food insecurity through integrated actions and strengthening LRRD (Linking Relief to Rehabilitation and Development) to bring sustainable livelihood for the vulnerable rural population in lowland agro-pastoral areas.
3 According to the EU RESET program, the clusters represent some 10 to 15 % of the overall population in the
country who are vulnerable to disaster risk and in need of interventions that build their resilience.
3
clusters are composed of three to eight woredas. As an input to the EU RESET program, we
have conducted comprehensive analyses of the baseline situations of the eight cluster
areas. Based on the findings of this study, we have proposed a relevant and feasible
strategy options that guides interventions that aim at building resilience in rural areas of the
eight geographical clusters. Though this study focuses on EU RESET intervention areas,
given the socio economic, geographical, and environmental characteristics of the study
areas, we believe that the study areas can represent vulnerable communities in rural areas
of Ethiopia, in particular, and Africa, in general. Thus, we believe that the study can have
substantial contribution to policy makers and development partners who work towards
building resilience in vulnerable rural areas of Ethiopia and African countries.
This report contains an executive summary of the study on the baseline situation of the eight
cluster areas and the proposed strategic options towards building resilience in most
vulnerable communities in rural areas of Ethiopia. The report is organized into five sections
including this introduction section.4 The second section briefly outlines the study approach,
section three presents an executive summary of the findings on the baseline situation
analyses study. The section is divided into five subsections. The subsections contain the
basic context, livelihood profile, health and nutrition; and natural resource and disaster risk
management situations as well as the review of the policy and institutional aspects of
resilience building at national and local levels. The fourth section presents the findings on
the gaps and opportunities for building resilience, which are the bases for identifying the
strategy options for future interventions to build the resilience. The last section presents the
strategic options.
2. Methodology
2.1 Conceptual Framework
The four cornerstones of a more global resilience building framework encompass disaster
risk management, livelihood building, strengthening basic social services, and increasing
access to safety nets (EU-RESET Programme, 2014). Key characteristics of resilient
communities include food, nutrition and environmental security. Accordingly, we adopted a
conceptual framework which looks into resilience building in the lens of development. The
4 The overall report on the comprehensive baseline situational analyses study is organized in to five volumes.
The first volume is this executive summary; volume two is the main situation assessment study report; volume
three is annexes for the main report; volume four contains the agricultural profile of the eight cluster areas
and volume five contains spatial and accessibility maps of the eight cluster areas. A separate volume is also
prepared for the detail analyses made on the identification of strategic options. Readers can request the detail
study at [email protected]
4
framework conceptualizes the link between resilience, on the one hand, and livelihood
strategy, health and nutrition and natural resource and disaster risk management, on the
other hand. It also looks into how these key components of resilience (including livelihood
strategy, health and nutrition as well as NR and DRM) should create linkage among
themselves so as to build resilience in the vulnerable communities.
One important implication of this is that a development approach is embedded in the notion
of resilience building in which due emphasis is given to systemic approach rather than in
isolation. It also implies thinking holistically about development interventions that crosscut
livelihood strategy, health and nutrition, natural resource and risk management. Finally, it
has also important implications in measuring resilience in terms of livelihood asset, food and
nutrition security and access to basic service at individual and household levels but also for
the policy, institutions, and governance systems required to build resilience.
2.2 Data
The situation assessment is done using information primarily collected from field and
nationally representative datasets collected by the Central Statistical Agency. The study
collected qualitative information from 19 sample woredas selected from each of the eight
clusters. Since the clusters areas and woredas encompassed a diverse array of agro-
ecological, cultural and religious diversity, we covered 50% of woredas in the clusters in the
field work to collect primary information. The field survey covered at least one kebele from
sample woreda. We selected sample woredas and kebeles based on agro-ecology and
livelihood characteristics of the woredas to represent pastoral and agro-pastoral livelihood
system.
We also used data collected by the Central Statistical Agency, including surveys on
agricultural sample, rural facility and land use. When cluster-level survey is not available, we
used regional and national-level reports such as DHS, HICE and WMS. Other secondary
sources such as policy documents and review of findings of other studies are also used to
enrich our dataset. These sources were used extensively in analyzing the agriculture profiles
and access to basic facilities.
2.3 Survey Instruments
We employed qualitative survey approach in which information on various issues are
collected using livelihood trajectory exercise, institutional and organizational ranking, field
level physical observation as well as stakeholder consultations. We used focus group
discussions and key informant interviews to collect primary field-level information. We
conducted 46 FGD with 372 community representatives, of which 166 (45%) are female. The
5
cluster-level key informant interviews covered 248 zone and woreda officials in
administration and sector offices. Stakeholder consultation and briefing meeting was
conducted with non-government organizations working in the clusters.
We collected information from field on various issues including community livelihoods, food
security status, wealth profile and perception of inequality; cultural and gender dimensions of
livelihoods; institutional and organizational characteristics; natural resource management;
and health and nutrition profiles. We also collected information on the major development
challenges and priority needs. The key informant interviews included priority role/area of
focus, implementation strategy, development gaps/challenges, opportunities as well as
priority needs for the cluster.
2.4 Analyses
The analyses on the baseline situation include analysis of contextual issues, livelihood,
health and nutrition, natural resource and disaster risk management, and policies and
institutions related to resilience building. In all the thematic areas, we tried to understand the
trends, current status and the underlying challenges and opportunities that are important for
resilience building. The assessment is done using descriptive analyses, review of policy and
strategy documents, GIS mapping and other qualitative methods such as livelihood
trajectory, food and water security calendar, wealth ranking, farm and non-farm employment
profiling, institutional ranking, and trend analyses.
2.5 Limitation
The advantage of using different sources of information is that it enriches the analyses.
However, it has a disadvantage particularly when the different sources give different data for
the same variable. In our case, we faced this problem, in which case, we triangulated the
different sources of information. The major limitation of this study is that it is based on
qualitative data since it did not collect its own quantitative data. However, we supplement our
qualitative survey with quantitative information generated through other sources. This data is
either made for national or regional level or they are not up-to-date. Though we tried to use
disaggregated data at cluster level, there are cases where we used regional level figures,
particularly in health and nutrition outcomes.

6
3. Baseline Situation of the Vulnerable Communities
This section presents the summary of the key findings that characterize the baseline
situations of the vulnerable communities, the underlying factors that drive for the prevailing
situations as well as the gender dimensions of the key thematic areas that together make up
resilience for vulnerable communities. It is presented in five subsections.
3.1 Basic Context
This subsection presents information that characterizes the basic situation related to
individual-specific and covariate factors for resilience.
3.1.1 Demographics
About 3.5 million people live in all the eight cluster areas (Table 1). The largest population is
found in Liben and Wolaita, where the population is 640,940 and 638,400, respectively. The
proportion of females in the population ranges from 45% in Afar to 51% in Wolaita. About
15% of the population is under age five, 19% are five to 14 years old, and 36% are 15 to 34
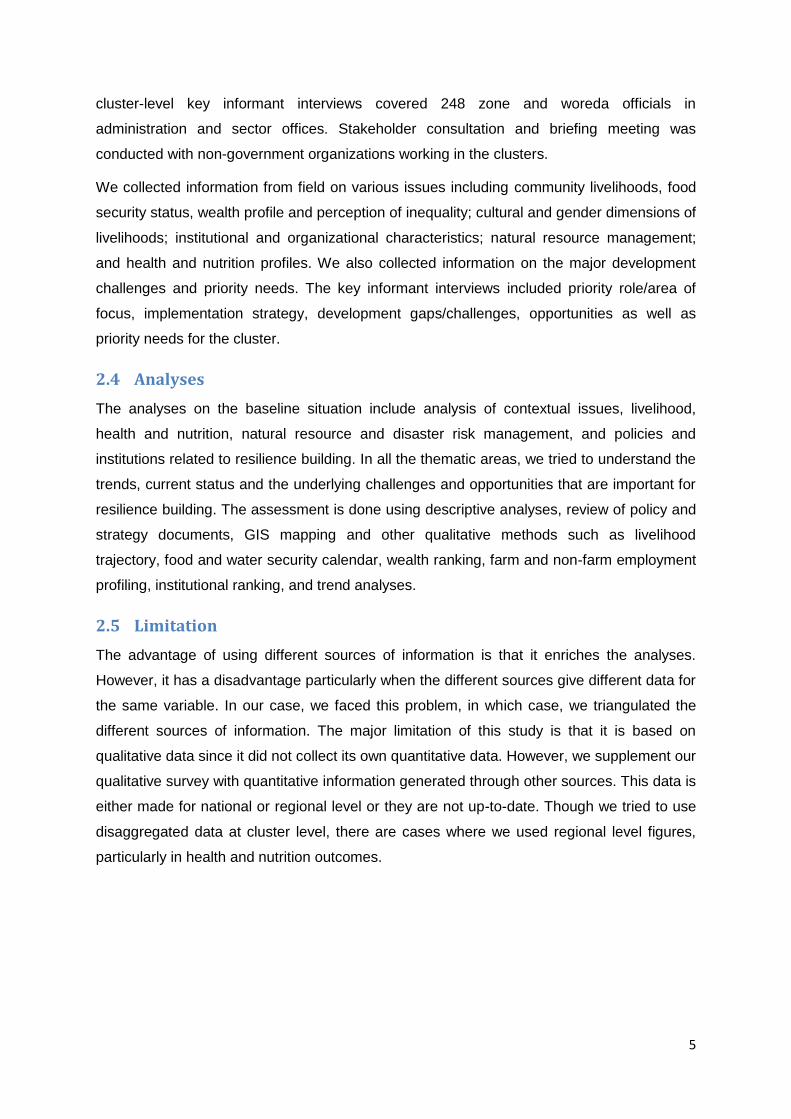
years old (Figure 1).
Table 1: Population by sex in cluster areas (2016 projection)
Cluster Num. woredas Male Female Total % female
Waghimra 6 234,536 234,829 469,365 50
Afar 8 254,343 208,575 462,918 45
Siti 5 246,121 229,484 468,392 49
Liben 5 341,803 299,137 640,940 47
Bale 5 179,387 174,607 353,994 49
Borena 6 160,173 158,193 318,365 49
Wolaita 4 310,974 327,426 638,400 51
South Omo 3 80,571 78,910 159,481 49
Total 42 1,807,908 1,711,161 3,511,855 49
Source: CSA (2013)
7
Figure 1: Share of population by age group (based on CSA projection for the year 2016)
Source: CSA (2013)
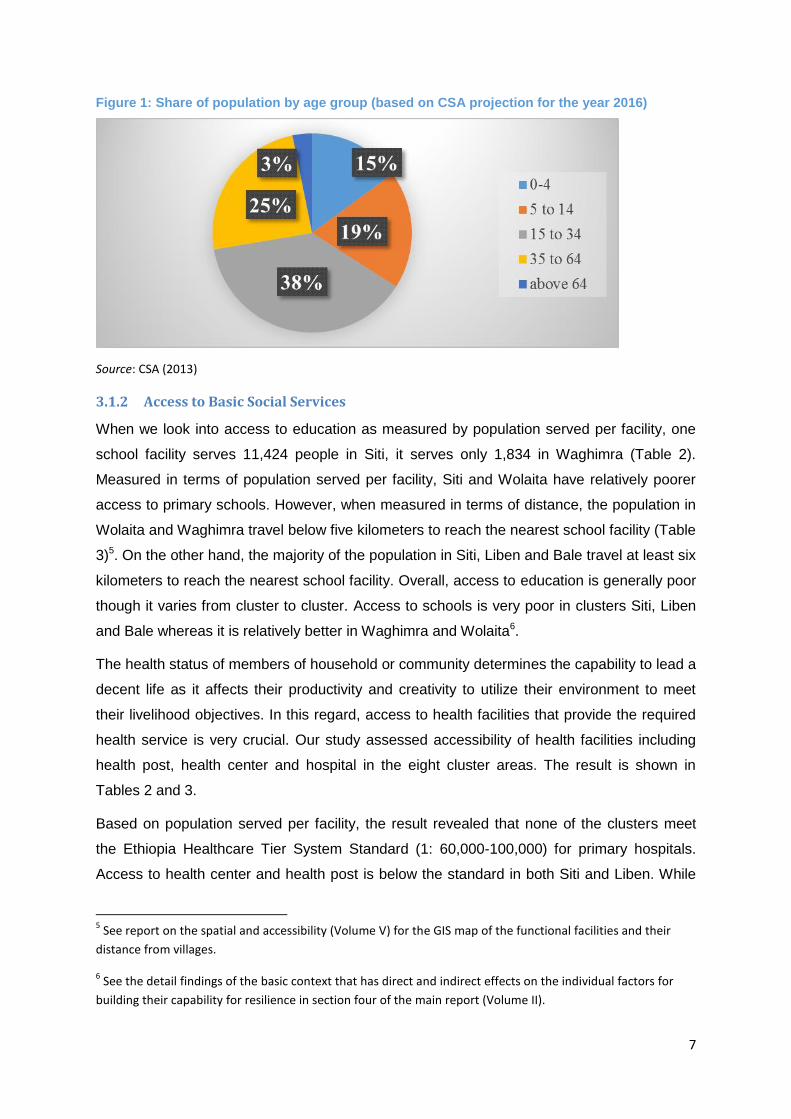
3.1.2 Access to Basic Social Services
When we look into access to education as measured by population served per facility, one
school facility serves 11,424 people in Siti, it serves only 1,834 in Waghimra (Table 2).
Measured in terms of population served per facility, Siti and Wolaita have relatively poorer
access to primary schools. However, when measured in terms of distance, the population in
Wolaita and Waghimra travel below five kilometers to reach the nearest school facility (Table
3)5. On the other hand, the majority of the population in Siti, Liben and Bale travel at least six
kilometers to reach the nearest school facility. Overall, access to education is generally poor
though it varies from cluster to cluster. Access to schools is very poor in clusters Siti, Liben
and Bale whereas it is relatively better in Waghimra and Wolaita6.
The health status of members of household or community determines the capability to lead a
decent life as it affects their productivity and creativity to utilize their environment to meet
their livelihood objectives. In this regard, access to health facilities that provide the required
health service is very crucial. Our study assessed accessibility of health facilities including
health post, health center and hospital in the eight cluster areas. The result is shown in
Tables 2 and 3.
Based on population served per facility, the result revealed that none of the clusters meet
the Ethiopia Healthcare Tier System Standard (1: 60,000-100,000) for primary hospitals.
Access to health center and health post is below the standard in both Siti and Liben. While
5 See report on the spatial and accessibility (Volume V) for the GIS map of the functional facilities and their
distance from villages.
6 See the detail findings of the basic context that has direct and indirect effects on the individual factors for
building their capability for resilience in section four of the main report (Volume II).

8
Wolaita and South Omo did not meet the standard for health center (1:15,000-25,000), Afar
did not meet the standard for health post (1:3000-5000). With regard to coverage based on
distance, 82%, 78% and 58% of the population in Siti, Liben and Borena, respectively, travel
at least 6 kilometers to reach to the nearest health facility, respectively. Overall, communities
in almost all cluster areas have poor access to health service, measured in terms of
population served per facility and distance traveled to reach the nearest services7.
Table 2: Access to basic social facilities (school, health and water supply)
Cluster Primary school Health center Health post Hospital Protected water supply
No. Ratio No. Ratio No. Ratio No. Ratio No. Ratio
Waghimra 256 1,833 31 15,140 125 3,754 3 156,455 544 862
Afar 153 3,025 22 21,041 75 6,172 1 462,918 263 1,760
Siti 41 11,424 11 42,581 51 9,1847 40 11,709
Liben 109 4,746 19 33,733 124 5,1681 40 16,023
Bale 823 430 19 18,631 90 3,9337 1 353,994 135 2,622
Borena 149 2,136 27 11,791 89 3,5775 414 769
Wolaita 159 4,015 22 29,018 128 4,987 486 1,313
South Omo 76 2,098 6 26,580 59 2,7038 108 1,476
Source: own calculation based on CSA facility survey (CSA, 2014)
In terms of access to potable water supply, communities in the EU RESET cluster areas use
different sources of water, both protected and unprotected. In all cluster areas, bono, open
pond, unprotected spring and water from deep well are the most common water schemes
though the number and types of schemes differ from cluster to cluster. The population
served per scheme and distance traveled to reach to the nearest protected water supply
scheme is shown in Tables 2 and 3. In terms of number of people with access to protected
water supply schemes, on average 1409 and 1314 people obtain services from one
protected water supply scheme in Wolaita and Borena, respectively. On the other hand, one
protected water supply scheme serves 37,702 and 13,382 people in Liben and Siti,
respectively. People who live in about 59% of the villages of the clusters travel at least 10
kilometers to get water for drinking and other domestic use including livestock drinking. This
also holds true for at least 61% of the villages in Liben (Table 3).
7 Section 3 describes the health service (and, thus, outcome) situations in detail based on provision of service
and utilization on the available health facilities in each of the cluster areas.
9
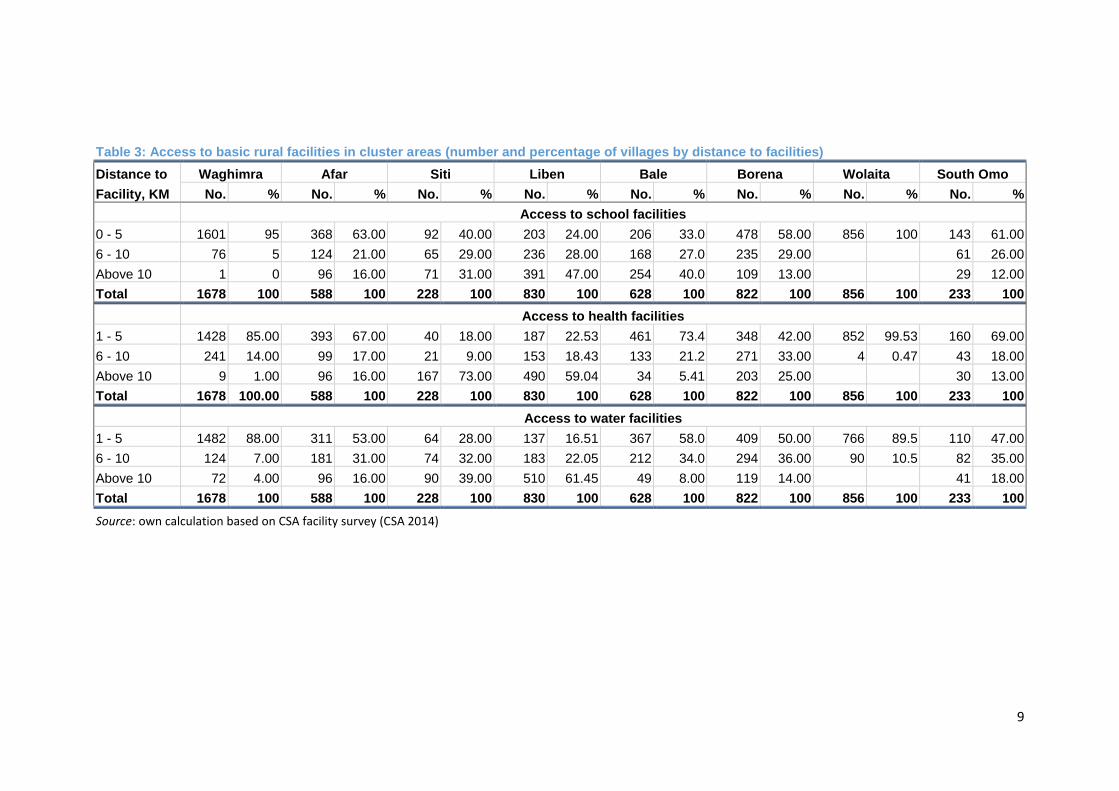
Table 3: Access to basic rural facilities in cluster areas (number and percentage of villages by distance to facilities)
Distance to Waghimra Afar Siti Liben Bale Borena Wolaita South Omo
Facility, KM No. % No. % No. % No. % No. % No. % No. % No. %
Access to school facilities
0 - 5 1601 95 368 63.00 92 40.00 203 24.00 206 33.0 478 58.00 856 100 143 61.00
6 - 10 76 5 124 21.00 65 29.00 236 28.00 168 27.0 235 29.00 61 26.00
Above 10 1 0 96 16.00 71 31.00 391 47.00 254 40.0 109 13.00 29 12.00
Total 1678 100 588 100 228 100 830 100 628 100 822 100 856 100 233 100
Access to health facilities
1 - 5 1428 85.00 393 67.00 40 18.00 187 22.53 461 73.4 348 42.00 852 99.53 160 69.00
6 - 10 241 14.00 99 17.00 21 9.00 153 18.43 133 21.2 271 33.00 4 0.47 43 18.00
Above 10 9 1.00 96 16.00 167 73.00 490 59.04 34 5.41 203 25.00 30 13.00
Total 1678 100.00 588 100 228 100 830 100 628 100 822 100 856 100 233 100
Access to water facilities
1 - 5 1482 88.00 311 53.00 64 28.00 137 16.51 367 58.0 409 50.00 766 89.5 110 47.00
6 - 10 124 7.00 181 31.00 74 32.00 183 22.05 212 34.0 294 36.00 90 10.5 82 35.00
Above 10 72 4.00 96 16.00 90 39.00 510 61.45 49 8.00 119 14.00 41 18.00
Total 1678 100 588 100 228 100 830 100 628 100 822 100 856 100 233 100
Source: own calculation based on CSA facility survey (CSA 2014)
10
3.1.3 Access to Public Services and Basic Infrastructure
Access to public services
Access to basic infrastructure is an important factor in building the resilience of vulnerable
communities or individual households. Infrastructure facilitates the capability of individuals to
access available opportunities and thereby improve their productivity which, finally,
contribute to alleviate poverty and build their resilience to shocks. The study assessed
availability of such infrastructure as agricultural services, commercial services, public
services. Access to public services is generally poor though it varies from cluster to cluster.
For instance, access to such services is better in clusters Waghimra, Borena and Wolaita.
Similar to access to basic social services, Siti and Liben have no such access. These
services are also poor in South Omo.
Access to infrastructure
In terms of basic infrastructure including road, telecommunication and electricity, our study
revealed that Waghimra and Afar are connected to the main asphalt road (Table 4). In
Waghimra, almost all the cluster woredas are linked with accessible road facility and have
electrification and telecommunication facilities. There are also accessible roads that link
kebele to kebele. In Siti, road problem is common and very serious problem in all the
woredas and kebeles in the zone. In Liben, road accessibility is major problem. Even all
weredas are not connected through all-whether roads yet. Other than kebeles that are found
along the main road, kebele-to-woreda roads are seasonal.
Almost all woreda capital towns in all cluster areas have access to telecommunication in the
form of fixed, wireless and/or mobile phone. However, it is rare situation to get such access
in the rural kebeles of all clusters. However, there is variation among the clusters. In Siti, like
the road and other basic social services, access to telecommunications service is very poor
whilst such services are very rarely functional in Liben. Like the other basic social services,
access to telecommunication is relatively better in Wolaita. Similarly, while almost all woreda
towns in all clusters have access to electricity, it varies among the clusters in terms of
duration of getting the service. While woreda towns in Wolaita have relatively better access
to this service, it is very poor in Siti.
Generally, the basic situation of all the clusters in terms of access to basic social services
and infrastructures is very poor though it varies from cluster to cluster. While communities in
Wolaita fare relatively better in terms of access, communities in Siti have extremely poor
access. Such situation has important implications for resilience building since it
fundamentally affects their livelihood and thereby their food security status. Therefore, such

11
situation suggests not only that people in all clusters are vulnerable to any kind of shock but
also that the degree of vulnerability varies from cluster to cluster as well as within a cluster.
Table 4: Access to basic infrastructure in cluster areas
Cluster Road Electricity Telephone Overall
Waghimra All woredas linked
Woreda–kebele linked
Access at woreda town
Poor at kebele level
Access at woreda town, poor at kebele level
Better access
Afar All woredas linked
Woreda–kebele linked
Limited access at woreda towns, not kebeles
Access at woreda town and kebele level
Better access
Siti Major problem Very limited access Very limited access Very poor
Liben Major problem Limited access Limited access Very poor
Bale Woreda–woreda linked
Woreda–kebele: limited
Limited access at woreda towns
Limited access Poor
Borena Woreda–woreda linked
Woreda–kebele: limited
Limited access at woreda town, not kebeles
Limited access Poor
Wolaita Woreda–woreda linked
Woreda–kebele linked
Access at woreda town
Access to some kebele
Access at woreda and kebele level
Better access
South Omo Woreda–woreda linked
Woreda–kebele linked
Access at woreda level Access at woreda level and some kebele level
Better access
Source: Own data from site visits.
3.2 Livelihood Profile
The study analyzed the trends and current status of the livelihood profile of the eight cluster
areas, the underlying driving factors as well as its gender dimensions. The analyses is made
in terms of livelihood system, asset, livelihood strategies, wealth and food and water
security. The key findings are summarized as follows8.
3.2.1 Livelihood System
The livelihood assessment revealed that the principal livelihood systems include pastoralism
(only raising livestock), agro-pastoralism (livestock raising with crop production), crop
production with livestock raising as minor and variety of non-agricultural activities. The main
form of livelihood in Afar, Siti, Liben, Borena, and South Omo is raising livestock. Majority of
the households depend on this system and significant number integrate raising livestock with
crop production as minor. For instance, in Afar and Liben, pastoralists are encouraged to
practice crop and vegetable production by making irrigation infrastructure available and
resettlement program. In Waghimra and Wolayita crop production is the main livelihood
system. Most households in this cluster integrate crop production with raising livestock as
8 See the detail findings of the livelihood aspects of resilience in section five of the main report (Volume II).
12
minor. In cluster Bale, agro-pastoralists are dominant. From 18 weredas in the zone, nine
are dominantly pastoralists and the other nine weredas' livelihood system is majorly crop
production with livestock raising as minor. Honey production and fishery are emerging
livelihood systems which need support.
Non-agricultural activities are also practiced in some clusters. Non-agricultural activities like
wage employment, handicrafts (weaving, spinning, carpentry, house mudding, pottery, etc),
petty trade (firewood selling, charcoal selling, local brewed alcohol), livestock trading, grain
trading, gum and incense selling, fruits and vegetables trading are practiced in the clusters.
Most non-agricultural activities are main copying mechanisms to fill the food shortage gaps.
3.2.2 Livelihood Assets
The two major livelihood assets in the EU RESET cluster areas are land and livestock. In
almost all cluster areas, one of the fundamental assets for livelihood, land, is not only an
extremely expensive natural resource but also that it is less productive. This problem is
being manifested in most clusters in different forms including very poor fertility and
fragmented and very small size of holding. Availability of land for crop production is being
deteriorated by size due to population growth and also becoming less productive as it is over
utilized in a very traditional system.
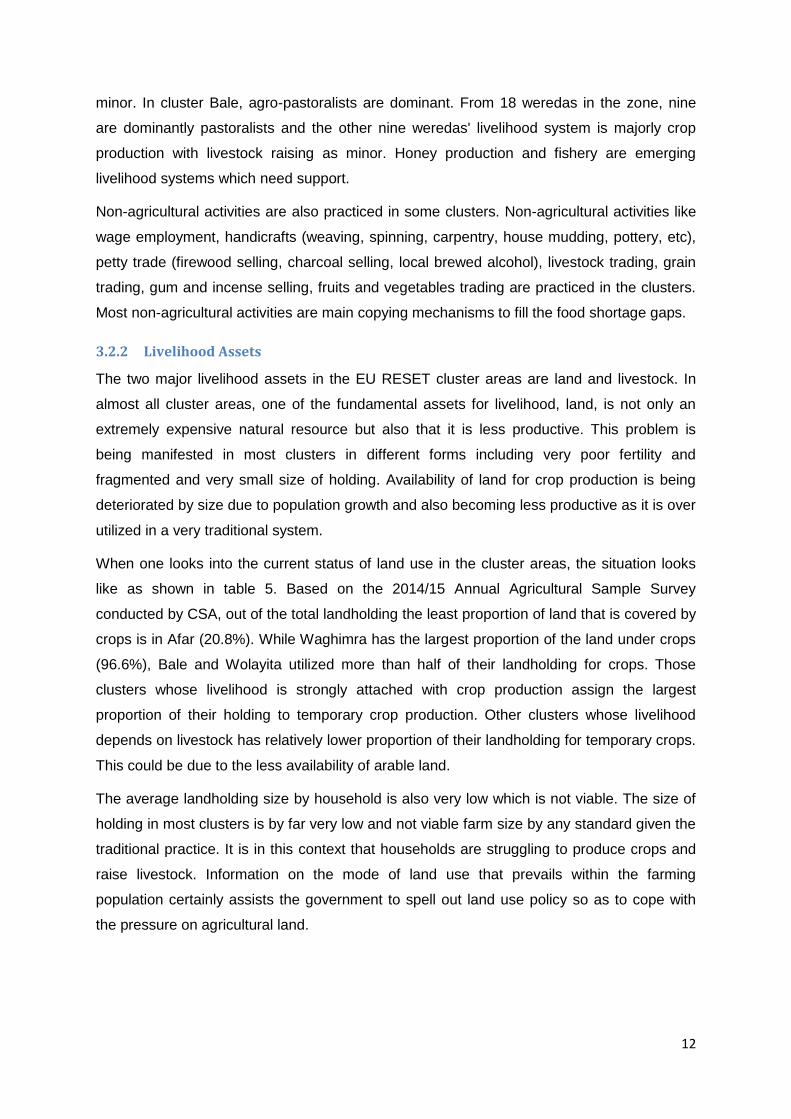
When one looks into the current status of land use in the cluster areas, the situation looks
like as shown in table 5. Based on the 2014/15 Annual Agricultural Sample Survey
conducted by CSA, out of the total landholding the least proportion of land that is covered by
crops is in Afar (20.8%). While Waghimra has the largest proportion of the land under crops
(96.6%), Bale and Wolayita utilized more than half of their landholding for crops. Those
clusters whose livelihood is strongly attached with crop production assign the largest
proportion of their holding to temporary crop production. Other clusters whose livelihood
depends on livestock has relatively lower proportion of their landholding for temporary crops.
This could be due to the less availability of arable land.
The average landholding size by household is also very low which is not viable. The size of
holding in most clusters is by far very low and not viable farm size by any standard given the
traditional practice. It is in this context that households are struggling to produce crops and
raise livestock. Information on the mode of land use that prevails within the farming
population certainly assists the government to spell out land use policy so as to cope with
the pressure on agricultural land.
13
Table 5: Land use patterns (% of total) in cluster areas
Land Use Waghimra Afar Siti Liben Bale Borena Wolayta South Omo
Temporary crops 96.5 19.4 42.8 51.3 63.3 43.0 53.4 71.0
Permanent crops 0.1 1.4 15.0 3.0 5.2 23.6 14.7 8.0
Fallow land 1.8 0.7 0.4 2.8 1.9 4.7 0.2 7.1
Grazing 0.1 1.6 17.5 7.9 16.2 14.6 16.2 8.2
Woodland 0.1 0.0 3.8 0.0 0.8 0.5 6.3 0.9
Others 1.4 77.0 20.4 35.0 12.7 13.6 9.2 4.7
Landholding size, ha 1.1 0.65 0.37 0.35 1.37 0.44 0.36 0.57
Source: CSA, Annual Agricultural Sample Survey 2014/15.
The other most important asset holding of the clusters is livestock. There are huge numbers
of livestock with poor quality. In addition, the size of livestock is also on diminishing trend.
Because of this, the benefit derived from livestock is not commensurate to the size of
livestock and is on decline. The main reason for this is that livestock is being raised in
traditional system. There are several and reinforcing reasons for this traditional system.
Pastoralists attach high value not to the quality as such but to the size of livestock. The size
of livestock is a symbol of richness and provides one high social status in the community.
Thus, pastoralists do not want to sale their livestock (unless they are desperate) and hence
no incentive for them to keep less number with high quality. Market/generating income is not
the driving force for raising livestock in the pastoral areas.
3.2.3 Crop Production, Productivity and Technology Use
Crop production is not a serious engagement in Afar, Siti and Liben though they grow few
crops. This is basically due to their focus on raising livestock as a main source of livelihood
and also social value attached to the stock of livestock. In the other clusters, crop production
is practiced in a very traditional way and because of this the productivity of land is not
encouraging though it differs from cluster to cluster. Waghimra, Bale, Wolayita and South
Omo produces all the five types of major crops including teff, barley, maize, wheat and
sorghum. While teff yield is 15.6 quintal per hectare in Waghimra, in Afar and 6 it is as high
as 36.5 quintal. The same story holds for wheat, sorghum and barley. The highest yield per
hectare for wheat and barley is recorded in Bale, about 31.0 and 21.6 quintals, respectively.
Technology application that improves yield is very limited. It is reported that in 2014/15 crop
season, Afar, Siti, Liben, and Borena did not use any inputs like fertilizer, improved seeds
and pesticides. Pesticides are applied only in Bale. Even those clusters which applied inputs
have problems of getting enough.
14
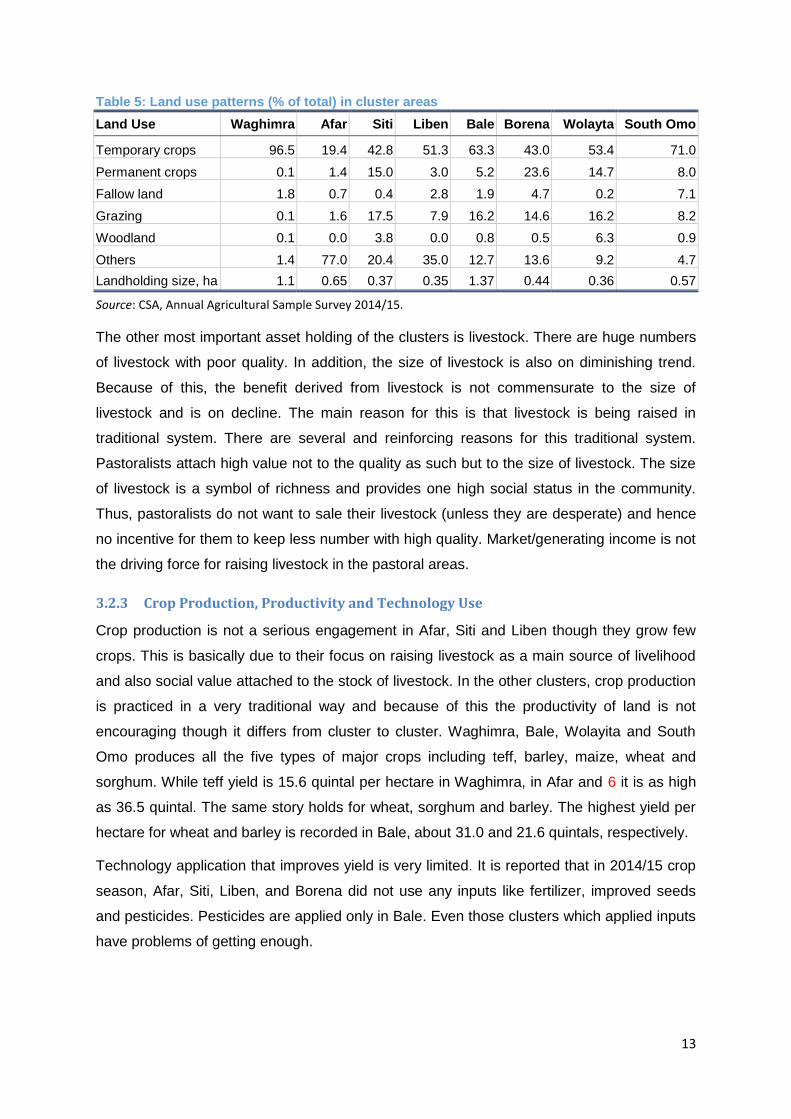
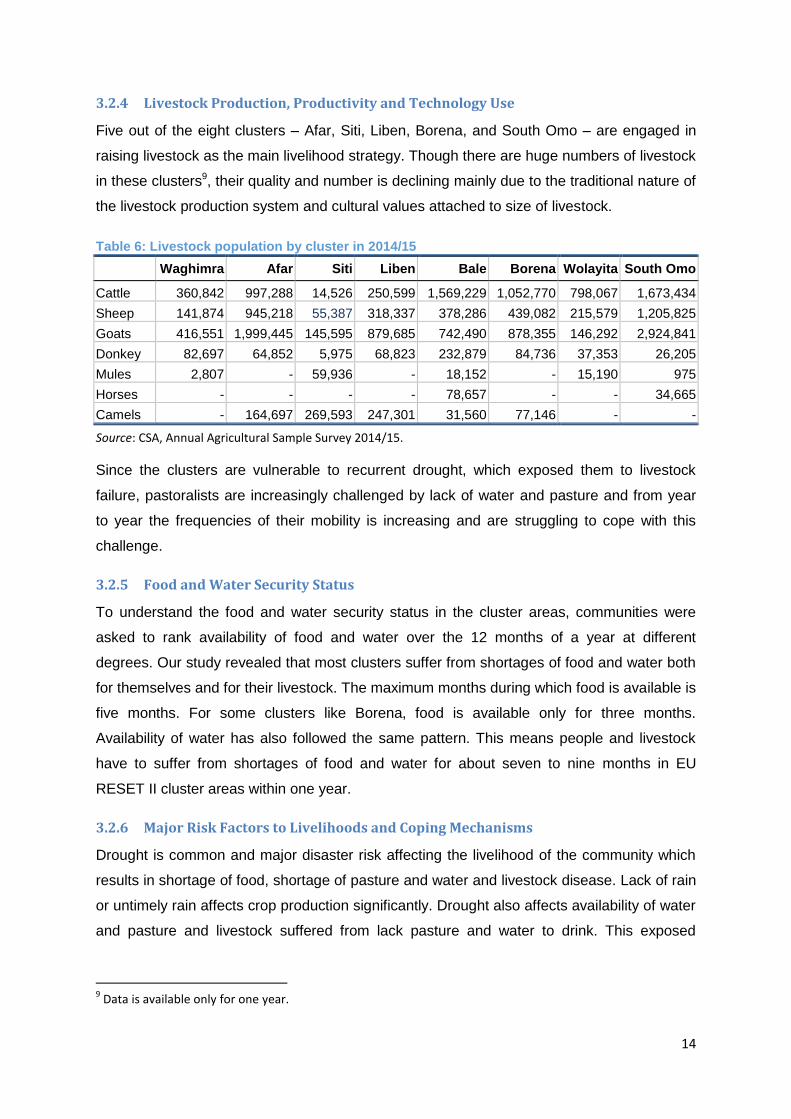
3.2.4 Livestock Production, Productivity and Technology Use
Five out of the eight clusters – Afar, Siti, Liben, Borena, and South Omo – are engaged in
raising livestock as the main livelihood strategy. Though there are huge numbers of livestock
in these clusters9, their quality and number is declining mainly due to the traditional nature of
the livestock production system and cultural values attached to size of livestock.
Table 6: Livestock population by cluster in 2014/15
Waghimra Afar Siti Liben Bale Borena Wolayita South Omo
Cattle 360,842 997,288 14,526 250,599 1,569,229 1,052,770 798,067 1,673,434
Sheep 141,874 945,218 55,387 318,337 378,286 439,082 215,579 1,205,825
Goats 416,551 1,999,445 145,595 879,685 742,490 878,355 146,292 2,924,841
Donkey 82,697 64,852 5,975 68,823 232,879 84,736 37,353 26,205
Mules 2,807 - 59,936 - 18,152 - 15,190 975
Horses - - - - 78,657 - - 34,665
Camels - 164,697 269,593 247,301 31,560 77,146 - -
Source: CSA, Annual Agricultural Sample Survey 2014/15.
Since the clusters are vulnerable to recurrent drought, which exposed them to livestock
failure, pastoralists are increasingly challenged by lack of water and pasture and from year
to year the frequencies of their mobility is increasing and are struggling to cope with this
challenge.
3.2.5 Food and Water Security Status
To understand the food and water security status in the cluster areas, communities were
asked to rank availability of food and water over the 12 months of a year at different
degrees. Our study revealed that most clusters suffer from shortages of food and water both
for themselves and for their livestock. The maximum months during which food is available is
five months. For some clusters like Borena, food is available only for three months.
Availability of water has also followed the same pattern. This means people and livestock
have to suffer from shortages of food and water for about seven to nine months in EU
RESET II cluster areas within one year.
3.2.6 Major Risk Factors to Livelihoods and Coping Mechanisms
Drought is common and major disaster risk affecting the livelihood of the community which
results in shortage of food, shortage of pasture and water and livestock disease. Lack of rain
or untimely rain affects crop production significantly. Drought also affects availability of water
and pasture and livestock suffered from lack pasture and water to drink. This exposed
9 Data is available only for one year.
15
livestock to various diseases that culminate in death and loss of weight with the resultant low
price.
Violent conflict between sub-clans is another risk factor for livelihood particularly in Siti.
Flood is also a risk factor in all clusters except in Waghimra, Siti and Bale. Crop disease is a
major risk factor in Bale. The types of livestock to be raised, the crop mix cultivated by
peasants, and the cropping calendar are explained by the spatial and temporal distribution of
rainfall. Thus, for rainfall dependent economy, both extreme situations of scarcity and excess
would function against people’s livelihood to a great extent, hampering the main production
activities, the outcome of which is seen in the shortage of food supply. Water scarcity
brought about by delay in rainfall from the normal period of occurrence, or even a complete
failure constitutes drought and cause crop failure and weight loss or death of livestock.
Both the pastoralists and agro-pastoralists had practiced some survival strategies to cope
with drought. Some of the major coping mechanisms adopted in the cluster areas include
livelihood diversification; building water reservoirs such as water pond, water pool, birka,
water well/ella and small dams to reserve water for consumption during the dry season;
reducing daily food consumption; substituting for less expensive foods, eating wild food (less
preferable in normal season), borrowing food or money and direct consumption of sheep and
goat; sale of livestock, sale of fire wood, dung, charcoal (which is currently restricted by
government); participation in food-for-work and employment-generation schemes, and
migration in search of job or food.
3.2.7 Wealth Status of Community and Perceptions of Inequality
The study revealed that number of livestock is the main criteria to categorize wealth status of
individuals. Among livestock, camel and cattle are the most recognized livestock but sheep
and goats are rarely considered as wealth. Size of landholding, labor supply, brewing local
alcohol for selling, and cash are also considered for wealth differentiation. The disparity
among clusters is not pronounced. The only exception is South Omo where the standard is
very high to be rich. In terms of livestock, a poor person in South Omo can be considered as
rich in Liben, Bale, Borena and Waghimra.
With regard to community’s perception about why some people are rich and others are poor
and what drives this disparity, most attribute the disparity to Allah/God. Most said that wealth
of individuals is predetermined by Allah/God. FGDs participants in Wolayita and South Omo
are, however, of different opinion. FGD participants in Wolayita stated that wealth
differentiation is driven by land, fertility of the land, oxen, access to water/irrigation, skill and
access to modern production system, individual’s effort, improper income management, and
habit/knowledge of saving. Another interesting area mentioned by FGD participants of South
16
Omo is wealth status of parents and inheritance rules. Head of the household/father
bequeaths all resources (land and all livestock) to the first born child. All the rest have to
start from zero.
3.2.8 Gender Dimensions of Rural Livelihoods
Our study also assessed the gender dimensions of rural livelihoods in all cluster areas using
focus group discussions with representatives of communities, supplemented by key
informant interviews with local officers. There are clear divisions between women and men in
terms of tasks; resource acquisition and management; decision making and management of
household resources, participation of women in community matters, perception of local
community on girls’ education, and violence status in the community in all cluster areas. In
general, the community opinion is that ‘someone has to own and decide’. Both the culture
and religion in the community prescribe ‘woman has to obey her husband’s idea’.
3.2.9 Key Driving Factors
The major driving factor for the shortage of food and water for both humans and livestock
depends on the specific livelihood activity. For those who are practicing farming, production
depends on climate, available land including its quality, labor including its quality, livestock,
agricultural inputs (improved seeds, pesticides, fertilizer, plant and animal health), and the
equipment employed. Drought has disaster effect on crop production. Furthermore, crop
disease and pests are prevalent in all clusters. Agricultural inputs are also another problem
area that most clusters are facing.
For those who are pure pastoralists, the driving factor is the less income they generate from
their livestock and the less livestock products they make due to several factors. All clusters
are affected by drought and this has adverse effect on body condition and health of livestock
via limited availability of animal fodder and water. This means the price of livestock will
drastically fall and pastoralists could not generate enough income to buy food. This is
compounded by several drivers such as livestock disease (prevalent in all clusters); lack of
adequate health facilities for livestock and when there is the facility it lacks either the
essential drugs or the proper health professional (this is the case in all clusters), lack of well-
integrated market system and very poor transport facility (Afar, Siti, Bale and Borena); and
lack of improved livestock production/varieties (Waghumra, Afar, Siti, Bale, and South Omo).
3.3 Health and Nutrition
The study also analyzed the health, nutrition and WASH aspects of resilience in the eight
cluster areas from the supply (service delivery), demand (utilization of available services)
and outcome (morbidity and mortality) perspective. The analysis is done to understand the
17
trends and the current status as well as the key drivers for the prevailing situations. The
gender dimension is also addressed. The key findings are summarized as follows.
3.3.1 Trends and Status in Health and Nutrition Service Delivery
The health facilities in the clusters lack basic infrastructure like water and electricity, a
challenge to be addressed to ensure quality primary healthcare services. The analysis on
access of health facilities to basic infrastructure revealed 64.3% of health centers do not
have access to potable water supply and 17.1% do not have access to any power source.
The analysis on human resource for health situation at the geographical clusters shows a
critical shortage of pharmacy and laboratory professionals. The situation analysis showed
22% of health centers have no pharmacy professionals and 18.7% of health centers have no
laboratory professionals in 2016. In addition there is high turnover of midwives and
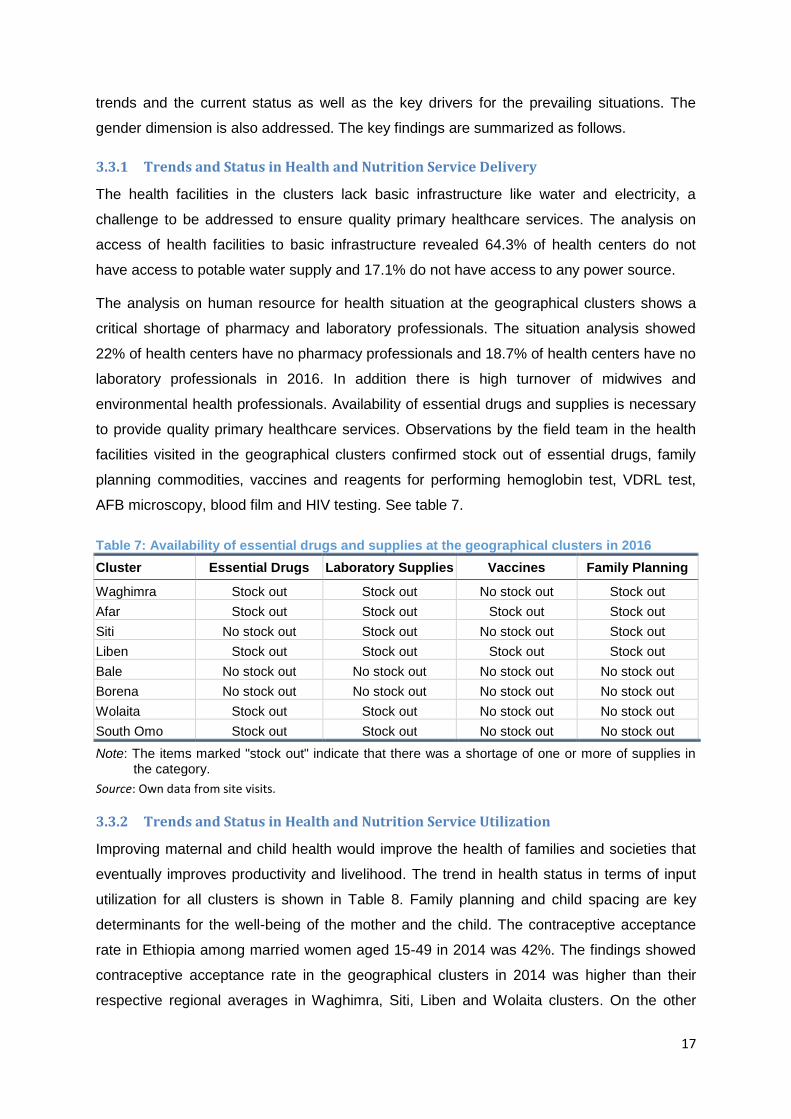
environmental health professionals. Availability of essential drugs and supplies is necessary
to provide quality primary healthcare services. Observations by the field team in the health
facilities visited in the geographical clusters confirmed stock out of essential drugs, family
planning commodities, vaccines and reagents for performing hemoglobin test, VDRL test,
AFB microscopy, blood film and HIV testing. See table 7.
Table 7: Availability of essential drugs and supplies at the geographical clusters in 2016
Cluster Essential Drugs Laboratory Supplies Vaccines Family Planning
Waghimra Stock out Stock out No stock out Stock out
Afar Stock out Stock out Stock out Stock out
Siti No stock out Stock out No stock out Stock out
Liben Stock out Stock out Stock out Stock out
Bale No stock out No stock out No stock out No stock out
Borena No stock out No stock out No stock out No stock out
Wolaita Stock out Stock out No stock out No stock out
South Omo Stock out Stock out No stock out No stock out
Note: The items marked "stock out" indicate that there was a shortage of one or more of supplies in the category.
Source: Own data from site visits.
3.3.2 Trends and Status in Health and Nutrition Service Utilization
Improving maternal and child health would improve the health of families and societies that
eventually improves productivity and livelihood. The trend in health status in terms of input
utilization for all clusters is shown in Table 8. Family planning and child spacing are key
determinants for the well-being of the mother and the child. The contraceptive acceptance
rate in Ethiopia among married women aged 15-49 in 2014 was 42%. The findings showed
contraceptive acceptance rate in the geographical clusters in 2014 was higher than their
respective regional averages in Waghimra, Siti, Liben and Wolaita clusters. On the other
18
hand the contraceptive acceptance rate in 2014 at geographical clusters Afar, Bale, Borena
and South Omo was lower than their respective regional averages. Generally there is low
utilization of family planning services in Afar, Siti, Liben, Bale and South Omo clusters;
moderate utilization in Borena cluster; and high utilization in Waghimra and Wolaita clusters.
Religion, culture and gender play a key role in influencing women's access to family
planning.
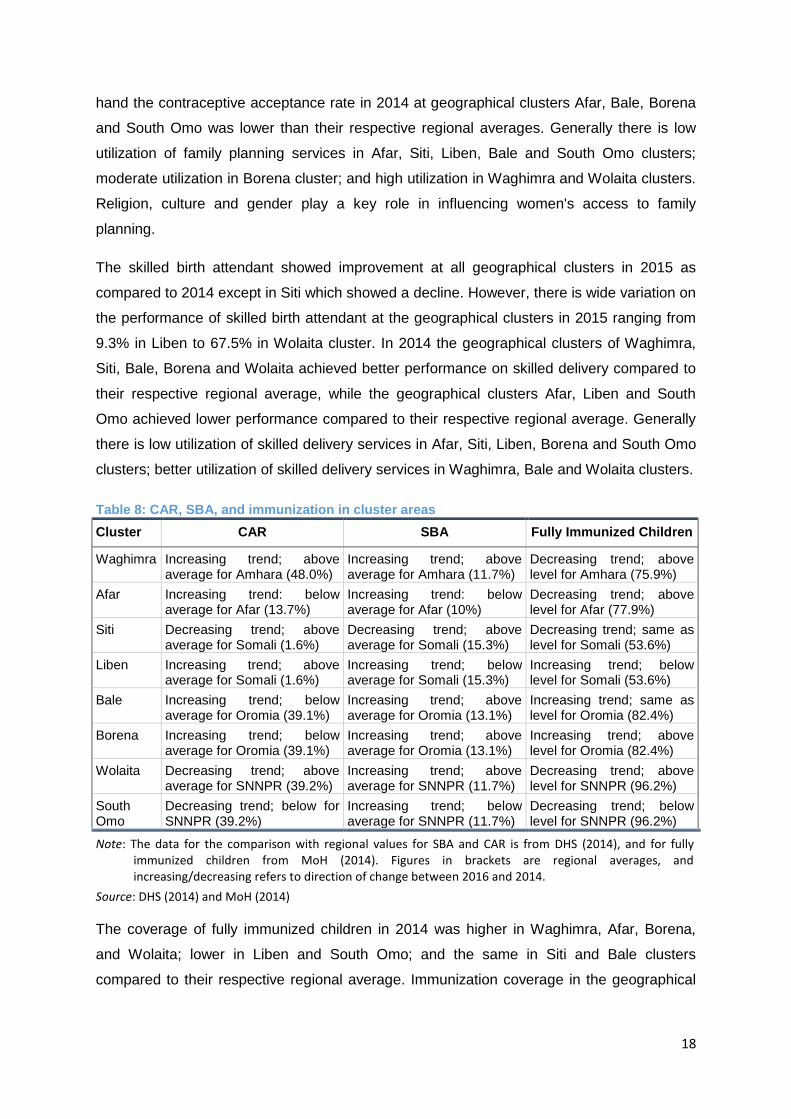
The skilled birth attendant showed improvement at all geographical clusters in 2015 as
compared to 2014 except in Siti which showed a decline. However, there is wide variation on
the performance of skilled birth attendant at the geographical clusters in 2015 ranging from
9.3% in Liben to 67.5% in Wolaita cluster. In 2014 the geographical clusters of Waghimra,
Siti, Bale, Borena and Wolaita achieved better performance on skilled delivery compared to
their respective regional average, while the geographical clusters Afar, Liben and South
Omo achieved lower performance compared to their respective regional average. Generally
there is low utilization of skilled delivery services in Afar, Siti, Liben, Borena and South Omo
clusters; better utilization of skilled delivery services in Waghimra, Bale and Wolaita clusters.
Table 8: CAR, SBA, and immunization in cluster areas
Cluster CAR SBA Fully Immunized Children
Waghimra Increasing trend; above average for Amhara (48.0%)
Increasing trend; above average for Amhara (11.7%)
Decreasing trend; above level for Amhara (75.9%)
Afar Increasing trend: below average for Afar (13.7%)
Increasing trend: below average for Afar (10%)
Decreasing trend; above level for Afar (77.9%)
Siti Decreasing trend; above average for Somali (1.6%)
Decreasing trend; above average for Somali (15.3%)
Decreasing trend; same as level for Somali (53.6%)
Liben Increasing trend; above average for Somali (1.6%)
Increasing trend; below average for Somali (15.3%)
Increasing trend; below level for Somali (53.6%)
Bale Increasing trend; below average for Oromia (39.1%)
Increasing trend; above average for Oromia (13.1%)
Increasing trend; same as level for Oromia (82.4%)
Borena Increasing trend; below average for Oromia (39.1%)
Increasing trend; above average for Oromia (13.1%)
Increasing trend; above level for Oromia (82.4%)
Wolaita Decreasing trend; above average for SNNPR (39.2%)
Increasing trend; above average for SNNPR (11.7%)
Decreasing trend; above level for SNNPR (96.2%)
South Omo
Decreasing trend; below for SNNPR (39.2%)
Increasing trend; below average for SNNPR (11.7%)
Decreasing trend; below level for SNNPR (96.2%)
Note: The data for the comparison with regional values for SBA and CAR is from DHS (2014), and for fully immunized children from MoH (2014). Figures in brackets are regional averages, and increasing/decreasing refers to direction of change between 2016 and 2014.
Source: DHS (2014) and MoH (2014)
The coverage of fully immunized children in 2014 was higher in Waghimra, Afar, Borena,
and Wolaita; lower in Liben and South Omo; and the same in Siti and Bale clusters
compared to their respective regional average. Immunization coverage in the geographical
19
clusters in 2015 was generally high except in Siti and Liben clusters which had immunization
coverage of 33.8% and 23.3%, respectively.
There is wide variation in the geographical clusters on time of initiation of breast-feeding to a
newborn ranging from immediate initiation to 12 hours. Mothers in the geographic clusters
commonly breast-feed their newborn exclusively up to the age of 6 month except in Borena
and South Omo where children are given milk, butter and/or water starting at the age of 4
months. Women in the geographical clusters universally continue breast-feeding up to the
age of two or beyond unless another pregnancy occurs, which is common in Afar, Siti, Liben
and Bale. The complementary diet is mostly limited to few varieties of cereals and milk
across the clusters. Pregnant and lactating women and adolescent girls do not get special
consideration to meet their nutritional needs associated to physiological changes.
Dairy products and cereals contributed most to consumption of children across the clusters.
Roots and tubes contributed relatively higher proportions of food consumed by children in
Wolaita and South Omo. Consumption of meat and fruits and vegetables rich in vitamin A
was low among children in all clusters. Cereals constitute the majority of food consumed by
women in Waghimra, Afar, Siti, Liben, Bale and Borena clusters while the combination of
cereals and roots or tubes constitute the majority of food consumed by women in Wolaita
and South Omo clusters. Cereals constituted the highest proportion of the diet among men
across the clusters.
Common source of water, which includes public tap, spring, pond, deep well, shallow well,
river, and water trucking, varies widely among the geographical clusters. There is low
prevalence of the practice of treatment of water to make it safe for drinking at the household
level. Women and girls are responsible to fetch water from the source for household
consumption. The average time spent to fetch water, according to the focus group
discussion participants, varies from 1-8 hours, with the lowest time spent in Siti, Wolaita and
South Omo clusters (taking one hour) while the longest time spent was in Bale (taking 8
hours).
There is general awareness on the principles of hand washing before and after eating, toilet
use and handling of dirt. However, the practice depends on a number of factors including
behavioral factors and availability of water and soap. People in all clusters increasingly wash
hands using water and soap or ash before and after eating. However, there is low
prevalence of the practice of hand washing after toilet use. During water scarcity, which is
common in the geographical clusters, water utilization is prioritized for drinking and food
preparation instead of utilization for hygienic practices.
20
There is variation among the clusters in degree of access to latrine facility at household
level. The proportion of open-defecation free kebeles in Afar, Siti, Bale and South Omo in
2016 was 11.3%, 3%, 6.6%, and 11%, respectively. No kebele is open-defecation free in
Liben. The kebeles in Waghimra, Borena and Wolaita had relatively better access to latrine
facility at the household level with 46%, 26% and 50% of kebeles are open-defection free,
respectively, in 2016.
3.3.3 Trends in Morbidity and Mortality
Immediately reportable diseases surveillance at the geographical clusters during the first
eight month of 2016 reported a total of four cases of acute flaccid paralysis (unconfirmed
poliomyelitis) from Waghimra, six cases of measles from Waghimra, 371 cases of anthrax
from Waghimra, and 281 cases of acute watery diarrhea (AWD) from Liben. No case of
neonatal tetanus, small pox and yellow fever was reported in the same period. The findings
on the surveillance of the weekly reportable diseases at the geographical clusters showed
malaria is the most common disease under surveillance followed by severe acute
malnutrition and dysentery.
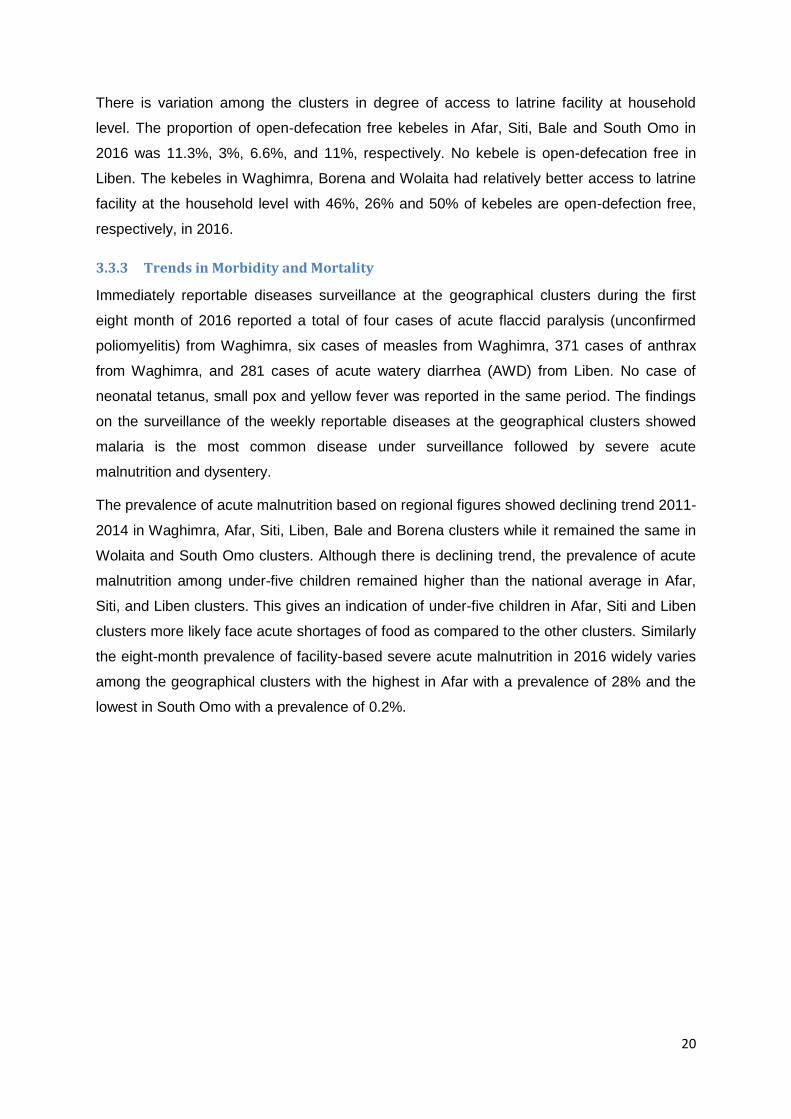
The prevalence of acute malnutrition based on regional figures showed declining trend 2011-
2014 in Waghimra, Afar, Siti, Liben, Bale and Borena clusters while it remained the same in
Wolaita and South Omo clusters. Although there is declining trend, the prevalence of acute
malnutrition among under-five children remained higher than the national average in Afar,
Siti, and Liben clusters. This gives an indication of under-five children in Afar, Siti and Liben
clusters more likely face acute shortages of food as compared to the other clusters. Similarly
the eight-month prevalence of facility-based severe acute malnutrition in 2016 widely varies
among the geographical clusters with the highest in Afar with a prevalence of 28% and the
lowest in South Omo with a prevalence of 0.2%.
21
Figure 2: Trends in wasting based on regional figures, 2011-2014
Source: DHS (2011) and DHS (2014)
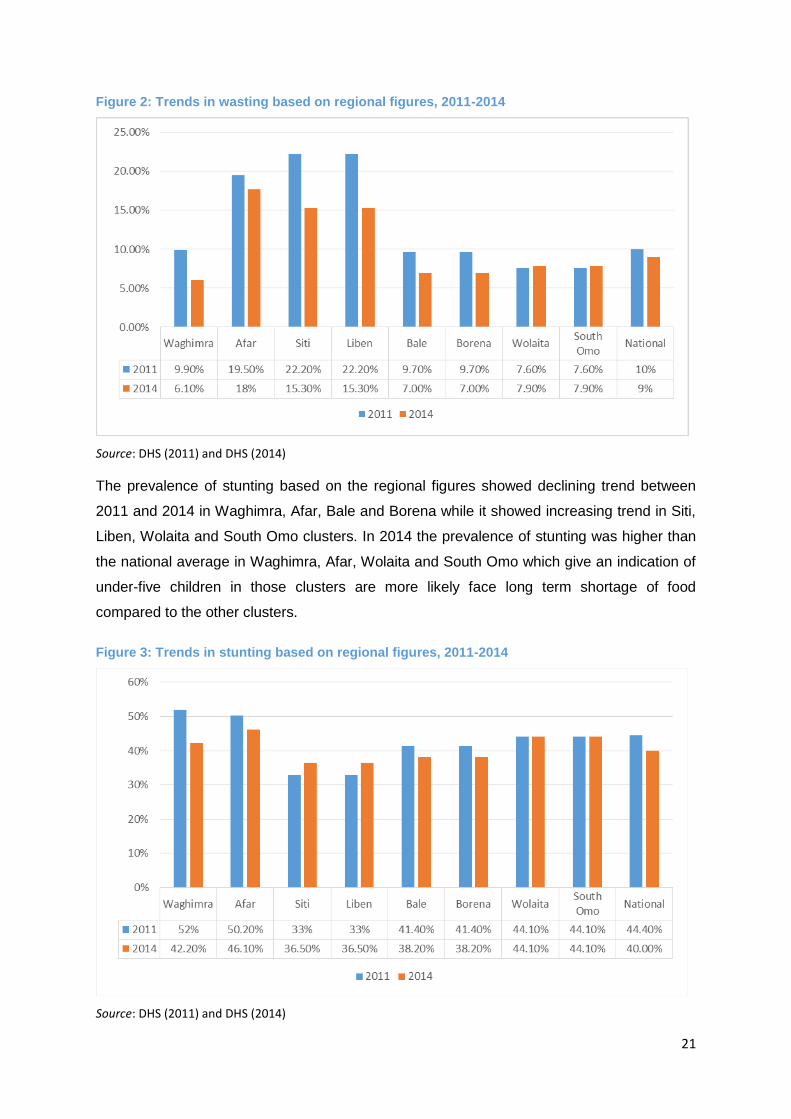
The prevalence of stunting based on the regional figures showed declining trend between
2011 and 2014 in Waghimra, Afar, Bale and Borena while it showed increasing trend in Siti,
Liben, Wolaita and South Omo clusters. In 2014 the prevalence of stunting was higher than
the national average in Waghimra, Afar, Wolaita and South Omo which give an indication of
under-five children in those clusters are more likely face long term shortage of food
compared to the other clusters.
Figure 3: Trends in stunting based on regional figures, 2011-2014
Source: DHS (2011) and DHS (2014)
22
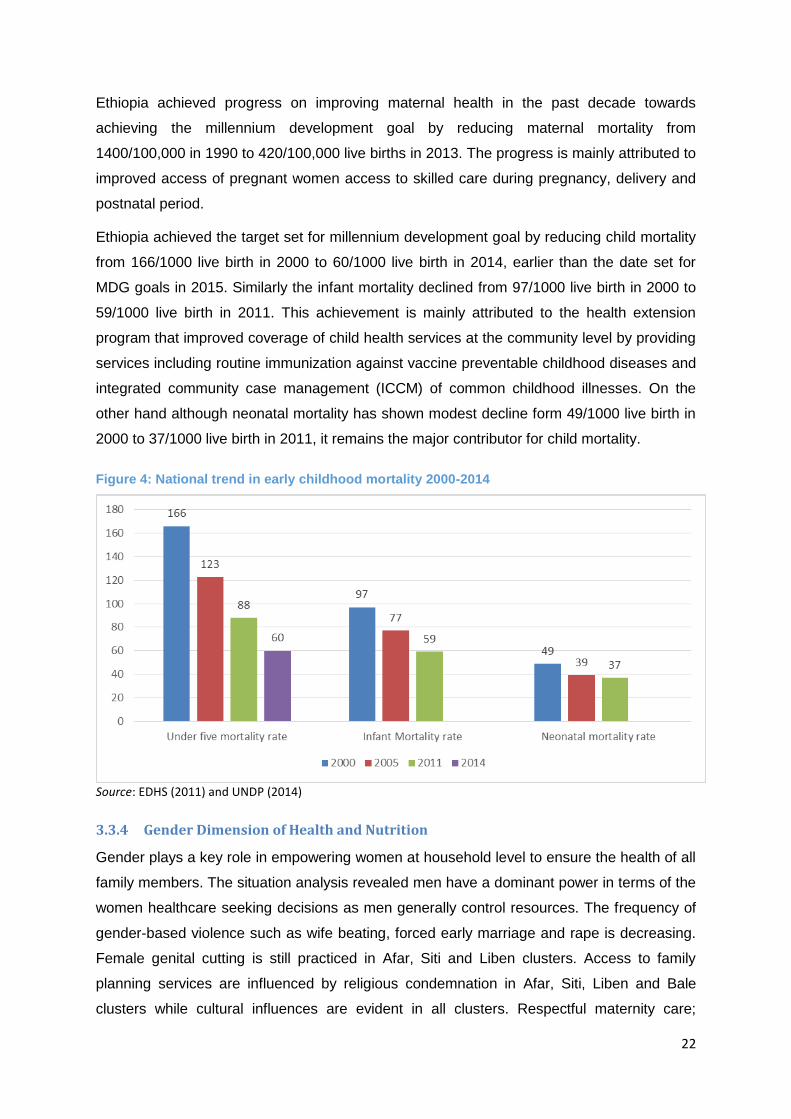
Ethiopia achieved progress on improving maternal health in the past decade towards
achieving the millennium development goal by reducing maternal mortality from
1400/100,000 in 1990 to 420/100,000 live births in 2013. The progress is mainly attributed to
improved access of pregnant women access to skilled care during pregnancy, delivery and
postnatal period.
Ethiopia achieved the target set for millennium development goal by reducing child mortality
from 166/1000 live birth in 2000 to 60/1000 live birth in 2014, earlier than the date set for
MDG goals in 2015. Similarly the infant mortality declined from 97/1000 live birth in 2000 to
59/1000 live birth in 2011. This achievement is mainly attributed to the health extension
program that improved coverage of child health services at the community level by providing
services including routine immunization against vaccine preventable childhood diseases and
integrated community case management (ICCM) of common childhood illnesses. On the
other hand although neonatal mortality has shown modest decline form 49/1000 live birth in
2000 to 37/1000 live birth in 2011, it remains the major contributor for child mortality.
Figure 4: National trend in early childhood mortality 2000-2014
Source: EDHS (2011) and UNDP (2014)
3.3.4 Gender Dimension of Health and Nutrition
Gender plays a key role in empowering women at household level to ensure the health of all
family members. The situation analysis revealed men have a dominant power in terms of the
women healthcare seeking decisions as men generally control resources. The frequency of
gender-based violence such as wife beating, forced early marriage and rape is decreasing.
Female genital cutting is still practiced in Afar, Siti and Liben clusters. Access to family
planning services are influenced by religious condemnation in Afar, Siti, Liben and Bale
clusters while cultural influences are evident in all clusters. Respectful maternity care;
23
maternity waiting areas at health facilities; free antenatal care, delivery, postnatal care,
family planning and ambulance services are interventions that empower women and
improving access to maternal health services. Women and girls are primarily responsible to
dedicate 1-8 hours a day to fetch water for the households.
At times of food shortage husbands get priority access to food, followed by children and then
women. This implies that women get less food in terms of quality and quantity during
scarcity. There is no special consideration given to nutritional need of pregnant and lactating
women and adolescent girls as they get similar type of meal with the remaining members of
the family in all the geographic clusters.
3.3.5 Key Driving Factors
The findings on the status and trends on health and nutrition suggest access and utilization
of primary healthcare services; access to basic infrastructures including safe water supply
and electricity; hygienic practices and access to household sanitation facilities; access to
adequate and diversified food; and gender are the main drivers of health and nutrition
situation of the population in the geographical clusters.
3.4 Natural Resource and Disaster Risk Management
The study also analyzed the trends and current status of natural resource and disaster risk
management aspect of resilience in the eight cluster areas. The key drivers of land use and
land cover changes were identified and the gender dimensions of NR and DRM analyzed.
Based on our assessment of NR and DRM in the clusters, the major take home messages
are the following:
• Population growth in the clusters is much higher than the national average, and most
depend on NRs. Dependence on NRs continues to grow due to population growth
and also to more frequent droughts that force many to depend on charcoal making
and fuel wood collection for sale that in the long term undermines resilience of the
ecosystem.
• DR profile and DR Reduction Planning documents have been prepared for most
woredas in all clusters except for Liben and South Omo. But there is little evidence to
show that these documents are informing planning and implementation of NR and
DRM undertakings of woredas.
• Drought, livestock disease and conflict are the three major disaster risks in all
clusters.
24
• We see sharp increase in agricultural land and bare lands and major decline in area
under forests and woodlands and grasslands. This undermines the resilience of the
ecosystem.
• NR degradation (notably the expansion of barelands and invasive species and
shrinkage of grasslands and forests and woodlands) is likely to be the major threat
for livestock based livelihoods in all clusters.
• Yet most interventions focus on relief and on improving access to basic services.
There is little to report on NRM. Emphasis remained on the communities but not on
ecosystem.
• Unless NR and DRM are mainstreamed and made integral parts of interventions,
building resilience of communities and their productions systems (the socio-
ecological system) to climate variability and change would simply prove very difficult.
• In this regard, bridging the research-development-policy continuum is critical.
The sections below present the summary of major findings that led to the aforementioned
key messages10.
3.4.1 The Status and Trend of NRs in the Clusters
Land use and land cover changes over time: Wolaita is the most densely populated
cluster of all, both in terms of human and livestock population. Agricultural production is
important activity in Waghimra and Wolaita as more reliable rainfall and mild climate favor
crop farming. In all other clusters, livestock production dominates. Semi-arid and dry climate
marked by high average temperature and short and erratic rainfall characterize most of
these clusters. Though rivers and underground water potentials exist in the clusters, effort to
harness these resources for irrigation and other uses remains limited. As a result, rainfall
distribution governs the availability of pasture and cultivated crops and hence the overall
food security situation of the pastoral and agro-pastoral communities residing in these
clusters.
Patches of woodlands, but vast expanses of shrubs, bushes and grasslands dominate the
vegetation types in most of these clusters. These vegetation types support large number of
grazing and browsing livestock species. The seven zones where the seven clusters are
found are home for over 26 million livestock (CSA, 2015). Satellite images indicate a major
land use land cover changes marked by sharp decline in woodlands, shrubs and bushlands
10
See section seven in the main report (Volume II) for detail report on the natural resource and disaster risk
management aspects of the eight cluster areas.
25
and rise in open grasslands, bare lands and agricultural lands. Vegetation cover is declining
whereas agricultural land area is expanding in almost all clusters. Major decline in grassland
area was observed in Siti, Bale and South Omo, and rapid decline in bush and shrub land
areas in Afar, Borena, Wolaita and South Omo. Grassland expansion was noted in Afar,
Bale, Borena and South Omo. Major increase in bareland areas was observed in Afar,
Liben, Borena, Woliata and South Omo indicating the urgency to pay attention to use the NR
base notably the vegetation cover. This clearly indicates a worrying trend of depletion of
desirable vegetation cover and the need to address the challenges in a coordinated manner
(Table 9).
The human population in the eight zones is estimated to be 9.4 million in 2017 and is
growing at a rate of 3.4% per annum, much faster than the national average (CSA 2015).
The population is largely dependent on pastoral and agro-pastoral production systems, but is
characterized by weak coping capacity. Wealth is determined by the number of livestock
especially cattle and camels. In the dry season, portion of the herd, except milking cows and
sheep, are taken to other areas in search of water and pasture, and this reduces grazing
pressure on habited sites. This mobility also enables pastoral and agro-pastoral communities
to make use of seasonally available fodder and water resources but scattered over large
area.
Income from firewood and charcoal sales is an important source of household income,
especially for the poor though unsustainable wood harvesting practices further increase
vulnerability in the long term. Food insecure households also receive government assistance
either in the form of food aid (emergency ration distribution) or being part of the productive
safety net program. Rapidly growing population in environmentally sensitive areas with
rapidly degrading natural resources, notably desirable vegetation cover, clearly indicates the
complexity of the challenge to build the resilience of livestock-based livelihood systems to
the impacts of climate variability and change.
The drastic changes in land use indicate the need for working towards well thought-out land
use plan in these areas. Areas that will be used for irrigation need to be defined and their
uses assessed in view of their role in the overall pastoral and agro-pastoral livelihood
systems. The farm by-products could provide feed sources and the farms could also create
employment opportunities. By so doing they contribute to diversification of livelihood options
as well. Thus, it is helpful to consider options to ensure that such land use changes (grazing
lands to irrigated fields) would not further squeeze mobility of pastoral and agro-pastoral
communities. Instead the sites could be identified and production systems identified in such
a way that these irrigated farms also complement or livestock production nearby. Estimating
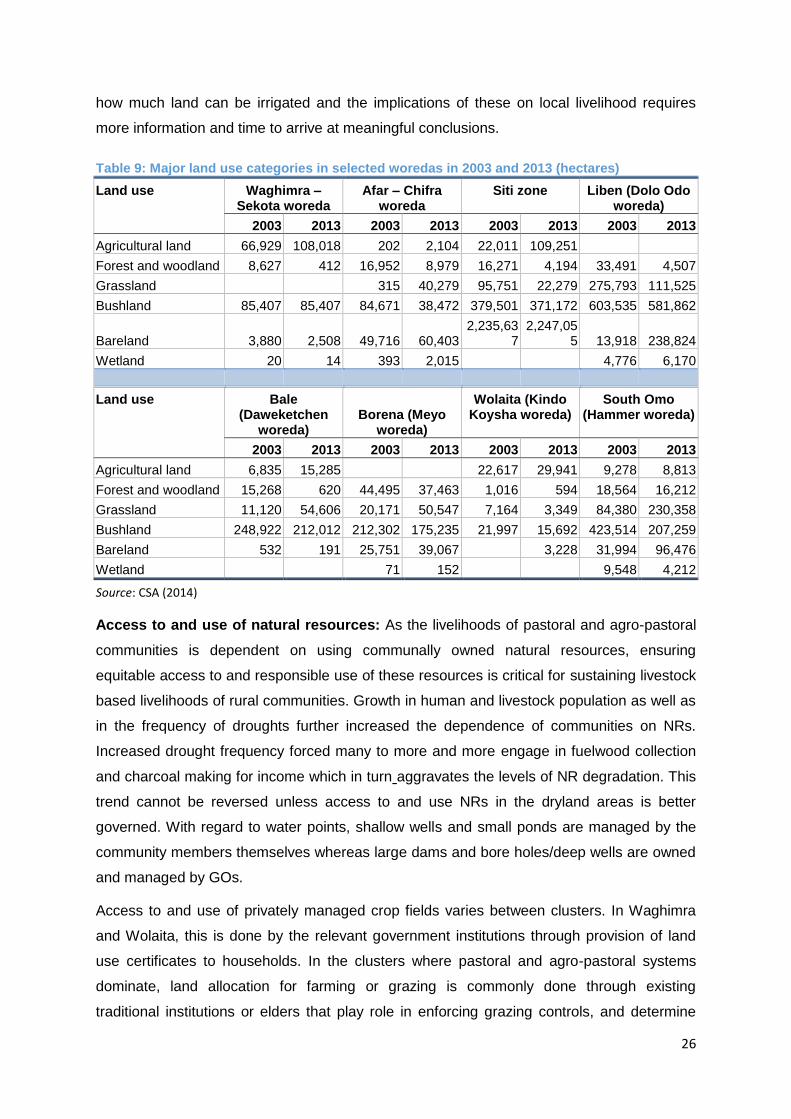
26
how much land can be irrigated and the implications of these on local livelihood requires
more information and time to arrive at meaningful conclusions.
Table 9: Major land use categories in selected woredas in 2003 and 2013 (hectares)
Land use Waghimra – Sekota woreda
Afar – Chifra woreda
Siti zone Liben (Dolo Odo woreda)
2003 2013 2003 2013 2003 2013 2003 2013
Agricultural land 66,929 108,018 202 2,104 22,011 109,251
Forest and woodland 8,627 412 16,952 8,979 16,271 4,194 33,491 4,507
Grassland 315 40,279 95,751 22,279 275,793 111,525
Bushland 85,407 85,407 84,671 38,472 379,501 371,172 603,535 581,862
Bareland 3,880 2,508 49,716 60,403 2,235,63
7 2,247,05
5 13,918 238,824
Wetland 20 14 393 2,015 4,776 6,170
Land use Bale (Daweketchen
woreda) Borena (Meyo
woreda)
Wolaita (Kindo Koysha woreda)
South Omo (Hammer woreda)
2003 2013 2003 2013 2003 2013 2003 2013
Agricultural land 6,835 15,285 22,617 29,941 9,278 8,813
Forest and woodland 15,268 620 44,495 37,463 1,016 594 18,564 16,212
Grassland 11,120 54,606 20,171 50,547 7,164 3,349 84,380 230,358
Bushland 248,922 212,012 212,302 175,235 21,997 15,692 423,514 207,259
Bareland 532 191 25,751 39,067 3,228 31,994 96,476
Wetland 71 152 9,548 4,212
Source: CSA (2014)
Access to and use of natural resources: As the livelihoods of pastoral and agro-pastoral
communities is dependent on using communally owned natural resources, ensuring
equitable access to and responsible use of these resources is critical for sustaining livestock
based livelihoods of rural communities. Growth in human and livestock population as well as
in the frequency of droughts further increased the dependence of communities on NRs.
Increased drought frequency forced many to more and more engage in fuelwood collection
and charcoal making for income which in turn aggravates the levels of NR degradation. This
trend cannot be reversed unless access to and use NRs in the dryland areas is better
governed. With regard to water points, shallow wells and small ponds are managed by the
community members themselves whereas large dams and bore holes/deep wells are owned
and managed by GOs.
Access to and use of privately managed crop fields varies between clusters. In Waghimra
and Wolaita, this is done by the relevant government institutions through provision of land
use certificates to households. In the clusters where pastoral and agro-pastoral systems
dominate, land allocation for farming or grazing is commonly done through existing
traditional institutions or elders that play role in enforcing grazing controls, and determine
27
timing and location of movements of livestock to minimize conflicts and over grazing of
rangelands. Communal lands and forests are administered by the state in the highlands but
mainly by traditional institutions in the lowlands. Key informants from communities feel that
the traditional rules are effective and well respected and elders ensure equitable access and
proper use of communal resources. Some point out however that the authorities of elders
and traditional institutions are being challenged by the younger generation that increasingly
demands their rights to resources.
This is compounded by the lack of clarity as to the legality and authority of these institutions
in managing access to and use of NRs. Bekele and Kassa (2015) noted that successive
governments paid less attention to the role of traditional institutions in the governance of
common property resources in pastoral and agro-pastoral areas of the country. With regard
to women, most of the assets with major values in most clusters are owned and
administered by men, including privately managed lands. Thus a lot more time and effort is
needed to empower women in the pastoral and agro-pastoral areas and assert their rights
over resources notably land (See Table 9).
Livestock production in all of the eight clusters is based on grazing and browsing on
communal rangelands. Rural communities depend on these resources not only for livestock
feed but also for wood and on non-wood products. In pastoral and agro-pastoral areas wood
and grasses are the primary materials used to make mobile homes and household furniture.
Many youngsters and women from poor Households collect wood and non-wood products
(fodder, forest foods, gums and resins, etc.) from dry forests and rangelands. Thus
degradation will affect most dependents segments of the community.
Major factors of resources degradation: The immediate causes of NR degradation area:
erratic rainfall and subsequent droughts, overgrazing and excessive extraction of wood/tree
cutting for energy (in all clusters), expansion of invasive bushes, weeds and toxic plants on
rangelands (in Afar, Siti, Bale and Borena), and farming marginal lands and hillsides (in
Waghimira and Wolaita). The underlying drivers for all cluster are (i) population pressure
(increase in number of poor people that depend on NRs), (ii) dependence on individual use
of communally owned and largely unmanaged NRs, (iii) lack of national land use plan to
govern development options and land use changes, and (iv) institutional failures (e.g. lack of
clear and effective tenure system for communal resources; weak role (absence or limited
presence) of GOs in NR and DRM in the pastoral areas, failure to enforce existing rules and
regulations), etc.
The need to adopt the concept of opportunistic carrying capacity: In six of the eight
clusters, pastoral and agro-pastoral production systems dominate. There has been attempts

28
to estimate carrying capacity of these areas in view of reducing NR degradation (carrying
capacity is understood as the number of people, animals or crops a region or an area can
support without suffering from environmental degradation). However various studies have
pointed out the difficulties of using the conventional carrying capacity concept in such areas
due to various technical and practical and knowledge related challenges. Our knowledge
about the productivity levels of rangelands (and its variation over time and space) and the
nutritional requirements of our livestock breeds for subsistence and production functions
remain minimal. Also the concept is dependent on the vegetation condition and economic
objectives we would like to attain and the production system we are following. For instance a
private ranch managing cattle cannot have similar carrying capacity to a subsistence
oriented pastoral production system on communally owned rangelands.
Thus, using a carrying capacity concept to determine the number of livestock or people that
could be supported in the cluster areas may prove difficult. These areas are characterized by
unpredictable and large inter and intra annual variations and greater spatial heterogeneity in
primary (feed) production to allow meaningful carrying capacity estimation. Thus, using the
carrying capacity concept in order to restore the equilibrium conditions (hoping to ensure
sustainable resource use) by adjusting stocking density and grazing strategy in pastoral and
agro-pastoral areas has been questioned. New understanding supports an alternative view
which calls for opportunistic carrying capacity that allows stocking densities to vary overtime
and space to make maximum use of vegetation without damaging resources and also
accepting the periodic need to destock or suffer losses. In other words, recognizing
efficiencies of existing practices and building upon them is essential.
Disaster risks, impacts and vulnerability factors: The major disaster risks and the
vulnerability factors are broadly similar across the six clusters where livestock production
dominates and between Waghimra and Wolaita where crop production is the major
component of the livelihood system. Based on available secondary data, the table below
summarizes disaster risks and their relative importance across the eight clusters, and
provides percentages of Households affected by different disasters over the last five years,
losses incurred in their order of importance and vulnerability factors across the eight
clusters. Please note that Table 10 was prepared assuming that the disaster risk profile
report from one woreda in each of the clusters would provide a general picture of the
respective cluster.
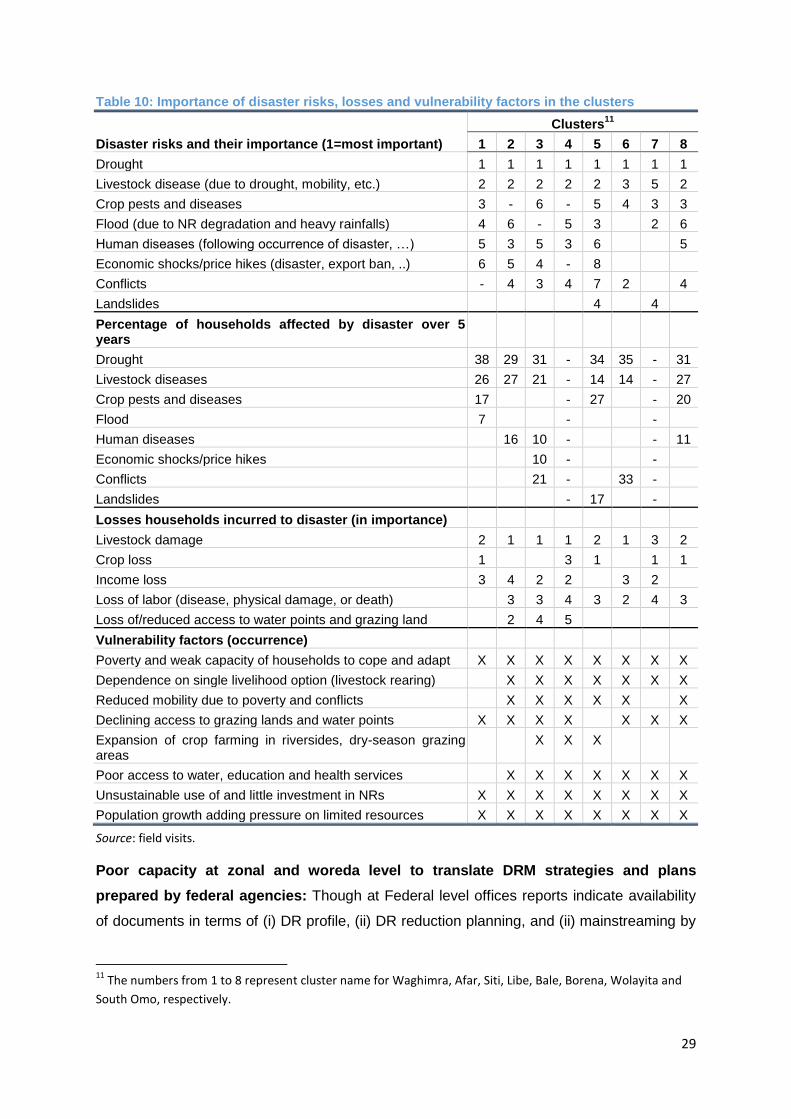
29
Table 10: Importance of disaster risks, losses and vulnerability factors in the clusters
Disaster risks and their importance (1=most important)
Clusters11
1 2 3 4 5 6 7 8
Drought 1 1 1 1 1 1 1 1
Livestock disease (due to drought, mobility, etc.) 2 2 2 2 2 3 5 2
Crop pests and diseases 3 - 6 - 5 4 3 3
Flood (due to NR degradation and heavy rainfalls) 4 6 - 5 3 2 6
Human diseases (following occurrence of disaster, …) 5 3 5 3 6 5
Economic shocks/price hikes (disaster, export ban, ..) 6 5 4 - 8
Conflicts - 4 3 4 7 2 4
Landslides 4 4
Percentage of households affected by disaster over 5 years
Drought 38 29 31 - 34 35 - 31
Livestock diseases 26 27 21 - 14 14 - 27
Crop pests and diseases 17 - 27 - 20
Flood 7 - -
Human diseases 16 10 - - 11
Economic shocks/price hikes 10 - -
Conflicts 21 - 33 -
Landslides - 17 -
Losses households incurred to disaster (in importance)
Livestock damage 2 1 1 1 2 1 3 2
Crop loss 1 3 1 1 1
Income loss 3 4 2 2 3 2
Loss of labor (disease, physical damage, or death) 3 3 4 3 2 4 3
Loss of/reduced access to water points and grazing land 2 4 5
Vulnerability factors (occurrence)
Poverty and weak capacity of households to cope and adapt X X X X X X X X
Dependence on single livelihood option (livestock rearing) X X X X X X X
Reduced mobility due to poverty and conflicts X X X X X X
Declining access to grazing lands and water points X X X X X X X
Expansion of crop farming in riversides, dry-season grazing areas
X X X
Poor access to water, education and health services X X X X X X X
Unsustainable use of and little investment in NRs X X X X X X X X
Population growth adding pressure on limited resources X X X X X X X X
Source: field visits.
Poor capacity at zonal and woreda level to translate DRM strategies and plans
prepared by federal agencies: Though at Federal level offices reports indicate availability
of documents in terms of (i) DR profile, (ii) DR reduction planning, and (ii) mainstreaming by
11
The numbers from 1 to 8 represent cluster name for Waghimra, Afar, Siti, Libe, Bale, Borena, Wolayita and
South Omo, respectively.

30
the Federal Govt. for some of the woredas in the clusters, none of the woredas reported
using those in their DRM work. We need however to note that no woreda in clusters Liben
and South Omo has DR profile prepared by the relevant federal agency. But most woredas
in other cluster have their DR profile and DR planning done. Thus building capacity and
follow remains critical to make use of these reports.
DRM strategies of communities: In the face of the above disaster risks, communities have
been using various DRM strategies. Drought, livestock diseases and conflicts remain the
three major disaster risks in most clusters. Communities with the support from GOs and
NGOs construct small dams, wells and other structures to improve availability of water for
people and livestock and also for irrigation. Communities rely on and respect the traditional
institutions to minimize the chances of conflicts over the use of communal resources and to
resolve them quickly when they happen. GOs and NGOs have been supporting communities
and the traditional institutions in their peace building efforts.
The other DRM strategies widely used by communities are: tapping into the existing social
network and support mechanisms (to seek loans or supports/donations); reducing expenses
and consumption; seeking employment and other income generating opportunities including
seasonal migration to other areas; increasing dependence on income from wood (fuel wood,
charcoal) and non-wood products (fodder, gums and resins, etc..); reducing livestock
numbers through sales; increasing diversity of livestock species and herd structure; mobility
(migrating to areas where more pasture and water for livestock are available being informed
by surveillance of rangelands and exchange of such information (particularly common in
Afar).
Measures being taken by GOs and non-state actors in NR and DRM: Major programs of
the federal government that are active in the clusters are PSNP and PCDP. Regional and
woreda level plans and programs though the prevalence and importance of each varies
across clusters include: improving access to water, infrastructure, markets and social
services; mobilizing communities to be engaged in soil and water conservation works;
establishing nurseries and producing seedlings; promoting crop production based
livelihoods; introducing improved farming and pest control methods; providing training,
improving access to credits and supporting livelihood diversification; establishing peace and
reconciliation committees; establishing early warning and disaster reduction management
taskforces/command posts at different levels; and providing emergency aid.
Dozens of NGOs and non-state actors are active in the clusters. Most are engaged in
providing either relief aid or supporting education, water and health sectors. The conclusion
was that NR and DRM has not been high on the agenda of most-non state actors operating
31
in the clusters. Only a fraction of them have activities in NR and DRM. In this regard, the
work of Save the Children has been cited as exemplary in its attempt to combine aid with
long term NRM work at community level in Siti and Bale. Its work demonstrated that
participatory, community-owned NRM projects can be planned and implemented in pastoral
and agro-pastoral settings with positive impacts on the resource base and also on local
livelihoods.
Perceptions of key actors on effectiveness of interventions in NR and DRM: Key
informants from community members in Waghimra and Wolaita are of the opinion that soil
and water conservation measures on communal lands were less successful. Annual tree
planting campaigns on communal lands through mass mobilization were even less
successful as follow up is inadequate, and the tenure rights remain unclear. They pointed
out that more needs to be done to fine tune and improve appropriateness of soil and water
conservation measures starting from selecting sites to identifying specific physical measures
to be applied in pastoral and agro-pastoral ecologies and grazing based livestock production
systems, determining species to be planted, and defining ownership and use rights of the
surrounding communities on trees planted and landscapes rehabilitated. They stress that the
needs, knowledge and capabilities or resources of local communities need to be properly
considered during the planning and implementation stages, and rigorous follow up should be
put in place to make sure that community efforts and the resources of GOs and NGOs are
not wasted.
In the clusters where pastoral and agro-pastoral productions systems dominate, key
informants have a more favorable view on the effectiveness of interventions to reduce
disaster risks, especially attempts to improve access to water and emergency food aid. They
also recognized the role of PSNP in protecting community members from selling their assets
in difficult times. But experts and some community members stressed that the focus of GOs
and non-state actors has generally been on emergency projects and not on long term
undertakings that will contribute to building resilience of socio-ecological system. They also
pointed out that efforts to increase biomass/feed production and improve vegetation cover
on the landscapes were minimal in most clusters, and that there is little or no consultation
with the community and GOS in the respective weredas during project design. Hence, top-
down planning of intervention dominates and most interventions remain relief focused with
little attention to NRM. There is a concern that the role of traditional institutions has not been
officially recognized and supported by GOs except in Borena and Wolaita. There is
recognition by experts that these institutions do well in terms of providing rules of resource
usage between community members that ensure equal access to use of communal
resources and in reducing conflicts over use of these resources. There is however a major

32
concern that they do not have track records of mobilizing communities to invest labor and
other resources in improving NR management. Most felt that mobilizing communities to
invest in NRM is being done by GOs.
3.4.2 Major Drivers of Change and Key Challenges
The major drivers of change in all of the clusters are: climate variability and change leading
to increased frequency and severity of drought and water shortages; poverty and population
expansion (human and livestock) that puts additional pressure on NRs; and government
policy that aims at improving access to social services while also encouraging crop-
production based livelihood option in these areas. Key challenges that constrain efforts in
the clusters to build resilience are: dependency on communally owned but degrading natural
resources (grazing lands and water points) leading to chronic water and livestock feed
shortage; illiteracy and cultural values; living in climatically challenging environment and
remote/isolated locations; poor access to extension, credits and markets; weak capacity of
households and communities to cope and adapt; less well-thought development
interventions; limited capacity of GOs and non-state actors to engage in long-term
development interventions; poor coordination of actors; declining importance of traditional
support systems; increased dependency on aid; degradation of rangelands; increased
incidence and regionalization of conflicts; reduced mobility of particularly poor households;
institutional gaps or overlaps in governing access to and use of NRs; unclear tenure on
communal lands and resource; less emphasis on NRM at local level; inadequate efforts to
promote collective action of communities in NRM; and little recognition by GOs to the need
for rethinking and diversifying development pathways in pastoral and agro-pastoral areas.
Cluster specific challenges are: extremely high land degradation due to conversion of
hillsides and shrub lands to agricultural lands in Waghimra and Wolaita, rapid decline in
bush and shrub land areas in Afar, Borena, and South Omo, and decline in grassland area
particularly in Siti, Bale and South Omo. Most worrying trend of rapid increase in the area of
barren land is observed in 5 of the clusters, namely Afra, Liben, Borena, Wolaita and South
Omo. This points to a major concern that requires the attention of all to be addressed.
To summarize, the following points are worth re-emphasizing to strengthen NR and DRM
undertakings in the clusters:
Most clusters are in areas to be affected most by the impacts of climate variability and
change. Yet we observe alarming rates of NR degradation that needs to be addressed.
Sadly, the level of awareness of communities and experts regarding the extent of LULCC
and their implications for sustaining livelihoods appears to be low.
33
The population growth in all clusters is much higher than the national average indicating
that the degradation will be even more in the years to come unless mitigated.
There is little evidence to support that DR profile and DR Reduction planning documents
prepared for woredas are used in DR reduction plans and programs. Efforts to promote
collective action in NRM and to develop appropriate tenure and governance systems that
ensure sustainable use of NRs in pastoral and agro-pastoral areas remain limited. We
also saw little evidence of learning from SLM in the highlands and from relief and
development oriented investments in the lowlands in designing interventions in NR and
DRM in the eight clusters. As a result, interventions in the clusters focus mainly on relief
and improving availability of services and local livelihoods. This implies that NRM has not
been high on the agenda of most GOs and non-state actors operating in the clusters.
Even in clusters with NR and DRM related interventions, the undertakings are limited to
building capacity through training and supporting activities nurseries. As a result, more
needs to be done to focus on NRM to build resilience of the ecological system.
To do so understanding the current status and changes in the natural resource base,
major disaster risks and their relative importance in each of the clusters, what is being
done by GOs and non-state actors and the various strategies that communities use to
cope with and adapt to climatic and socio-economic changes is critically important to
identify more effective and efficient intervention options to build the resilience of
communities and their ecosystems in each of the clusters and also to identify and use
robust indicators to assess progress in NR and DRM.
In designing programs and assessing their progress in NR and DRM the following
indicators are proposed to be used to monitor progress and assess impact of
interventions in building resilience of socio-ecological systems:
Number of woredas using DR Reduction planning report to plan interventions,
Percentage of land, forest area, water points, etc. put under improved
management,
Area of desirable vegetation cover (in line with the prevailing land use system),
Proportion of households that are food secure,
Proportion of food insecure households that have built asset and better coping
capacity,
Capacity built to better forecast and manage disaster, and to specifically plan,
implement and evaluate programs in NR and DRs at different levels,

34
3.5 Policy and Institutional Aspects of Resilience
Since policy is the starting point for any development effort, we also reviewed policies,
strategies and programs formulated and being implemented in relation to building resilience
of vulnerable communities in the country. The review not only includes government policies
and strategies but also program interventions being implemented in the country by
development partners in building resilience12.
The government of Ethiopia has endorsed a comprehensive DRM policy and strategy, which
emphasizes the necessity of a multi-hazard approach grounded in a deep understanding of
specific disaster risk, and its link to development and vulnerability; emphasis on prevention,
mitigation, preparedness and post-disaster modalities and capacities; de-centralization of
resources and structures; a clear determination of DRM responsibilities, supported by the
capacity for legal enforcement and a high degree of accountability. Other national and
sectoral policies related to resilience building include population, women, youth, food
security, education, health, water, etc.
These policies and strategies not only have close linkages with building resilience in
Ethiopia, but also they form the basis for mainstreaming development plans in to the
resilience building efforts of the DRM. For example, the National Women’s Policy and the
National Action Plan for Gender Equality provide the basis for mainstreaming gender in
DRM. The Hyogo Framework for Action (HFA) and the Africa Regional Strategy for Disaster
Risk Reduction are important initiatives of the international community and serve as the
primary international framework on DRM. The Intergovernmental Authority on Development
(IGAD) also reiterates the importance of integrating gender and youth in the regional
responses through their gender policy and strategy, including disaster risk management in
its paper entitled “To End Drought Emergencies in the Horn of Africa”. IGAD aims to achieve
regional food security and encourage and assist efforts of member states to collectively
combat drought and other natural and man-made disasters and their natural consequences.
The medium term plan, the Growth and Transformation Plan (GTP II) have emphasized the
importance of DRM. In relation to resilience building, the plan stipulated that agriculture and
rural transformation is one of the key pillars for building resilience to any shocks. In this
respect the strategic direction is that development of smallholder crop and pastoral
agriculture will be further enhanced and hence will be the main source of growth and rural
transformation during the plan period. The plan also stated that support to youth in terms of
education will be key pillars so that the youth able to organize themselves and engage in
12
See section 8 of the main report (volume II) for detail review of the policy and institutional aspects of
resilience.

35
agricultural investment. In terms of improving the governance system in formulating,
implementing and monitoring interventions that build resilience of vulnerable communities,
the GTP II aims to strategically strengthening people’s participation along all the political and
development processes. In this respect, capacity building programs that build and enhance
the capacity of woreda and kebele councils are given due emphasis.
The development of the Disaster Risk Management Strategic Programme and Investment
Framework (DRM SPIF) is a testament to the commitment and dedication of the Early
Warning and Response Directorate (EWRD) of the Disaster Risk Management and Food
Security Sector (DRMFSS), federal government line agencies, regional governments,
development partners, humanitarian organizations, and civil society organizations to the
effort of operationalizing the new comprehensive DRM approach. The three programs
closely related to the contribution of agriculture for building resilience are the Agriculture
Sector Policy and Investment Framework (PIF), Agricultural Growth Program (AGP) and the
Productive Safety Net Programme (PSNP).
With regard to health and nutrition, there are various programs and declarations made by the
government of Ethiopia and development partners. Some of the most important for resilience
building include the Seqota Declaration to express its commitment to end child under-
nutrition by 2030; Health Sector Transformation Plan, the National Nutrition Strategy (NNS),
the Nutrition Sensitive Agriculture Strategic Plan, under the Ministry of Agriculture and
Natural Resource (MoANR), the National School Health and Nutrition Strategy (SHN),
developed by the Ministry of Education, and the Productive Safety Net Programme (PSNP).
With regard to natural resource and risk management, the 2007 Forest Conservation and
Utilization Policy and Strategy, the 2007 Federal Forest Law, the 2011 CRGE strategy and
the GTP II targets are worth to mention. Besides, the Rural Development Policy and
Strategy document underlines the need to rehabilitate and restore the country’s degraded
natural resources. It emphasizes the integration of tree planting in agricultural landscapes
and advocates for having clearly defined objectives for tree planting initiatives. GTP II has
set the target to increase national forest cover and double the contribution of the forestry to
the national GDP. The National Women’s Policy and the National Action Plan for Gender
Equality provide the basis for mainstreaming gender in DRM. Likewise, the Food Security
Strategy (FSS) emphasize the need to address vulnerabilities to drought and other natural
calamities in the long and medium term. , In addition to those mentioned above, the Global
Facility for Disaster Reduction and Recovery (GFDRR), is a key initiative of an international
partnership initiative to help developing countries reduce their vulnerability to natural hazards
and adapt to climate change particularly in pastoral areas.
36
In addition to the above review on national and international policies, strategies, program
initiatives, the study also conducted institutional mapping at cluster levels. The following
section presents the gaps and opportunities for each thematic areas as well as cross cutting
issues that are relevant to build resilience in the vulnerable cluster areas.
4. Gaps and Opportunities for Resilience Building
Based on the analyses and findings of the past trends and current status as well as
fundamental drivers of livelihood, health, nutrition and WASH, natural resource and disaster
risk management as well as the policy aspects of resilience, the key gaps and opportunities
are identified. These gaps and opportunities will be used as inputs in developing strategies
to build the resilience of vulnerable communities in the eight cluster areas. The findings are
summarized as follows.
4.1 Gaps and Opportunities in Livelihood
To deal with food shortages most clusters are suffering from several gaps. Water, animal
and crop diseases, animal fodder, veterinary facilities, agricultural inputs etc are major gaps.
There is a need to tackle these gaps to improve food availability. Pastoralists and agro-
pastoralists are entirely dependent on rainfall for their crops and livestock. Water is critical
for both human and livestock. Different potentials are available which could be tapped to
deal with improving livelihood of the community. All clusters have large stock of livestock but
poor quality. In order to tap this development opportunity and improve the livelihood of the
community, it requires a serious work on the quality of livestock. It requires veterinary
infrastructure, providing improved livestock breed that resist animal disease. Crop production
is also another potential. Most clusters have arable land for crop production and in some
clusters like Bale even potential for cotton, sugar cane, fruits, through irrigation. There are
lots of rivers that flow throughout the year in most clusters suitable for irrigation.
For these opportunities to materialize there is a need for different kinds of support from the
government. Improving the knowledge and skills of pastorals on how to integrate crop
production with livestock raising, making available different agricultural equipment and
inputs, enhance animal and plant disease protection facilities, and improving infrastructures
for market accessibility and linkage, production of animal fodder, and the like. Honey
production, tourism and fishery is also another potential that can improve the livelihood of
the community if serious attention is given by all stakeholders.
Overall, the challenges that substantially contributed to the vulnerability for the livelihood of
the communities include lack of human capital (low education level, poor health, limited skill);
extremely poor initial conditions; poor access to soft and hard infrastructures; limited options
37
for livelihood strategy, which are vulnerable to shocks and climate change risks; and
subsistence/traditional animal husbandry; low productivity due to crop disease/pest, low
technology use such as improved seed, chemicals, improved livestock breed, absence or
shortage of improved technology, poor access to transportation, poor market access and
infrastructure/structure, absence/limited and poor veterinary facilities and services, livestock
disease, shortage of livestock feed and limited institutional services and support; drought;
flood and conflict.
In addition to the policies and strategies discussed below, there are opportunities in the
cluster areas to address the above gaps and build the resilience of the vulnerable
communities. These include high livestock resource, availability of arable land with water
resource for crop production and irrigation, alternative livelihood strategies such as fishery,
tourism, bee keeping (honey production), etc.
4.2 Gaps and Opportunities in Health and Nutrition
This study identified a number of gaps in health and nutrition in the communities. Overall, the
health-related gaps in resilience building in the cluster areas include poor access to health
facilities, available health facilities are with low access to basic infrastructure such as potable
water supply, electricity; shortage of essential drugs and laboratory supplies, low utilization
rate of available health facilities; shortage of pharmacy and laboratory professionals;
inadequate implementation of Integrated Pharmaceutical Supply System (IPLS); low family
planning practice (low contraceptive acceptance rate), low skilled-delivery service utilization,
and low immunization coverage.
With regard to the nutrition, the key gaps include high rate of acute malnutrition (in Afar, Siti
and Liben) and chronic malnutrition (Waghimra, Afar, Wolaita and South Omo); low
consideration to improve access of pregnant and lactating women and adolescent girls to
their nutritional needs at household level. The key gaps related to poor WASH status include
low access to safe water supply, poor access to sanitation facilities such as improved latrine
facility, and poor hygienic practices. The key gaps from gender perspective of the health and
nutrition are that men plays dominant role in decision making on health seeking behavior
and spending household resources; women and girls spend on average four hours to fetch
water from the nearest safe water source; and the presence of gender based violence in the
cluster areas.
The study identified important opportunities to be considered in designing interventions to
build health and nutrition-related aspects of the communities' resilience. The opportunities
include:
38
the health sector transformation plan that gives due emphasis to provision of
equitable, accessible, and quality primary health services;
the woreda transformation plan which aims to create high-performing health facilities
and model kebeles that ensure free home delivery and are open-defecation free;
the flagship health extension program designed to improve access to health of
women, children and families with a strong community ownership mechanism;
the health development army organized to scale-up best practices gained from the
implementation of the health extension program at household level;
the maternal health initiatives of maternity waiting areas at health centers and
Respectful Maternity Care;
the WASH framework with an integrated approach which aims to improve access to
water, hygiene and sanitation;
the national nutrition strategy with a multi-sectoral and multi-dimensional approach
which aims fulfilling the nutrition need of the population;
the productive safety net program (PSNP) and availability of rivers at most clusters
suitable for irrigation;
the gender policy with a main strategy of gender mainstreaming in sector and
development programs; and,
the presence of experienced development partners on the ground in the geographical
clusters working in the technical areas of health, nutrition and WASH.
4.3 Gaps and Opportunities in NR and DRM
In light of observed trends in the status of NRs and the challenges described above, the
major gaps to be addressed for improving NR and DRM are:
extremely underdeveloped capacity at woreda and lower levels for NR and DRM;
the apparent lack of understanding of the severity of NR degradation in the clusters
both by government experts and NGOs as well as development partners/donors;
inadequate attention paid to ensuring mobility which in turn reduced possibilities to
use seasonally available water and fodder on wider areas;
the lack of adequate knowledge on dryland areas in general and on: (i) the status of
NRs base, the extent of land use changes and their implications to livelihoods, and
on site specific drivers and consequences of land use changes; (ii) options to better
manage the NR-livestock link; (iii) to devise a mechanism that provides
complementary roles for GOs and traditional institutions in NR and DRM; (iv) the
extent and implications of individualization of communal resources (e.g. grazing
lands and woodlands); and, (v) on the effectiveness of traditional institutions in
39
ensuring access and responsible use of communal resources and mobilizing
communities to rehabilitate communal resources;
little information on options to improve livestock feed resources in dry lowland areas
of the country;
underutilization of existing potential in GIS and remote sensing to gather spatial and
temporal data on the changes over time and current status of NRs and to collate
existing information for knowledge-based planning and informed decision making at
different levels;
unclear position of the government on the role of traditional institutions in managing
NRs and conflicts;
government emphasis on promoting settlement and crop based farming in most
clusters with little emphasis to provide support to enable mobility of pastoral and
agro-pastoral households reduces possibilities to use seasonally available water and
fodder but scattered over wide areas;
perceived increased dependency of communities on food aid and relief oriented
interventions of NGOs and top down planning of government structures;
limited effort to make explicit links between food security (PSNP, HABP) and natural
resources management programs to ensure complementarities and maximize
synergy;
intervention identification and implementation not informed by knowledge and
experience on the status and changes of the natural resources base;
concerns that in some cases conflicts are taking regional dimensions and are
becoming more difficult to solve;
women in most clusters continue have little control over assets with major values,
including privately managed lands;
poor coordination amongst actors; and
lack of multi-faceted approach targeted to the different segments of pastoral and
agro-pastoral communities as the focus has been on promoting settlement and
irrigation based crop farming over shadowing the need for rethinking and diversifying
development pathways for varying segments of the community in pastoral and agro-
pastoral areas.
The prevailing opportunities for building the resilience of socio-ecological systems in the
eight clusters are, among others:
existence of potentials for irrigation in a number of woredas in the clusters;
40
improved capacity to predict weather patterns and forecast drought and floods as
well as better communication capability (e.g. mobile network) that could be used to
convey such information to rural communities;
presence of NGOs and government offices in charge of NR and DRM at regional,
zonal and woreda levels and in some cases committees at kebele levels;
presence of traditional institutions that govern access to and use of natural resources
that are used communally;
presence in the country of international research centers (CIFOR, ICRAF, ILRI,
IWMI, IFPRI, …) and national institutes (EEFRI, EIAR, EDRI, universities, …) that
could support the efforts of GOs and non-state actors in building and sharing
knowledge in NR and DRM; and
the DRM strategy of the government that provides platform for encouraging
coordination among actors.
The situation analysis revealed that drought is the number one disaster risk in all of the eight
clusters. This is followed by disease (especially of livestock, followed by human and crop),
conflicts, economic shocks, floods and landslides.
4.4 Policy and Institutional Gaps and Opportunities
In the previous three subsections, the gaps related to the specific thematic areas are
identified. In this sub section, some policy and institutional gaps that cross cuts among the
different thematic areas are identified. The policy and institutional gaps that link across the
different thematic areas include the following: first, lack of scientific knowledge for policy
priority for linking livelihood/agriculture and nutrition and health for resilience building based
on country/region specific context; second, lack of strategy to link food security programs
(PSNP, HABP) with NRM; third, more sector specific programs that have specific targets of
achieving development outcomes; limited complementarities among different sectoral
programs; fourth, lack of plans/programs designed based on agro ecological and socio-
economic settings of the eight clusters; fifth, absence of targeted program coverage for
integrating agricultural production for nutrition security especially for women and children
that simultaneously improve the resilience of vulnerable communities; sixth, perceived
increased dependency of communities on food aid and relief oriented interventions of NGOs
and top down planning of government structures; seventh, weak coordination or weak
linkage among the different sectoral offices, which led to very loss linkage among livelihood
strategy, nutrition and health programs due to weak linkage among the different sectors;
eighth, low capacity to harmonize and utilize existing opportunities in planning and
implementing programs that have cross sectoral impact at local levels; ninth, weak
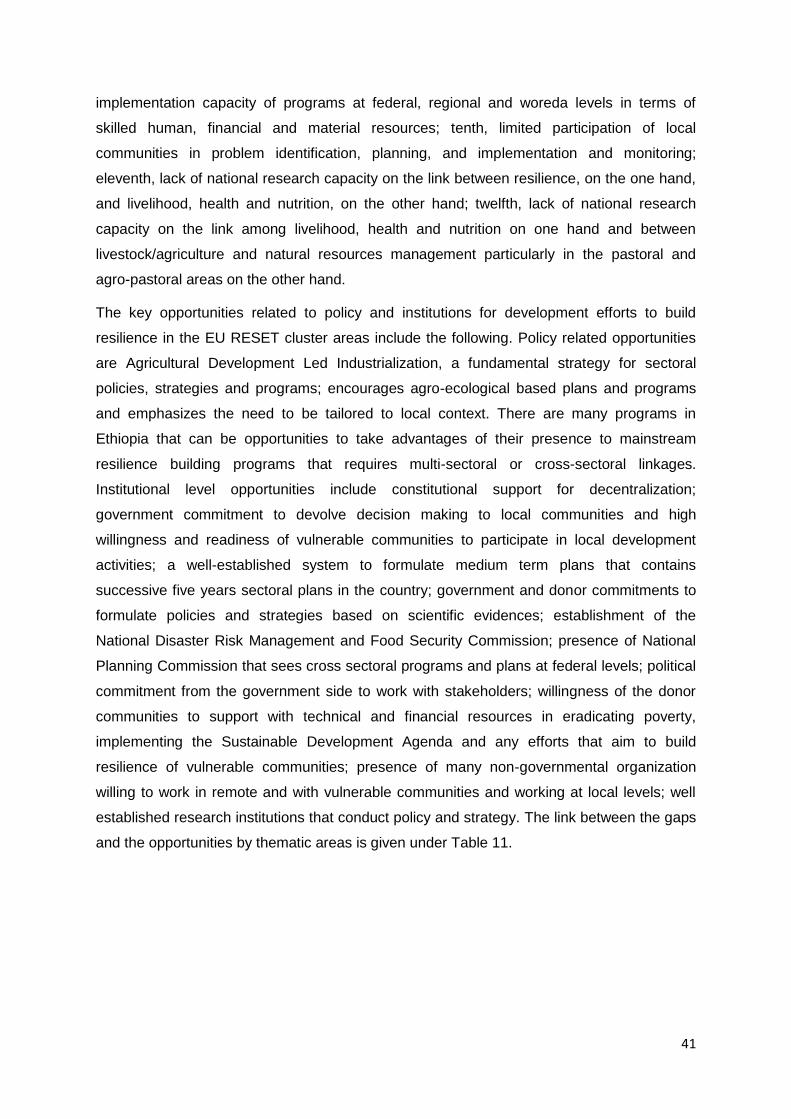
41
implementation capacity of programs at federal, regional and woreda levels in terms of
skilled human, financial and material resources; tenth, limited participation of local
communities in problem identification, planning, and implementation and monitoring;
eleventh, lack of national research capacity on the link between resilience, on the one hand,
and livelihood, health and nutrition, on the other hand; twelfth, lack of national research
capacity on the link among livelihood, health and nutrition on one hand and between
livestock/agriculture and natural resources management particularly in the pastoral and
agro-pastoral areas on the other hand.
The key opportunities related to policy and institutions for development efforts to build
resilience in the EU RESET cluster areas include the following. Policy related opportunities
are Agricultural Development Led Industrialization, a fundamental strategy for sectoral
policies, strategies and programs; encourages agro-ecological based plans and programs
and emphasizes the need to be tailored to local context. There are many programs in
Ethiopia that can be opportunities to take advantages of their presence to mainstream
resilience building programs that requires multi-sectoral or cross-sectoral linkages.
Institutional level opportunities include constitutional support for decentralization;
government commitment to devolve decision making to local communities and high
willingness and readiness of vulnerable communities to participate in local development
activities; a well-established system to formulate medium term plans that contains
successive five years sectoral plans in the country; government and donor commitments to
formulate policies and strategies based on scientific evidences; establishment of the
National Disaster Risk Management and Food Security Commission; presence of National
Planning Commission that sees cross sectoral programs and plans at federal levels; political
commitment from the government side to work with stakeholders; willingness of the donor
communities to support with technical and financial resources in eradicating poverty,
implementing the Sustainable Development Agenda and any efforts that aim to build
resilience of vulnerable communities; presence of many non-governmental organization
willing to work in remote and with vulnerable communities and working at local levels; well
established research institutions that conduct policy and strategy. The link between the gaps
and the opportunities by thematic areas is given under Table 11.
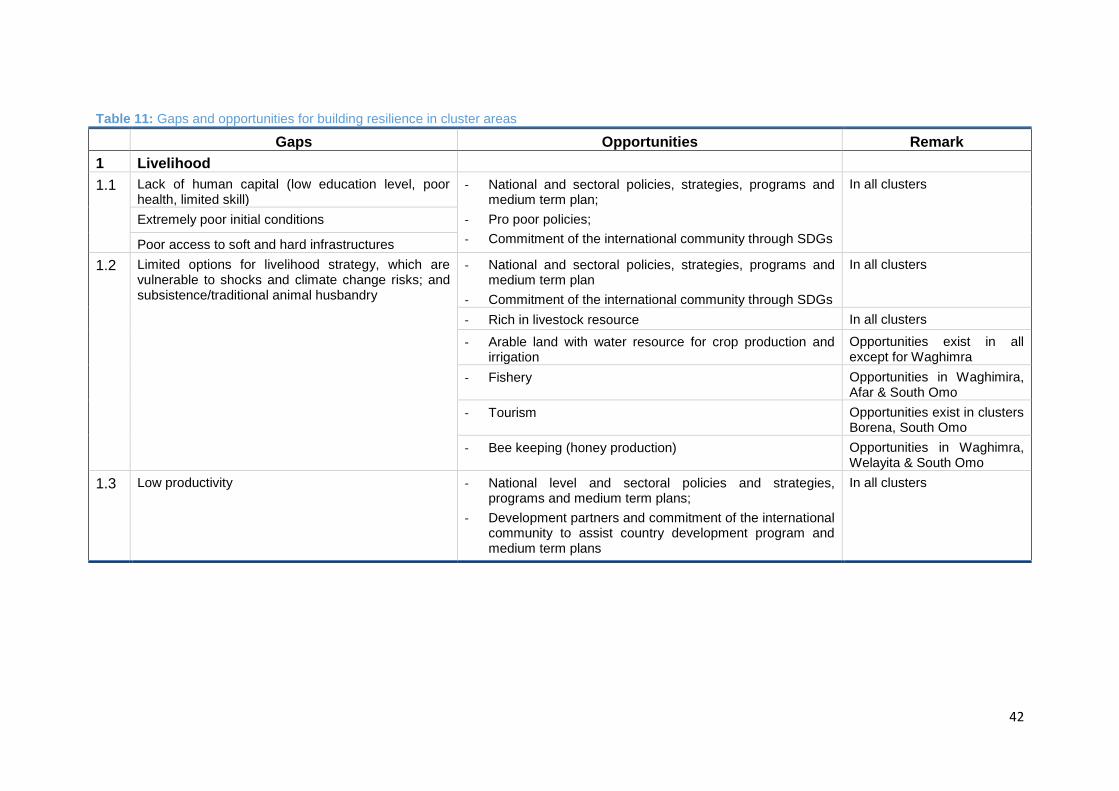
42
Table 11: Gaps and opportunities for building resilience in cluster areas
Gaps Opportunities Remark
1 Livelihood
1.1 Lack of human capital (low education level, poor health, limited skill)
- National and sectoral policies, strategies, programs and medium term plan;
- Pro poor policies;
- Commitment of the international community through SDGs
In all clusters
Extremely poor initial conditions
Poor access to soft and hard infrastructures
1.2 Limited options for livelihood strategy, which are vulnerable to shocks and climate change risks; and subsistence/traditional animal husbandry
- National and sectoral policies, strategies, programs and medium term plan
- Commitment of the international community through SDGs
In all clusters
- Rich in livestock resource In all clusters
- Arable land with water resource for crop production and irrigation
Opportunities exist in all except for Waghimra
- Fishery Opportunities in Waghimira, Afar & South Omo
- Tourism Opportunities exist in clusters Borena, South Omo
- Bee keeping (honey production) Opportunities in Waghimra, Welayita & South Omo
1.3 Low productivity - National level and sectoral policies and strategies, programs and medium term plans;
- Development partners and commitment of the international community to assist country development program and medium term plans
In all clusters

43
Gaps Opportunities Remark
- Crop disease/pest
- Low technology use such as improved seed, chemicals, improved livestock breed
- Absence or shortage of improved technology
- Poor access to transportation
- Poor market access and infrastructure/structure
- Absence/limited and poor veterinary facilities and services
- Livestock disease
- Shortage of livestock feed
- Limited institutional services and support
- Country structural organization from federal to local/kebele level to implement policies, strategies, programs and plans;
- Non-governmental organizations willingness to actively participate in the implementation of national and sectoral programs and plans to fill the available gaps
- Government commitment through its policy and regulations in private sector participation in the development of the country
Drought - DRM policies and strategies
- Water sector policy and strategy: Flood and drought control and mitigation efforts are also priorities in the water sector.
In all clusters
Flood - DRM policies and strategies
- Water sector policy and strategy: Flood and drought control and mitigation efforts are also priorities in the water sector.
Gaps observed in all but mainly in Afar, Borena, Welayita & South Omo
Conflict - Country strategy and experience in conflict management Gaps observed in all but mainly in Siti, Borena & South Omo
2 Health and Nutrition
2.1 Health
- Poor access to health facilities
- Available health facilities are with low access to basic facilities such as potable water supply, electricity,
- Shortage of essential drugs, laboratory supplies and long-acting family planning commodities
- Low utilization rate of available health facilities
- Health sector policy and strategy give due emphasis to provide accessible, and quality primary health service
- Education sector policy and strategy to expand access to basic education services to all
- GTP II: one of its priority areas is improvement in pharmaceutical supply service.
- Global strategies to reduce malaria transmission
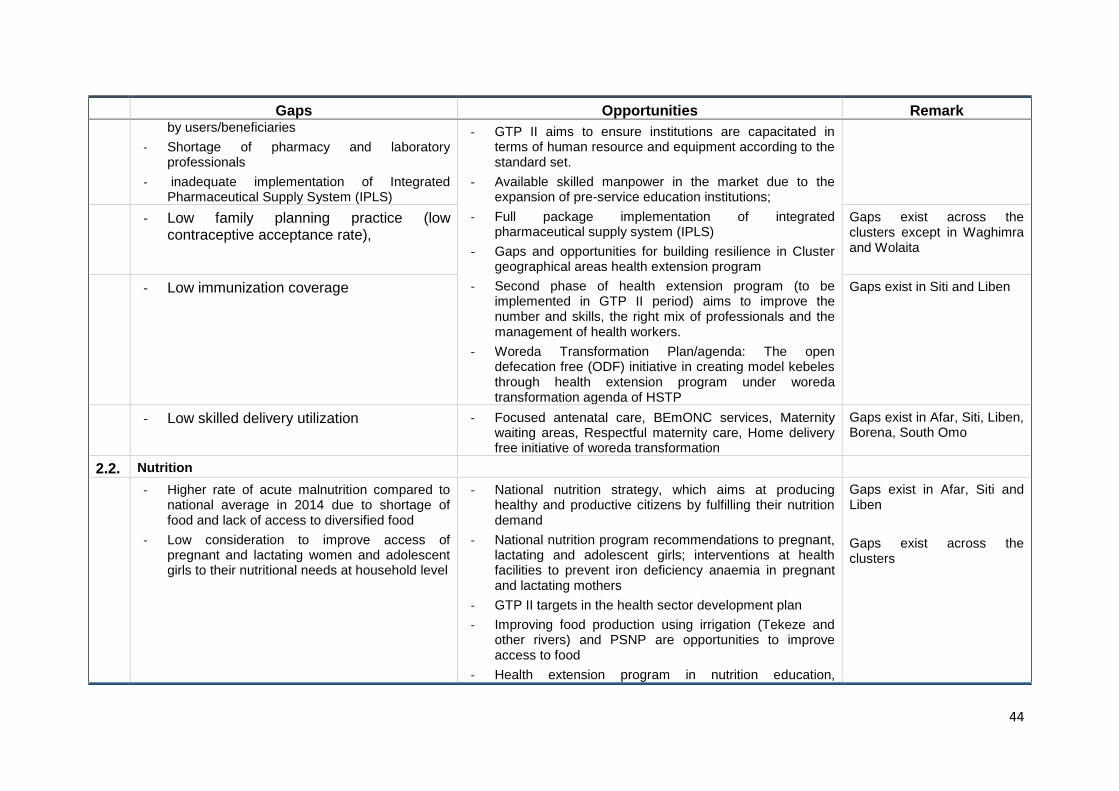
44
Gaps Opportunities Remark by users/beneficiaries
- Shortage of pharmacy and laboratory professionals
- inadequate implementation of Integrated Pharmaceutical Supply System (IPLS)
- GTP II aims to ensure institutions are capacitated in terms of human resource and equipment according to the standard set.
- Available skilled manpower in the market due to the expansion of pre-service education institutions;
- Full package implementation of integrated pharmaceutical supply system (IPLS)
- Gaps and opportunities for building resilience in Cluster geographical areas health extension program
- Second phase of health extension program (to be implemented in GTP II period) aims to improve the number and skills, the right mix of professionals and the management of health workers.
- Woreda Transformation Plan/agenda: The open defecation free (ODF) initiative in creating model kebeles through health extension program under woreda transformation agenda of HSTP
- Low family planning practice (low contraceptive acceptance rate),
Gaps exist across the clusters except in Waghimra and Wolaita
- Low immunization coverage Gaps exist in Siti and Liben
- Low skilled delivery utilization - Focused antenatal care, BEmONC services, Maternity waiting areas, Respectful maternity care, Home delivery free initiative of woreda transformation
Gaps exist in Afar, Siti, Liben, Borena, South Omo
2.2. Nutrition
- Higher rate of acute malnutrition compared to national average in 2014 due to shortage of food and lack of access to diversified food
- Low consideration to improve access of pregnant and lactating women and adolescent girls to their nutritional needs at household level
- National nutrition strategy, which aims at producing healthy and productive citizens by fulfilling their nutrition demand
- National nutrition program recommendations to pregnant, lactating and adolescent girls; interventions at health facilities to prevent iron deficiency anaemia in pregnant and lactating mothers
- GTP II targets in the health sector development plan
- Improving food production using irrigation (Tekeze and other rivers) and PSNP are opportunities to improve access to food
- Health extension program in nutrition education,
Gaps exist in Afar, Siti and Liben
Gaps exist across the clusters
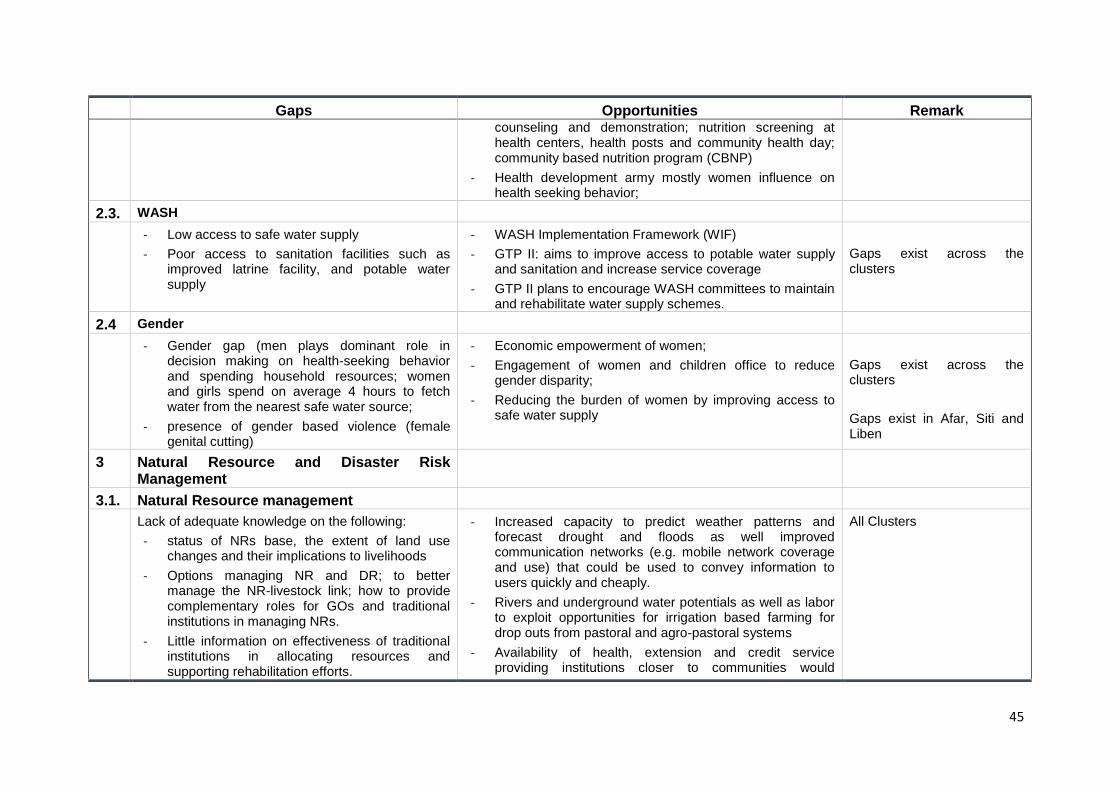
45
Gaps Opportunities Remark counseling and demonstration; nutrition screening at health centers, health posts and community health day; community based nutrition program (CBNP)
- Health development army mostly women influence on health seeking behavior;
2.3. WASH
- Low access to safe water supply
- Poor access to sanitation facilities such as improved latrine facility, and potable water supply
- WASH Implementation Framework (WIF)
- GTP II: aims to improve access to potable water supply and sanitation and increase service coverage
- GTP II plans to encourage WASH committees to maintain and rehabilitate water supply schemes.
Gaps exist across the clusters
2.4 Gender
- Gender gap (men plays dominant role in decision making on health-seeking behavior and spending household resources; women and girls spend on average 4 hours to fetch water from the nearest safe water source;
- presence of gender based violence (female genital cutting)
- Economic empowerment of women;
- Engagement of women and children office to reduce gender disparity;
- Reducing the burden of women by improving access to safe water supply
Gaps exist across the clusters
Gaps exist in Afar, Siti and Liben
3 Natural Resource and Disaster Risk Management
3.1. Natural Resource management
Lack of adequate knowledge on the following:
- status of NRs base, the extent of land use changes and their implications to livelihoods
- Options managing NR and DR; to better manage the NR-livestock link; how to provide complementary roles for GOs and traditional institutions in managing NRs.
- Little information on effectiveness of traditional institutions in allocating resources and supporting rehabilitation efforts.
- Increased capacity to predict weather patterns and forecast drought and floods as well improved communication networks (e.g. mobile network coverage and use) that could be used to convey information to users quickly and cheaply.
- Rivers and underground water potentials as well as labor to exploit opportunities for irrigation based farming for drop outs from pastoral and agro-pastoral systems
- Availability of health, extension and credit service providing institutions closer to communities would
All Clusters

46
Gaps Opportunities Remark
- Growing trend of individualization of communal resources (e.g. grazing lands and woodlands)
particularly support agriculture and livelihood diversification efforts, and hence potentially reduce dependence on livestock production alone and on exploitation of NRs
- Increased presence of GOs and offices in charge of NR and DRM at regional, zonal and woreda levels and in some cases committees at kebele levels
- The existence of willingness and interest to support from bilateral and multilateral development agencies;
- The presence of traditional institutions that govern access to and use of natural resources that are used communally;
- Presence in the country of international research centers (CIFOR, ICRAF, ILRI, IWMI, IFPRI..) and national institutes (EEFRI, EIAR, EDRI, Universities, ..) that could support the efforts of GOs and non-state actors in collating, building and sharing knowledge in NR and DRM
- The growing call for multi-faceted approach targeted to the different segments of pastoral and agro-pastoral communities.
All Clusters
- Little efforts to improve livestock feed resources, the vegetation cover on the landscapes, and the natural resource base at large notably rangelands in the clusters
All Clusters
- Fragmented and inadequate attempts to build DRM capacity at woreda and kebele level
- The DRM strategy of the government provides platform for encouraging coordination among actors. It lays the foundation for building capacity for early warning systems at lower levels of the government structure;
- Improved understanding of the advantages and limitations and building on the strengths of DRM strategies communities.
- Woreda level DSRM strategies and structures could lead initiatives to making such links and pilot such explicit links
- Existing national and international capacities to generate
spatial and temporal maps on the resource base and on options to improving management and sustainable use of NRs can be used
All Clusters
- Little attention to ensuring mobility reduces possibilities to use seasonally available water and fodder on wider areas
- Limited effort to make explicit links between food security (PSNP, HABP) and natural resources management
- Planning is not informed by knowledge on the status and changes of the natural resources base
3.2. Conflict
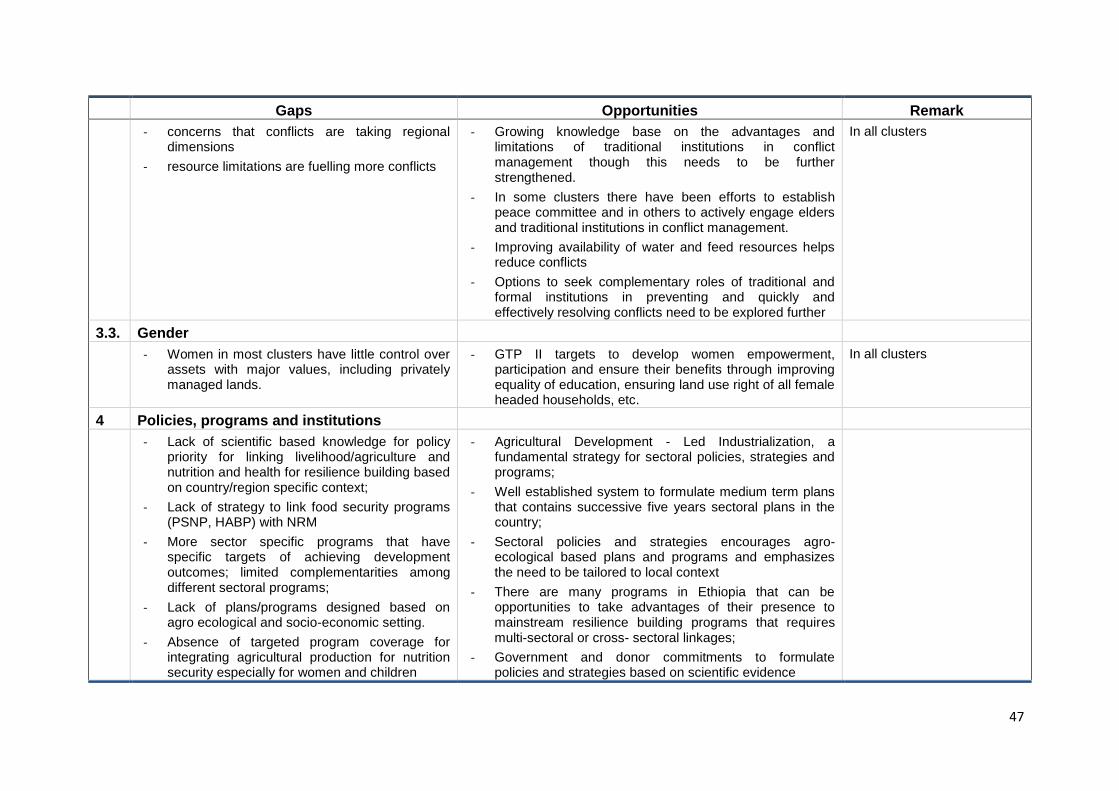
47
Gaps Opportunities Remark
- concerns that conflicts are taking regional dimensions
- resource limitations are fuelling more conflicts
- Growing knowledge base on the advantages and limitations of traditional institutions in conflict management though this needs to be further strengthened.
- In some clusters there have been efforts to establish peace committee and in others to actively engage elders and traditional institutions in conflict management.
- Improving availability of water and feed resources helps reduce conflicts
- Options to seek complementary roles of traditional and formal institutions in preventing and quickly and effectively resolving conflicts need to be explored further
In all clusters
3.3. Gender
- Women in most clusters have little control over assets with major values, including privately managed lands.
- GTP II targets to develop women empowerment, participation and ensure their benefits through improving equality of education, ensuring land use right of all female headed households, etc.
In all clusters
4 Policies, programs and institutions
- Lack of scientific based knowledge for policy priority for linking livelihood/agriculture and nutrition and health for resilience building based on country/region specific context;
- Lack of strategy to link food security programs (PSNP, HABP) with NRM
- More sector specific programs that have specific targets of achieving development outcomes; limited complementarities among different sectoral programs;
- Lack of plans/programs designed based on agro ecological and socio-economic setting.
- Absence of targeted program coverage for integrating agricultural production for nutrition security especially for women and children
- Agricultural Development - Led Industrialization, a fundamental strategy for sectoral policies, strategies and programs;
- Well established system to formulate medium term plans that contains successive five years sectoral plans in the country;
- Sectoral policies and strategies encourages agro-ecological based plans and programs and emphasizes the need to be tailored to local context
- There are many programs in Ethiopia that can be opportunities to take advantages of their presence to mainstream resilience building programs that requires multi-sectoral or cross- sectoral linkages;
- Government and donor commitments to formulate policies and strategies based on scientific evidence
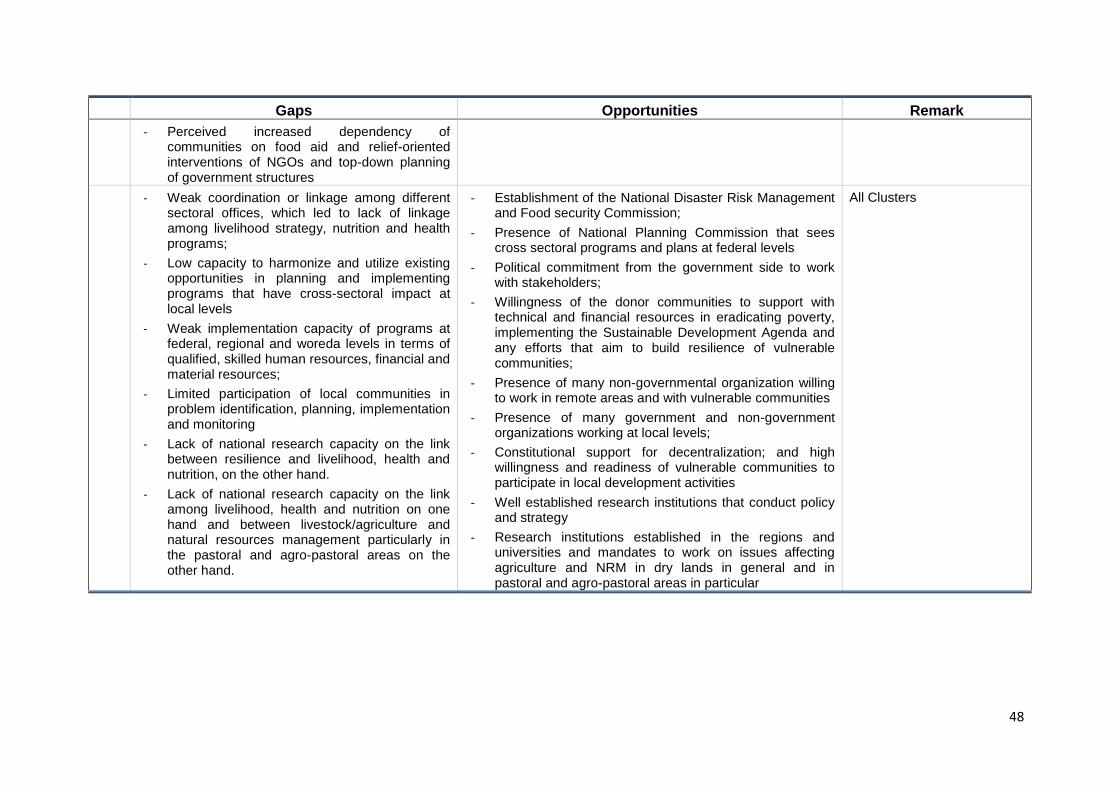
48
Gaps Opportunities Remark
- Perceived increased dependency of communities on food aid and relief-oriented interventions of NGOs and top-down planning of government structures
- Weak coordination or linkage among different sectoral offices, which led to lack of linkage among livelihood strategy, nutrition and health programs;
- Low capacity to harmonize and utilize existing opportunities in planning and implementing programs that have cross-sectoral impact at local levels
- Weak implementation capacity of programs at federal, regional and woreda levels in terms of qualified, skilled human resources, financial and material resources;
- Limited participation of local communities in problem identification, planning, implementation and monitoring
- Lack of national research capacity on the link between resilience and livelihood, health and nutrition, on the other hand.
- Lack of national research capacity on the link among livelihood, health and nutrition on one hand and between livestock/agriculture and natural resources management particularly in the pastoral and agro-pastoral areas on the other hand.
- Establishment of the National Disaster Risk Management and Food security Commission;
- Presence of National Planning Commission that sees cross sectoral programs and plans at federal levels
- Political commitment from the government side to work with stakeholders;
- Willingness of the donor communities to support with technical and financial resources in eradicating poverty, implementing the Sustainable Development Agenda and any efforts that aim to build resilience of vulnerable communities;
- Presence of many non-governmental organization willing to work in remote areas and with vulnerable communities
- Presence of many government and non-government organizations working at local levels;
- Constitutional support for decentralization; and high willingness and readiness of vulnerable communities to participate in local development activities
- Well established research institutions that conduct policy and strategy
- Research institutions established in the regions and universities and mandates to work on issues affecting agriculture and NRM in dry lands in general and in pastoral and agro-pastoral areas in particular
All Clusters
5. Strategic Option for Building Resilience Following the situation analyses, a detail analyses is made to identify strategic options to
address the gaps and utilize the opportunities so as to build the resilience of the vulnerable
communities. The options are identified based on the findings of the comprehensive situation
analyses of the vulnerable areas, review of policy, institutional and organizational arrangements
related to resilience building at federal, regional and local levels. We also used primary
information collected through field level activities as well as key informant interviews of key
stakeholders including policy making, donors, government offices and non-government
organizations that operate in the areas. Moreover, the analysis is supported by a review of
literature on resilience building and vulnerability focusing on the transmission mechanism from
interventions on livelihood, health, nutrition and WASH and Natural Resource Management
(NRM) and Disaster Risk Management (DRM). The strategic options proposed to build the
resilience of vulnerable communities in rural areas of Ethiopia are summarized as follows.
Fundamental strategic direction should be on interventions with complementarity effect:
Since resilience has a multidimensional aspect, it is strongly recommended that the
fundamental strategic direction is supporting interventions that have complementarity in building
resilience in the vulnerable communities. In this regard, the key strategic directions that have
such complementarity effects include interventions that focus on improving access to basic
social services and infrastructure, community based development to broaden interventions that
work on responsible use of natural resources that are supporting people’s livelihoods; promoting
and supporting climate smart agriculture and nutrition sensitive agricultural production practices
that also enhance productivity and farm income; school based interventions as well as capacity
building that improve governance system in coordination, accountability, planning, implementing
and monitoring of interventions at federal, regional and local levels as well as building national
and regional capacity for early warning and build capacity for preparedness. Given this, the key
strategic options focusing on specific thematic areas and with complementarity effects on
resilience building can be summarized as follow.
Major strategic options to improve the livelihood system for resilience building: The
policy implication of the current situations in the study areas is that the proposed strategic
options should not only consider addressing covariate factors but also individual specific factors
such as the capability to utilize opportunities. Accordingly, the proposed strategic option to build
51
resilience through improving the livelihood system of the vulnerable communities focus on
identifying interventions that improve the capabilities of individuals and communities in the
vulnerable areas, and their agricultural production and productivity. Due emphasis should also
be given to identify major strategic options to improve the livelihoods of communities in pastoral
development areas, which is one of the major livelihood system in the study areas. Interventions
are also required to improve or enhance non-farm rural development so that vulnerable
communities can have alternative livelihood strategies other than crop and livestock
productions.
Major strategic options to improve the health, nutrition and WASH for resilience building:
Important resilient building related policy implications can be drawn from the findings of the
situation analyses on the health, nutrition and WASH. In this regard, due emphasis needs to be
given for interventions that improve the service delivery and utilization, those that enhance
resilience-oriented nutrition; improving the gender dimension of the health, nutrition and WASH;
and improve the health information management system. Accordingly, the following
interventions are worth to consider.
First, strategic direction to improve health service delivery include interventions that improve
access to primary healthcare facilities through improving primary healthcare facilities,
infrastructure (water & electricity), human resource capacity and supply chain management for
drugs and supplies. Strategic directions to improve health service utilization include
interventions that focus on improving utilization of family planning services that focus on
reversible long acting contraceptives and post-partum family planning methods; interventions
that improve utilization of skilled delivery through strengthening basic emergency obstetric and
newborn care (BEmONC) services, maternity waiting areas and engaging traditional birth
attendants in the referral of women in labor to health facilities; and interventions that focus on
improving routine immunization services by focusing on reaching communities that do not have
access to primary health care facilities and strengthening surveillance and response system for
vaccine preventable childhood illness.
Second, strategic directions to improve WASH include interventions that improve population
access to safe water supply through rehabilitation of existing water supply systems to reduce
non-functionality and construction of new water supply systems; capacity building interventions
for sustainable management of WASH facilities at the community focusing on improving the
technical capacity of WASH committees at all levels in managing WASH facilities, managing
finance, resources and maintenance of WASH facilities. The sustainable management of WASH
52
facilities needs further studies to investigate its impact in creating long term sustainability and
ownership. Key strategic direction should also focus on interventions that improve access to
sanitation facilities and communication for behavioral change on hygiene and sanitation at the
communities through health extension program and health development armies.
Third, strategic directions to improve the nutrition status of infants, children, pregnant and
lactating mothers include strengthening routine nutritional assessment for young infants,
children, pregnant and lactating mothers with appropriate nutrition counselling for optimal
nutrition practices; improving food diversification through education, demonstration, agriculture
sensitive nutrition interventions like household gardening, community gardening, school
gardening, small scale irrigation, fishing etc.; and improving the capacity of early detection and
management of acute malnutrition through strengthening integrated community case
management (ICCM) at the community and integrated management of childhood illnesses at
the health facilities (IMNCI).
Fourth strategic directions to improve the gender dimension of health, nutrition and WASH
should mainly focus on women empowerment through interventions that focus on income
generating interventions like micro-finance, household gardening; and interventions that
improve the health of children, women and families through strengthening implementation of the
health extension program packages (HEP) through engagement of the health development
armies (HDA’s) in creating model households in health.
Major strategic options to improve the NRM and Disaster risk management system for
resilience building: In addressing the challenges, gaps and utilize the opportunities to improve
the NRM and DRM so as to build resilience, it is important that major strategic direction focuses
on the following.
First, the major strategic interventions towards improving the NRM that are targeted to build
resilience include those that improve natural resource conservation and utilization with
emphasis on rural land administration that carefully marries the roles and responsibilities of GOs
with traditional institutions, watershed management and expansion of small scale irrigation,
which are fundamental to build resilience in the vulnerable areas. Besides, exploring options for
working with elders, traditional institutions and Community Based Organizations (CBOs) to
mobilise the communities to better manage and responsibly use these common property
resources (e.g. in controlling bush encroachment, in reducing over grazing, excessive tree
cutting, ..) and in identifying and protecting areas that could be used as fodder banks and dry
season grazing areas.
53
Second, in relation to irrigation development, interventions that ensure sustainable agricultural
development that does not undermine mobility of pastoralists and agro pastoralists; that
enhances productivity through improved water utilization (e.g. multiple – use water system) and
agro-ecologically sensitive irrigation schemes that do not lead to salinity; growing diverse crops
that also contribute to livestock feed and human nutrition while also respond to market
demands. All these efforts also need to contribute to women’s empowerment through increased
asset ownership, and improved access to and control over natural resources including
production and cash income are proposed.
Third, in the disaster risk management, major strategic directions proposed include interventions
addressing elements of risk related to food security such as livestock and crop diseases,
supporting voluntary resettlement programs for those that cannot be mobile and plan to switch
to settled farming, improving the credit and risk insurance system that would help household not
to lose so much assets in times of disaster; exploring options to linking pastoral and agro
pastoral systems to national and global efforts of building climate resilient green economy;
strengthening community managed DRR practices and principles and creating incentive based
effective links between eco-system management and climate change to DRR; and those related
to climate change adaptation action plan (community contingency plan). Fourth, strategic
interventions that improve food security, disaster prevention and preparedness are strongly
advised. In this respect, the key strategic interventions include, but not limited to, those that
improve contingency food reserve and safety net programs especially to food insecure
households. This can be linked with strengthening voluntary and well negotiated and planned
resettlement programs and improving the credit system that enables to build household assets;
and establishing risk insurance system. In relation to social protection, it is strongly advisable to
support interventions that provide timely resources for transitory food insecurity in response to
shocks; and strengthening the delivery of demand-driven and market-oriented advice.
Strategic direction in improving the governance system for resilience: Since there are
important policy related gaps that hinder or jeopardize the effective implementation of the
strategic interventions proposed above, it is also strongly advisable to strategically promote and
support governance related interventions to effectively implement the proposed strategies. The
fundamental gaps related to governance include poor planning, lack of synergies among the
various resilience related interventions, weak coordination among various sectors, low
implementation capacity and lack of accountability at all level as well as lack of information and
knowledge on the linkage among the various thematic areas related to resilience building. Thus,
54
the important strategic issues proposed by the study include interventions that aim to improve
harmonization of the various sectoral strategies and programs; strengthen coordination
capacity; enhance implementation capacity and accountability for building resilience as well as
research that fill data and knowledge gaps. In these regard, the following interventions are worth
to consider.
First, since issues of resilience cut across many sectors, resilience has multi-sectoral
dimensions. Currently various programs are being implemented in all cluster areas that directly
or indirectly have influence on the resilience of the vulnerable communities. However, there is
lack of harmony among the various programs. The strategies, programs and interventions in the
various sectors should be harmonized. Towards this, it is strongly advisable to promote and
support interventions that aim to improve harmonization of the various sectoral strategies and
programs. Joint planning and budgeting can help to improve harmonization across sectors.
Second, there is huge capacity gap in formulating, implementing and monitoring and evaluation
of programs related to resilience building at all levels, and the gap is worse particularly at
regional, local and household level. Lack of capacity, poor integration, and lack of accountability
are among the key reasons for poor implementation. It is, therefore, strongly advisable to
promote and support interventions that improve the implementation of the strategies including
accountability at all levels including at federal, regional and local levels. Some of the proposed
strategic options that aim to enhance the implementation capacity and accountability include,
but not limited to, improving human resource development, information system, and supporting
the private sector to engage in the value chain of resilience related interventions. Besides, in
relation to improving the governance system in formulating, implementing and monitoring
interventions that build resilience of vulnerable communities at local level, it is advisable to
strategically support a decentralized and Community-Based System. In this respect, it is
strongly recommended to strategically strengthening people’s participation along all
development processes starting from the planning of the interventions up to monitoring and
evaluation. In addition, it is also advisable that capacity building interventions that build and
enhance the capacity of woreda and kebele councils are given due emphasis.
Third, the various programs that are related to resilience need to be effectively implemented.
These can be possible if and only if the different sector offices at federal, regional and local level
implement the programs in a well-coordinated system. Coordination should be strengthened at
all levels of government, down to the woreda level, as well as among donors and NGOs, and
such coordination should direct efforts toward common targets. Accordingly, it is strongly
advisable to support interventions that strengthen coordination among the various actors
55
including government, donors, NGOs at all levels. In addition, it is also advisable to support
interventions that focus in strengthening inter-sectorial coordination and collaboration at the
community, woreda, zonal and regional levels for effective implementation of the health sector
transformation plan particularly those that focus on primary healthcare facilities & other.
Fourth, with respect to filling information and knowledge gaps, academic and research
institutions as well as specialised government agencies (e.g. the national meteorological
agency, disaster commission, etc) and local governance bodies need to be engaged to jointly
identify and address knowledge and capacity related gaps. Accordingly, in relation to filling the
information gap, it is advisable to engage research institutions in supporting them to collect and
record data on the livelihood, health and nutrition aspects of resilience building since such
information can help to generate knowledge to design feasible monitoring and evaluation
systems that provide continuous feedback mechanisms to inform feasible interventions and their
implementation mechanisms at all levels. Second, it is also important to engage specialised
government agencies (e.g. the national meteorological agency, disaster commission, etc) and
local governance bodies since such organizations, together with research institutions, play
important role in generating and sharing data.
6. Further Research The fact that resilience building has multi-sectoral dimension means that any effort towards
building resilience requires empirical evidences conducted through multi-disciplinary approach.
In this regard, given the limited resources and the urgency of the issue particularly in rural areas
of the country and Sub Saharan Africa, there is still knowledge gap on the feasible policy,
technological, institutional and organizational options towards building resilience at household,
community and country levels. Accordingly, this study highlights the following as research gaps
that deserve attention.
First, despite the various researches conducted on water management, there is still knowledge
gap that feed into policy making on how to sustainably manage and integrate water supply
schemes with small scale irrigation schemes. Second, there is little empirical evidence on how
to integrate livelihood interventions with NRM & DRM specifically for low land pastoral areas.
Third, there is still knowledge gap on the institutional arrangements that create synergies and
effective implementation mechanism given the multi-sectoral & multidisciplinary nature of
resilience, including the potential role of the private sector in resilience building. Fourth, further
research is needed in how to integrate sustainable NRM & DRM including (i) understanding how
mobility (short and long term migration of youth) are affecting production systems in terms of
56
labour, gender, and asset build up; (ii) feasible technical and institutional options to increase
livestock feed and feed reserves at community and household levels; to mobilise communities in
rangeland management and incentives and challenges to do so; and as to how irrigation based
(smallholder or commercial) farming can be linked to supporting livestock production in terms of
producing fodder as well (either as a product or as a by-product, etc). Finally, though climate
change risks are recently given attentions among policy makers and development partners,
there is little empirical evidence generated based on ‘scenario – based analyses’ under different
environments that consider climatic, policy and technological changes and their implications for
resilience.
References
Amaha Kassahun (2006), Characterization of the Rangeland Resources and Dynamics of the Pastoral
Production Systems in the Somali Region of Ethiopia. PhD thesis, University of Free State,
Bloemfontein.
Central Statistical Agency (2016), Agricultural Sample Survey 2015/2016 (2008 E.C.). Vol. II Report on
Livestock and Livestock Characteristics. Private Peasant Holdings. Statistical Bulletin 583. June
2016. Central Statistical Agency, Federal Democratic Republic of Ethiopia. Addis Ababa. June
2016.
Central Statistical Agency (2014), Ethiopia Mini Demographic and Health Survey 2014, Central Statistics
Agency, August 2014
Central Statistical Agency (2013), Population Projection of Ethiopia for All Regions at Wereda Level from
2014 – 2017. June 2015. Central Statistical Agency, Federal Democratic Republic of Ethiopia. Addis Ababa.
August 2013. URL address: http://www.csa.gov.et/images/general/news/pop_pro_wer_2014-2017_final. Accessed
July 6, 2016
Central Statistical Agency (2013), Ethiopian National Food Consumption Survey, Ethiopian Public Health
Institute, Addis Ababa, Ethiopia, August 2013
Central Statistical Agency (2011), Ethiopia Demographic and Health Survey (2011), Central statistics
Agency, March 2011
Central Statistical Agency (2007) Population and Housing Census 2007, Central Statistical Agency
Disaster Risk Management and Food Security Sector ‘Disaster Risk Management Strategic Programme
And Investment Framework, Ministry Of Agriculture
Early Warning and Response Directorate DRMFSS, MoA ‘Early Warning and Response Analysis’
October 2012
EU (2016) EU Resilience Building Programme in Ethiopia (RESET II) January 2016 Map Map
Doc.:23_23.2_ECHO_DEVCO_012216_A4, Prepared by:OCAHA Creation date: 22 Jan 2016
EU (2015) Resilience Building in Ethiopia (RESET): Map of EU Resilience Clusters and Sectoral
Interventions (ECHO + DEVCO) March 2015
57
EU RESET Programme EU (2014), Linking EU’s humanitarian and development interventions in the
context of resilience building (Concept Note: EU- Resilience Building in Ethiopia): The case of
Ethiopia, (EU - Resilience Building in Ethiopia), draft 29 October, 2014
Federal Democratic Republic of Ethiopia, Ministry Of Water Resources Ethiopian Water Sector Policy
2001
Federal Democratic Republic of Ethiopia, Ministry Of Water Resources ‘Ethiopian Water Sector Strategy’
2001
Federal Democratic Republic of Ethiopia, Ministry Of Water Resources ‘Water Sector Development
Program Main Report Volume I’ October 2002
Federal Democratic Republic of Ethiopia, Ministry Of Water Resources ‘Water Sector Development
Program Main Report Volume Ii’ October 2002
Federal Democratic Republic of Ethiopia Sustainable Land Management Project II ‘Revised Final Draft
Document on Environmental and Social Management Framework (ESMF)’ September 2013
Addis Ababa
Federal Democratic Republic of Ethiopia Ministry of Agriculture ‘Regional Pastoral Livelihoods Resilience
Project (RPLRP)’ Environmental and Social Management Framework (ESMF) October, 2013
Addis Ababa
Federal Democratic Republic of Ethiopia Ministry of Agriculture ‘Regional Pastoral Livelihoods Resilience
Project (RPLRP) Environmental and Social Management Framework (ESMF)’ October, 2013
Addis Ababa
Federal Democratic Republic of Ethiopia Ministry of Agriculture ‘Regional Pastoral Livelihoods Resilience
Project (RPLRP) Resettlement Policy Framework (Final Revised)’ November, 2013 Addis Ababa
Federal Democratic Republic of Ethiopia Ministry of Agriculture ‘Regional Pastoral Livelihoods Resilience
Project (RPLRP) Integrated Pest Management Framework’ July 2014 Addis Ababa
Federal Democratic Republic of Ethiopia (2011), Ethiopia Disaster Risk Management Country ‘Plan
Project, Phase I: Environmental And Social Management Framework (ESMF)’ Disaster Risk
Management and Food Security Sector 14 June 2011
Federal Democratic Republic of Ethiopia (2013), ‘National Policy and Strategy on Disaster Risk
Management’ July 2013 Addis Ababa
Federal Democratic Republic of Ethiopia (2015), Health Sector Transformation Plan, August 2015
Global Health Workforce Alliance (2014), World Health Organization, 2014
Government of the Federal Democratic ‘Republic of Ethiopia National Nutrition Programme’ June 2013 –
June 2015
The Health Workforce in Ethiopia, Addressing the remaining challenges, Washington DC, World Bank,
2012
Melaku Bekele and Habtemariam Kassa. 2014. Governance challenges of dry woodlands. In: Reflections
on Development in Ethiopia: New Trends, Sustainability and Challenges. Dessalegne Rahmato,
Mehret Ayenew, Asnake Kifle and Birgit Habrermann (eds.) Pp. 269-285. ISBN: 978-99944-50-
52-7.
Ministry of Agriculture (2013), Sustainable Land Management Project Phase – II: settlement Policy
Framework (RPF) Final (Revised_final), August 28, 2013 Addis Ababa
58
Ministry of Agriculture (2013) Sustainable Land Management Project Phase – II: Social Assessment
Report (Final) August 18, 2013 Addis Ababa
Ministry of Finance and Economic Development (MoFED) (2006), Ethiopia: Building on Progress A Plan
for Accelerated and Sustained Development to End Poverty (PASDEP) (2005/06-2009/10)
Volume I: Main Text September, 2006 Addis Ababa
Ministry of Finance and Economic Development (MoFED) (2010), Growth and Transformation Plan I
(GTP I) (2015/16-2019/20) Volume I: Main Text, Federal Democratic Republic of Ethiopia, May
2010. Addis Ababa
Ministry of Finance and Economic Development Economic Policy and Planning ‘Rural Development
Policy And Strategies’ Addis Ababa April, 2003
National Planning Commission (2016) Growth and Transformation Plan II (GTP II) (2015/16-2019/20)
Volume I: Main Text, Federal Democratic Republic of Ethiopia, May 2016. Addis Ababa
National Planning Commission and the United Nations in Ethiopia (2015), MDG Report 2014 Ethiopia,
Assessment of Ethiopia’s Progress towards MDG’s, 2015.
National Nutrition Program (2013). Federal Democratic Republic of Ethiopia
National Disaster Risk Management Commission (NDRMC) (2016). Woreda disaster risk profile reports.
FDRE, Addis Ababa. Available at http://profile.dppc.gov.et/Pages/Wereda_Disaster_Risk_Profile_Indicator_Reports.aspx.
Accessed on 15 September 2016.
Respectful Maternity Care: The universal Rights of Childbearing women, The White Ribbon Alliance for
Safe Motherhood
WASH implementation framework, Federal Democratic Republic of Ethiopia, August 2011.
World Malaria Report (2015), World Health Organization Global malaria Program, 2016.
የኢትዮጵያ ፌዴራላዊ ዴሞክራሲያዊ ሪፐብሊክ (2005) ብሔራዊ የአደጋ ክስተት ስጋት ሥራ አመራር ፖሊሲና ስትራቴጂ፣ ሐምሌ 2005፣ አዲስ
አበባ