ethiopian panel on climate change first assessment …
TRANSCRIPT
ETHIOPIAN PANEL ON CLIMATE CHANGE
FIRST ASSESSMENT REPORT
WORKING GROUP I REPORT ON CLIMATE CHANGE OVER ETHIOPIA
ETHIOPIAN PANEL ON CLIMATE CHANG
FIRST ASSESSM EN T REPORT
W O RKIN G G RO U P I REPO RT ON CLIM ATE CH AN G E OVER ETH IO PIA
PHYSICAL SCIENCE BASIS

Ethiopian Academy of Sciences House No. 199, Woreda 9, Gulele Sub-city Near Commercial Bank of Ethiopia, Gulele Branch P. 0. Box: 32228 Addis, Ababa, Ethiopia
Tel: +251 112 59 57 45/50 or +251 112 59 09 43E-mail: [email protected] or [email protected]/[email protected] Website: www.eas-et.org/www.epcc-ei.org
Financed by the SCIP Fund: The SCIP Fund is Supported by DFID UK, Aid, The Royal Norwegian Embassy and The Royal Danish Embassy
Lead Author: Tesfaye GisilaAuthors: Jemal Seid, Andualem Shemelis, Temesgen Gebrem ariam , Gebru
Jember, Aklilu Amsalu (PhD)Review Editor: Gizaw Mengistu (PhD)Substantive Editor: Seyoum Mengitou (Prof.) ______________
© 2015 Ethiopian Academy of Sciences. All rights reserved Printed in Addis Ababa, Ethiopia ISBN:978-99944-918-2-7
Citation- This docum ent may be cited as follows:
Ethiopian panel on Climate Change (2015), First Assessm ent Report, Working
Group I Physical Science Basis, Published by the Ethiopian Academy of Sciences
About the Ethiopian Academ y of Sciences
The Ethiopian Academy of Sciences (EAS) was launched in April 2010 and recognized by an act of parliament (Proclamation No. 783/2013) as an independent institution mandated to provide, inter alia, evidence-based policy advice to the Government of Ethiopia and other stakeholders. Its major activities include undertaking consensus studies, conducting convening activities such as public lectures, conferences, workshops and symposia on issues of national priority: as well as promoting science, technology and innovation.

Acknowledgements
This book is part of the First Assessment Report of the Ethiopian Panel on
Climate Change (EPCC). The EPCC, established under the auspices of the
Ethiopian Academy of Sciences (EAS), primarily to, inter alia, produce periodic
assessments of climate change issues in Ethiopia, is a sub-project of the
"Environment Service and Climate Change Analyses Program (ESACCCAP)"
project jointly run by the Ethiopian Academy of Sciences, the Climate Science
Centre (CSC) and the Horn of Africa Regional Environment Centre and Network
(HoA-REC&N) of Addis Ababa University The Ethiopian Academy of Sciences
gratefully acknowledges the Department for International Development
(DFID) UK, the Danish Government and the Norwegian Government for their
support to the Project through the Strategic Climate Institutions Programme
(SCIP).
The book was produced through exemplary collaboration between lead
authors, authors, reviewers and editors indicated on the publisher's page
(copy-right page) of the book. EAS gratefully acknowledges them for their
dedicated service. The First Assessment Report has also benefited from the
validation workshop conducted on 20 and 21 November 2014. The Academy
gratefully acknowledges the participants for their input.
Masresha Fetene (Prof.)
Executive Director, Ethiopian Academy of Sciences
Table of ContentsPreface vi
1. Introduction 1
1.1 Background 2
1.2 Key concepts and Terminology 4
2. Observations of Atmosphere and land surface 6
2.1. Changes in Atmospheric Composition/ Radiation Budget,
Aerosol 6
2.2. Change in land use, land cover and Albedo 7
2.3. GHG 9
2.4. The Climate system over Ethiopia 13
2.5. Ethiopian Rainfall and Global teleconnection Features 20
2.6 Observations over Indian, Atlantic and Pacific Ocean and their
implication 23
3. Observed changes in climate extremes 30
3.1 Extreme precipitation events 32
3.2 Extreme Temperatures events 33
4. Changes in hydrological cycle 35
4.1 Surface Humidity 36
4.2 Troposphere Humidity 36
4.3 Evapotranspiration including Pan Evaporation 37
4.4 Clouds and aerosols 38
5. Climate impact on agriculture 44
5.1 Onset, Cessation, and Length of Growing Season 44
5.2 Onset of the growing season 44
5.3 Cessation of the growing season 45
5.4 Length of the growing season 47
6. Climate models and their characteristics 48
6.1 Introduction 48
6.2 Characteristics of Climate Models 49
6.3 Global climate models (GCMs) 50
6.4 Downscaling techniques and Simulation of Regional-Scale Climate 54
7. Future climate change 57
7.1 Introduction 57
7.2 CMIP5 model ensemble based historical changes in rainfall and
temperature 58
7.3 CMIP5 model ensemble based projected changes in rainfall 59
7.4 CMIP5 model ensemble based projected changes in temperature 61
References 64
Annex: Atlas of Climate Projections for Ethiopia 73

Preface
The Working Group I is one of the key working groups established by Ethiopian
Academy of Science to compile and assess the physical science aspect of
climate change over Ethiopia. The contribution of the working group to
Ethiopian Panel on Climate Change (EPCC) is a more detailed assessment
of the physical aspect of current and future climate change and variability
over Ethiopia while ensuring consistence with the Intergovernmental Panel
on Climate Change (IPCC) AR5 report. As a result, the assessment expands
existing new evidence of past, present and projected future climate change
reported by IPCC Working Group I, based on analysis of in-situ observations
and outputs from Coordinated Modeling Inter-comparison Project Phase 5
(CMIP5) models over Ethiopia.
The report is a compressive review of the physical aspect of climate variability
and change and it is based on IPCC report, other published and unpublished
scientific literatures on Ethiopian climate variability, change and its drivers
available up to the end of March, 2015 and ongoing investigations from
analysis of in-situ observations and data from CMIP5 models over Ethiopia.
The report has short summary for policymakers and seven chapters plus
annex. The first chapter presents an overview of observed extreme events
attributable to climate variability and change over Ethiopia, global climate
change in general, efforts to unravel evidences of climate change and its links
to anthropogenic factors as well as global initiatives to create awareness and
to tackle the problem. The second and the third chapters assess the observed
changes in mean climate and extremes over Ethiopia based on analysis of
instrumental records and climate archives. Chapters 4-5 describe observed
changes in the hydrological cycles and impact of climate change through
shift on onset, cessation of rainy seasons and length of growing season. The
introduction of climate models used in simulating past and present climate
is presented in Chapter 6. The seventh chapter covers analyses of the 21st
century projected changes in precipitation and temperature based on the
ensemble mean of fourteen CMIP5 models.
A new element in this Working Group I review assessment is the inclusion
of studies at local scales based on in-situ observations that resolve small
scale features peculiar to Ethiopia. Moreover maps of Climate Projections (in
Chapter 7 and in the Annex) containing future temperature and precipitation
projections for Ethiopia strengthens existing AR5 IPCC report on East Africa
with country level detailed evidences. However, the limitations of this report
is that it is based only on coarse resolution CMIP5 models since the models
are not downscaled either dynamically or statistically to resolve small scale
features spatially.
PHYSICAL SCIENCE BASIS | vii
1. Introduction
The increased frequency of extreme weather events which faced Ethiopia
in the 20th century may be one major impetus for enhancing the visibility of
climate change issues over the country, Thus, research activities dealing with
finding the major causes of these increasingly occurring extreme and severe
weather and climatic events in the country date from the 1980s onwards
(Gissila et al, 2004).
The major land marks of official research reports on Climate change over
Ethiopia include climate change assessment reports coordinated by the
National Meteorological Agency which included, US country climate change
study report on climatic trend and vulnerability to climate change in 1996, the
Initial National Communication Report of Ethiopia to the conference of the
parties in 2001 and the National Adaptation Plan of Action (Ethiopia's NAPA
report) in 2007. Since the publication of the NAPA report, various research
reports have confirmed that the country should face climate change issues,
and one of the objectives of this synthesis report is to undertake a general
review and assessment of the results of climate change research over the
country.
Anthropogenic climate change is one of the most pressing problems, which
have emerged on our planet in the 20th century, needing serious attention on
the part of Governments, the United Nations Organization and the Public.
The major milestones in the science of climate research that brought the
immensity of the problem to the attention of the public were the first and
the second World Climate Conferences in 1979 and in 1990, where solid
evidences on global warming and climate change were presented by Climate
scientists and researchers based by the study of direct and proxy climate data.
The first official admission of the UN Body on the problem of global warming
and climate change was, when the two specialized agencies of the United
Nations, the United Nations Environmental Program(UNEP) and the World
Meteorological Organization(WMO) decided in 1988 to set up an Inter
Governmental Panel on Climate Change (an international panel of climate
scientists, researchers and experts delegated by their Governments) to
undertake a more thorough investigation on this newly emerging problem of

global warming and climate change, and come out with concrete proposals
for the decision makers.
In 1990, the first Assessment report on global warming and climate change
was released by the Intergovernmental Panel on Climate Change (IPCC),
and a call for a global treaty regarding global warming and climate change
was put as a proposal by the IPCC. In the same year, the issue was raised
in the United Nations General Assembly and negotiations on a framework
convention began. In 1991, the first meeting of the Inter-Governmental
Negotiating Committee (INC) took place and in 1992, the Inter Governmental
Negotiating committee adopted the UNFCC text, and at the earth summit in
Rio, the UNFCC was opened for signature and in 1994 the UNFCC entered
force.
By 2013, the IPCC has reached its fifth assessment report and all the studies
undertaken so far have reconfirmed that global warming and climate change
has become one of the most important problems facing mankind.
1.1 Background
There is now increased scientific consensus that climate change is happening.
Observations and historical records provide strong evidence that the global
climate has already started to change. In its Fifth Assessment Report, the
IPCC (2013) has indicated that warming of the climate system is unequivocal,
and since the 1950s, many of the observed changes are unprecedented over
decades to millennia; the atmosphere and ocean have warmed, the amounts
of snow and ice have diminished, sea level has risen, and the concentrations
of greenhouse gases have increased. The trend in recent years show
increasing temperatures in various regions, and/or increasing extremes in
weather patterns.
During the last century, the average global temperature rose by 0.74°C which
is the largest and fastest warming trend in the history of the Earth. Current
projections show that the trend will continue and accelerate. The best
estimate indicates that the earth could warm by 3°C during the 21st Century.
Furthermore, the number and intensity of extreme events might increase
further as the global temperature continues to warm as a result of climate
change (WMO 2006). The radiation budget of the earth is a central element
2 I PHYSICAL SCIENCE BASIS

of the climate system. On average, radiative processes warm the surface and
cool the atmosphere, which is balanced by the hydrological cycle and sensible
heating. Spatial and temporal energy imbalances due to radiation and latent
heating produce the general circulation of the atmosphere and oceans. The
major landmark in this direction has been the detection of an increasing
trend of downward thermal radiation, based on data from observatories.
Climate changes prior to the Industrial Revolution in the 1700s can be explained
by natural causes, such as changes in solar energy, volcanic eruptions, and
natural changes in greenhouse gas (GHG) concentrations. However, research
indicates that recent climate changes cannot be explained by natural causes
alone; it is now certain that most of the change is due to human interference.
This is evident from the increasing greenhouse gas concentrations in the
atmosphere, positive radiative forcing, observed warming, and understanding
of the climate system (IPCC, 2013). Greenhouse gases, of which C02 is the
most important, trap heat in the earth's atmosphere, leading to the overall rise
of global temperatures, which are liable to disrupt natural climate patterns.
Modeling studies based on observations indicate an increase of 2.6 W nr2 per
decade over the 1990s, in line with model projections and the expectations
of an increasing greenhouse effect (Wild et al., 2008). It is found out that
human pollution mainly from fossil fuels, has added substantially to global
warming in the past 50 years (Fowler et al 2004; UNEP 2006). With global
warming on the increase and species and their habitats on the decrease,
chances for ecosystems to adapt naturally are diminishing.
Climate change is already having significant impacts in certain regions,
particularly in developing countries, and on most ecosystems. Africa is the
most vulnerable continent to the impacts of projected changes because of
widespread poverty which is a significant limitation to adaptation capabilities.
The climate of the continent is controlled by complex maritime and terrestrial
interactions that produce a variety of climates across a range of regions, e.g.,
from the humid tropics to the hyper-arid Sahara (Boko et al., 2007). There
is already evidence that Africa is warming faster than the global average,
and this is likely to continue although the overall trend is geographically
variable (Conway, 2009). According to the IPCC (2007), average temperatures
in Africa are predicted to increase by 1.5 to 3°C by 2050, and will continue
further upwards beyond this time. Over the next century, this warming
PHYSICAL SCIENCE BASIS |3

trend and changes in precipitation patterns are expected to continue and
be accompanied by a rise in sea level and increased frequency of extreme
weather events. Such changes are expected to put huge pressure on the
main economic activities and livelihoods of the people in the continent. For
instance, projections indicate that the population at risk of increased water
stress in Africa will be between 75-250 million and 350-600 million people
by the 2020s and 2050s, respectively (IPCC, 2007). In addition, climate
change is predicted to reduce the area of land suitable for rainfed agriculture
by an average of 6%, and reduce total agricultural GDP in Africa by 2 to 9%
(TerrAfrica, 2009).
Like manyotherdevelopingcountriesofthe world, Ethiopia is also experiencing
climate change and its impacts. Model predictions for Ethiopia indicate not
only a substantial increase in mean temperatures and an increase in rainfall
variability but also a higher frequency of extreme events such as flooding and
drought. The country's geographical location within the tropics and extremes
of topography in combination with the low adaptive capacity of the people
and their resources result in a high degree of vulnerability to the adverse
impacts of climate change. A strong link has been observed between climate
variations and the overall performance of the country's economy, mainly due
to the direct impacts of unreliable weather on agriculture and the links to
other sectors of the economy.
1.2 Key concepts and terminologies
This section attempts to describe some of the key concepts and terminologies
often used in climate science.
Weather: Weather describes the conditions of the atmosphere at a certain
place and time with reference to temperature, pressure, humidity, wind,
and other key parameters (meteorological elements); the presence of
clouds, precipitation; and the occurrence of special phenomena, such as
thunderstorms, dust storms, tornadoes and others (Cubasch, 2013).
Climate: Climate is usually defined in a narrow sense as the average weather,
or more rigorously, as the statistical description in terms of the mean and
variability of relevant quantities over a period of time ranging from months
to thousands or millions of years (Cubasch, 2013).
4 I PHYSICAL SCIENCE BASIS

Greenhouse Gases (GHG): A greenhouse gas is any gaseous compound in the
atmosphere that is capable of absorbing infrared radiation, thereby trapping
and holding heat in the atmosphere. The most significant greenhouse gases
include carbon dioxide (C02), methane (CH4), nitrous oxide (N20) and water
vapor (H20). Greenhouse gases increase the heat in the atmosphere and
cause the greenhouse effect, which leads to global warming.
Greenhouse Effect: The greenhouse effect is a process whereby the earth's
atmosphere traps thermal radiation from a planetary surface due to the
presence of greenhouse gases that allow incoming sunlight to pass through
but absorb heat radiated back from the earth's surface.
Global warming: Global warming refers to an increased in average global
temperatures which are believed to be caused primarily by increasing in
greenhouse gases such as carbon dioxide and other greenhouse gases (John
1997; Anup S. 2006).
Land use: Land use is commonly defined as a series of operations on land,
carried out by humans, with the intention to obtain products and/or benefits
through using land resources.
Land cover: Land cover is defined as the vegetation (natural or planted) or
man-made constructions (buildings, etc.) which occur on the earth surface. It
is the observed physical and biological cover of the earth's land, as vegetation
or man-made features. Water, ice, bare rock, sand and similar surfaces also
count as land cover.
Albedo: The fraction of solar radiation reflected by a surface or object, often
expressed as a percentage. Snow-covered surfaces have a high albedo, the
surface albedo of soils ranges from high to low, and vegetation-covered
surfaces and oceans have a low albedo. The Earth's planetary albedo varies
mainly through varying cloudiness, snow, ice, leaf area and land cover
changes (IPCC, 2013)
PHYSICAL SCIENCE BASIS |5

2. Observations of Atmosphere and land surface
2.1. Changes in Atmospheric Composition/Radiation Budget
Anthropogenic influence on climate occurs primarily through perturbations
of the components of the Earth's radiation budget. The radiation budget of
the Earth is a central element of the climate system. On average, radiative
processes warm the surface and cool the atmosphere, which is balanced
by the hydrological cycle and sensible heating. Spatial and temporal energy
imbalances due to radiation and latent heating produce the general circulation
of the atmosphere and oceans. The major landmark in this direction has been
the detection of an increasing trend of downward thermal radiation, based
on data from observatories.
The major causes for this increasing trend in the downward thermal radiation
were finally identified through various studies to be the increase in the green
house gases emitted to the atmosphere. Recent modeling studies based on
observations indicate an increase of 2.6 Wm per decade over the 1990s, in
line with model projections and the expectations of an increasing greenhouse
effect (Wild et al., 2008). Thermal radiation, also known as long wave,
terrestrial or far-IR radiation is sensitive to changes in atmospheric GHGs,
temperature and humidity.
The 1750 globally averaged abundance of atmospheric CO based on
measurements of air extracted from ice cores was 278 ± 2 ppm (Etheridge et
al., 1996). The current level of CO 400 ppm, which is 1.4 times the amount
recorded in the pre-industrial time.
Both the fifth assessment and the fourth assessment reports of the IPCC
indicate that increasing atmospheric burdens of well-mixed GHGs resulted in
a 9% increase in RF from 1998 to 2005 and in a 7.5% increase in RF from 2005
to 2011, with carbon dioxide (CO ) contributing 80% of these amounts. Thus,
the global warming observed in the 20th and in the 21! century is intrinsically
connected with the radiative forcing of the green house gases. This connection
has been well captured in the climate model outputs. However, it is important
to note that aerosols would have the opposing tendency of affecting the
radiation budget, dimming the solar radiation reaching the surface of the
earth. The level of aerosols in the atmosphere over Ethiopia is basically
6 I PHYSICAL SCIENCE BASIS

dependent on the level of dust activity and biomass burning that occur over
the country in addition to transport of aerosols from nearby regions (e.g.,
anthropogenic aerosol haze over the north Indian Ocean, due to atmospheric
circulation). Moreover, volcanic activity over the Afar depression may also
have some contribution. In this regard, it is important to realize that aerosol
from anthropogenic sources (i.e., fossil and biofuel burning) are confined
mainly to populated regions in the Northern Hemisphere (NH), whereas
aerosol from natural sources, such as desert dust, sea salt, volcanoes and
the biosphere, are important in both hemispheres and likely dependent
on climate and land use change (Carslaw et al., 2010). Aerosols levels over
Ethiopia due to dust activity is greatly characterized by seasonality, where the
maximum dust activity occurs in May-July. Though there are evidences from
observations that show increase in aerosols over the country, it is clear that
the state of the aerosols over Ethiopia can be considered as very insignificant
as compared with the state of aerosols observed over South Asia. However
the likelihood impact of the transport of aerosols from the South Asia region
to the region including Ethiopia is addressed in Chapter 4. It is important
to note here that it has not yet been established how much the seasonally
varying aerosols affect the surface radiation balance over Ethiopia, though
there are various eye witness reports of sudden cooling during intense dust
storms over north-eastern and northwestern lowlands of the country.
2.2. Changes in Land Use, Land Cover and Albedo
Land use and land cover change in relation to natural resources management
over Ethiopia is perhaps one of the topics investigated extensively. Knowledge
on land use and land cover changes, both on a local scale and large scale,
is essential as these changes cause great environmental concerns to local
and regional climate change. Several papers have been published which
monitored land use and land cover changes over the past several decades in
the different parts of Ethiopia. However, most of these studies cover smaller
areas, and there is no a comprehensive study which covers the entire country
yet. Available studies focused mostly on the highlands than the lowlands of
the country.
In northern Ethiopia, Nyseen et al (2009) investigated land use and land cover
change using a matched pair of photographs that date back to 1868 to assess
PHYSICAL SCIENCE BASIS |7

the changes over the last 140 years. They found out that the landscape has
already been in a severe state of degradation with limited vegetation cover in
1868. Until the recent massive plantations, the northern highlands in general
and Tigray in particular have been devoid of vegetation cover. A watershed
scale investigation by Aynekulu et al (2006) indicated that 75% of the forest
land had been converted into arable land over a period of 50 years. Studies
carried out in the north-western highlands of Ethiopia indicate a considerable
decline in the natural forest cover and expansion of cultivated land (Zeleke
and Hurni, 2001; Beweket, 2002; Gebrehiwot et al.. 2010).
In the north-eastern part of Ethiopia, land use and land cover change over the
past several decades has been considerable. Evidences indicate that there
has been massive deforestation that probably contributed to the prevalence
of severe droughts. Based on analysis of matched pairs of photographs
from 1937 and 1997, Crummey (1998) found out that the land cover in
Tahuladare area in Wollo is marked by more trees. Whereas in Kalu district,
Tekle and Hedlund (2000) found reduction of shrub lands by 51% and forests
by 31% between 1958 and 1986. Similarly, there has been a decline in land
area covered with shrubs by 58% between 1957 and 1986 in the Derekolli
catchment of South Wollo (Tegene, 2002).
A study in the Chemoga watershed of the north -western highlands of Ethiopia
shows a remarkable decrease of woodlands (by 46%) and shrublands (by
41%), and an expansion of cultivated land (by 13%) between 1957 and 1982
(Beweket, 2002). Zeleke and Hurni (2001) also reported a similar trend of land
use and land cover change: a decline of the natural forest cover from 27% in
1957 to 2% in 1982 with an increase of cultivated land from 39% in 1957 to
70% in 1982, which is a 78% increment of cultivated land within only two and
a half decades. According to Gebrehiwot et al (2010), the forest cover has
declined by about 86% and cultivated land expanded by 40% between 1957
and 1986 in the Koga watershed at the headwaters of the Blue Nile Basin.
Using travellers' accounts, MacCann (1995) found out that much of the
central highlands has been devoid of trees and wood fuel for at least 150
years due to deforestation. Based on analysis of remote sensing data in
Beressa watershed in North Shewa, Amsalu et al (2007) found a reduction
of the natural forest cover and plantations by 55% and 35%, respectively,
8 I PHYSICAL SCIENCE BASIS

between 1957 and 1984. In Debre Sina area, on the other hand, an increase
in woody plant cover, from 4.4% in 1957 to 9.2% in 1986, has been observed
mainly due to government afforestation and land rehabilitation programs
during the early 1980's (W0ien, 1995).
Significant loss of forest cover has been observed by Dessie and Christiansson
(2008) in parts of the south central Rift Valley region. Asimilar study by Muzein
(2006) in the Zeway-Awassa basin found a substantial loss of vegetation cover
at the expense of cultivated land expansion: about 27% of the woodland
cover is lost between 1973 and 1986, and cultivated land expanded by 113%
during the same period. Furthermore, Dessie and Kleman (2007) in Awassa
watershed, Garedew et al. (2009) in Arsi Negele area, Moges and Holden
(2009) in Umbulo catchment of the southern Ethiopian highlands, and
Mengistu (2009) in the Abaya-Chamo sub-basin of the southern Ethiopian
Rift valley area revealed a considerable decline in forest cover mainly due
to farmland expansion. In Western Ethiopia, Tefera and Sterk (2008) studied
land use and land cover changes in Fincha watershed and found out that
forest cover declined by 51.6% between 1957 and 1980 with a corresponding
expansion of cropland by 18.7% and decreased grazing land by 50.8%.
2.3. Greenhouse gases (GHG)
Climate change is mainly caused by the build-up of greenhouse gases in the
atmosphere which has led to an enhancement of the natural greenhouse
effect. Hence, the increasing concentration of greenhouse gases (such as CO,,
CH ., and N,0) in the atmosphere as a result of human activities and its possible
consequence of global warming and climate change has become a serious
international concern. GHG emissions have increased since the beginning of
the industrial era and accelerated worldwide, particularly since 1945. The
dominant causes of increase in emissions over the last 250 years mainly
include fossil fuel use, agriculture and land use (IPCC, 2007). However, the
extent of emissions varies across countries and economic sectors. Developed
countries are generally regarded for causing significant contributions to the
global greenhouse gas emissions.
PHYSICAL SCIENCE BASIS |9

Global trends
According to the fifth assessment report (IPCC, 2014), the atmospheric
concentrations of major GHG such as carbon dioxide, methane, and nitrous
oxide have increased to levels unprecedented in at least the last 800,000 years.
In particular, carbon dioxide concentrations have increased by 40% since pre
industrial times, primarily from fossil fuel emissions and secondarily from net
land use change emissions. However, though negligible, other natural events
can also contribute to an increase in global GHG emissions and average
global temperature. In 2011, the concentrations of carbon dioxide, methane,
and nitrous oxide were 391 ppm, 1803 ppb, and 324 ppb, and exceeded the
pre-industrial levels by about 40%, 150%, and 20%, respectively. On the other
hand, global estimates indicate that deforestation can account for 5 billion
metric tons of C 0 2 emissions, or about 16% of emissions from fossil fuel
sources. Tropical deforestation in Africa, Asia, and South America are thought
to be the largest contributors to emissions from land use change globally.
Waste and wastewater 3%
Residential & Com m ercial buildings
8%
Figure 1. Global GHG emissions by source (Source: IPCC, 2007).
As shown in Fig. 1, the energy sector is relatively the biggest contributor of
greenhouse gas emission. Most of the emissions result from the combustion
of fossil fuels mainly for transport and industrial activities. Of all the GHGs,
10 I PHYSICAL SCIENCE BASIS
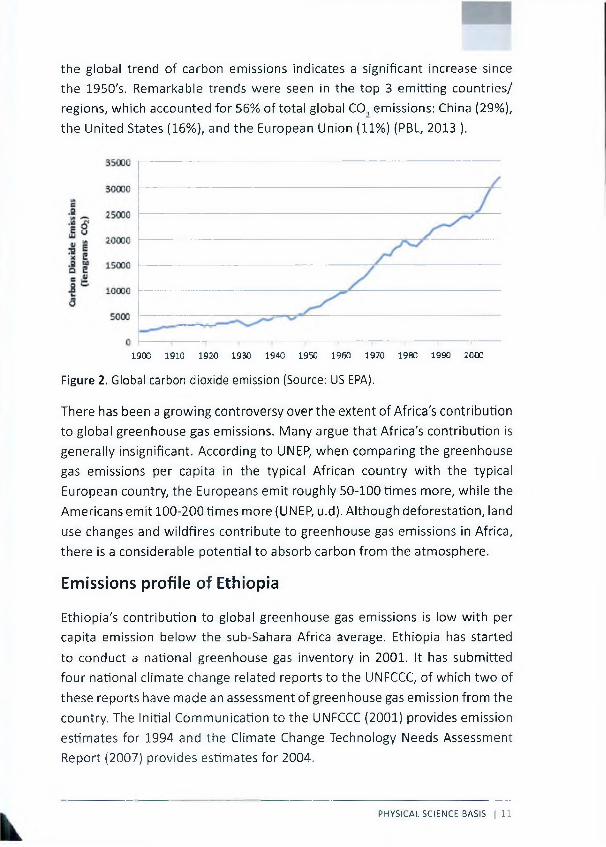
the global trend of carbon emissions indicates a significant increase since
the 1950's. Remarkable trends were seen in the top 3 emitting countries/
regions, which accounted for 56% of total global CO, emissions: China (29%),
the United States (16%), and the European Union (11%) (PBL, 2013 ).
1900 1910 1920 1930 1940 1950 1960 1970 1980 1990 2000
Figure 2. Global carbon dioxide emission (Source: US EPA).
There has been a growing controversy over the extent of Africa's contribution
to global greenhouse gas emissions. Many argue that Africa's contribution is
generally insignificant. According to UNEP, when comparing the greenhouse
gas emissions per capita in the typical African country with the typical
European country, the Europeans emit roughly 50-100 times more, while the
Americans emit 100-200 times more (UNEP, u.d). Although deforestation, land
use changes and wildfires contribute to greenhouse gas emissions in Africa,
there is a considerable potential to absorb carbon from the atmosphere.
Emissions profile of Ethiopia
Ethiopia's contribution to global greenhouse gas emissions is low with per
capita emission below the sub-Sahara Africa average. Ethiopia has started
to conduct a national greenhouse gas inventory in 2001. It has submitted
four national climate change related reports to the UNFCCC, of which two of
these reports have made an assessment of greenhouse gas emission from the
country. The Initial Communication to the UNFCCC (2001) provides emission
estimates for 1994 and the Climate Change Technology Needs Assessment
Report (2007) provides estimates for 2004.
PHYSICAL SCIENCE BASIS | 11

In general, the contribution of Ethiopia to the global GHGs emission is
negligible. According to the first National Communication total greenhouse
gas emission across four key economic sectors (energy, agriculture, industry,
waste) indicates national emissions of 48 million tons CO^-equivalent,
excluding C 0 2 emissions/removals from the Land Use, Land Use Change
and Forestry (LULUCF) sector. Agriculture, mainly the livestock sub-sector,
accounted for 80% of total emissions (38MtCO,e), energy 15% of the total
emissions (7.2MtCO,e) and the balance was emitted from waste, land use
change and industrial processes. The Climate Change Technology Needs
Assessment Report estimated greenhouse gas emissions from petroleum
combustion to have increased to 4.7M tC01e by 2004, an increase of 63%
compared to 1994. The total greenhouse gas emissions is estimated to have
increased to nearly !OOMtCO,e, i.e., twice that of 1994, and per capita
emission was 0.9tC02e in 1994 and reached to 1.2tCO.,e in 2010. Generally,
there were increasing trends of greenhouse gas emissions in the country in
the period from 1990 to 1995. The relative comparisons of increase indicated
that, C 0 7 have increased by 24% while emission of CH, and N^O increased by
1% and 119%, respectively. Aggregate greenhouse gases emissions in terms
of CO, equivalents have increased by 12% (NMSA 2001).
Although, it was planned to undertake a GHG emissions inventory for all
sources/sectors recommended by IPCC, only emissions from the following
sources/sectors are considered. These are:
• Energy consumption, either traditional or modern ;
• Agricultural practices: livestock, burning of agricultural residues, and
savanna;
• Natural forests (special attention given to emission from on site
burning);
• Waste emissions from landfills, municipal, and industrial liquid waste;
and
• Industrial processes (for instance, emissions from cement factories).
These sources/sectors are believed to be the most significant based on
Ethiopia's economic level of development. Ethiopia's emission profile is
dominated by emissions from energy and agriculture sectors, contributing
about 90% of the total emissions. The greenhouse gas emission from energy
sector is an important contributor to the total national emission. According
12 | PHYSICAL SCIENCE BASIS
to the 2004 inventory, it was accounted for more than 50% of the total GHGs
emission and was twice of the 1994 values. The combustion of fossil fuels
mainly in the transportation sector was responsible for 88% of the total CO;
in 1994 (B and M Development Consultants, 2006). Emissions from these
sectors and for five types of greenhouse gases (C02, CO, CH4, N?0, and N20)
is summarized as follows:
• Emissions from agriculture account for 80% to 85% of the total
emissions (38Mt C 0 ?e 84Mt CO,e in 1994 and 2010 respectively).
The main greenhouse gases emitted from the agriculture sector
are methane, N70 emissions from fertilizer, and methane and other
greenhouse gases from animal waste.;
• The energy sector constitutes 14% of the total emissions. Emissions
from the sector are due to CO, released during the combustion of fossil
fuels and methane released during the combustion of biomass fuels;
• Greenhouse gas emission from Industrial processes (not from energy
consumed in industry) in Ethiopia is mainly due to cement and lime
production (calcining of limestone to form clinker generates C 0 2, as
a result of chemical transformation of limestone); other industrial
processes with GHG emission include production of iron and steel,
aluminum, magnesium, and nitric acid;
• Land use change and forestry contribute to greenhouse gas emissions
due to deforestation and burning of forests, woodlands and grasslands.
Emissions from land use change are estimated to amount to 656ktC02e
in 2010; and
• Emission from waste (mainly solid and liquid waste from humans) is
due to emission of methane in anaerobic decomposition. A significant
and increasing amount of waste is generated in the main cities in open
waste dump sites and landfills and from waste water. Emissions are
expected to increase rapidly due to increased urbanization, increased
affluence of the population in cities and increased waste collection.
2.4 The Climate System over Ethiopia
The climate of Ethiopia is tropical modified by the topography of the country
and is dominated by convective precipitation associated with the seasonal
PHYSICAL SCIENCE BASIS | 13

migration of the Inter tropical Convergence Zone (ITCZ). Moreover, dynamic
convergence systems such as the Tropical Easterly jet stream also do play an
important role associated with the East west overturning Walker circulation
system during the northern hemisphere summer, locally known as Kiremt
season. The major topographies that affect the Climate system of Ethiopia
include the major mountain chains, the highland plateaus, the low lying
plains, the Great Rift Valley and river valleys associated with the major river
basins of the country. Thus, temperature is greatly determined by altitude
over Ethiopia where various attempts have been successful to develop a
relation between the mean annual average temperature of a place and its
altitude.
Rainfall in Ethiopia is characterized by high spatial and temporal variability as
a result of the topographic variation and geographical location. Topgraphic
highs play a major role in releasing the conditional thermodynamic
instabilities of the moist incoming air into the country strengthening
convective developments, where as precipitation patterns over topographic
lows greatly depend on the strength of large scale rainfall producing systems,
such as the ITCZ, the Tropical Easterly Jet, the creation of convergence zones
and local convective systems. When the windward side of the mountains
is characterized with a rising moist air, the leeward side of the mountains
is characterized with a descending warm dry air. Thus, rainfall activity on
locations with the same altitude can differ depending on whether they are
found over the windward or on the leeward side. As a result, one can observe
great difference in the rainfall between the western lowlands of the country
which are on the windward direction as compared with the lowlands of the
eastern parts of the country, which are usually on the leeward side.
2.4.1 Seasons and seasonal classification over Ethiopia
In high and mid-latitudes, seasons are classified as winter, spring, summer
and autumn, while in low latitudes they are categorized as wet and dry
seasons. In the case of Ethiopia, air mass analysis of seasonality over the
country indicates that there are three major seasons over the country,
which include the Belg Season (Feb-May), Kiremt season (June-September)
and Bega Season (October-January). This seasonality is basically the result
of the seasonal migration of the Inter tropical Convergence Zone (ITCZ) and
14 I PHYSICAL SCIENCE BASIS

the seasonal distribution of the atmospheric pressure systems (both over
land and over the near by Oceans) and the quasi stationary sub tropical
anticyclones over the Indian Ocean and the Atlantic Ocean (Endalew, 2007).
The major rainfall regimes of the country include four cases where group
A of the rainfall regime corresponds with areas having a distinct wet and a
distinct dry season, group B corresponds with areas having two wet and two
dry seasons, and group C corresponds with two wet and one dry season in
between (Fig. 3).
Figure 3. Rainfall Regimes (left) and topography map (right) of the Country.
The main moisture source during the Belg (Spring season) and the Bega
(October-January) can be considered as the Indian Ocean where as the
Ethiopian summer rains occur as air masses carrying moisture from the Indian
Ocean, the Gulf of Guinea and the region to the north of Ethiopia, converge
above the Ethiopian highlands (Hurk et al. 2005; Korecha and Barnston 2007;
Segele, 2009; Lamb et al. 2009; Viste and Sorteberg 2011). Recent studies
(Mengistu Tsidu, 2012a) based on high resolution gridded rainfall shows
presence of more rainfall regimes within the three broad categories (see Fig. 4).
PHYSICAL SCIENCE BASIS | 15

Figure 4. (left) The homogeneous rainfall regimes determined from the new gridded
gauge rainfall data based on the self-organizing map and (right) their seasonal rainfall
variation (Source: Mengistu Tsidu, 2012a).
The major basic reasons for the division of the country, in to the given rainfall
regimes can be ascribed to the combined effect of the major topographies
of the country with the associated orientation of the moisture bearing winds
and the North-South meridional movement of the ITCZ.
2.4.2 Weather systems affecting Ethiopia
Seasonal and annual rainfall variations in Ethiopia as well as the neighboring
areas of the region are associated with the macro-scale pressure systems and
monsoon flows (Tesfaye 1986, 1987; Hastenrath, 1991). Bekuretsion (1987a)
has indicated that the weather and climate of Ethiopia arises from the
influence of tropical weather systems, like the Intertropical Convergence Zone
(ITCZ), the monsoon, easterly waves, etc., and quasi-stationary subtropical
anticyclones of both northern and southern hemisphere. The interactions
between the tropical and extratropical weather systems produce major
active weather over the country, especially during the months of February to
May (Northern Hemisphere Spring). The main weather bearing systems for
the Bega, Belg and Kiremt seasons, respectively are discussed below
2.4.2.1 Weather Systems during the Bega season
During Bega (October to January) the country predominantly falls under
the influence of warm and cool northeasterly winds. These dry air masses
originate either from the Saharan anticyclone or from the ridge of high
16 | PHYSICAL SCIENCE BASIS

pressure extending into Arabia from the large high over central Asia (Siberia).
However, occasionally the northeasterly winds are interrupted when
migrating low pressure systems originating in the Mediterranean area move
southwards and interact with the tropical systems resulting in unseasonal
rains over central and northern Ethiopia. Occasionally the development of
the red Sea Convergence Zone (RSCZ) also produces rains over northeastern
Ethiopia (Pedgley, 1966). Moreover the southward migration of the ITCZ
produces rains over the southern and southeastern lowlands of the country,
where October-November constitutes their short rainy season with moisture
incursion from the Indian Ocean.
Figure 5. The ITCZ and the quasi stationary subtropical anticyclones during the Bega
season.
2A.2.2. Weather Systems during the Belg season
During Belg (the small rainy season) which is from March to May, the Arabian
high moves towards the northern Arabian Sea. When it is pushed over the
water body, it causes a moist southeasterly air current to flow towards
Ethiopia (NMSA 1996; Camberlin et al, 2002). Occasionally, there are also
frontal lows that either originate from the Mediterranean area or originate
within the Atlantic Ocean and are swept through from west to east. These
occur in association with a cold front, the intensity of which depends on
the temperature contrast ahead and behind the front. As it reaches east
PHYSICAL SCIENCE BASIS | 17

of Mediterranean Sea, the surface front is split into two: one front over
the Arabian lowland and the other over the Sudan lowland (Gizaw, 1968).
Once the surface fronts reach over the high grounds, they interact with
the equatorial systems and produce abundant rains over the northern,
northeastern, central parts of Ethiopia and the escarpments. Sometimes
when the low-level westerly trough penetrates along the Rift Valley, the
rainfall activity could linger for some days.
The meridional arm of the ITCZ also contributes for the rainfall activity over
East Africa. Hence, it produces rainfall during February/March over south
west of Ethiopia (Kassahun, 1987a). The formation of intense and frequent
tropical disturbances over the southeast Indian Ocean occurs simultaneously
with Belg and Kiremt rainfall deficiency in Ethiopia (Bekele, 1992).
Figure 6. The ITCZ and the quasi stationary subtropical anticyclones during the Belg
season.
2.4.2.3 Weather systems during the Kiremt season
During Kiremt season, the low-level air circulation over the western half of
the Indian Ocean is dominated by the southwest monsoon winds over the
Arabian Sea, a strong cross-equatorial flow along the East African coast and
over the adjacent ocean, and southeasterly trade winds in the Southern
Hemisphere (SH). The high topography of the African coast diverts the main
18 | PHYSICAL SCIENCE BASIS
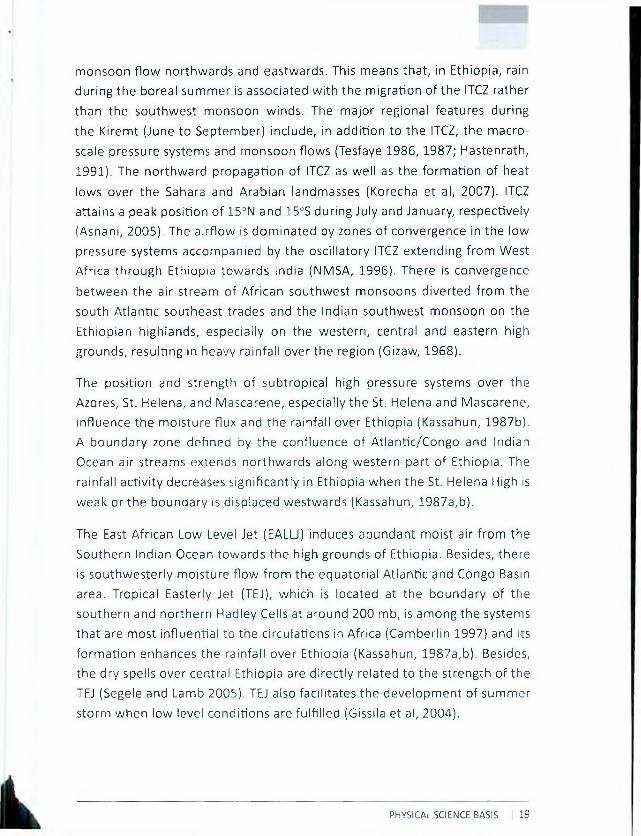
monsoon flow northwards and eastwards. This means that, in Ethiopia, rain
during the boreal summer is associated with the migration of the ITCZ rather
than the southwest monsoon winds. The major regional features during
the Kiremt (June to September) include, in addition to the ITCZ, the macro
scale pressure systems and monsoon flows (Tesfaye 1986, 1987; Hastenrath,
1991). The northward propagation of ITCZ as well as the formation of heat
lows over the Sahara and Arabian landmasses (Korecha et al, 2007). ITCZ
attains a peak position of 15JN and 15°S during July and January, respectively
(Asnani, 2005). The airflow is dominated by zones of convergence in the low
pressure systems accompanied by the oscillatory ITCZ extending from West
Africa through Ethiopia towards India (NMSA, 1996). There is convergence
between the air stream of African southwest monsoons diverted from the
south Atlantic southeast trades and the Indian southwest monsoon on the
Ethiopian highlands, especially on the western, central and eastern high
grounds, resulting in heavy rainfall over the region (Gizaw, 1968).
The position and strength of subtropical high pressure systems over the
Azores, St. Helena, and Mascarene, especially the St. Helena and Mascarene,
influence the moisture flux and the rainfall over Ethiopia (Kassahun, 1987b).
A boundary zone defined by the confluence of Atlantic/Congo and Indian
Ocean air streams extends northwards along western part of Ethiopia. The
rainfall activity decreases significantly in Ethiopia when the St. Helena High is
weak or the boundary is displaced westwards (Kassahun, 1987a,b).
The East African Low Level Jet (EALLJ) induces abundant moist air from the
Southern Indian Ocean towards the high grounds of Ethiopia. Besides, there
is southwesterly moisture flow from the equatorial Atlantic and Congo Basin
area. Tropical Easterly Jet (TEJ), which is located at the boundary of the
southern and northern Hadley Cells at around 200 mb, is among the systems
that are most influential to the circulations in Africa (Camberlin 1997) and its
formation enhances the rainfall over Ethiopia (Kassahun, 1987a,b). Besides,
the dry spells over central Ethiopia are directly related to the strength of the
TEJ (Segele and Lamb 2005). TEJ also facilitates the development of summer
storm when low level conditions are fulfilled (Gissila et al, 2004).
PHYSICAL SCIENCE BASIS | 19

Figure 7. The ITCZ, the macro-sc ile pressure systems and the quasi stationary
subtropical anticyclones during the Kiremt season^
2.5 Ethiopian rainfall and global teleconnection features
Various studies on the inter-annual rainfall variability over Ethiopia have
shown the presence of a teleconnection between the rainfall variability
over the country and patterns of large scale atmospheric circulations like
the Walker circulation which have proved to be associated with variabilities
related with large sea surface temperature anomaly over the Indian and the
Pacific Ocean (Nicholls, 1993; Ininda et a l i 1987; Tadesse, 1994; Camberlin,
1995; Gissila et al., 2004; Shanko, 2000; Endalew, 2007).
The major result of these studies is the association between strong El
Nino-southern oscillation (ENSO) events and regional climate anomalies
over Ethiopia. The first person to indicate indirectly the presence of a link
between the southern oscillation and rainfall variability in parts of Ethiopia
was Sir Gilbert Walker. In his calculations of the southern oscillation, one of
the variables he used was the Nile flood level, whose major water source is
the Ethiopian Highlands (Walker and Bliss, 1932). Later on , Quinn (1992)
confirmed this, demonstrating that the variability between high and low flood
levels of the River Nile is related to the ENSO cycle. El Nino's role in Ethiopian
drought was explored by Nicholls (1993). That study associated the severe
drought and famine of 1888-89 in Ethiopia with the 1888 strong El Nino
warming. Ininda et al. (1987), Tadesse (1994) and Camberlin (1995) have also
20 I PHYSICAL SCIENCE BASIS A

described the close association between El Nino events and drought over
Ethiopia.
June-September rainfall over the Ethiopian highlands is positively correlated
to the equatorial East Pacific sea level pressure and the southern oscillation
index, and negatively correlated to SST over the tropical eastern pacific Ocean
as expected, confirming again that ENSO episodes are associated with below-
average June-September rainfall over the Ethiopian Highlands (Seleshi and
Zanke, 2004). Various studies have revealed the relationship between ENSO
and Ethiopian rainfall and atmospheric systems (Bekele, 1993). The principal
cause of drought is asserted to be the fluctuation of the global atmospheric
circulation, which is triggered by the SST anomalies occurring during ENSO
events. These phenomena have significant impact on the displacement and
weakening of the rain producing mechanisms in Ethiopia (Haile, 1988). A
comparative study of a drought year (1972) and a normal rainfall year (1967)
over the global tropics for the boreal summer months revealed that for a
drought year we have (1) a weaker TEJ, (2) a weaker Tibetan high, and (3)
a southeastward shift of the major circulation patterns as well as of several
dynamic parameters (Krishnamurti and Kanamitsu, 1981). Similarly, the
major rain-producing mechanism in Ethiopia and its vicinity - the ITCZ - was
found to be weak, shallow, and shifted southeastward in drought years
(Kruzhkova, 1981; Lamb, 1978). The findings of a case study of seasonal
forecasts in Ethiopia are also consistent with the above mentioned results
(Haile, 1987). These and other findings confirm that the fluctuations of
atmospheric circulation, which are sometimes triggered by SST anomalies in
the equatorial Pacific have significant impacts on the position, magnitude,
and intensity of the rain-bearing systems in Ethiopia The above-mentioned
changes of the rain-bearing systems frequently caused meteorological,
agricultural, and hydrological drought. However, the 1982-83 El Nino, which
was by far the most intense one, did not produce a very dry Kiremt (Ward and
Yeshanew, 1990).
The ENSO events may not be the only cause of meteorological drought in
Ethiopia. A growing body of evidence suggests that Indian Ocean processes
also play an important role in controlling African rainfall (e.g. Goddard and
Graham, 1999; Latif et al., 1999; Black et al., 2003). Although all three of
these studies focus on equatorial coastal regions, rather than on Ethiopia,
PHYSICAL SCIENCE BASIS | 21

studies of the dynamics of the Indian Ocean basin as a whole suggest that
Indian Ocean processes affect Ethiopian climate. For example, Cadet and
Diehl (1984) identified the warming over the western Indian Ocean in the
area of the Somali Current and the southwestern Indian Ocean as important
characteristics of the year 1972, a drought year in Ethiopia. The relationship
between the Ethiopian rainfall during Belg and the tropical cyclones over the
southwest Indian Ocean indicates that low/high frequency of the cyclones
resulted in excess/deficit rainfall (Shanko et al, 1998).
Furthermore, in Ethiopia and Eritrea, Belg rainfalls have been shown
to be associated with the Northern Hemispherical subtropical westerly
jet (Habtemichael and Pedgley, 1974). The bega and belg seasons are
overwhelmed by the north east continental cool air- stream from the Sahara and progression of the ITCZ in its south- north migration (Camberlin and
Philippon, 2002; Conway 2000; Sileshi and Zanke, 2004). The belg season
also coincide with the development of a thermal low (Cyclone) over southern
Sudan, and winds blowing from the Gulf of Aden and the Indian Ocean highs
(Sileshi and Zanke, 2004).
The variability of African rainfall is statistically related to both Pacific and
Indian oceans, but the variability in the two oceans is also related. While
the SST variability of the tropical Pacific exerts some influence over the
African region, it is the atmospheric response to the Indian Ocean variability
that is essential for simulating the correct rainfall response over eastern,
central, and southern Africa. Analysis of the dynamical response(s) seen in
the numerical experiments and in the observations indicate that the Pacific
and Indian Ocean have a competing influence over the Indian Ocean/African
region. This competition is related to the influence of the two oceans on the
Walker circulation and the consequences of that variability on low-level fluxes
of moisture over central and southern Africa (Hastenrath and Polzin, 2003).
Comparison of the wind anomalies that develop during extreme Indian Ocean
dipole or Zonal mode (IOZM) events with those that develop during weaker
(moderate) events shows that strong easterly anomalies in the northern-
central Indian ocean are a persistent feature of extreme, but not of moderate,
IOZM years. It is suggested that these anomalies weaken the westerly flow
that normally transports moisture away from the African continent, out over
22 I PHYSICAL SCIENCE BASIS
the Indian Ocean. Thus, during extreme IOZM years, rainfall is enhanced over
east Africa and reduced in the central and eastern Indian Ocean basin (Emily
and Julia, 2002; Bahaga et al., 2015).
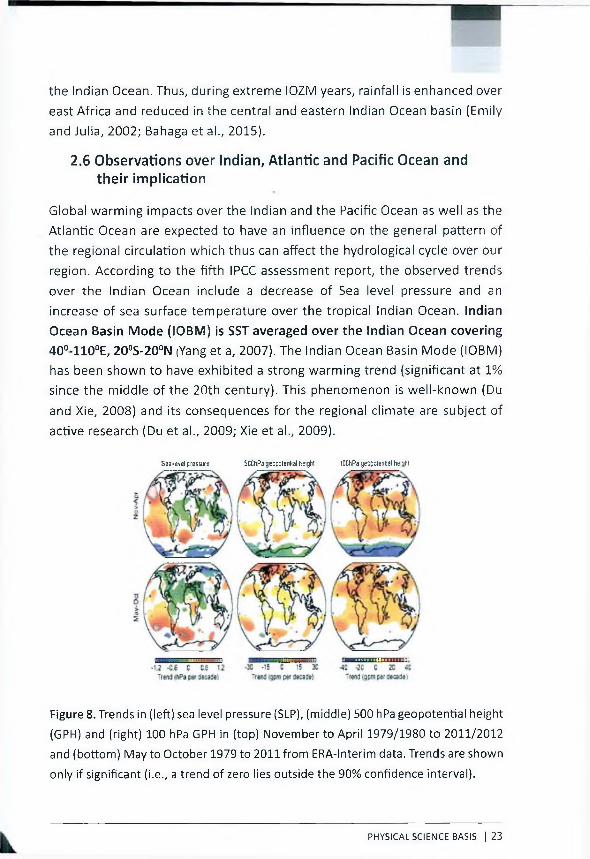
2.6 Observations over Indian, Atlantic and Pacific Ocean and their implication
Global warming impacts over the Indian and the Pacific Ocean as well as the
Atlantic Ocean are expected to have an influence on the general pattern of
the regional circulation which thus can affect the hydrological cycle over our
region. According to the fifth IPCC assessment report, the observed trends
over the Indian Ocean include a decrease of Sea level pressure and an
increase of sea surface temperature over the tropical Indian Ocean. Indian
Ocean Basin Mode (IOBM) is SST averaged over the Indian Ocean covering
40°-110°E, 20°S-20°N (Yang et a, 2007). The Indian Ocean Basin Mode (IOBM)
has been shown to have exhibited a strong warming trend (significant at 1%
since the middle of the 20th century). This phenomenon is well-known (Du
and Xie, 2008) and its consequences for the regional climate are subject of
active research (Du et al., 2009; Xie et al., 2009).
Sea-level pressure SCChPa gecpcteniial heigh! ICChPa ge;p:ienCal helghi
Figure 8. Trends in (left) sea level pressure (SLP), (middle) 500 hPa geopotential height
(GPH) and (right) 100 hPa GPH in (top) November to April 1979/1980 to 2011/2012
and (bottom) May to October 1979 to 2011 from ERA-lnterim data. Trends are shown
only if significant (i.e., a trend of zero lies outside the 90% confidence interval).
PHYSICAL SCIENCE BASIS | 23

This warming has been estimated to be greater than IK , which can affect
the large scale circulation over the region (Sperber et al. 2000). Normally the
impact of the warming over the Indian Ocean over the circulation systems
over Ethiopia is greatly determined on the time of the year or the season
and also on which part of the Indian Ocean is this warming significant.
For example an increase in the warming of the northern Indian Ocean on
the Arabian sea during the months of October-November can lead to the
formation of more depressions that can move to the horn of Africa and bring
rain (which is usually called unseasonal rainfall over the central and the
northern parts of Ethiopia), where as in combination with other dynamical
systems can lead to more rain to the short rain season of the southern and
southeastern lowlands of Ethiopia. In contrast, a warming over the South
West Indian Ocean and also the western Indian Ocean during the months of
February/March to May season can lead to the formation of tropical cyclones
resulting in much drier condition over Ethiopia including other parts of East
Africa, where most of moisture bearing winds from the Indian Ocean will be
directed towards the south-eastern parts of Africa, resulting in more wetter
condition over Mozambique and neighboring areas.
SST anomalies in the Indian and Pacific Oceans have a fundamental influence
on Sahel rainfall and have been associated with Nile flows (Folland et al.
1986). These variations in the Indian and Pacific oceans are affiliated with
rainfall changes in Ethiopia and East Africa (Beltrando and Camberlain, 1993;
Sileshi et al., 1995; Conway, 2000). It has also been suggested that positive
SST anomalies in the southwestern Indian Ocean (SWIO) may increase
oceanic precipitation and decrease rainfall over eastern Africa, especially
during March-May (Funk et al. 2005). It is believed that the low pressure
systems associated with the storms of April 1984 in the SWIO accounted for
the severe and widespread drought in the horn (Macodras et al., 1989).
ENSO has been shown to strongly interact with climate dynamics in the Indian
Ocean where during most El Nino events, anomalies are observed in the
Indian Ocean (Cadet 1985; Reveredin et al 1986; Beltrando and Camberlin
1993). There exist a strong coupling between the short rainy season in the
neighboring East African countries, and both the ENSO and the east - west
circulation over the Indian Ocean (Beltrando and Cambrlin 1993). However,
other studies have contradicted similar findings. Ogallo et al. (1988) observed
24 | PHYSICAL SCIENCE BASIS

a 'see-saw' pattern between the eastern Pacific Ocean and the Indonesia
region which coincides with positive anomalies over the coast of Eastern
Africa indicating a relationship between rainfall variability in the region and
ENSO phenomena. Nicholson and Entekhabi (1986) also identified significant
Teleconnection between the southern oscillation and seasonal rainfall over
part of East Africa. Coupling between the East African long rains and ENSO,
however did not show any significant correlations (Ogallo 1988, Hastenrath
et al. 1993; Rowell et al. 1994; Philipps and McIntyre 2000). These findings
are at odds with several other studies that noted a relationship between
Nino-3 SST and rainfall across the season (Nicholson 1996; Nicholson and
Kim 1997; Indeje et al. 2000).
On the other hand, warming in the Indian Ocean which has been linked to
anthropogenic causes (Funk et al. 2005, 2008) have had major impacts on
eastern African rainfall from March to June (Belg, Funk et al. 2008, Funk
and Williams, 2010). It was suggested that long established interannual
teleconnections between large scale climate variability and long rains
precipitation are being altered due to warming with in the south central
Indian Ocean. Reduced rainfall across eastern Africa, thus, is linked to deep
atmospheric convention over the Indian Ocean due to warming near tropical
Pacific-lndian Ocean (Funk et al, 2008; Funk and Williams 2010). Consistent
weakening and pole ward expansion due to reduced upward Convective mass
flux as diagnosed in climate change simulations imply reduced subsidence in
the tropics (Held and Soden 2006; Lu et al. 2007).
The weakening of the atmospheric overturning is driven by changes in the
atmospheric hydrologic cycle (Held and Soden 2006) and is primarily evident
as a reduction in the zonally asymmetric overturning of air (i.e., the Walker
circulation) rather than in the zonal-mean overturning, the Hadley circulation
(Vecchi and Soden 2007). A projected weakened walker circulation as a result,
resembles a more "El Nino like" climate with withered subsidence over
eastern tropical Pacific and eastern tropical Africa (Vecchi and Soden 2007).
Consecutive occurrences of several tropical depressions over the SWIO
coincide with the drought years of Ethiopia (Shanko and Camberlin 1998).
In contrast, years of low frequency tropical cyclones are associated with
PHYSICAL SCIENCE BASIS | 25

heavy rainfall in Ethiopia. Shanko and Camberlin (1998) have shown that
Belg rainfall is influenced much more by the cyclonic activity than Kiremt
rainfall, which occurs outside the cyclonic season of the SWIO. Ogallo (1988)
presented cases from further south in East Africa where rainfall is influenced
directly and indirectly by tropical storms that originate from SWIO and the
Arabian Sea.
Shanko and Camberlin (1998) quoted four well documented cases of cyclones
which have hit the East African coast in April 1872, April 1952, May 1966
and April 1974. Inter annual variability of rainfall is remarkably coherent
with in Eastern Africa implying major large scale influences (Nicholson,
1996). Camberlin (1996) further investigated the Teleconnection between
Nile floods and the Indian monsoon, and found a close relationship between
summer (July - September) sea level pressure (SLP) in India and concurrent
interannual rainfall variations over the horn of Africa. He also noted a direct
link between monsoon variations in these two regions suggesting that ENSO
plays a prominent part in the India-East Africa co-variability of rainfall.
2.6.1 The Walker Circulation
There have been various attempts to investigate the nature and cause of
the Indian Ocean warming and its impact on the regional circulation. Since
the approach is based on the impact of the Walker Circulation We will have a brief review of the importance of Walker circulation. The term Walker
Circulation was first introduced in 1969 by Professor Jacob Bjerknes, referring
to the large-scale atmospheric circulation along the longitude-height plane
over the equatorial Pacific Ocean. The Walker Circulation features low-level
winds blowing from east to west across the central Pacific, rising motion
over the warm water of the western Pacific, returning flow from west to
east in the upper troposphere, and sinking motion over the cold water of
the eastern Pacific. Since Bjerknes's introduction of the Walker Circulation,
there have been reports of similar east-west circulation cells spanning
different longitudinal sectors along the Equator. Today, the Walker Circulation
generally refers to the totality of the circulation cells as shown in Fig. 9 over
the Pacific, the Indian and the Atlantic Ocean. Ethiopia also happens to be
affected greatly by the characteristics of the strength and orientation of the
Global Walker Circulation, where the surface processes can be important
26 I PHYSICAL SCIENCE BASIS

over the neighboring Indian Ocean, which is expected to affect the strength
of the local East-west circulation cell.
INDIAN
90 E
Hightropospheric isobaric surface
Low tropospheric isobaric surface
ATLANTIC
130Longitude
90 W
Figure 9. Schematic view of the east-west atmospheric circulation along the
longitude-height plane over the Equator.
L o n g t
—C 0 0 7 —O COS 0 . 0 OS C- C l C 0 1 5m s *
Figure 10. The equatorial east-west atmospheric circulation calculated from the
PHYSICAL SCIENCE BASIS | 27

reanalysis of data from the US National Centers for Environmental Prediction and
National Center for Atmospheric Research. Shown are the climatologies of all months
(top panel), January (middle panel), and July (bottom panel) for the period 1949-
99. The streamlines where vertical motions have been multiplied by 30 times are
constructed from the divergent components of winds. Areas of strong upward and
downward motions (in meters per second) are shaded.
As is evident from Fig. 10, the Walker Circulation also includes secondary
circulation cells whose rising motions appear over the land regions of South
American and Africa, with compensating subsidence over the Atlantic and
the Indian Ocean.
The Walker circulation affects convection and precipitation patterns, the
easterly trade winds, oceanic upwelling and ocean biological productivity;
hence, changes in this circulation can have far-reaching consequences.
The Warm Pool has extended westward into the Indian Ocean, causing the
western, convective branch of the Walker Circulation to extend to the west
as well. As evaporation, convection, and precipitation have increased over
the Indian Ocean, circulation has been altered in surrounding areas including
the Horn of Africa. The physical explanation is that the Tropical Warm Pool:
where the eastern tropical Pacific Ocean meets the western tropical Indian
Ocean, in the region of the Indonesian and Malaysian Islands. The ocean's
surface is warmer here than anywhere else on earth. The fact that the ocean's
surface is very warm has two very important impacts within the Warm Pool
region. One, water evaporates from the Warm Pool's surface very rapidly,
causing the air above the Warm Pool to be very humid. Two, warm air rises,
and where warm, humid air rises, you get heavy rain. When the humid air
condenses into liquid water high above the Warm Pool, a massive amount of
energy is released into the atmosphere. This energy causes wind to flow in all
directions away from the area where the storm clouds are produced. While
the ocean's surface is very warm within the Warm Pool region, it is much
cooler to the east and west, in the central Pacific Ocean and the central/
western Indian Ocean, respectively.
The work of Williams and Funk (2011) shows a connection between warming
in the Indian Ocean and the expansion of the warm pool over the Equatorial
Pacific. The physical explanation is that the Tropical Warm Pool: where the
28 | PHYSICAL SCIENCE BASIS

eastern tropical Pacific Ocean meets the western tropical Indian Ocean, in
the region of the Indonesian and Malaysian Islands has extended westward
into the Indian Ocean, causing the western, convective branch of the Walker
Circulation to extend to the west as well. As the globe has warmed over the
last century, the Warm Pool region has warmed as well. As it has warmed,
it has expanded. On its western side, the Warm Pool has expanded by
about 4,000 km into the central Indian Ocean. This westward expansion of
the Warm Pool has caused surface waters in central Indian Ocean to warm
about one-and-a-half times faster than the global average temperature, and
about three times faster than the cooler tropical waters of the central Pacific
Ocean. Westward expansion of the Warm Pool has led to increased humidity,
upward movement of air, and storm activity over the central and western
Indian Ocean. As the region of warm water, convection, and storminess has
expanded to the west, the western sinking branch of the circulation system
has also moved to the west During the March-June rains season in Kenya and
Ethiopia, the rate at which dry air sinks over northern Africa has substantially
increased, in step with storminess over the central Indian Ocean. When this
dry air returns to the surface over northern Africa, much of it flows east,
back to the Indian Ocean, and travels through the Horn of Africa on the way.
Numerous researchers have tried to connect the more frequent occurrences
of drought during the March to May rainfall season in East Africa to this factor
(Du et al., 2009; Xie et al., 2009, Vincent et al, 2011b , Funk et al., 2008;
Williams and Funk, 2011, Lyon and DeWitt, 2012 , Jury et al., 2013). There
may be a need for more research regarding the impact of this westward
extension of the warm pool to the Indian Ocean on the Summer rainfall
season of June/July to September over the Ethiopian highlands.
The investigation of whether the Walker Circulation overthe Equatorial Pacific
has strengthened or weakened due to global warming is still a debatable topic
where the major implication for Ethiopia is its impact on the hydrological
cycle during the main northern hemisphere summer rainfall season. Major
proponents of a weakened or a slowed down Walker Circulation are using
two major hypothesis. The first hypothesis, for example Vichy et al, 2012,
attributes the Walker circulation slowdown to a decrease in convective mass
flux under global warming that balances a slower increase in global mean
precipitation than can be expected from the increase in atmospheric water
PHYSICAL SCIENCE BASIS | 29

vapor, due to Clausius-Clapeyron equation, prediction of a strong increase of
boundary layer water vapor content with temperature (about 7% per degree
of warming). It is important to note here that the Clausius Clapeyron equation
is also cited to explain cases of extremely heavy rainfall events due to the
capacity of the atmosphere to contain more moisture due to global warming.
The second hypothesis is changes in zonal SST gradient across the Equatorial
West and East Pacific Ocean. This mechanism is dominant for ENSO, but the
effort to test its role in the long-term weakening of the Walker circulation
has been hampered by uncertainty in observed SST warming. Thus a more
exhaustive research both observational trend analysis and modeling are very
important to make an assessment on the impact regarding the hydrological
cycle over our region for the northern hemisphere summer rainfall season.
Moreover various findings indicating the pole ward extension of the Hadley
Cell circulation system due to global warming also needs further research
on assessing its implication for the Hydrological Cycle over Ethiopia and the
neighborhood.
3. Observed Changes in extremes
According to the forth assessment report of the Intergovernmental Panel on
Climate Change (IPCC), not only the mean climate but also the variability of
climate and the occurrence of extreme events are changing and will likely
continue to change, due to human influences on the weather (IPCC, 2007).
The occurrence of extreme events in air temperature and precipitation
is typically evaluated based on the analysis of a set of indicators defining
variation and extreme conditions. For example, the Climate Variability and
Predictability (CLIVAR) Expert Team on Climate Change Detection and Indices
(ETCCDI), has developed a set of indices on moderate extremes (Peterson et
al., 2001) that represents a common guideline for regional analysis of climate.
30 I PHYSICAL SCIENCE BASIS
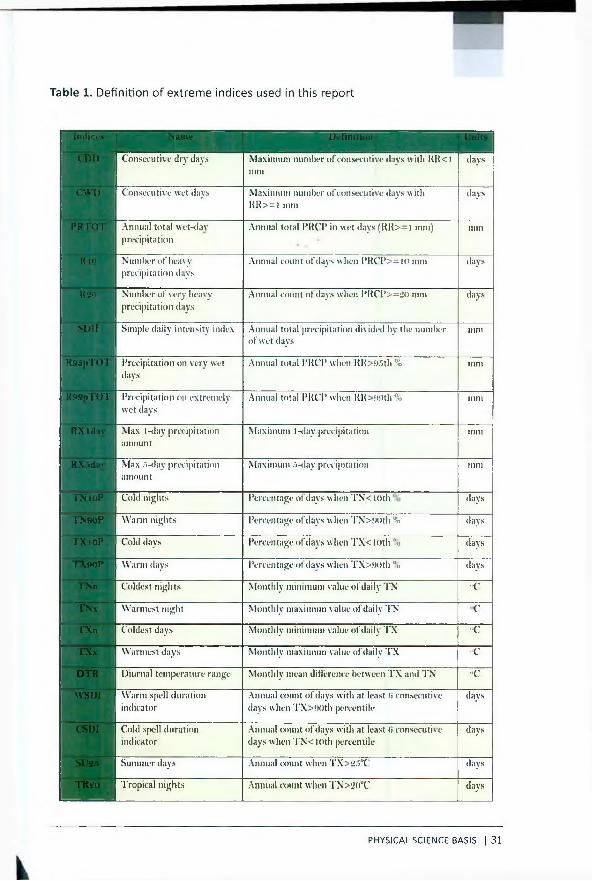
Table 1. Definition of extreme indices used in this report
Indices Nnuuie Definition Units
CDD Consecutiv e dry days Maximum number of consecutive days with R R < ! mm
days
CW D Consecutive wet days Maximum number o f consecutive days with R R > = l mm
days
PRTOT Annual total wet-dav precipitation
Annual total PRCP in wet days (R R > = 1 mm) mm
R io Number o f heavy precipitation days
Annual count of days when PR C P>= 10 mm days
Hilo Number o f very heavy precipitation days
Annual count of days when PR C P>=20 mm days
SDH Simple daily intensity index Annual total precipitation divided by the number of wet days
mm
RflSpTOT Precipitation on very wet days
Annual total PRCP when R R >95th % mm
R&9pTOT Precipitation on extremely wet days
Annual total PRCP when RR>.‘Wth % mm
RXlday M ax 1-day precipitation amount
Maximum 1 -day precipitation mm
RX.'idaj Max 5-day precipitation amount
Maximum -5-clay precipitation 111111
TNlOP Cold nights Percentage of days when T N cio th days
TNiioP Warm nights Percentage of days when T N >90th % days
TXlO P Cold days Percentage of days when T X < loth u» days
T X so P Warm days Percentage of days when T X > 9 0 th °<> days
TN'n Coldest nights Monthly minimum value of daily TN °C
TN x Warmest night Monthly maximum value of daily TN •c
T X n Coldest days Monthly minimum value of daily T X -C
T X x Warmest days Monthly maximum value o f daily T X c
D3H Diurnal temperature range Monthly mean difference between T X and TN -C
WSDI W arm Spell duration indicator
Annual count of days with at least 6 consecutive days when T X > 9 0 th percentile
days
CSDI Cold spell duration indicator
Annual count of days with at least 6 consecutive days when T N cioth percentile
days
SUi!3 Summer days Annual count when T X > 2 5 °C days
T R *o Tropical nights Annual count when TN>20°C days
PHYSICAL SCIENCE BASIS | 31
Takele et al (2012) have generated and analyzed the temporal trends of the
indices shown in Table 1 for selected meteorological stations in Ethiopia
based on 30 years period (1981-2010) rainfall, minimum and maximum
temperature data. Mengistu Tsidu et al. (2015) have also determined the
changes in the precipitation and temperature extremes over East Africa
from analysis of Climate Hazards Group Infrared Precipitation with Stations
(CHIRPS) rainfall and ERA-lnterim maximum and minimum temperature at
a horizontal resolution of 0.25°. The findings in this report on the climate
extremes are mainly compiled from the two studies.
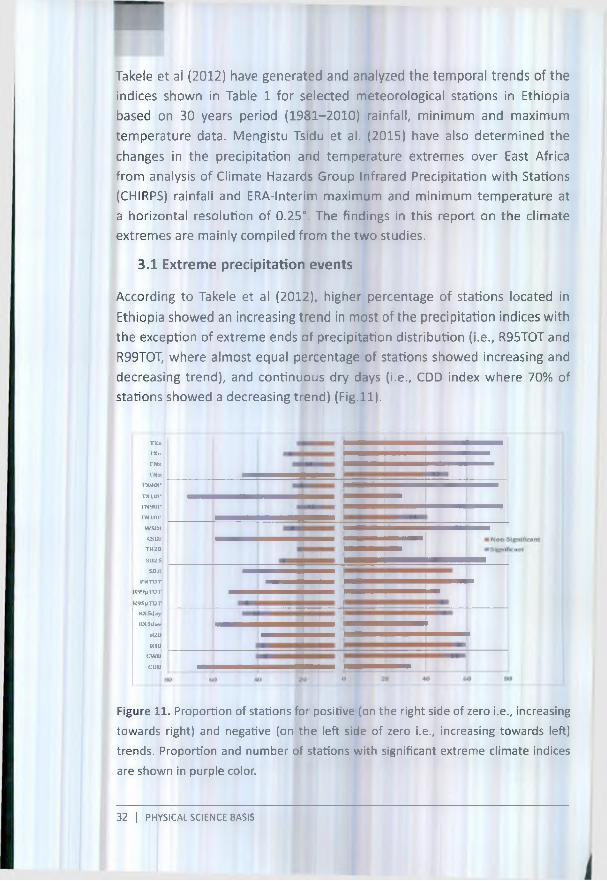
3.1 Extreme precipitation events
According to Takele et al (2012), higher percentage of stations located in
Ethiopia showed an increasing trend in most of the precipitation indices with
the exception of extreme ends of precipitation distribution (i.e., R95TOT and
R99TOT, where almost equal percentage of stations showed increasing and
decreasing trend), and continuous dry days (i.e., CDD index where 70% of
stations showed a decreasing trend) (Fig.11).
TXx
TXii
TNx
rwn rxvoi*T X 1 Ql*
TN90P
rN lor W SD l
CSUI
TR20
S U 2 5
SOU
I'H T O T
K W p T U T
K9SpTOr KXSday
K X ltluy
K2Q
KIO CWU
cuu
Figure 11. Proportion of stations for positive (on the right side of zero i.e., increasing
towards right) and negative (on the left side of zero i.e., increasing towards left)
trends. Proportion and number of stations with significant extreme climate indices
are shown in purple color.
32 I PHYSICAL SCIENCE BASIS
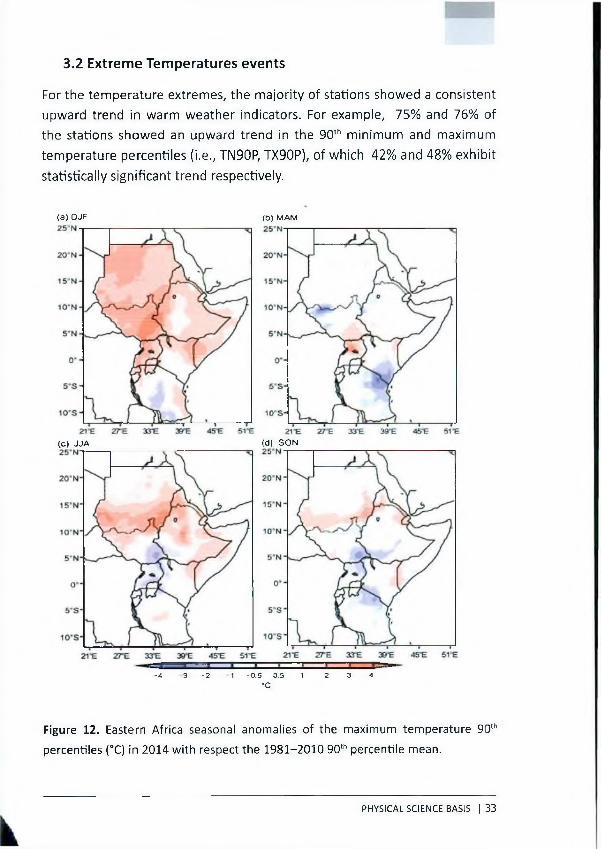
3.2 Extreme Temperatures events
For the temperature extremes, the majority of stations showed a consistent
upward trend in warm weather indicators. For example, 75% and 76% of
the stations showed an upward trend in the 90th minimum and maximum
temperature percentiles (i.e., TN90P, TX90P), of which 42% and 48% exhibit
statistically significant trend respectively.
(a) DJF (b) MAM
(c) JJA (d) SON
- 4 3 - 2 1 - 0 .5 0 .5 1 2 3 4"C
Figure 12. Eastern Africa seasonal anomalies of the maximum temperature 90th
percentiles (°C) in 2014 with respect the 1981-2010 90th percentile mean.
PHYSICAL SCIENCE BASIS | 33

Since the changes in climate extremes differ from one season to the other, it
is important to investigate climate extremes of each season separately. For
example in a recent report for state of climate in 2014 over Eastern Africa,
significant differences between seasons were observed (Mengistu Tsidu
et al. , 2015). The authors found that during December to February (DJF),
there were warm anomalies in the extreme ends of maximum temperature
exceeding 90t,; percentiles over most of the country except over south-
central Ethiopia, which were normal in 2014 with respect to the 1981-2010
base period (Fig. 12a). The June-August (JJA) season 90th percentile maximum
temperatures were also above average over most parts of Ethiopia in 2014
(Fig. 12c). Observations during SON were similar to JJA, specifically over
northern Ethiopia (Fig. 12d) (Mengistu Tsidu et a l. , 2015).
Figure 13 The 90lh percentiles minimum temperature trend (°C/year) during the
1981-2014 period.
25N
20N
I15N ION
5N EO
5S 1GS
25N
2CN
15NION
5N
EQ5S
10S
( o ) DJF
2IE 24E 27E 30E J6 E 39E 42E 45E *BE 51E
34 I PHYSICAL SCIENCE BASIS
In case of cold weather indicators, majority of stations showed a decreasing
trend in the 10th minimum and maximum percentiles with 30% and 48%
of stations showing significant trend. Furthermore, consistent pattern of
changes were detected for the majority of temperature extreme indices (Fig.
11). Moreover, the 90th percentile minimum temperature trend also shows
increasing trend over western, northern and eastern Ethiopia in spring,
summer and autumn seasons whereas central Ethiopia and southwestern
Ethiopia exhibit normal to decreasing trend. However, during winter (DJF),
the 90th percentile minimum temperature does not show any trend during
the last 3 decades (Fig. 13).
The observed increasing changes in warm extremes are consistent with the
already happening global warming. The heterogeneous behavior identified
in most precipitation extreme indicators might be attributed to the high
variations in local geographical features.
4. Changes in hydrological cycle
Both the AR4 and AR5 concluded that precipitation has generally increased
over land north of 30°N over the period 1900-2005, which is noted as
statistically significant. However it has also been indicated that longer
term trends in large scale precipitation pattern for the years 1901-2008
in the tropics has been reported as non significant. Further more, the fifth
assessment report suggests that precipitation over tropical land areas (30°S
to 30°N) has increased over the last decade (2000-2010), reversing the drying
trend that occurred from the mid-1970s to mid-1990s. The mechanism for a
change in the hydrological cycle over Ethiopia and the neighborhood due to
global warming stems from two major aspects and these are the impact of the
global warming over the sea surface temperature of the neighborhood oceans
and thus the resulting impact on the distribution of the pressure systems
and the circulation patterns and the other impact is on the characteristics
profile of surface and troposphere humidity. The characteristics of the profile
of surface and troposphere humidity are largely determined apart from the
level of the presence of moisture on the land surface temperature (for near
surface humidity) and tropospheric temperature (for tropospheric humidity).
The most important factor usually cited here is the Clausius Clapeyron
equation, where an increase of 1 degree Celsius is responsible for an increase
PHYSICAL SCIENCE BASIS | 35
in the moisture holding capacity of the atmosphere by 7%. This condition
is usually associated with enhancing the occurrences of extreme weather
events.
4.1 Surface humidity
There have been reports of widespread increases in surface air moisture
content since 1976, along with near-constant relative humidity over large
scales though with some significant changes specific to region, time of day or
season. In good agreement with previous analysis from Dai (2006), Willett et
al (2008) show widespread increasing specific humidity across the globe from
the homogenized gridded monthly mean anomaly product Had-CRUH (1973-
2003). Since 2000 surface specific humidity over land has remained largely
unchanged, whereas land areas have on average warmed slightly implying a
reduction in land region relative humidity. This may be linked to the greater
warming of the land surface relative to the ocean surface (Joshi et al., 2008).
The marine specific humidity (Berry and Kent, 2009), like that over land,
shows widespread increases that correlate strongly with SST. In summary,
it is very likely that global near surface air specific humidity has increased
since the 1970s. However, during recent years the near surface moistening
over land has abated (medium confidence). As a result, fairly widespread
decreases in relative humidity near the surface are observed over the land
in recent years.
4.2 Troposphere humidity
Observations from radiosonde and GPS measurements over land and satellite
measurements over ocean indicate increases in tropospheric water vapour at
near-global spatial scales which are consistent with the observed increase in
atmospheric temperature over the last several decades. In each analysis, the
rate of increase in the free troposphere is concluded to be largely consistent
with that expected from the Clausius- Clapeyron relation (about 7% per
degree Celsius). Jin et al. (2007) found an average column integrated water
vapor trend of about 2 kg.nrr2 per decade during 1994-2006 for 150 (primarily
land-based) stations over the globe, with positive trends at most NH stations
and negative trends in the SH. There is a need to make an assessment of
near surface relative humidity and specific humidity trend over Ethiopia to
understand more the impact on the hydrological cycle over the country.
36 I PHYSICAL SCIENCE BASIS
4.3 Evapotranspiration including Pan Evaporation
On a global scale, evapotranspiration over land increased from the early
1980s up to the late 1990s (Wild et al., 2008; Jung et al., 2010; Wang et al.,
2010) and Wang et al. (2010) found that global evapotranspiration increased
at a rate of 0.6 W.rrr2 per decade for the period 1982-2002. After 1998, a lack
of moisture availability in SH land areas, particularly decreasing soil moisture,
has acted as a constraint to further increase of global evapotranspiration
(Jung et al., 2010). In semiarid and arid regions, trends in evapotranspiration
largely follow trends in precipitation (Jung et al., 2010).
Over the last 50 or so years, pan evaporation has been carefully monitored. For
decades, nobody took much notice of the pan evaporation measurements1.
But in the 1990s in Europe, Israel, and North America, scientists spotted
something that at the time was considered very strange: the rate of
evaporation was falling although they had expected it to increase due to
global warming. The same trend has been observed in China over a similar
period. A decrease in solar irradiance is cited as the driving force. However,
unlike in other areas of the world, in China the decrease in solar irradiance
was not always accompanied by an increase in cloud cover and precipitation.
It is believed that aerosols may play a critical role in the decrease of solar
irradiance in China. Thus, it is important to note that decreasing trends in
Pan Evaporation was detected over some areas of the world, where aerosol
emission has shown a large increase over countries especially over the
South Asia region. Other factors that can be responsible for a decrease of
pan evaporation include decreased surface solar radiation due to aerosols,
decrease in sunshine duration due to increased specific humidity and
increase in cloud cover. It is important to note here that pan evaporation
depends on some additional factors besides net radiation from the sun. The
other two major factors are vapor pressure deficit and wind speed, where
the ambient temperature could tern out to be a negligible factor. Though
research literature is very few over Ethiopia, it is expected that there has
been a general increase in the pan evaporation due to the warming of the
atmosphere. However, it is important to note seasonal peculiarities where
increase in cloud cover and volcanic ash may induce a decrease in pan
evaporation.
PHYSICAL SCIENCE BASIS | 37
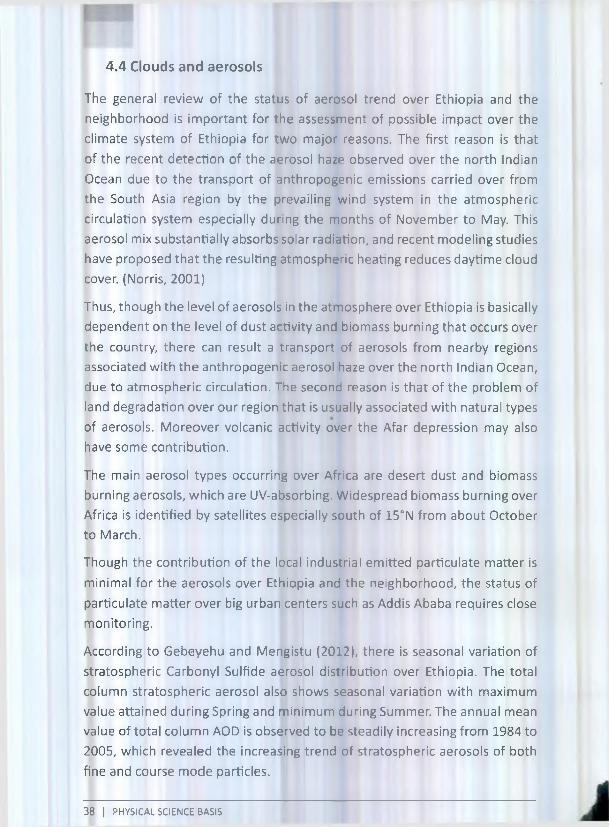
4.4 Clouds and aerosols
The general review of the status of aerosol trend over Ethiopia and the
neighborhood is important for the assessment of possible impact over the
climate system of Ethiopia for two major reasons. The first reason is that
of the recent detection of the aerosol haze observed over the north Indian
Ocean due to the transport of anthropogenic emissions carried over from
the South Asia region by the prevailing wind system in the atmospheric
circulation system especially during the months of November to May. This
aerosol mix substantially absorbs solar radiation, and recent modeling studies
have proposed that the resulting atmospheric heating reduces daytime cloud
cover. (Norris, 2001)
Thus, though the level of aerosols in the atmosphere over Ethiopia is basically
dependent on the level of dust activity and biomass burning that occurs over
the country, there can result a transport of aerosols from nearby regions
associated with the anthropogenic aerosol haze over the north Indian Ocean,
due to atmospheric circulation. The second reason is that of the problem of
land degradation over our region that is usually associated with natural types
of aerosols. Moreover volcanic activity over the Afar depression may also
have some contribution.
The main aerosol types occurring over Africa are desert dust and biomass
burning aerosols, which are UV-absorbing. Widespread biomass burning over
Africa is identified by satellites especially south of 15°N from about October
to March.
Though the contribution of the local industrial emitted particulate matter is
minimal for the aerosols over Ethiopia and the neighborhood, the status of
particulate matter over big urban centers such as Addis Ababa requires close
monitoring.
According to Gebeyehu and Mengistu (2012), there is seasonal variation of
stratospheric Carbonyl Sulfide aerosol distribution over Ethiopia. The total
column stratospheric aerosol also shows seasonal variation with maximum
value attained during Spring and minimum during Summer. The annual mean
value of total column AOD is observed to be steadily increasing from 1984 to
2005, which revealed the increasing trend of stratospheric aerosols of both
fine and course mode particles.
38 | PHYSICAL SCIENCE BASIS

Aerosols levels over Ethiopia due to dust activity is greatly characterized
by seasonality. During maximum dust activity in May-July, high AAI values
extend from the western flanks of the Ethiopian highlands west to the
plateaus of western Sudan roughly between 15° and 22°N. Dust activity over
the Ethiopian Rify Valley peaks in June and July. Dust distributions are sharply
defined by the mountains to the west and to the south in Ethiopia and to
the east, across the Red Sea and the Gulf of Aden, the mountains in Yemen.
Total Ozone Monitoring Satellite (TOMS) shows a maximum at 14°N, 42°E,
slightly to the east of the Danakil Depression and Kobar Sink in the Rift Valley
of northern Ethiopia. Almost all major sources are located in arid regions
and are centered over topographical lows or on lands adjacent to strong
topographical highs.
AOD is a measure of the integrated columnar aerosols load and is an important
parameter for evaluating aerosol-radiation interactions. A multi-regional
analysis for 1973- 2007 (Wang and Liang, 2009) shows positive AOD trends
over Africa. Seasonal average AOD trends at 0.55 pm for 1998-2010 using
SeaWiFS data (Hsu et al., 2012) indicates that there is a strong positive AOD
trend over our region in the Arabian Peninsula and also including northeastern
and northwestern lowlands of Ethiopia (Fig. 14) occurring mainly during
spring (MAM) and summer (JJA), during times of dust transport, and is also
visible in MODIS data.
-0.04 -0.03 -0.02 -0.01 0 0.01 0.02 0.03 0.04
Aerosol Optical Depth Trend (per year)
Figure 14. Seasonal average AOD trends at 0.55 |im for 1998-2010 using SeaWiFS
data (Hsu et al., 2012) for MAM (left) and JJA (right). White areas indicate incomplete
or missing data. Black dots indicate significant trends
PHYSICAL SCIENCE BASIS | 39
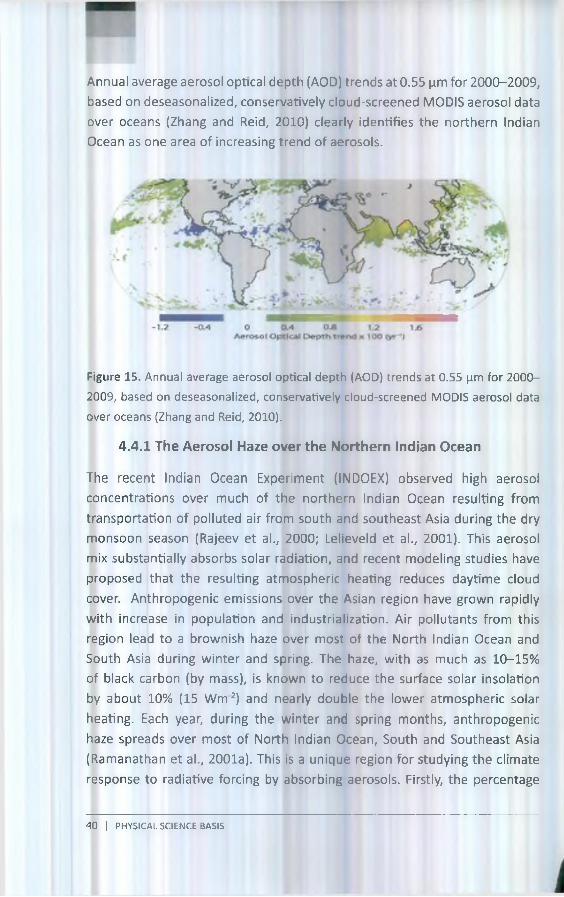
Annual average aerosol optical depth (AOD) trends at 0.55 urn for 2000-2009,
based on deseasonalized, conservatively cloud-screened MODIS aerosol data
over oceans (Zhang and Reid, 2010) clearly identifies the northern Indian
Ocean as one area of increasing trend of aerosols.
Figure 15. Annual average aerosol optical depth (AOD) trends at 0.55 pm for 2000-
2009, based on deseasonalized, conservatively cloud-screened MODIS aerosol data
over oceans (Zhang and Reid, 2010).
4.4.1 The Aerosol Haze over the Northern Indian Ocean
The recent Indian Ocean Experiment (INDOEX) observed high aerosol
concentrations over much of the northern Indian Ocean resulting from
transportation of polluted air from south and southeast Asia during the dry
monsoon season (Rajeev et al., 2000; Lelieveld et al., 2001). This aerosol
mix substantially absorbs solar radiation, and recent modeling studies have
proposed that the resulting atmospheric heating reduces daytime cloud
cover. Anthropogenic emissions over the Asian region have grown rapidly
with increase in population and industrialization. Air pollutants from this
region lead to a brownish haze over most of the North Indian Ocean and
South Asia during winter and spring. The haze, with as much as 10-15%
of black carbon (by mass), is known to reduce the surface solar insolation
by about 10% (15 Wm 2) and nearly double the lower atmospheric solar
heating. Each year, during the winter and spring months, anthropogenic
haze spreads over most of North Indian Ocean, South and Southeast Asia
(Ramanathan et al., 2001a). This is a unique region for studying the climate
response to radiative forcing by absorbing aerosols. Firstly, the percentage
40 | PHYSICAL SCIENCE BASIS

contribution to global anthropogenic emissions from the South and East
Asian countries has increased considerably over the last few decades (Smith
Steven et al., 2001). Every dry season from November to May, anthropogenic
haze spreads over most of the northern Indian Ocean and Southeast Asia.
INDOEX documented this Indo-Asian haze at various scales during 1995-2001.
The observed high aerosol concentrations over much of the northern Indian
Ocean have been shown to be the result of transportation of polluted air
from south and Southeast Asia during the dry monsoon season (Rajeev et
al., 2000; Lelieveld et al., 2001). It is estimated that anthropogenic sources
contributed as much as 75% (+10%). This haze, about the size of USA, extends
from the south Asian continent to the Arabian Sea, and from the Bay of Bengal
to the Indian Ocean ITCZ. The reason why this anthropogenic haze appears
over the north Indian Ocean during Months of November to May is due to
the direction of the prevailing wind system from the Indian Sub continent
towards the Arabian Sea and the associated subsidence during this season.
There is also a need to address whether the transport of these anthropogenic
air pollutants can reach Ethiopia during these months. It is important to note
that this anthropogenic aerosol haze over the northern Indian Ocean could
have an important impact on the climate system of Ethiopia by modifying the
sea surface temperature pattern over this region. The haze layer can reduce
the net solar flux at the surface by as much as 20 to 40 Wnrf2 on a monthly
mean basis and can heat the lowest 3 km atmosphere by as much as 0.4
to 0.8 K/day, which would enhance the solar heating. Moreover, Soot was
a sizable fraction of the aerosol mix and caused substantial absorption of
solar radiation. Satheesh and Ramanathan (2000) infer from satellite and
surface measurements that aerosol heating in the lower atmosphere over
the northern Indian Ocean at local noon is 1-3 K/day, an increase of 50-100%
over aerosol-free solar heating.
PHYSICAL SCIENCE BASIS | 41
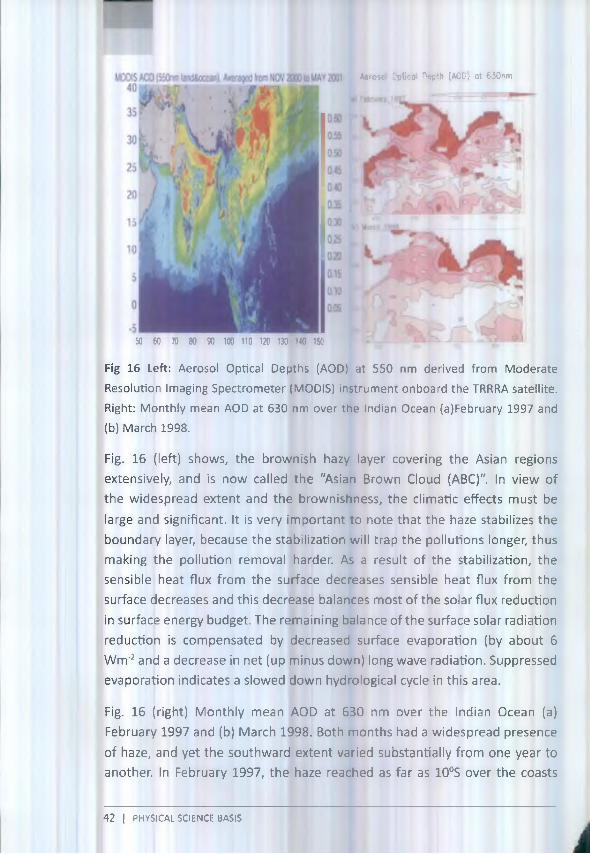
50 60 70 80 90 100 110 120 130 140 15G
Fig 16 Left: Aerosol Optical Depths (AOD) at 550 nm derived from Moderate
Resolution Imaging Spectrometer (MODIS) instrument onboard the TRRRA satellite.
Right: Monthly mean AOD at 630 nm over the Indian Ocean (a)February 1997 and
(b) March 1998.
Fig. 16 (left) shows, the brownish hazy layer covering the Asian regions
extensively, and is now called the "Asian Brown Cloud (ABC)". In view of
the widespread extent and the brownishness, the climatic effects must be
large and significant. It is very important to note that the haze stabilizes the
boundary layer, because the stabilization will trap the pollutions longer, thus
making the pollution removal harder. As a result of the stabilization, the
sensible heat flux from the surface decreases sensible heat flux from the
surface decreases and this decrease balances most of the solar flux reduction
in surface energy budget. The remaining balance of the surface solar radiation
reduction is compensated by decreased surface evaporation (by about 6
Wm'2 and a decrease in net (up minus down) long wave radiation. Suppressed
evaporation indicates a slowed down hydrological cycle in this area.
Fig. 16 (right) Monthly mean AOD at 630 nm over the Indian Ocean (a)
February 1997 and (b) March 1998. Both months had a widespread presence
of haze, and yet the southward extent varied substantially from one year to
another. In February 1997, the haze reached as far as 10°S over the coasts
A*rosot Optical D«pth (AOD) at 630nm
42 | PHYSICAL SCIENCE BASIS

of the horn of Africa but in M arch 1998 it stayed north of the equator. The
aerosol clim ate forcing over this area is one order of m agnitude greater than
the green house gas forcing. Furtherm ore, the haze is regionally concentrated
d im in ish ing tow ards the ITCZ. M odeling studies have indicated the im pact of
the aerosol haze over the sea surface tem perature pattern over the Indian
Ocean as can be exhibited in Fig. 17.
Impact of aerosol on modelled (CMIP5) trend in Sea Surface Temperature 1986-2005 HadGEM2-ES
Models show aerosol
impact on SST in regions
known to influence
East Africa rainfall
variability
Impact is highly model
dependent
Figure 17. Modeled impacts of the aerosol haze over the North Indian Ocean on the
sea surface temperature pattern.
One major impact of the aerosol haze over the Indian Ocean then would be
the modification of the meridional SST gradient over the Indian Ocean, which
can have negative impact on the circulation pattern over the region. The sea
surface temperature pattern over the northern Indian Ocean has both a direct
and an indirect link with the weather systems over Ethiopia. The aerosol haze
phenomena over the north Indian Ocean has also been identified as one
major reason for the so called the East Africa Climate paradox of contrast
between the observed drying of the March to May rainfall season over East
Africa during the recent decades and the CMIP5 wetting projection of the
March to May seasonal rainfall over East Africa. Thus, there is a need to
address this impact on the climate system of Ethiopia.
PHYSICAL SCIENCE BASIS | 43
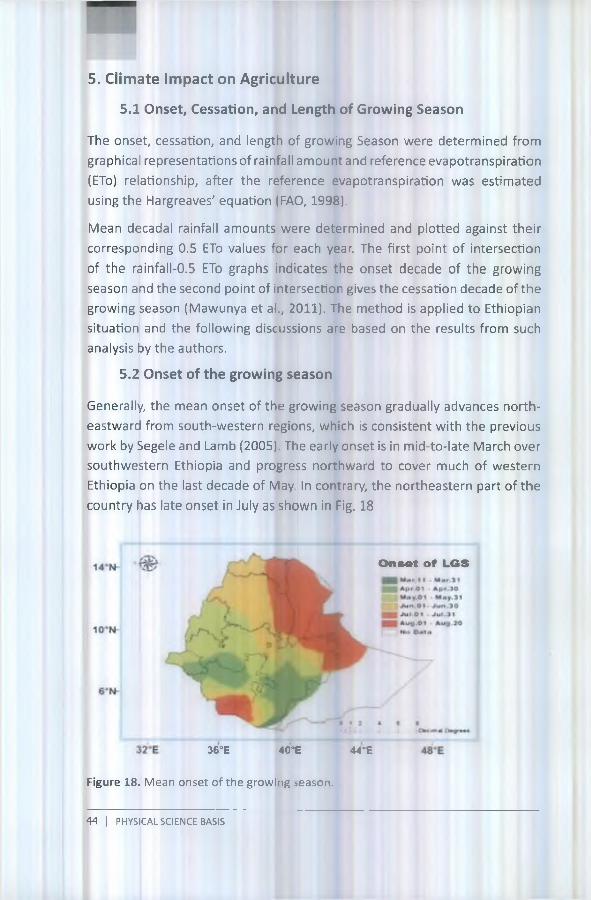
5. Climate Impact on Agriculture
5.1 Onset, Cessation, and Length of Growing Season
The onset, cessation, and length of growing Season were determined from
graphical representations of rainfall amount and reference evapotranspiration
(ETo) relationship, after the reference evapotranspiration was estimated
using the Hargreaves' equation (FAO, 1998).
Mean decadal rainfall amounts were determined and plotted against their
corresponding 0.5 ETo values for each year. The first point of intersection
of the rainfall-0.5 ETo graphs indicates the onset decade of the growing
season and the second point of intersection gives the cessation decade of the
growing season (Mawunya et al., 2011). The method is applied to Ethiopian
situation and the following discussions are based on the results from such
analysis by the authors.
5.2 Onset of the growing season
Generally, the mean onset of the growing season gradually advances north
eastward from south-western regions, which is consistent with the previous
work by Segele and Lamb (2005). The early onset is in mid-to-late March over
southwestern Ethiopia and progress northward to cover much of western
Ethiopia on the last decade of May. In contrary, the northeastern part of the
country has late onset in July as shown in Fig. 18
O n s« t o f L G S
36°E 40°E 44°E
Figure 18. Mean onset of the growing season.
44 I PHYSICAL SCIENCE BASIS

Fig. 19 shows the annual variability of the mean onset of the growing season.
It is highly variable, with standard deviation across the country ranging from
9 to 47 days. South-western regions have the highest onset variability with
standard deviation of 34 to 48 days, whereas north-eastern regions have the
lowest onset variability with standard deviations from 9 to 15 days.
10 N-
6 N
I3 2 E
Figure 19. The standard deviation of the mean onset of the growing season.
5.3 Cessation of the growing season
The mean cessation of the growing season advances south-westward from
northeastern part of Ethiopia (Fig. 20). North-eastern Ethiopia has the earliest
cessation on the first decade of September, followed by central and northern
Ethiopia, which have cessation in October. South-western regions have late
cessation in early-to-mid December.
36 E
Standard Deviation (D ays)
22.01 28.01 34 01 40.01
No D.1M
4 0 E
0 12 4 6 IH H F~ ----:D*«m4
i i 4 4 E 4 8 E
PHYSICAL SCIENCE BASIS | 45

n i l .'- I 7 O m m « P »r »««
32 E 36‘E 40 E 44 E 48 E
Figure 20. The mean cessation of the growing season.
The mean cessation of the growing season is less variable temporally than the
mean onset, with standard deviation of 10 to 32 days (Fig. 21). The highest
variability of the mean cessation occurs over southern, south-eastern Ethiopia
which have standard deviation of 26 to 32 days, while the lowest variability is
over north-eastern and north-western regions, where the standard deviation
ranges from 10 to 18 days.
32 E 36 E 40 E 44 E 48 E
Figure 21. The standard deviation of the mean cessation of the growing season.
46 | PHYSICAL SCIENCE BASIS

In general, the mean length of the growing season decrease as we move
northeastward from south-western regions of Ethiopia (Fig. 22), following
the spatial pattern of the mean onset (Fig. 18). It has high special variability
with values ranging from 40 to 260 days. Southern and south-western parts
of Ethiopia have the longest mean growing season from 180 to 260 days,
followed by central and north-western regions (121 to 180 days). North
eastern Ethiopia has the shortest mean growing season (from 40 to 60 days).
5.4 Length of the growing season
32 E
Figure 22. The mean length of the growing season.
The annual variability of the mean length of the growing season is shown in
Fig. 23.. Its standard deviation ranges from 8 to 55 days. North-eastern and
small portion of western Ethiopia have the lowest variability with standard
deviation of 8 to 24 days, whereas southern and south-western regions have
the highest variability (standard deviations of 32 to 55 days).
LGS (Days)40 • 60 SI 90 91 - f 20 121 110
1*1 220
■I 221 - 2*0No G a la
I I
44 E 48 E
PHYSICAL SCIENCE BASIS | 47

101*
6 N
14-N- % '
3 2 E
Figure 23. The standard deviation of the mean length o' the growing season.
6. CLIMATE MODELS AND THEIR CHARACTERISTICS
6.1 Introduction
Our understanding of how climate will change over the next century is largely
based on the projections of the global coupled climate models used in the
fifth IPCC assessment report on climate change (IPCC, 2013). In order to
have confidence in the projections of climate models it is essential that they
can simulate the present day climate. On global scales, climate models have
already shown they can make credible simulations of the temperature record
of the 20th century (IPCC, 2007) and of the response of global temperatures
to major climatic events, such as the Mount Pinatubo eruption and the El
Nino phenomenon in the Tropical Pacific. However, one of the key challenges
for climate models and climate science is that they should be capable of
not only making predictions at the global scale, but that their predictions
should also be relevant at the local scale. Central to this is understanding
and predicting how climate will change at regional and country scales (e.g.,
rainfall, temperature).
Standard Deviation (Days)19 15
13.01 - 222 2 .0 1 - 2 •
28.01 • 3434.01 - 40
I 40.01 • 47N o D a t a
36°E 4 0 E
H H t r -
44aE
48 | PHYSICAL SCIENCE BASIS
6.2 Characteristics of Climate Models
Climate models use quantitative methods to simulate the interactions of
the atmosphere, hydrosphere, lithosphere, cryosphere and and biosphere.
They are used for a variety of purposes from study of the dynamics of the
weather and climate system to projections of future climate. Climate models
are systems of differential equations based on the basic laws of physics,
fluid motion, and chemistry. To apply a climate model, scientists divide the
planet into a 3-dimensional grid, apply the basic equations, and evaluate the
results. Atmospheric models calculate winds, heat transfer, radiation, relative
humidity, and surface hydrology within each grid and evaluate interactions
with neighboring points. Due to the large number of calculations involved,
climate models currently use bigger grid spacing and longer time steps so
that they can be run further ahead in time for a given amount of computer
time.
Without more powerful computers, simulation of the climate with the same
detail as in weather forecasts would take far too long, especially if we want
to explore many different scenarios of the future. Nevertheless, there is
increasing convergence between weather forecasting and climate models,
especially for predictions in the range out to months and seasons.
There have been major advances in the development and use of models
over the last 20 years and the current models give us a reliable guide to the
direction of future climate change. Computer models cannot predict the
future exactly, due to the large number of uncertainties involved. The models
are based mainly on the laws of physics, but also empirical techniques which
use, for example, studies of detailed processes involved in cloud formation.
The most sophisticated computer models simulate the entire climate system.
By linking the atmosphere and ocean, they also capture the interactions
between the various elements, such as ice and land.
PHYSICAL SCIENCE BASIS | 49

Figure 24. Improvement of climate model resolution over the four IPCC reports.
Climate models have been used successfully to reproduce the main features
of the current climate; the temperature changes over the last hundred years,
and the main features of the Holocene (6,000 years ago) and last glacial
maximum (21,000) years ago. Current models enable us to attribute the
causes of past climate change, and predict the main features of the future
climate, with a high degree of confidence.
The most talked-about models of recent years have been those relating
temperature to emissions of carbon dioxide (and other greenhouse gases).
These models project an upward trend in the surface temperature record, as
well as a more rapid increase in temperature at higher altitudes.
6.3 Global climate models (GCMs)
Weather forecasting models must handle the properties of the atmosphere
in three dimensions, and work with current analyses of the ocean surface
temperatures and at least some basic land surface processes. These models
have come to be known as atmospheric general circulation models (GCMs).
In parallel, studies of the oceans can concentrate on three-dimensional
properties of the oceans and are generally known as ocean GCMs.
Assessments of vulnerability are informed by estimates of the impacts of
50 | PHYSICAL SCIENCE BASIS

climate change, which in turn are often based on scenarios of future climate.
These scenarios are generally derived from projections of climate change
undertaken by Global Climate Models (GCMs).
These GCM projections may be adequate up to a few hundred kilometres
or so, however they do not capture the local detail often needed for impact
assessments at a regional level. One widely applicable method for adding
this detail to global projections is to use a regional climate model (RCM).
Other techniques include the use of higher resolution atmospheric GCMs
and statistical techniques linking climate information at GCM resolution with
that at higher resolution or at point locations.
6.3.1 Coupled model systems
When it comes to simulating the general behavior of the climate system over
lengthy periods, however, it is essential to use models that represent, and
where necessary conserve, the important properties of the atmosphere,
land surface and the oceans in three dimensions. At the interfaces, the
atmosphere is coupled to the land and oceans through exchanges of heat,
moisture and momentum. These models of the climate system are usually
known as coupled GCMs.
Coupling the ocean processes to atmospheric GCMs is a major challenge.
The thermal capacity of the oceans is massive compared to the atmosphere
and can provide to, or extract from, the atmosphere, massive amounts of
latent and thermal heat. Representing their heat storage, and the absorption
of greenhouse gases by the oceans, in long-term simulations of climate
requires a full three-dimensional ocean model, which simulates even the
deep currents. Changes in the intensity and location of deep-water currents
can ultimately have profound effects on the atmosphere. In the past, changes
in the circulation of the oceans have produced major atmospheric responses.
The models must also be able to handle shorter-term fluctuations such as those
associated with ENSO. Recent developments in climate modeling, which take
into account not only surface processes at the ocean-atmosphere interface
but also those acting at depth, have produced considerable improvement to
the quality of climate model results. An oceanic GCM typically requires very
high spatial resolution to capture eddy processes associated with the major
PHYSICAL SCIENCE BASIS | 51

currents, bottom topography and basin geometry. High-resolution ocean
models are therefore at least as costly in computer time as are atmospheric
GCMs. Further coupling of other climate system component models,
especially the cryosphere and the biosphere, are also necessary to obtain
more realistic simulations of climate on decadal and longer timescales.
6.3.2 Parameterization
There are certain physical processes that act at a scale much smaller than the
characteristic grid interval (e.g., clouds and turbulence). And if the complete
physics of these processes, for example, clouds, were to be computed
explicitly at each time step and at every grid-point, the huge amount of data
produced would swamp the computer. These processes cannot be eliminated,
so simplifying equations are developed to represent the gross effect of the
many small-scale processes within a grid cell as accurately as possible. This
approach is called parameterization. There is a lot of research going on to
devise better and more efficient ways for incorporating these small scale
processes into climate models.
6.3.3 Regional Climate Models (RCMs)
Simulating climate change at the regional and national levels is essential for
policymaking. Only by assessing what the real impact will be on different
countries will it be possible to justify difficult social and economic policies
to avert a dangerous deterioration in the global climate. Furthermore,
understanding processes on the regional scale is a crucial part of global
research. Processes acting on local or regional scales, such as mountain range
blocking air flow or dust clouds interacting with radiation will ultimately have
impacts at the global level.
52 I PHYSICAL SCIENCE BASIS

Figure 25. Regional climate model nesting approach.
One technique used to overcome the coarse spatial resolution of coupled
GCMs is that of nested modeling, depicted in the image above. This involves
the linking of models of different scales within a global model to provide
increasingly detailed analysis of local conditions while using the general
analysis of the global output asa drivingforce forthe higher resolution model.
Results for a particular region from a coupled GCM are used as initial and
boundary conditions for the RCM, which operates at much higher resolution
and often, with more detailed topography and physical parameterizations.
This enables the RCM to be used to enhance the detailed regional model
climatology and this downscaling can be extended to even finer detail in local
models. This procedure is particularly attractive for mountain regions and
coastal zones, as their complexity is unresolved by the coarse structure of a
coupled GCM grid.
The provision of a flexible Regional Climate Model (RCM) is thus part of an
integrated package of methods, which would also include a range of GCM
projections for assisting countries to generate climate change scenarios and
hence to inform adaptation decisions. It must be stressed that the RCM does
not replace GCMs, but it is a powerful tool to be used together with the GCMs
in order to add fine-scale detail to their broad-scale projections.
PHYSICAL SCIENCE BASIS | 53

6.4 Downscaling techniques and Simulation of Regional-Scale Climate
The climate change information required for many impact studies is of a
spatial scale much finer than that provided by global or regional climate
models. The ensuring problem of impact assessment have been recognized
for a long time (Kim et al., 1984; Gates, 1985; Robinson and Finkelstein, 1989;
Lamb, 1987; Smith and Tirpak, 1989; Cohen, 1990).
Global climate models (GCMs) have resolution of hundreds of kilometers
whilst regional climate models (RCMs) may be as fine as tens of kilometers.
However, many impact application require the equivalent of point climate
observations and highly sensitive to fine-scale climate variations that
parameterized in coarse-scale models. This especially true for regions of
complex topography, coastal or island locations, and in regions of highly
heterogeneous land-cover.
The most straightforward means of obtaining higher spatial resolution
scenarios is to apply coarse-scale climate change projections to a high
resolution observed climate baseline-the change factor methods. This method
is often used when RCM output are unavailable, for sensitivity studies, or
whenever rapid assessments of multiple climate change scenarios (and/or
GCM experiments) are required. Fine resolution climate change information
for use in impact studies can also obtained via more sophisticated statistical
downscaling (SD) methods but such studies have to date, largely restricted
themselves to the use of a single driving GCM.
6.4.1 Climate Scenarios developed from Statistical Downscaling
Statistical downscaling is based on the view that the regional climate is
conditioned by two factors; the large scale climate state and regional/local
physiographic featured (e.g. topography, land-sea distribution and land use;
(Von Storch, 1995, 1999). From this perspective, regional or local climate
information is derived by first determining a statistical model which relates
large-scale climate variable (or "predictors") to regional and local variable
(or "predict ands"). Then the large-scale output of a GCM simulation is fed
into this statistical model to estimate the corresponding local and regional
climate characteristics. One of the primary advantages of these techniques
54 | PHYSICAL SCIENCE BASIS
is that they are computationally inexpensive, and thus can be easily applied
to output from different GCM experiments. Another advantage is that they
can be used to provide site-specific information, which can critical for many
climate change impact studies. The major theoretical weakness of a SD
methods isthattheir basic assumption is not verifiable, i.e., that the statistical
relationship develop for the present day climate also hold under the different
forcing conditions of possible future climates - a limitation that also applies
to the physical parameterizations of dynamic models.
6.4.2 Dynamical downscaling for development of climate scenario
In recent years, Regional Climate Models (RCMs) are one of the fundamental
techniques used to downscale global (large-scale) climate processes for
regional applications. Several studies have demonstrated the capability of
RCMs in representing details of regional climate variability when such models
are driven by initial and lateral boundary conditions taken from the analyses
of observations or the Global Circulation Models (GCMs) output.
The RCMs have also become suitable tools for regional climate processes,
seasonal climate variability, regional climate change and impact studies that
are not well represented by coarse resolution GCMs. In RCMs the influence
of local climatic forcing superimposed on large-scale climate variability are
resolved than using GCMs.
6.4.3 The Case of Ethiopia: Regional-Scale Simulation using RegCM (Dynamical)
Ethiopia presents a particularly difficult test for climate models. The central
part of Ethiopia is dominated by the East African Highlands, which split the
country climatically.
To the south and east the land is semi-arid and the rains fall in two short
spells either side of the dry season of Kirmet (June to August). To the north
and west, the vegetation is lusher, and Kirmet is the major rainy season. This
split in the geographical distribution of rainfall, and the different seasonal
cycles in different regions of Ethiopia, make the task of simulating Ethiopian
rainfall extremely challenging. This was noted in recent work by Mengistu
Tsidu (2012a) which has shown that there is large wet bias over highlands and
PHYSICAL SCIENCE BASIS | 55
dry bias over lowlands of Ethiopia in ECMWF reanalysis rainfall. Furthermore,
climate models need to be able to capture the processes that influence
the year-to-year (interannual) variability of Ethiopian rainfall. Variations of
El Nino, the Indian Monsoon and the position of the African Easterly Jet all
impact the rainfall over Ethiopia.
Disentangling these remote influences on the climate of Ethiopia, and
correctly simulating them in a climate model is an exceptionally difficult
task. One of the most challenging and uncertain aspects of present-day
climate research is associated with the prediction of a regional response to
a global forcing. Evaluations of the GCMs show that they still have significant
systematic errors in and around Africa, with excessive rainfall in the south, a
spurious southward displacement of the Atlantic inter-tropical convergence
zone (ITCZ), and insufficient upwelling in the seas off the western coast. These
conditions are exacerbated over Ethiopia due to its complex topography as
we have discussed before.
Mengistu et al (2012b) used the latest version of the International Center
for Theoretical Physics (ICTP) Regional climate model version 4 (RegCM4)
to study the climate variability of Ethiopia. The model was configured to a
spatial resolution of 50 km and model performance evaluations were made
for the known three Ethiopian seasons which are JJAS (June, July, August and
September), ONDJ (October, November, December and January) and FMAM
(February, March, April and May).
According to Mengistu et al (2012b), RegCM4 was able to capture the
structure of the dominant atmospheric circulation patterns which are
associated with precipitation over Africa north of the Equator especially over
complex orography like Ethiopian highlands.
The model simulated well the depth and northward extent of the low level
jet (L U ) ; the strength, location and depth of the upper troposphere Tropical
Easterly Jet (TEJ) ; the location (both in latitude and height) of the African
Easterly Jet (AEJ). The main model deficiency being the underestimation of
the mid-tropospheric easterlies in both seasons over the southern equatorial
regions and the overestimations of TEJ and LU.
Mengistu et al (2012b) also conclude that RegCM4 reproduces well the spatial
56 I PHYSICAL SCIENCE BASIS

pattern of the mean temperature climatology of the three seasons although
there is slight deference locally resulting in mixed bias. Generally, the model
was found to have moderate warm and cold biases over low and highlands of
Ethiopia respectively.
Although the performance of RegCM4 in simulating precipitation varies with
the selection of convective parametrization scheme, Mengistu et al (2012b)
reported that RegCM4 reproduced the major features of precipitation in all
seasons. The model able to reproduce the observed intrannual cycle peaks,
although it tends to over-predict their magnitude except some cases. The
RegCM4 rainfall climatology also shows some deficiencies in reproducing
the intensities and phase of the observed rainfall. They suggested that
this deficiency might be due to the fact that the limitations of RegCM4 in
reproducing the observed rainfall climatology of those climate Eco-regions
of Ethiopia which is characterized by complex topographical features, land cover and mesoscale circulations that might be difficult to capture with
50 km horizontal resolution. However, the above study is mainly based on
simulations for the current climate and one of the AR4 emission scenarios.
While the study can in principle be replicated under RCP scenarios, this is not
the case for this report. Therefore, the results on both current and future
climate model projections are based on data interpolated to finer spatial
resolution from coarse-resolution coupled climate models shown in Table A.2
of the annex of this report. Moreover, the errors that could arise from the
interpolation procedure is not included in the overall uncertainty budget of
the ensemble mean from the GCMs.
7. FUTURE CLIMATE CHANGE
7.1 Introduction
Projections of changes in the climate system are made using a hierarchy of
climate models ranging from simple climate models, to models of intermediate
complexity, to comprehensive climate models, and Earth System Models.
These models simulate changes based on a set of scenarios of anthropogenic
forcings. A new set of scenarios, the Representative Concentration Pathways
(RCPs), was used for the new climate model simulations carried out under
the framework of the Coupled Model Intercomparison Project Phase 5
(CMIP5) of the World Climate Research Program. In all RCPs, atmospheric
C 0 2 concentrations are higher in 2100 relative to present day as a result of
PHYSICAL SCIENCE BASIS | 57

a further increase of cumulative emissions of CO, to the atmosphere during
the 21st century (IPCC, 2013).
7.2 CMIP5 model ensemble based historical changes in rainfall and temperature
Figs. 26-27 show the CMIP5 model ensemble-based historical annual mean
precipitation and temperature trends with their significance. Although there
is no significant change in simulated mean annual precipitation, there is a
tendency of a decrease over the central and an increase over the rest of the
country.
The change is pronounced when seasonal precipitation is considered. For the
Belg rains, the decrease in rainfall ranges from -150 to -50 mm across the
south-central and eastern parts of the country, and will be associated with
lower Belg harvests and poorer pastoral rangelands during the summer and
early fall. For the Kiremt rains, the decline in rainfall ranges also from -150
to -50 mm across the western and southern parts of Ethiopia. The combined
Belg and Kiremt rainfall reductions results in a total loss of more than 150
mm of rainfall per year in the most densely populated (Fig. 26) long cycle crop
growing area of the country. During the past 11 or 12 years, average rainfall
conditions have been poor in most areas, more than 0.4 standard deviations
below average.
Trend = 0.06 [mm/day]015
40 45
Longitude [°]
pValue = 0.26 [mm/day]
35 40 45
Longitude [°]
Figure 26. Trend (left) and significance ( right) of historical ensemble mean annual
precipitation from 1975 to 2005 from fourteen CMIP5 models. The rainfall trends are
determined by linear regression from each model data with 95% confidence.
58 I PHYSICAL SCIENCE BASIS

There is significant trend in mean annua! surface temperature during 1975-
2005 period. The annual mean surface temperature increases within a range
of 0.6 to 0.8 0C from place to place over the country.
Trend = 073 T5JJT
pValue = 0.005 °C]14
0.8 o_ 12
V 10T3
0.7 3 8
ra 6_ i
0 6 4
■ 0.04
0 03
0.02
j0 01
35 40 45
Lo n g itu d e [°]
Figure 27. Trend (left) and significance ( right) of historical ensemble mean surface
temperature 1975 to 2005 from fourteen CMIP5 models in the same manner as in
Fig. 26.
7.3 CMIP5 model ensemble based projected changes in rainfall
Fig. 28 shows the CMIP5 model-based historical and projected annual mean
precipitation. The single line represents the historical (1975-2005) ensemble
model simulations, whereas RCP2.6, RCP4.5 and RCP8.5 ensembles mean
precipitation are indicated with the solid lines. The shaded areas represent
the standard errors of each RCP as determined from the scatter among the
models in the ensemble.
.5 2
"1975 1985 1995 2005 2015 2025 2035 2045 2055 2065 2075Y e a r s s i n c e 1 9 7 5
Figure 28. Mean annual rainfall over Ethiopia from 1975-2099.
PHYSICAL SCIENCE BASIS | 59

Mean precipitation projections have larger uncertainties as evident from the
large spread of the precipitation projections in the figure, which ranges from
1.8 to 2.2 mm/day towards the end of the century. The RCPs diverge from
each other while there is also an increase in the uncertainty with time as
expected (see Table A .l for the definition of RCPs). RCP8.5 project the lowest
and highest precipitation values during the near term and the last two terms
respectively.
Fig. 29 shows the CMIP5 model ensemble-based average percentage change of
rainfall over Ethiopia for the near-term (2006-2036, left column), for the mid-term
(2037-2067, middle column) and for the end-term (2068-2099, right column) relative
to the baseline period (1975-2005) mean for the RCP2.6 (top row), RCP4.5 (middle
row) and RCP8.5 (bottom row)..
Fig. 29. Percentage change of rainfall under RCP2.6 (upper), RCP4.5 (middle) and
RCP8.5 (bottom) scenarios over Ethiopia with respect to the historical period (1975-
2005) mean.
60 | PHYSICAL SCIENCE BASIS

An increased precipitation over Ethiopia is projected during the 21st century,
except the negative to no change projections of the RCP2.6 over the eastern
part of the country. The ensemble-mean annual precipitation for all RCPs
increase by 4% to 12% by 2100 compared to the 1975- 2005 baseline.
The response of different parts of the country to different RCPs is slightly
different. The percentage increase is high over northern part of Ethiopia
under RCP2.6 scenario and over southern and east-southern part of the
country under RCP4.5 and RCP8.5 scenarios.
According to Cline (2007), projections from different models indicate that
there will be an increasing of annual rainfall in the short rainfall season in
southern Ethiopia. However, the larger proportion of the country will see
mixed result showing slight increase in south east and decrease over the
north.
7.4 CMIP5 model ensemble based projected changes in tempera ture
Fig. 30 shows the CMIP5 model-based historical and projected annual mean
temperature. The solid line represent RCP2.6, RCP4.5 and RCP8.5 ensembles
mean temperatures, whereas the shaded areas represent the standard errors
of each RCP.
7971975 1985 1995 2005 2015 2025 2035 2045 2055 2065 2075 2085 2095
Y e a r s s i n c e 1 9 7 5
Figure 30. Historical and projection period mean annual temperature over Ethiopia
(1975-2099).
PHYSICAL SCIENCE BASIS | 61

Although there is a slight spatial difference among the three RCPs in mean
temperature projections of the 2020s, the difference increases with time.
The range of annual temperature increase for all the RCPs by 2100 relative
to the 1975-2005 baseline period mean ranges from -0.5° to 6°C. From Fig.
31, one can see that under RCP2.6 the mean temperature increases by
approximately 1°C at the end of the century relative to the baseline period,
and 5°C in RCP8.5. For RCP 4.5, which represents the moderate scenario, the
projected increase in temperature is around 2°C.
Figure 31. Change in annual mean temperature under RCP2.6 (upper), RCP4.5
(middle) and RCP8.5 (bottom) scenarios over Ethiopia from the historical period
(1975-2005) mean.
The mean surface temperature change for the near-term relative to the
baseline will likely be in the range of 0.84°C to 1.08°C. Relative to natural
internal variability, near-term increases in seasonal mean and annual mean
62 | PHYSICAL SCIENCE BASIS

temperatures are expected to be larger in the tropics and subtropics than
in mid-latitudes. Increase of mean surface temperatures for the end-term
relative to 1975-2005 is projected to likely be in the range of 0.8°C to 1.1°C
(RCP2.6), 1.8°C to 2.6°C (RCP4.5), 2.6°C to 3.6°C (RCP8.5).
This is in agreement with the report by (World Bank, 2008) which report that
the average temperature in Ethiopia has been projected to increase from
23.08°C during 1961-1990 to 26.92°C in 2070-2099. However, Temesgen et
al, (2007) also reported that, there will be significant temperature difference
among different parts of the country. While highlands in the Central North of
the country will be as cold as -0.5°C, the Southeast low lands will be as warm
as 37°C. These extreme temperatures constrain crop production by limiting
water availability and growth of many plants.
Table 2. Summary of projected change in mean surface air temperature and
percentage change of rainfall over Ethiopia for the near, mid- and late 21st century
relative to the reference period (1975-2005) mean.
/' jutP 8
RCP2.6 1.08 1.50 1.45
RCP4.5 0.84 1.65 1.89
RCP8.5 0.92 2.21 3.07
RCP2.6 4.67 3.75 4.69
RCP4.5 2.93 4.46 4.75
RCP8.5 2.95 8.49 12.27
PHYSICAL SCIENCE BASIS | 63

References
Amsalu, A., Stroosnijder, L. and Graaff, J. (2007) Long-term dynamics in land
resource use and the driving forces in the Beressa watershed, highlands of
Ethiopia. Journal of Environmental Management, 83, 448-459.
Aynekulu, E., Wubneh, W., Birhane, E. and Begashaw, N. (2006) Monitoring
and Evaluating Land Use/Land Cover Change Using Participatory Geographic
Information System (PGIS) Tools: A Case Study of Begasheka Watershed,
Tigray, Ethiopia. The Electronic Journal of Information Systems in Developing
Countries, 25 ,1-10.
Asnani, G. (2005). Tropical Meteorology, Volume 1. Praveen Printing Press,
revised edition.
Bahaga, T. K., Mengistu Tsidu, G., Kucharski, F. and Diro, G. T. (2015), Potential
predictability of the sea-surface temperature forced equatorial East African
short rains interannual variability in the 20th century. Q.J.R. Meteorol. Soc.,
141:16-26. doi:10.1002/qj.2338
Bekele, F. (1997), Ethiopian use of ENSO information in its seasonal forecasts,
Internet J. Afr. Studies, No. 2. [Available at http://www.ccb.ucar.edu/ijas/ijasno2/
bekele.html.]
Beltrando, G., and P. Camberlin, (1993): Interannual variability of rainfall in
the eastern Horn of Africa and indicators of atmospheric circulation. Int. J.
Climatol., 13, 533-546.
Bewket, W. (2002) Land cover dynamics since the 1950s in Chemoga
watershed, Blue Nile basin, Ethiopia. Mountain Research and Development,
22, 263-269.
Boko, M., I. Niang, A. Nyong, C. Vogel, A. Githeko, M. Medany, B. Osman-
Elasha, R. Tabo and P. Yanda (2007) Africa. Climate Change 2007: Impacts,
Adaptation and Vulnerability. Contribution of Working Group II to the Fourth
Assessment Report of the Intergovernmental Panel on Climate Change, M.L.
Parry, O.F. Canziani, J.P. Palutikof, P.J. van der Linden and C.E. Hanson, Eds.,
Cambridge University Press,Cambridge UK, 433-467.
Cadet DL, Diehl BC. (1984) Interannual variability of surface fields over the
64 I PHYSICAL SCIENCE BASIS
Indian- Ocean during recent decades. Monthly Weather Review 112: 1921-
1935.
Camberlin P., (1997) Rainfall anomalies in the source region of the Nile and
their connection with the Indian summer monsoon. J. Climate, 10, 1380-
1392.
Camberlin P., and Philippon,N. (2002) The East African March-May Rainy
season: Associated Atmospheric dynamics and predictability over the 1968-
97 period. J. Climate, 15, 1002-1019.
Carslaw et al, (2010): A review of natural aerosol interactions and feedbacks
within the Earth system. Atmos. Chem. Phys., 10, 1701-1737.
Cline, W.R. (2007). Global warming and agriculture: impact estimates by
country. Center for Global Development. Preferred estimates based on
World Bank Ricardian model and a crop model.
Conway D , (2000): Some aspects of climate variability in the northeast
Ethiopian highlands-Wollo and Tigray. SINET: Ethiopian J. Sci. 23(2):139-161.
Conway, D., Mould, C., & Bewket, W., (2004): Over one century of rainfall and
temperature observations in Addis Ababa, Ethiopia. International Journal of
Climatology, 24(1), 77-91.
Conway, G. (2009) The science of climate change in Africa: impacts and
adaptation. Discussion paper No 1. Grantham Institute for Climate Change.
London.
Crummey, D. (1998) Deforestation in Wollo: Process or illusion? Journal of
Ethiopian Studies, 31,1-42.
Cubasch, U., D. Wuebbles, D. Chen, M.C. Facchini, D. Frame, N. Mahowald,
and J.-G. Winther (2013) Introduction. In: Climate Change 2013: The Physical
Science Basis. Contribution of Working Group I to the Fifth Assessment Report
of the Intergovernmental Panel on Climate Change [Stocker, T.F., D. Qin, G.-K.
Plattner, M. Tignor, S.K. Allen, J. Boschung, A. Nauels, Y. Xia, V. Bex and P.M.
Midgley (eds.)]. Cambridge University Press, Cambridge, United Kingdom and
New York, NY, USA.
Degefu, W. (1987) Some aspects of meteorological drought in Ethiopia, in
PHYSICAL SCIENCE BASIS | 65

Drought and Hunger in Africa: Denying Famine a Future, edited by M. H.
Glantz, pp. 23-36, Cambridge Univ. Press,, Cambridge, U. K.
Dessie, G. & Kleman, J. (2007) Pattern and magnitude of deforestation in the South Central Rift Valley region of Ethiopia. Mountain research and
development, 27, 162-168.
Dessie, G. & Christiansson, C. (2008) Forest decline and its causes in the
south-central Rift Valley of Ethiopia: Human impact over a one hundred year
perspective. Ambio, 37, 263-271.
Endalew, Gebru J. (2007) Changes in the frequency and intensity of extremes
over Northeast Africa. KNMI scientific report = wetenschappelijk rapport ;
WR 2007-02.
Etheridge et al, (1996): Natural and anthropogenic changes in atmospheric
C 0 2 over the last 1000 years in Antarctic ice and firn. J. geophys. Res. Atmos.,
4115-4128
FAO, (1998): Crop Evapotranspiration, Irrigation and Drainage, paper 56.FAO,
Rome, pp. 15-86.
Funk C, Senay G, Asfaw A et al (2005) Recent drought tendencies in Ethiopia
and equatorial-subtropical eastern Africa. US Agency for International
Development, Washington
Funk, C., Senay, G., Asfaw, A., Verdin, J., Rowland, J., Korecha, D., Eilerts,
G., Michaelsen, J., Amer, S., and Choularton, R., (2005): Recent drought
tendencies in Ethiopia and equatorial-subtropical eastern Africa: Washington,
D.C., U.S. Agency for International Development.
Funk, C., Dettinger, M.D., Michaelsen, J.C., Verdin, J.P., Brown, M.E., Barlow,
M., and Hoell, A., (2008) Warming of the Indian Ocean threatens eastern and
southern African food security but could be mitigated by agricultural devel
opment: Proceedings of the National Academy of Sciences of the United
States of America, v. 105, no. 32, p. 11,081-11,086. (Also available online at
ftp://chg.geog.ucsb.edu/pub/pubs/PNAS_2008.pdf.)
Funk, C., Dettinger, M.D., Michaelsen, J.C.. Verdin, J.P., Brown, M.E., Barlow,
M., and Hoell, A., (2008): Warming of the Indian Ocean threatens eastern
and southern African food security but could be mitigated by agricultural
!
66 | PHYSICAL SCIENCE BASIS

development: Proceedings of the National Academy of Sciences of the United
States of America, v. 105, no. 32, p. 11,081-11,086.
Garedew, E., Sandewall, M., Soderberg, U. & Campbell, B. M. (2009) Land-use
and land-cover dynamics in the Central Rift Valley of Ethiopia. Environmental
Management, 44, 683-694.
Gebrehiwot, S., Taye, A. & Bishop, K. (2010) Forest cover and stream flow in a
headwater of the Blue Nile: Complementing observational data analysis with
community perception. Ambio, 39, 284-294.
Gebeyehu M. and G. Mengistu (2012) Stratospheric Aerosol and Its Main
Deriver Over Equatorial Africa, LAP Lambert Academic Publishing, ISBN-10:
3659129356.
Gissila, T., E. Black, D. I. F. Grimes, and J. M. Slingo (2004) Seasonal forecasting
of the Ethiopian summer rains, Int. J. Climatol., 24, 1345-1358.
Gizaw Attlee (1968) weather and climate at Addis Ababa, Asmara(1964),
Diredawa and Jimma. Met. Serv. Ethiopia, Addis Ababa.
Goddard L, Graham NE. (1999) Importance of the Indian Ocean for simulating
rainfall anomalies over eastern and southern Africa. Journal of Geophysical
Research-Atmospheres 104: 19 099-19 116.
Habtemichael, A., and D. E. Pedgley, (1974): Synoptic case-study of spring
rains in Eritrea. Meteor. Atmos. Phys., 23, 285-296.
Haile, T., (1987) A case study of seasonal forecasts in Ethiopia. In: WMO RAI
(Africa) Seminar on Modern Weather Forecasting (Part II), 30 November-4
December 1987. Addis Ababa, Ethiopia.
Haile, T., (1988): Causes and characteristics of drought in Ethiopia. Ethiopian.
Journal of Agricultural Science, 10, 85-97.
Hastenrath,S. (1991) Climate DynamicsoftheTropics. Norwell Massachusetts:
Kluwer Academic Publishers. 488 pp.
Hastenrath S. and Polzin D., (2003): Dynamics of the surface wind field over
the equatorial Indian Ocean. Q. J. R. Meteorol. Soc. (2004), 130, pp. 503-517.
Held, I., and B. J. Soden, (2006): Robust responses of the hydrological cycle to
global warming. J. Climate, 19, 5686-5699.
PHYSICAL SCIENCE BASIS | 67

IPCC, (2007): Climate Change 2007: Synthesis Report. Contribution of Working
Groups I, II and III to the Fourth Assessment Report of the Intergovernmental
Panel on Climate Change [Core Writing Team, Pachauri, R.K and Reisinger, A.
(eds.)]. IPCC, Geneva, Switzerland, 104 pp.
IPCC (2013) Summary for Policymakers. In: Climate Change 2013: The Physical
Science Basis. Contribution of Working Group I to the Fifth Assessment Report
of the Intergovernmental Panel on Climate Change [Stocker, T.F., D. Qin, G.-K.
Plattner, M. Tignor, S.K. Allen, J. Boschung, A. Nauels, Y. Xia, V. Bex and P.M.
Midgley (eds.)]. Cambridge University Press, Cambridge, United Kingdom and
New York, NY, USA.
Ininda J, Desalgne B, Befekadu A. (1987) The characteristics of rainfall
in Ethiopia and its relationship to the El Nino southern oscillation. In First
Technical Conference on Meteorological Research in Eastern and Southern
Africa, Nairobi, Kenya, Kenya Meteorological Department; 133-135.
Jury M. R. and C. Funk (2013) Climate change over Ethiopia: regional signals
and drivers, International Journal of Climatology, in press.
Kassahun, B (1987a) Large Scale Features Associated with Kiremt Rainfall
Anomaly. African Climate and Climate Change: Physical Social and Political
perspectives: Charles J. R. Williams, Dominic R. Kniveton.
Kassahun, B. (1987b) Weather systems over Ethiopia, paper presented at
the first international Technical Conference on Meteorological Research in
Eastern and Southern Africa, pp. 53-57, Nairobi, Kenya, UCAR
Korecha D. and Barnston A. G., (2007) Predictability of June-September
Rainfall in Ethiopia. Amer. Meteor. Soc., 135, 625-650.
Krishnamurti, T.N., and M. Kanamitsu, (1981). Northern summer planetary-
scale monsoons during drought and normal rainfall months. Monsoon
Dynamics, 19-48.
Kruzhkova, T.S., (1981): On certain features of the atmospheric circulation in
periods of drought. In: R.P. Pearce (Ed.),. Tropical Droughts, Meteorological
Aspects and Implication for Agriculture. Gidrometeostat: Moscow, 49-55.
Latif M, Dommenget D, Dima M, Grotzner A. (1999) The role of Indian Ocean
1
68 | PHYSICAL SCIENCE BASIS
sea surface temperature in forcing East African rainfall anomalies during
December-January 1997/98. Journal of Climate 12: 3497-3504.
Mawunya, F. D., S. G. K. Adiku, K. B. Laryea, M. Yangyuoru and E. Atika, (2011):
Characterization of Seasonal Rainfall for Cropping Schedules, West African
Journal of Applied Ecology, 19, pp. 107-118.
McCann, J. C. (1995): People of the plow: an agricultural history of Ethiopia
1800-1990. Madison: University of Wisconsin Press.
Mengistu, K. T. (2009) Watershed Hydrological Responses to Changes in Land
Use and Land Cover, and Management Practices at Hare Watershed, Ethiopia.
Dissertation, Universitat Siegen Fakultat Bauingenieurwesen, Research
Institute for water and Environment, Germany.
Mengistu Tsidu, G. (2012a) High-Resolution Monthly Rainfall Database for
Ethiopia: Homogenization, Reconstruction, and Gridding. J. Climate, 25,
8422-8443. doi: http://dx.doi.Org/10.1175/JCLI-D-12-00027.l
Mengistu Tsidu, G., Tamene Mekonnen, Robel Takele, Jemal Seid, Andualem
Shimelis, Girma Mammo, (2012b): Dynamical and statistical downscaling
of climate data for impact modeling over Ethiopia, unpublished report for
Ethiopian Institute of Agricultural Research.
Mengistu Tsidu, G., W. Gitau, C. Oludhe, L. Ogailo, Z. Atheru, and P. Ambenje
(2015): [Regional Climates] Eastern Africa [in "State of the Climate in 2014"].
Bull. Amer. Meteor. Soc. , P187-189.
Nicholls N. (1993) What are the potential contributions of El Nino southern
oscillation research to early warning of potential acute food-deficit situations?
Internet Journal of African Studies 2 http://www.brad.ac.ukresearch/ijas
[May 2004],
NMSA, (1996) Climatic and agroclimatic resources of Ethiopia. National
Meteorological Services Agency of Ethiopia, Meteorological Research Report
Series, Vol. 1, No. 1 ,1 -137.
NMSA, (2001): Initial National Communication of Ethiopia to the United
Nations Framework Convention on Climate Change. Federal Democratic
Republic of Ethiopia, Ministry of Water and Energy, National Meteorological
Agency, June 2001, Addis Ababa Ethiopia.
PHYSICAL SCIENCE BASIS | 69
Nyssen, J., Poesen, J., Moeyersons, J., Deckers, J., Haile, M. & Lang, A. (2004)
Human impact on the environment in the Ethiopian and Eritrean highlands -
A state of the art. Earth-Science Reviews, 64, 273-320.
Nyssen, J., Haile, M., Naudts, J., Munro, N., Poesen, J., Moeyersons, J., Frankl,
A., Deckers, J. & Pankhurst, R. (2009) Desertification? Northern Ethiopia re
photographed after 140 years. Science of the Total Environment, 407, 2749-
2755.
PBL (2013) Trends in global C02 emissions: 2013 Report. Bakgound studies.
PBL Netherlands Environmental Assessment Agency. PBL publishers.
Pedgley, D. E. (1966) THE RED SEA CONVERGENCE ZONE. Weather, 21: 394-
406. doi: 10.1002/j.1477-8696.1966.tb02788.x Desert Locust Control
Organization for Eastern Africa on secondment from the British Meteorological
Office.
Quinn WH. (1992) A study of the southern oscillation related climatic activity
for AD 622-1990 incorporating Nile River flood data. In El Ni~no: Historical
and Paleo Climatic Aspects of the Southern Oscillation, Diaz HF, Markgraf V
(eds). Cambridge University Press.
Segele, Z. T. and P. J. Lamb, (2005): Characterization and variability of Kiremt
rainy season over Ethiopia, Meteorol Atmos Phys, 89:153-180.
Segele, Z. T., P. Lamb, and L. Leslie (2009) Seasonal-to-lnterannual variability
of Ethiopia/Horn of Africa monsoon, part I: Associations of wavelet-filtered
large-scale atmospheric circulation and global sea surface temperature, J.
Clim., 22, 3396-3421.
Shanko D., and P. Camberlin, (1998) The effect of the southwest Indian Ocean
tropical cyclones on Ethiopian drought. Int. J. Climatol., 18, 1373-1378.
Selesh i Y, Zanke U, (2004): Recent changes in rainfall and rainy days
in Eth iopia . Int. J. C lim atol. 24:973-983.
Selesh i Y, Cam berlin P, (2006): Recent changes in dry spell and
extrem e rainfall events in Ethiopia. Theor. Appl. C lim ato l. 83(1-
4 ):181-191.
Sm ith, J.B ., and D. T irpak, (1989): The Potential Effects of C lim ate
Change on the United States, EPA -230-05-89-050, U.S. Environm ental
70 | PHYSICAL SCIENCE BASIS

Protection Agency, W ashington, DC. W orld Bank, (2008): Ethiopia:
A Country Study on the Econom ic Im pacts of C lim ate Change.
Environm ent and Natural Resource M anagem ent Report, no.
46946-ET. W ashington, DC: World Bank, Susta inable D evelopm ent
D epartm ent, Africa Region.
Tadesse T. (1994) Summer monsoon seasonal rainfall of Ethiopia in ENSO
episodic years. In WMO/TOGA International Conference on Monsoon
Variability and Prediction, ICTP, Trieste, WMO; 48-55.
Tefera, B. & Sterk, G. (2008) Hydropower-induced land use change in Fincha
watershed, western Ethiopia: Analysis and impacts. Mountain Research and
Development, 28, 72-80.
Tegene, B. (2002) Land-cover/land-use changes in the Derekolli catchment
of the South Welo zone of Amhara region, Ethiopia. Eastern Africa Social
Science Research Review, 18, 1-20.
Takele R, Shimes A, Legesse G, Said J, Mekonen T, Gebre L, Tsega M, Girma
Mamo, Tesfaye K. 2013. Analyzing Climate Risks and Exploring Options
in Eastern and Southern Africa. Research Report. Addis Ababa: Ethiopian
Institute of Agricultural Research (EIAR) and International Maize and Wheat
Improvement Center (CIMMYT).
Tekle, K. & Hedlund, L. (2000): Land cover changes between 1958 and 1986 in
Kalu District, southern Wello, Ethiopia, Mountain Research and Development,
20, 42-51.
Temesgen M, Rockstrom J, Savenije HHG, Hoogmoed WB (2007). Assessment
of Strip Tillage Systems for Maize production in semi-arid Ethiopia: Effects
on grain yield and water balance. UNESCO-IHE, Wageningen University, The
Netherlands.
TerrAfrica, (2009) The role of sustainable land management for climate
change adaptation and mitigation in sub-Saharan Africa. Issue Paper,
TerrAfrica, Regional Sustainable Land Management. A TerrAfrica Partnership
Publication
UNEP (u.d). Vital Climate Graphics Africa. A UNEP/GRID-Arendal publication.
http://www.grida.no/publications/vg/africa
PHYSICAL SCIENCE BASIS | 71

Viste, E., and A. Sorteberg (2011), Moisture transport into the Ethiopian
highlands, Int. J. Climatol., 33, 249-263.
von Storch, H., (1995) Inconsistencies at the interface of climate impact
studies and global climate research. -Meteor. Z. 4 NF, 72-80.
Von Storch, H., 1999: Misuses of statistical analysis in climate research.
Analysis of Climate Variability: Applications of Statistical Techniques, 2nd
edition [H. Von Storch and A. Navarra (eds.)]. Springer-Verlag, New York, and
Heidelberg, Germany, pp. 11-26.
Walker GT, Bliss EW. (1932) World Weather V. Memoir of the Royal
Meteorological Society 3: 81-95
Wang, K. C., and S. L. Liang, (2009) Global atmospheric downward long wave
radiation over land surface under all-sky conditions from 1973 to 2008. J.
Geophys. Res. Atmos., 114, D19101.
Wang et al, (2012): Recent change of the global monsoon precipitation
(1979-2008). Clim. Dyn., 39, 1123-1135.
Wild, M., J. Grieser, and C. Schaer (2008) Combined surface solar brightening
and increasing greenhouse effect support recent intensification of the global
land-based hydrological cycle. Geophys. Res. Lett., 35, L17706.
William, A.P., and C. Funk; (2011) A westward extension of the warm pool
leads to a westward extension of the Walker circulation, drying eastern
Africa. Clim Dyn DOI 10.1007/s00382-010-0984-y.
W0ien, H. (1995) Deforestation, information and citations. GeoJournal 37,
501-511.
Zeleke, G. & Hurni, H. (2001) Implications of land use and land cover dynamics
for mountain resource degradation in the northwestern Ethiopian highlands.
Mountain Research and Development, 21, 184-191.
72 I PHYSICAL SCIENCE BASIS

ANNEX: ATLAS OF CLIMATE PROJECTIONS FOR ETHIOPIA
This Annex presents a series of figures showing patterns of climate change
over Ethiopia computed from twenty one global climate models output
gathered as part of the Coupled Model Intercomparison Project Phase 5
(CMIP5; Taylor et al., 2012). Maps of surface air temperature change and
relative precipitation change (i.e., change expressed as a percentage of mean
precipitation) in different seasons are presented for Ethiopia and for eleven
administrative regions in Ethiopia. Twenty-year average changes for the
near term (2016-2035), for the mid term (2046-2065) and for the long term
(2081-2100) are given, relative to a reference period of 1986-2005.
Maps are shown only for the RCP4.5 scenario; however, the time series
presented show how the area-average response varies among the RCP2.6,
RCP4.5 and RCP8.5 scenarios. Tables A .l and A.2 give experiment description
and the set of models used to produce the time series plots and the spatial
maps. The 25th, 50th and 75th percentile of the distribution of ensemble
members is presented in the spatial maps (different from similar plots in
Chapter 4 and the time series which show the multi-model mean).
Table A .l Short names for RCP scenario experiments used in this report and their
descriptions.
Experiment
Short Name
Experiment Description
Historical Simulation of recent past (1850 to 2005). Impose changing conditions
(consistent with observations).
RCP2.6 Future projection (2006-2100) forced by RCP2.6. RCP2.6 is a
representative concentration pathway which approximately results in
a radiative forcing of 2.6 W.m 2 at year 2100, relative to pre-industrial
conditions.RCP4.5 Future projection (2006-2100) forced by RCP4.5. RCP4.5 is a
representative concentration pathway which approximately results in
a radiative forcing of 4.5 W.m'2 at year 2100, relative to pre-industrial
conditions. RCPs are time dependent, consistent projections of
emissions and concentrations of radiatively active gases and particles.
PHYSICAL SCIENCE BASIS | 73

RCP8.5 Future projection (2006-2100) forced by RCP8.5. RCP8.5 is a
representative concentration pathway which a proximately results in
a radiative forcing of 8.5 W.m - at year 2100, relative to pre-industrial
conditions. RCPs are time dependent, consistent projections of
emissions and concentrations of radiatively active gases and particles.
74 I PHYSICAL SCIENCE BASIS

Model Institute Link to model documentationBCC-CSM1.1 Beijing Climate Center (BCC) http://forecast.bcccsm.cma.gov.cn/
web/c hannel-34.htmBCC- CSMl.l(m) Beijing Climate Center (BCC) http://f0recast.bcccsm.cma.R0v.cn/
web/c hannel-34.htmCCSM4 National Center for Atmospheric
Research (NCAR)http://www2.cesm.ucar.edu/
CESM1 (BGC) National Center for Atmospheric Research (NCAR)
http://www2.cesm.ucar.edu/
CESM1 (CAM5) National Center for Atmospheric Research (NCAR)
http://www2.cesm.ucar.edu/
CESM1 (WACCM) National Center for Atmospheric Research (NCAR)
http://www2.cesm.ucar.edu/errata
FGOALS-g2 Institute of Atmospheric Physics,
Chinese Academy of Sciences
http://www.lasg.ac.cn/fgoals/index2.asp
GFDL-CM3 Geophysical Fluid Dynamics Laboratory (GFDL)
http://www.gfdl.noaa.gov/cmip
GFDL-ESM2G Geophysical Fluid Dynamics Laboratory (GFDL)
http://journals.ametsoc.org/doi/abs /10.1175/JCLI-D-11-00560.1
GFDL-ESM2M Geophysical Fluid Dynamics Laboratory (GFDL)
http://iournals.ametsoc.org/doi/abs /10.1 175/JCLI-D-11-00560.1
GISS-E2-R NASA Goddard Institute for Space Studies (NASA-GISS)
http://data.giss.nasa.gov/modelE/ar5
HadGEM2-AO National Institute of Meteorological Research,
http://dx.doi.org/10.1175/JCLI3712.1
HadGEM2-CC Met Office Hadley Centre (MOHC)
http://dx.doi.org/10.1175/JCLI3712.1
HadGEM2-ES Met Office Hadley Centre (MOHC)
http://dx.doi.org/10.1175/JCLI3712.1
Table A.2 The CMIP5 models used in this report for each of the historical and RCP
scenario experiments. The data is a subset of the IPCC working group i AR5 snapshot
of the 15th March 2013.
PHYSICAL SCIENCE BASIS | 75
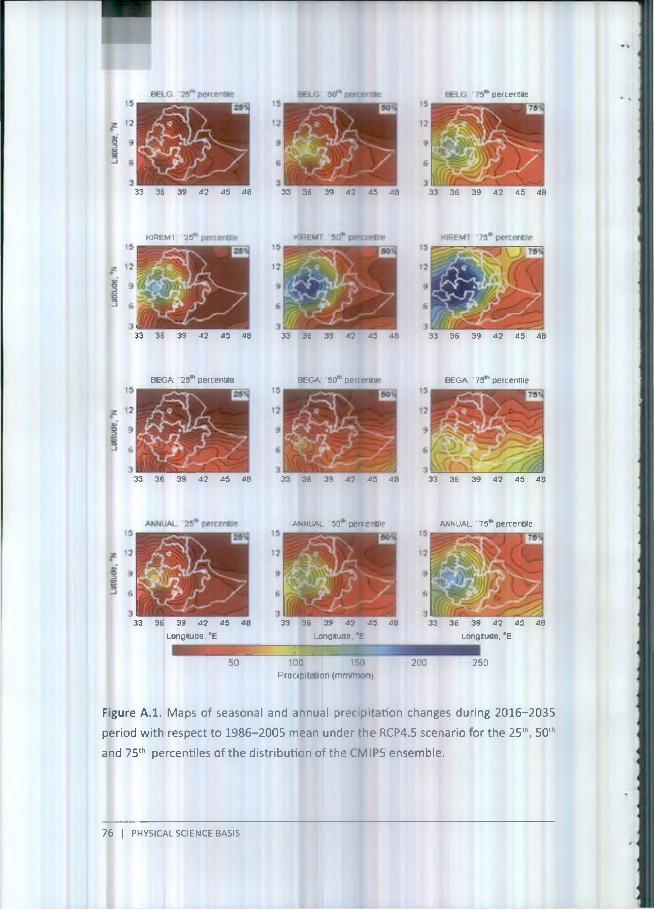
percentile
33 36 39 42 45 48 33 36 39 42 45 48 33 36 39 42 45 48
KIREMT 25
33 36 39 42 45 48 33 36 39 42 45 48 33 36 39 42 45 48
BEG A 25"1 percentile B EG A 50“ percentile BEGA 75 percentile
33 36 39 42 45 48 33 36 39 42 45 48 33 36 39 42 45 48
a n n u a l '50 pert entile ANNUAL •75"' percentile
33 36 39 42 45 48
Longitude °E
33 36 39 42 45 48
Longitude ‘ E
33 36 39 42 45 48
Longitude, *E
50 100 150 200 250 Precipitation (mrrVmon)
Figure A.I. Maps of seasonal and annual precipitation changes during 2016-2035
period with respect to 1986-2005 mean under the RCP4.5 scenario for the 25th, 50th
and 75th percentiles of the distribution of the CM IPS ensemble.
76 I PHYSICAL SCIENCE BASIS

15
12
9
b
333 36 39 42 45 48
B E L G 50,h percentileB E L G '2 5 p e rc e n ts
KIREMT. ' 25th percentile15
KIREM T '50 Bi percentile15
12
9
6
333 36 39 42 45 48
BEG A '25:h percentile 8 E G A '50 percentile15
Figure A.2. Maps of seasonal and annual precipitation changes during 2046-2065
period with respect to 1986-2005 mean under the RCP4.5 scenario for the 25th, 50th
and 75th percentiles of the distribution of the CMIP5 ensemble.
B E L G : '7 5 lh percentile
KIREMT. '75 percentile15
12
9
6
333 36 39 42 45 48
B E G A '75th percentile
33 36 39 42 45 48
Longitude. "E
100 150Precipitation (mm/mon)
33 36 39 42 45 48
Longitude, °E
a n n u a l '50th percentile a n n u a l 75th percentile
PHYSICAL SCIENCE BASIS | 77

*31
KIREMT ' 50* percentileKIREMT 25* percentile
B EG A '25th percentile BEG A '50*percenWe
BELG '25,h percentile
33 36 39 42 45 48
BELG 50"“ percentile BELG 75tN percentile
KIREMT 75* percentile
B EG A ' 75* percentileio
12
9
6s _________________
33 36 39 42 45 48
ANNUAL '25* percentile a n n u a l 50* percentile15
a n n u a l ' 75th percentile
33 36 39 42 45 48
Longitude ®E
III I— III
33 36 39 42 45 48
Longitude, ®E
1 0 0 150
Precipitation (mm/mon)
15
12
9
6
Figure A.3. Maps of seasonal and annual precipitation changes during 2081-2100
period with respect to 1986-2005 mean under the RCP4.5 scenario for the 25th, 50"
and 75th percentiles of the distribution of the CMIP5 ensemble.
78 | PHYSICAL SCIENCE BASIS
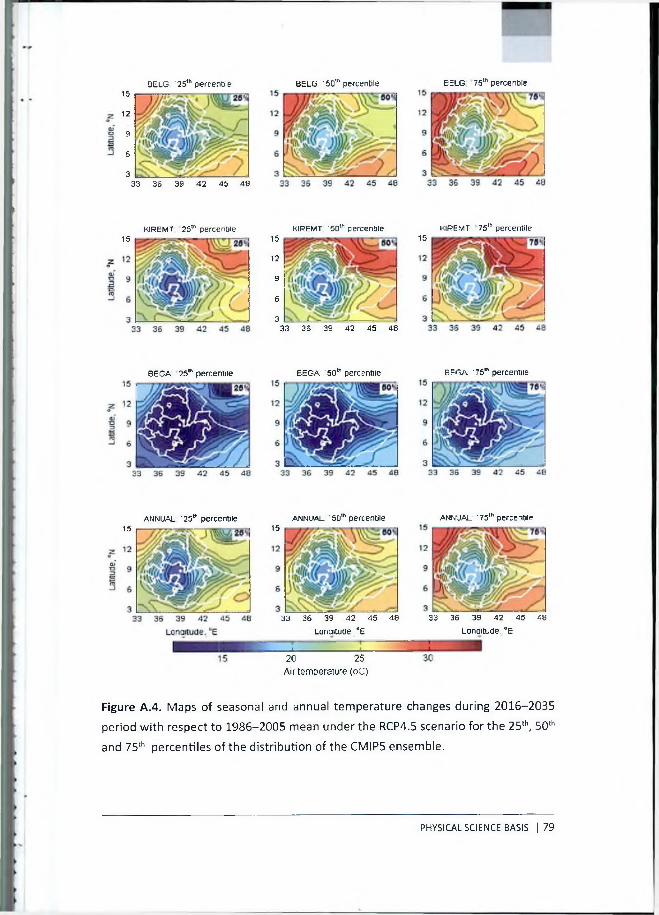
KIREM T 25th percentile15
KIREMT '50th percentile15
12
9
6
333 36 38 42 45 48
8EG A 25v ' percentile B E G A '50th percentile
15
12
9
6
333 36 39 42 45 48
B E L G : '2 5 lh percentile B E L G : '5Q,h percentile B E L G 75th percentile
KIREMT: 75th percentile15
B E G A '75th percentile
ANNUAL ‘ 25,h percentile15
ANNUAL "50"' percentile15
ANNUAL ■751h percentile
33 36 39 42 45 48
Lonaitude. °E
■20 25Air temperature (oC)
33 36 39 42 45 48
Lonaitude. °E
Figure A.4. Maps of seasonal and annual temperature changes during 2016-2035
period with respect to 1986-2005 mean under the RCP4.5 scenario for the 25th, 50th
and 75th percentiles of the distribution of the CMIP5 ensemble.
PHYSICAL SCIENCE BASIS | 79

15
z 12 «>1 9 I
15
12
9
6
333 36 39 42 45 48
BELG 50 percentile15
12
9
6
333 36 39 42 45 48
BELG '75 percentileBELG 25"* percentile
k ir e m t 'VS01 percentileKJRcMT 25* percentile KIREMT 50th percentile
33 36 39 42 45 48 36 39 42 45 48
ANNUAL 25" percentile15
12
9
6
ANNUAL 'SO* percentile
33 36 39 42 45 48 33 36 39 42 45 48
Longitude, “E Longitude. “E
15 20 25Air temperature (oC)
Figure A.5. Maps of seasonal and annual temperature changes during 2046-2065
period with respect to 1986-2005 mean under the RCP4.5 scenario for the 25tr, 50th
and 75th percentiles of the distribution of the CMIP5 ensemble.
B EG A percentile15
12
9
6
333 36 39 42 45 48
ANNUAL 75 percentile
33 36 39 42 45
Longitude. °E
80 | PHYSICAL SCIENCE BASIS

(oC)
(o
C)
(oC)
10
C)B E L G - Air temperature change in ETH IO P IA
K IR E M T- Air temperature change in ETHIOPIA
BEGA - Air temperature change in ETHIOPIA
ANNUAL - Air temperature change in ETHIOPIA
Figure A.8. Time series of seasonal and annual temperature change relative to 1986-
2005 averaged over Ethiopia for the three RCP scenarios.
PHYSICAL SCIENCE BASIS | 83

BELG - Precipitation change >n ADDiS-ABABA region
100
50
0
-50
RCPS 5 RCP-J 5 RCP2 6 historical
1975 2000 2025 2050 2075
K IR EM T- Precipitation change m ADDIS-ABABA region
2100
1975 2000 2025 2050 2075
BEGA Precipitation change in ADDIS ABABA region
2100
100
50
0
-50
RCPS 5 RCP4 5 RCP2 6 historical
AL
1950 1975 2000 2025 2050 2075
ANNUAL - Precipitation change in ADDIS-ABABA region
2100
1975 2000 2025 2050 2075 2100
Figure A.9. Time series of relative change in seasonal and annual precipitation relative
to 1986-2005 mean averaged over Addis Ababa region for the three RCP scenarios.
84 I PHYSICAL SCIENCE BASIS

6
B E L G - Air temperature change in A D D IS -A B A B A region
1950
-2 1950 1975 2000 2025 2050 2075 2100
B EG A - Air temperature change in AD D IS-AB AB A region
1975
KIR EM T -
2000 2025 2050 2075
Air temperature change in AD D IS-AB AB A region
2100
Oo
- 2 - — i--------------------------L _1950 1975 2000 9 2025 2050 2075 2100
ANNUAL - Air temperature change in A D D IS -A B A B A region
Figure A .10. Time series of seasonal and annual temperature change relative to
1986-2005 mean averaged over Addis Ababa region for the three RCP scenarios.
PHYSICAL SCIENCE BASIS | 85
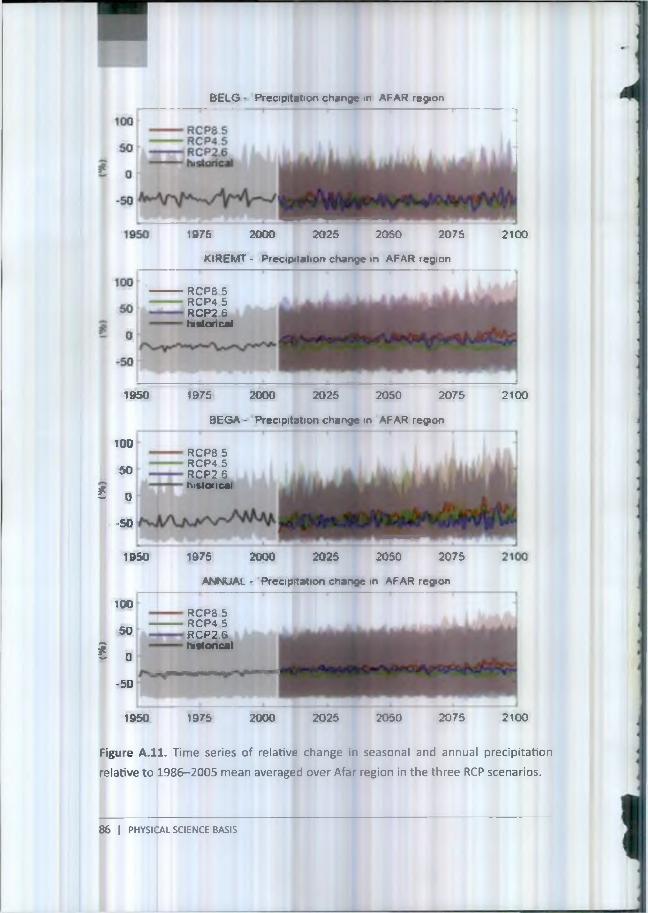
B E L G - Precipitation change in AFAR region
1975 2000 2025 2050 2075
KIREMT - Precipitation change in AFAR region
RCP8 5 RCP4 5 RCP2 6 historical
2100
1950
100
50
i o
1975 2000 2025 2050 2075
BEGA - Precipitation change in AFAR region
RCPS 5 RCP4 5 RCP2 6 historical
2100
-50
1950 1975 2000 2025 2050 2075
ANNUAL - Precipitation change in AFAR region
100
50
I 0
RCP8 5 RCP4 5 RCP2.6 historical
-50
1950 1975 2000 2025 2050 2075 2100
Figure A . l l . Time series of relative change in seasonal and annual precipitation
relative to 1986-2005 mean averaged over Afar region in the three RCP scenarios.
86 I PHYSICAL SCIENCE BASIS

<oC)
i.o
Ct
(oC)
i.o
Ci
B E L G - Air temperature change in A FAR region
4
o
0
6
1950 1975 20G0 2025 2050 2075 2100
KiREM T - Air temperature change in AFAR region
BEGA - Air temperature change in AFAR reg»on
6
4
1950 1975 2000 2025 2050 2075 2100
1950 1975 2000 2025 2050 2075 2100
ANNUAL - Ajt temperature change in AFAR region
RCP8 5 RCP4 5 RCP2 <3 historical
Figure A.12. Time series of seasonal and annual temperature change relative to
1986-2005 averaged over Afar region for the three RCP scenarios.
RCPS.5 RCP4 5 RCP2 6 historical
PHYSICAL SCIENCE BASIS | 87

B ELG * Precipitation change ip AMRARA r e g i o n
100------------RCP8 5
1950 1975 2000 2025 2050 2075 2100
KIREMT - Precipitation change >n AMHARA region
1950 1975 2000 2025 2050 2075 2100
B E G A - Precipitation change n AMHARA region
100 '
RCP8 5
1950 1975 2000 2025 2050 2075 2100
ANNUAL - Precipitation change in AMHARA region
1950 1975 2000 2025 2050 2075 2100
Figure A.13. Time series of relative change in seasonl and annual precipitation
relative to 1986-2005 averaged over Amhara region for the three RCP scenarios.
88 I PHYSICAL SCIENCE BASIS

B E L G - Air temperature change in AM HARA region
u
-21950
1975 2000 2025 2050 2075
K IR E M T - A ir te m p e ra tu re ch ange in A M H A R A reg ion
100
1975 2000 2025 2050 2075
BEGA - Air temperature change m AM HARA region
2100
2000 2025 2050 2075
Air te m p e ra tu re change in A M H A R A reg ion
2100
1975 2100
Figure A .14. Time series of seasonal and annual temperature change relative to
1986-2005 averaged over Amhara region for the three RCP scenarios.
PHYSICAL SCIENCE BASIS [89

B E L G - Precipitation change in B E N E S H -G U M U Z region
50
i o
RCPS.5 RCP4 5 RCP2 6 historical
-50 L- a- - -r _ •*1950 1975 2000 2025 2050 2075 2100
KIREMT - Precipitation change in BENESH-GUM UZ region
50
1975 2000 2025 2050 2075
B EGA - Precipitation change in BENESH-GUM UZ region
RCPS 5 RCP4 5 RCP2 6
2100
* 0historical
'n̂ ^ V v /v^ A-50
1950 1975 2000 2025 2050 2075 2100
ANNRJAL - Precipitation change in BENESH-GUM UZ region
RCP8 5 RCP4 5 RCP2 <3 historical
-50
1950 1975 2000 2025 2050 2075 2100
Figure A.15. Time series of relative change in seasonal and annual precipitation
relative to 1986-2005 averaged over Beneshangul gumuz region for the three RCP
scenarios.
90 | PHYSICAL SCIENCE BASIS

B E L G - Air temperature change in B E N E S H -G U M U Z region
K IR E M T - .Air te m p e ra tu re change in B E N E S H -G U M U Z reg ion
B E G A - A ir te m p e ra tu re change in B E N E S H -G U M U Z reg ion
6
■ - „ i i j1950 1975 2 0 0 0 2 0 2 5 2C5C 2 0 7 5 2100
ANNUAL. - Air te m p e ra tu re change in B E N E S H -G U M U Z reg ion
6
t____ _________ I A-------------- 1--------------1------------- 3i«r>n i9 7fs ?onn ?n??s ?nfsn ?o7?s ?m n
Figure A.16. Time series of seasonal and annual temperature change relative to
1986-2005 averaged over Beneshangul Gumuz region for the three RCP scenarios.
PHYSICAL SCIENCE BASIS | 91
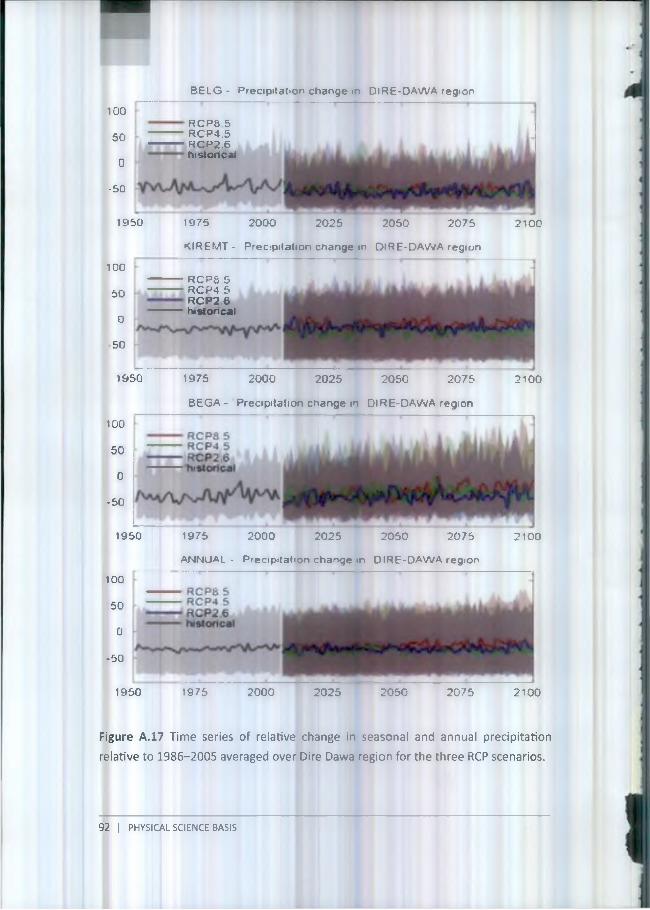
100
50
0
-SO
1950 1975 2000 2025 2050 2075 2100
100
50
0
50
1950 1975 2000 2025 2050 2075 2100
100
50
0
-50
1950 19 75 2000 2025 2050 2075 2100
100
50
0
-50
1950 1975 2000 2025 2050 2075 2100
Figure A.17 Time series of relative change in seasonal and annual precipitation
relative to 1986-2005 averaged over Dire Dawa region for the three RCP scenarios.
B E L G - Precipitation change in D lR E -D A W A region
ANNUAL - Precipitation change m D lR E-D AW A region
B E G A - Precipitation change in D lRE-D AW A region
KIREMT - Precipitation change in D lR E-D AW A region
RCP8 5 RCP4 5 RCP2.6 historical
RCPS 5 RCP4.5 RCP2.6 historical
92 | PHYSICAL SCIENCE BASIS

<oC
) io
C)
i'oC
i 1.0
C1
B E L G - Air temperature change m D lR E -D A W A region
•* L - - -A- — - _________I _____ - ■ ■ - . .4 J
1950 1975 2000 2025 2050 2075 2100
KiREfvIT - Air te m p e ra tu re ch a n ge <n D lR E -D A W A re g io n
BE G A - A:r te m p e ra tu re change in D lR E -D A W A reg ion
* • L - .................... j - - i - - ____ - ............ i— J1950 1975 2000 2025 2050 2075 2100
ANNUAL - A t te m p e ra tu re change in D lR E -D A W A reg ion
Figure A.18 Time series of seasonal and annual temperature change relative to
1986-2005 averaged over Dire Dawa region for the three RCP scenarios.
PHYSICAL SCIENCE BASIS | 93

B E LG - Precipitation change in GAM BEL LA region
------------RCPS 550 ----------- RCP4 5
1950 1975 2000 2025 2050 2075 2100
K IR EM T- Precipitation change in GAMBEL LA region
------------R C P S 550 ----------- RCP4 5
-50 \ ____________ *__________________________________ j
1950 1975 2000 2025 2050 2075 2100
B E G A - Precipitation change in GAM BELLA region
50RCP8 5 RCP4 5 RCP2.6 historical
-50 •
1950 1975 2000 2025 2050 2075
ANNUAL - Precipitation change in GAMBELLA region
RCP^S
historical
2100
2050 2100
Figure A.19. Time series of relative change in seasonal and annual precipitation
relative to 1986-2005 mean averaged over Gambella region for the three RCP
scenarios.
94 I PHYSICAL SCIENCE BASIS
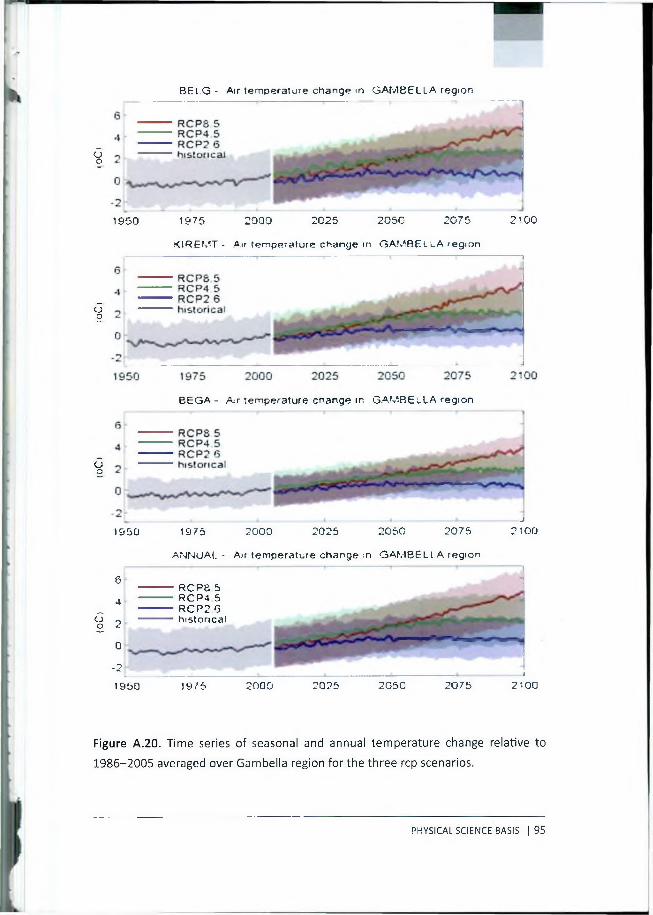
<0C)
io
C)
foC
i io
Ci
B E L G - Air temperature change m G A M B E L L A region
1950 1975 2000 2025 2050 2075
K IR E M T - Air te m p e ra tu re change in G A M B E L L A reg io n
2 , 00
1950
6-
4
2
0
.2
1950
B E G A - A j t te m p e ra tu re change in G A M B E L L A reg io n
1975 2000 2025 2050 2075
ANN UAL - Air te m p e ra tu re ch a n ge ;n G A M B E L L A reg ion
— J2100
RCP8 5 RCP4 5 RCP2 0 historical
19 75 2000 2025 205C 2075__I2 1 0 0
Figure A.20. Time series of seasonal and annual temperature change relative to
1986-2005 averaged over Gambella region for the three rep scenarios.
PHYSICAL SCIENCE BASIS | 95

B E L G - Precpitation change in HARAR region
1950 1975 2000 2025 2050 2075
KIREMT - Precpitation change in HARAR region
2 1 0 0
J 'kr. \ ' ■ - -fkyjr • - ~ ..
1950
100 '
50
€ 0
1975 2000 2025 2050 2075
BEGA - Precipitation change in HARAR region
RCPS 5 RCP4 5 RCP2 6 historical
2100
-50r v v v / V ' s r ' V y ' ^ ' V *
1950 1975 2000 2025 2050 2075
ANhJUAL - Precipitat'on change in HARAR region
2100
100
50
€ 0
-50
RCPS 5 RCP4 5RCP2 e U ^ i l historical
P1950 1975 2000 2025 2050 2075 2100
Figure A.21. Time series of relative change in seasonal and annual precipitation
relative to 1986-2005 averaged over Harar region for the three RCP scenarios.
96 | PHYSICAL SCIENCE BASIS

ioC)
io
C)
(oCi
(o
Ct
B E L G - Air temperature change m H A R A R region
1950 1975 2000 2025 2050 2075 2100
K IR E M T - A<r te m p e ra tu re change in H AR AR re g io n
1950 1975 2000 2025 2050 2075 2100
19 5 0
1950
B E G A - A ir te m p e ra tu re ch a n g e in H A R A R reg io n
R C P S 5 R C P4.5 R C P 2 6 historical
19 75 2000 2025 2050 2075
ANN UAL - A ir te m p e ra tu re ch a n g e in H A R A R reg io n
1975 >000 2025 2050 2075
2100
2100
Figure A.22. Time series of seasonal and annual temperature change relative to
1986-2005 averaged over Harar region for the three RCP scenarios.
PHYSICAL SCIENCE BASIS | 97

B E L G - Preopitation change in O R O M IY A region
RCP8 5 RCP4 5 RCP2 6 historical
1975 2000 2025 2050 2075
KIREMT - Precipitatron change in OROMIYA region
100
100
50
0
-50
RCP8 5 RCP4 5 RCP2 6 historical
1950 1975 2000 2025 2050 2075
BEGA - Precipitation change in OROMIYA region
2100
100
60
0
-50
RCP8 5 RCP4 5 RCP2 6 historical
z.1950 1975 2000 2025 2050 2075
ANNUAL - Precipitation change in OROMIYA region100
-50
1950 1975 2000 2025 2050 2075 2100
Figure A.23. Time series of relative change in seasonal and annual precipitation
relative to 1986-2005 averaged over Oromiya region for the three RCP scenarios.
98 I PHYSICAL SCIENCE BASIS
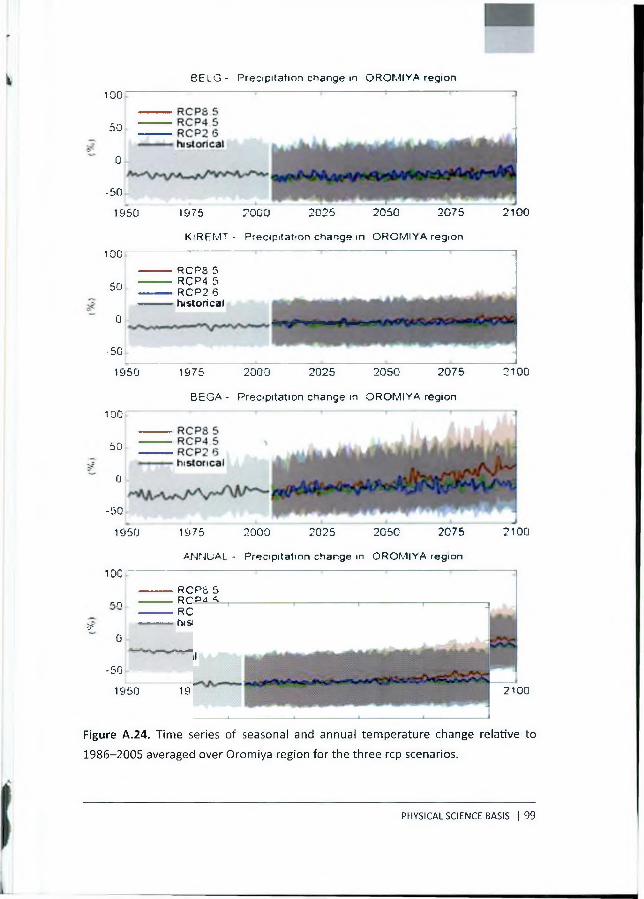
100
50
0
-50
1950 1975 2000 2025 2050 2075 2100
100
50
0
-so
1950 1975 2000 2025 2050 2075 2100
100
50
0
-50
1950 1975 2000 2025 2050 2075 2100
ANNUAL - P re c ip ita tio n change in O R O M IY A reg ion
10C---------R C P S 5
, n --------- RCP4 5_____ R CP2 0
^ ■ ■ ■ historical0
-50
1950 19 75 2000 2025 2050 2075 2100
Figure A.24. Time series of seasonal and annual temperature change relative to
1986-2005 averaged over Oromiya region for the three rep scenarios.
BE LG - Precipitation change in O R O M IY A region
ANNUAL - P re c ip ita tio n change in O R O M IY A reg ion
R C P S 5 RCP4 5 RCP2 0 historical
BEG A - P re c p ita tio n change in O R O M IY A reg ion
K 'R F M T - P rec ip ita t-on change in O R O M IY A reg ion
R C P S 5 RCP4 5 RCP2 6 historical
PHYSICAL SCIENCE BASIS | 99

100
50
0
-50
1950
B E L G - Precipitation change in SNNPR region
1975 2000 2025 2050 2075
KIREMT - Precipitation change in SNNPR region
2100
1975 2000 2025 2050 2075
BEGA - Precipitation change in SNNPR region
RCP8 5 RCP4.5 RCP2 6 historical
2100
,*rv» wV_:- A
1975 2000 2025 2050 2075
ANfAJAL - Precipitation change in SNNPR region
2 1 0 0
1975 2000 2025 2050 2075 2100
Figure A.25. Time series of relative change in seasonal and annual precipitation
relative to 1986-2005 averaged over SNNRP region for the three RCP scenarios.
100 | PHYSICAL SCIENCE BASIS
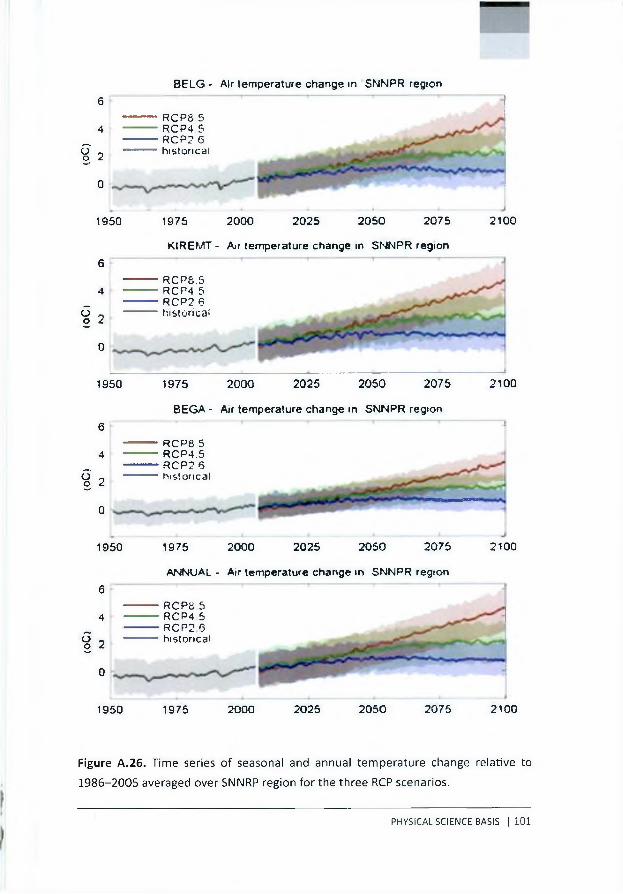
<oC>
(o
C)
(oC)
(.o
C)6
4
2
0
1950 1975 2000 2025 2050 2075 2100
6
4
2
0
1950 1975 2000 2025 2050 2075 2100
6
4
2
0
1950 1975 2000 2025 2050 2075 2100
6
4
2
0
1950 1975 2000 2025 2050 2075 2100
Figure A .26. Time series of seasonal and annual temperature change relative to
1986-2005 averaged over SNNRP region for the three RCP scenarios.
ANNUAL - Air temperature change tn SNNPR region
R C P S 5 R CP4 5 R C P2 6 h is to rica l
BEGA - Air temperature change in SNNPR region
R C P S 5 RCP4.5 R C P 2 6 h is to rica l
KIREM T - Air temperature change in SNNPR region
R C P S .5 RCP4 5 R C P 2 6 historical
B E L G - Air temperature change in S N N PR region
R C P S .5 RCP4.5 R C P2 6 h is to rica l
PHYSICAL SCIENCE BASIS | 101
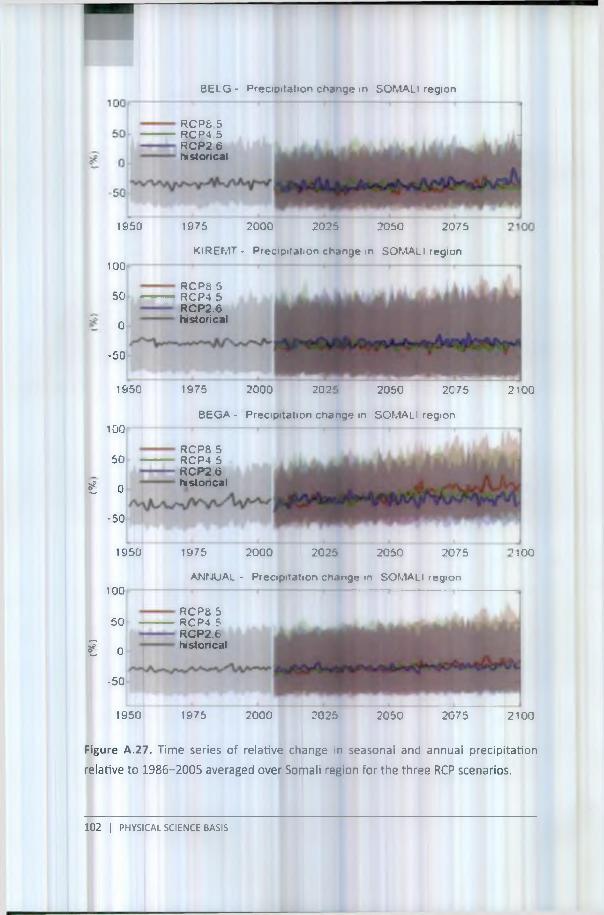
B E L G - Precipitation change in SO M A LI region
RCPS 5 RCP4 5 RCP2 6 historical
1950
100
50
0
-50
1975 2000 2025 2050 2075
KiREfvIT - Precipitation change in SOMALI region
RCPS 5 RCP4 5 RCP2.6 historical
1950 1975 2000 202' 2050 2C75 2100
BEGA - Precipitation change in SOMALI region100
50
€ 0
RCP8 5 RCP4 5 R C P2 (3 historical
-50
1950
10G
50
€ 0
-50
1975 2000 2025 2050 2075
ANNUAL - Precipitation change in SOMALI region
RCP8 5 RCP4 5 RCP2.6 historical
'100
1950 1975 2000 2025 2050 2075 2100
Figure A.27. Time series of relative change in seasonal and annual precipitation
relative to 1986-2005 averaged over Somali region for the three RCP scenarios.
102 I PHYSICAL SCIENCE BASIS

(oC
i (o
Ci
10C)
io
C'i
B E L G - Air temperature change in SO M A LI region
1950 1975 20G0 2 0 2 5 2 0 5 0 2 0 7 5 2 1 0 0
K iR E M T - A ir te m p e ra tu re ch ange in SOIWVLI reg ion
1950 1975 2 0 0 0 2 0 2 5 2 0 5 0 2 0 7 5 2 1 0 0
BE G A - A r te m p e ra tu re change in S O M A LI reg ion
R CPS 5R C P 4 S
1950 19 75 2 0 0 0 2 0 2 5 2 0 5 0 2 0 7 5 2 100
AN N U AL - A r te m p e ra tu re change in S O M A LI reg ion
1950 1975 2 0 0 0 2025 2 0 5 0 2 0 7 5 2 100
Figure A.28. Time series of seasonal and annual temperature change relative to
1986-2005 averaged over Somali region for the three RCP scenarios.
PHYSICAL SCIENCE BASIS | 103

B E L G - Precipitation change in T iG R A Y region
50
1 0 0RCP8 5 RCP4 5 R C P 26
- - historical- 0
-50
1950
100
50
1975 2000 2025 2050 2075
K IR EM T- Precipitation change in TIGRAY region
2100
* 0
•50
1950
100
50 .
------------RCPS 5 '------------RCP4 5
L 1 . . - ■ M ^■ — — historical
F T w
------1. ... — J1975 2000 2025 2050 2075
B E G A - Precipitation change in TIGRAY region
RCPS 5 RCP4 5 RCP2 6 histoncai
2100
-50
1950 1975 2000 2025 2050 2075
ANNUAL - Precipitation change in TiGRAY region
2000 2025 2050 2075 2100
Figure A.29. Time series of relative change in seasonal and annual precipitation
relative to 1986-2005 averaged over Tigray region for the three RCP scenarios.
104 I PHYSICAL SCIENCE BASIS

B E L G - Air temperature change in T iG R A Y region
K iR E M T - A ir te m p e ra tu re c h a n g e in T IG R A Y re g io n
1950 1975 2 0 0 0 2 0 2 5 2 0 5 0 2 0 7 5 2 1 0 0
B E G A - Air tem perature change in TIGRAY region
1950 1975 2 0 0 0 2 0 2 5 2 0 5 0 2 0 7 5 2 1 0 0
A N N U A L - A ir te m p e ra tu re c h a n g e in T IG R A Y re g io n
- 2 . . * . i 1950 19 75 2 0 0 0 2025 2G5C 207 5 2 1 0 0
Figure A.30 Time series of seasonal and annual temperature change relative to
1986-2005 averaged over Tigray region for the three RCP scenarios.
PHYSICAL SCIENCE BASIS | 105
