ethnic differences in transition to first marriage in iran
TRANSCRIPT

Demographic Research a free, expedited, online journal of peer-reviewed research and commentary in the population sciences published by the Max Planck Institute for Demographic Research Konrad-Zuse Str. 1, D-18057 Rostock · GERMANY www.demographic-research.org
DEMOGRAPHIC RESEARCH VOLUME 22, ARTICLE 2, PAGES 29-62 PUBLISHED 08 JANUARY 2010 http://www.demographic-research.org/Volumes/Vol22/2/ DOI: 10.4054/DemRes.2010.22.2 Research Article
Ethnic differences in transition to first marriage in Iran: The role of marriage market, women’s socio-economic status, and process of development
Fatemeh Torabi
Angela Baschieri © 2010 Fatemeh Torabi & Angela Baschieri. This open-access work is published under the terms of the Creative Commons Attribution NonCommercial License 2.0 Germany, which permits use, reproduction & distribution in any medium for non-commercial purposes, provided the original author(s) and source are given credit. See http:// creativecommons.org/licenses/by-nc/2.0/de/

Table of Contents
1 Introduction and background 30 2 Theoretical framework 33 3 Data and methods 36 3.1 Data 36 3.2 Methods 38 3.3 Sample 39 3.4 Measures 40 3.4.1 Individual-level variables 40 3.4.2 Contextual-level variables 41 4 Results 44 4.1 Ethnic differences in women’s transition to first marriage 44 4.2 The role of individual- and contextual-level factors 45 4.3 Ethnic patterns of the contribution of individual- and contextual-
level factors 47
5 Conclusion 55 6 Acknowledgements 56 References 57

Demographic Research: Volume 22, Article 2 Research Article
http://www.demographic-research.org 29
Ethnic differences in transition to first marriage in Iran: The role of marriage market, women’s socio-economic status,
and process of development
Fatemeh Torabi1
Angela Baschieri2
Abstract
This paper, using data from the 2000 Iran Demographic and Health Survey and a range of time-varying district-level contextual information derived from the 1986 and 1996 censuses of Iran, applies a discrete time hazard model to study ethnic differences in women’s transition to first marriage. The model specification accounts for both spatial and temporal changes in the socio-economic context of transition to marriage. We found ethnic-specific responses on women’s marriage timing to changes in the socio-economic context between the mid 1970s and 2000. Some ethnic groups appear to be more resistant to change despite sharing similar changes in their socio-economic context.
1 Centre for Population Studies, London School of Hygiene and Tropical Medicine, 49-51 Bedford Square, London, WC1B 3DP, United Kingdom. E-mail: [email protected]. 2 Centre for Population Studies, London School of Hygiene and Tropical Medicine, 49-51 Bedford Square, London, WC1B 3DP, United Kingdom. E-mail: [email protected].

Torabi & Baschieri: Ethnic differences in transition to first marriage in Iran
30 http://www.demographic-research.org
1. Introduction and background
Between 1976 and 2000, Iranian women experienced an increase of more than three years in their age at marriage. The female singulate mean age at marriage (FSMAM) slightly increased from 19.7 years to 19.9 between 1976 and 1986, but rose more substantially to 22.4 by 1996 (Kazemipour 2004) and to 23.0 by 2000 (calculated from the 2000 Iran Demographic and Health Survey). Some studies (Abbasi-Shavazi 2000; Abbasi-Shavazi, McDonald, and Hosseini-Chavoshi 2003; Mahmoudian 2005; Abbasi-Shavazi, Hosseini-Chavoshi, and McDonald 2007) have attributed the changes in women’s age at marriage to changes in the socio-cultural and institutional setting (ideational changes related to the Islamic Revolution, changes in the minimum legal age at marriage, urbanisation, access to means of communication, women’s education, economic hardship, etc.). Other studies (Jafari-Mojdehi 2003; Doroudi-Ahi 2004) have highlighted the role of marriage market, and more specifically the shortage of marriageable men, in the later marriage of Iranian women.
Marriage in Iran is also characterised by ethnic differences in women’s marriage timing (Abbasi-Shavazi and Sadeghi 2005). Iran’s population consists of various ethnic groups. Persians constitute nearly half and other ethnic groups (Turk, Kurd, Gilak, Mazandarani, Baluch, Lur, etc.) make up the rest of the population (Abbasi-Shavazi and Jones 2001). Iranian ethnicities are specific in terms of language, religion, and their geographic distribution. The Kurd, Lur, Baluch, Gilak and Mazandarani groups originate from Indo-Europeans (Aryans) and their languages are specific branches of the old Persian language (Afshar-Sistani 1987). The Gilak and Mazandarani groups mainly reside in the north, Kurds in the west and the north west, Lurs in the south west, and the Baluch group in south east of the country. Turks mainly live in the north west of Iran and their language is a branch of Turkish language influenced by Azeri, the language of the local population of Azerbaijan before the great migration of Turks to this area in the eleventh century (Atabaki 1993). These ethnic groups adhere to different sects of Islam with the Lur, Gilak, Mazandarani, and Turk groups being Shiite, and most Kurds and the Baluch group being Sunni Muslims.
Ethnic disparity in women’s marriage timing is shown in Figure 1. The mean age at first marriage of ethnic groups was diverse in the mid 1970s (between 16 and 20 years). During the 1990s, we witness a convergence in the trends with different ethnic groups stabilising their level at different paces. In the late 1990s, the marriage timing of most ethnic groups converged but two groups exhibited considerable differences. Specifically, the marriage timing of the Persian, Turk, Kurd, Lur, and Mazandarani groups converged at around 20 years but Gilak women still married later (22 years) and Baluch women married earlier (17 years).

Demographic Research: Volume 22, Article 2
http://www.demographic-research.org 31
Figure 1: Trend (5-year moving average) of female mean age at first marriage by ethnic group, 1976-2000, Iran
Source: Data for calculation of the mean age at first marriage was adapted from the 2001 national survey of Socio-Economic
Characteristics of Household in Iran (SECHI).3 Note: The mean age at first marriage has been calculated directly from respondents’ reported age at first marriage in SECHI.
These differences in marriage timing can be related to the specific cultural and
socio-economic attributes of ethnic groups. Some marriage patterns have been common among all Iranian ethnicities including endogamy, arranged, and supervised marriage (Harris 1977; Afshar-Sistani 1987; Askari-Khaneghah and Kamali 1995; Kazempour 1996; Nik-Kholgh and Nouri 1998). These marriage patterns are generally regarded to be traditional as they are commonly aimed at protecting the kinship and community networks and interests of the community over the preferences of individuals. However, there are ethnic dissimilarities in this marriage system even as late as 2001 (Abbasi-Shavazi and Sadeghi 2005; Abbasi-Shavazi and Torabi 2007). The Baluch and Lur groups are characterised by a high prevalence of consanguineous and arranged marriages, although not to the same extent. Among all marriages in these groups, more than half are between relatives (Baluch: 83.2% and Lur: 57.4%) (Abbasi-Shavazi and 3 One-stage cluster sampling method used in this survey. The sample consists of approximately 6960 households in 232 clusters from urban and rural areas (Statistical Centre of Iran 2001).

Torabi & Baschieri: Ethnic differences in transition to first marriage in Iran
32 http://www.demographic-research.org
Torabi 2007) and more than 70% arranged by others, mainly by parents (Baluch: 84.6% and Lur: 73.4%) (Abbasi-Shavazi and Sadeghi 2005). These marriage patterns are less frequent among other ethnicities, particularly the Mazandarani and Gilak groups with nearly one out of every five marriages among the Gilak group being consanguineous (Abbasi-Shavazi and Torabi 2007) and more than half of them being based on women’s own mate selection (Abbasi-Shavazi and Sadeghi 2005). The consanguinity and arranged marriage act to shorten the process of mate selection and, thus, can explain the marriage timing of some ethnic groups.
In addition, changes in the socio-economic context of ethnic groups over time might have affected their marriage timing both directly through the process of modernisation or indirectly by changing the composition of the marriage market. A study conducted by Erfani (2005) shows substantial differences in the pace of development between 1986 and 1996 at the provincial level. According to this study, Persians mainly lived in moderately developed and highly developed areas during this period. The Gilak and Mazandarani groups enjoyed a moderate development. Kurds, Turks, and Lurs generally lived in less developed areas in 1986 and moderately developed areas in 1996. The Baluch group lived in less developed areas during the whole period.
Therefore, ethnic differences in marriage timing can be related to both culturally-oriented marriage patterns and the process of socio-economic development. For example, despite being less developed than Persians, Gilak women marry later which can be related to their less traditional cultural marriage patterns as indicated by women’s greater freedom in mate selection and lower consanguinity. Compared with other groups, Lur and Baluch women adhere to a more traditional family value system, yet Lur women have experienced a remarkably later marriage than Baluch women which can partly be attributed to their greater progress in development and partly to their less traditional cultural patterns. Ethnic differences in marriage timing can also be related to the availability of marriageable men in areas where they live or their adaptation to this availability.
The extent of the domination of cultural factors related to ethnicity by socio-economic factors has been examined by Abbasi-Shavazi and Sadeghi (2005). Using data from the 2001 national survey of Socio-Economic Characteristics of Household in Iran and applying multiple classification analysis, they found that the magnitude of the effect of ethnicity on women’s age at marriage is reduced by 25.7% after accounting for a number of characteristics of women (age, education, employment status, and place of residence). Nevertheless, the effect of ethnicity (as a cultural indicator) remained statistically significant throughout the analysis. Using the same data and applying multiple regression analysis to a different set of explanatory variables, Mahmoudian (2005) found that the effect of ethnicity and some other characteristics of women (e.g.

Demographic Research: Volume 22, Article 2
http://www.demographic-research.org 33
education and economic activity) remain statistically significant. These studies suggest that both ethnicity and socio-economic characteristics have affected the marriage timing of Iranian women. However, they did not specifically account for temporal changes in the socio-economic context.
This study will add to the demographic literature in Iran by specifically analysing changes in the marriage market and the process of socio-economic development among different ethnic groups in order to explain ethnic-specific patterns of marriage timing. By using district-level data from two rounds of censuses and deriving time-varying contextual data linked to the 2000 Iran Demographic and Health Survey, this analysis will also add to the demographic literature by accounting for both spatial and temporal changes in the socio-economic context of women’s transition to first marriage among different ethnic groups. This paper is organised as follow: Section 2 presents the theoretical framework, the data and method are introduced in Section 3, Section 4 presents the main results, and Section 5 concludes and discusses the main findings.
2. Theoretical framework
Several studies have highlighted the importance of the demand and supply side of marriage market in determining marriage timing (Elm and Hirschman 1979; Stycos 1983; Teachman, Polonko, and Leigh 1987; Oppenheimer 1988; McLaughlin, Lichter, and Johnston 1993; Santow and Bracher 1994; Oppenheimer and Lew 1995; Sweeney 2002). Oppenheimer (1988: 573) pointed out that “people do not wish to marry just anyone-they want to mate assortatively”. Even in societies where women have a high participation in the labour market, men’s economic status remains important in marriage formation (Teachman, Polonko, and Leigh 1987; Santow and Bracher 1994; Sweeney 2002). Thus, the greater the availability of eligible men, the higher women’s probability of marriage will be (Stycos 1983; McLaughlin, Lichter, and Johnston 1993).
Women’s own socio-economic status can also contribute to their marriage timing. According to the economic theory of marriage proposed by Becker (1973 and 1974), individuals marry when their utility is maximised-that is when the benefits from marriage are greater than those from remaining single. As women’s educational attainment and participation in the labour market increases, their economic utility from marriage reduces and so does their willingness to get married. Therefore, women’s higher economic status is related to their marriage postponement by increasing the opportunity costs of marriage.
Women’s higher educational level can also contribute to their later marriage by increasing the time they are enrolled in education and postponing transition to such adulthood roles as marriage (Santow and Bracher 1994; Thornton et al. 1994; Blossfeld

Torabi & Baschieri: Ethnic differences in transition to first marriage in Iran
34 http://www.demographic-research.org
1995; Pollard and Wu 1998; Raymo 2003). In Iran, women’s educational attainment improved substantially as indicated by an increase in their literacy rate from 35.6% to 74.2% between 1976 and 1996 (Abbasi-Shavazi 2000). This educational improvement, however, did not translate to women’s higher participation in the labour force; rather it declined from 12.9% to 9.1% during the same period (Abbasi-Shavazi et al. 2002). Therefore, the negative association between educational attainment of Iranian women and their age at marriage (Kazemipour 2004; Mahmoudian 2005) is more likely to be related to the second scenario (a delay in transition to adulthood) rather than to the first (a rise in opportunity costs of marriage).
The process of development can also affect women’s marriage timing. For instance, urbanisation and industrialisation can result in women’s marriage postponement by raising their access to education and non-familial paid work and also by reducing the cultural restrictions for women’s engagement in socio-economic activities (Elm and Hirschman 1979; Abdelrahman and Morgan 1987; Santow and Bracher 1994). In Iran, urban population rose from 46.9% of the population in 1976 to 61.3% in 1996 (Amani 2001). Yet, rural residents have become more similar to those living in urban areas in terms of access to education, health, and modern amenities (Abbasi-Shavazi et al. 2002). As a result, urban women on average have married only one year later than their rural counterparts during the past few decades (Iran Ministry of Health and Medical Education 2002). Lower availability of marriageable men in rural areas (Doroudi-Ahi 2004) may be responsible for the minor rural-urban differences in marriage timing. Thus, the process of development can insert compound influences on women’s marriage timing by affecting their socio-economic status and by changing the characteristics of marriage market.
In addition to these socio-economic forces, the cultural setting also shapes demographic behaviours such as marriage timing (McNicoll 1980 and 1985; Greenhalgh 1988 and 1995). It has been suggested that the ideational system defines the aspirations and preferences of members of the society and conditions the means to achieve them through the process of socialisation (Lesthaeghe 1983; Lesthaeghe and Surkyn 1988). Thus, the independent effect of ethnicity on marriage timing of Iranian women can be related to the role of culture in mediating the socio-economic and demographic influences. In other words, we can assume that women who are exposed to different cultural settings may respond differently to socio-economic changes at the micro and macro levels.
Figure 2 provides a graphical representation of this conceptual framework. At the individual level, we control for women’s characteristics such as age, birth cohort, and education. At the contextual level, we account for temporal changes in such socio-economic and demographic factors as marriage market, women’s socio-economic status, and process of development. The effect of these factors on women’s marriage

Demographic Research: Volume 22, Article 2
http://www.demographic-research.org 35
timing can vary by their ethnicity as a factor shaping the cultural context of marriage. Using this framework, we compare the impact of these social, economic, and demographic factors on the marriage timing of ethnic groups in order to assess the extent to which ethnic patterns of marriage timing can be explained by their differences in the individual- and contextual-level factors and by their different responses to these changes.
In the specific context of Iran, for instance, despite the Lur and Baluch groups having more traditional family patterns, the Lur group is considered less traditional and more developed than the Baluch group and has experienced later marriage. On the other hand, Gilak women have experienced marriage at a later age than Manzadarani women in a less traditional context, despite their similar trends in development. Finally, Turks and Kurds have experienced similar changes in women’s marriage timing in comparable socio-economic and cultural settings. This analytical approach will help to shed light on the contribution of ethnic dissimilarity in the individual and contextual factors or their differences in resistance to change.
Figure 2: Ethnic-specific multi-level influences on women’s transition to first marriage
Ethnicity
Marriage market: -Availability of suitable men in terms of age, economic status, etc. Women’s socio-economic status: -Education -Economic activity Process of development: -Population’s education -Urbanisation -Industrialisation
Women’s characteristics: -Age -Birth cohort -Education
Transition to first marriage

Torabi & Baschieri: Ethnic differences in transition to first marriage in Iran
36 http://www.demographic-research.org
3. Data and methods
3.1 Data
We use a range of data sources: the 2000 Iran Demographic and Health Survey (IDHS), district-level data from the 1986 and 1996 Iranian censuses, and the 2001 national survey of Socio-Economic Characteristics of Household in Iran (SECHI). IDHS is a nationally-representative survey and includes 113,957 households in 28 provinces and the city of Tehran; nearly 4000 households in each province (2000 households in rural and 2000 households in urban areas). From 178,553 women who were interviewed, 50.1% (89,424 women) were ever married. The survey collected data on women’s educational attainment, marital status, date of birth of each child, and current employment status. The information regarding the age at first marriage was obtained for all ever-married women aged 10-49 (Iran Ministry of Health and Medical Education 2002).
In addition to these data, the published data of the 1986 and 1996 Iranian censuses at district “shahrestan” level4 are used in order to account for changes in the socio-economic setting over time. Due to the lack of retrospective information regarding the respondents’ place of residence in IDHS, we consider their district of residence at the time of survey as their place of residence during the period of study. Although this place could vary over time, the flow of migration has not been large and, therefore, it is convenient to apply this approach. Between 1986 and 1996, 9.1% of the population of Iran migrated to another district and only 5.4% migrated to another province (Statistical Centre of Iran 2007).
As neither census, nor IDHS collected information on ethnicity, we use the 2001 SECHI in order to derive the prevalence of ethnic groups in different regions. As Iranian ethnic groups populate distinct areas, ethnicity is identified by the region where each ethnic group lives. Using SECHI data, the proportion of inhabitants of provinces speaking each language (as an indicator of ethnicity) is estimated and provinces with similar language groups are grouped together. Although respondents’ province could change over time, which may potentially lead to misclassification of ethnicity, it is convenient to use women’s province at the time of survey as a proxy for their ethnicity due to the minor intra-province migration flows. In addition, we do not have access to other data sources in order to identify the geographic distribution of ethnic groups over the period of study and account for changes in this distribution over time.
4 The number of districts increased from more than 190 in 1986 to more than 250 in 1996 and further to nearly 270 in 2000.

Demographic Research: Volume 22, Article 2
http://www.demographic-research.org 37
Selected provinces include those where at least 75% of residents speak a single language.5 Because of comparability of the population composition of the two neighbouring provinces of Tehran and Qom in terms of language, these two provinces are categorised in one specific category.6 There are also five provinces whose population consist of different ethnic groups with nearly identical proportions and are identified as being provinces of mixed ethnicities.7 The geographic distribution of ethnic groups is displayed in Figure 3. In this study, we refer to the regions predominated by each ethnic group by their major ethnicity: for instance, Persian-predominated region, Gilak-predominated region, etc.
Figure 3: Geographic distribution of ethnic groups in Iran
Source: adapted from http://www.mahgasht.org/Images/Map/iran-map.gif.
5 The major ethnicity in Sistan-and-Baluchistan and Qazvin constitutes 65-75% of residents of these provinces. 6 Approximately half and 40% of the population of these provinces consist of those speaking Persian and Turkish, respectively. 7 These provinces include Golistan, Hamedan, Charmahal-and-Bakhtiari, Ilam, and Khuzistan.

Torabi & Baschieri: Ethnic differences in transition to first marriage in Iran
38 http://www.demographic-research.org
3.2 Methods
We apply a discrete time hazard model to analyse ethnic differences in women’s transition to first marriage. We use the age of 10 as the initial exposure to the risk of first marriage because the question of marital status has been administered from women aged 10 and above and only few women married before the age of 10 (according to IDHS, only 0.4%). The discrete time hazard rate (Allison 1982) is defined as:
Pr ,it i i itP T t T t x⎡ ⎤= = ≥⎣ ⎦ (1)
where Ti is a discrete random variable representing the time at which the end of the spell occurs. xit is a vector of regressor variable (covariate) which can be either fixed or time-varying. In the discrete time hazard model, the baseline hazard is not parameterised. In other words, no assumption regarding the functional form of the effect of length of time is made. The length of time is broken into k categories and during each category, the risk of marriage is assumed to be constant for individuals with identical values of the covariates.
In order to estimate the hazard, the discrete time hazard model is applied using the logistic regression function. As Jenkins (1995) points out, if the data is organised in a person-year format, the model likelihood has exactly the same format as a standard binary logit regression model. Using this function, the hazard rate is defined as:
( )1 1 exp 'it t itP xα β⎡ ⎤= + − −⎣ ⎦ (2)
which can be written in logit form:
log (1 ) 'it it t itP P α β− = +⎡ ⎤⎣ ⎦ (3)
where αt allows the hazard to vary with time. This specification facilitates the introduction of time-varying covariates in the model because xit can include both time-varying and fixed covariates. This model also allows for censored observations which in this study are women who did not marry by the date of survey.
The time variable, which is years since the initial exposure to the risk of first marriage (the age of 10) until first marriage (for ever-married women) or the date of survey (for never-married women), is divided into 6 categories in all models: 0-3, 4-7, 8-10, 11-14, 15-19, and 20-24. These durations correspond, respectively, with ages 10-13, 14-17, 18-20, 21-24, 25-29, and 30-34. As the age of 13 is the lowest minimum

Demographic Research: Volume 22, Article 2
http://www.demographic-research.org 39
legal age at first marriage for women during the past few decades8, this age together with the preceding ages are grouped into one category. The duration between the ages 18 and 20 includes narrower time intervals in order to capture changes in the proportion of marriage around its mean age where the risk of marriage is the highest.
Failing to account for unobserved heterogeneity in modeling of time to event can lead to overestimation of hazard rates at lower durations and an underestimation of it at higher durations (Allison 1984; Jenkins 1997). In other words, individuals who are more likely to experience the event because of their unobservable characteristics are eliminated from the risk set earlier and vice versa. In the present study, the models are estimated with and without accounting for unobserved heterogeneity. In the model which takes unobserved heterogeneity into account, the hazard rate is defined as:
log (1 ) 'it it t it iP P α β ε− = + +⎡ ⎤⎣ ⎦ (4)
where εi is the unobserved heterogeneity term. The models are estimated using pgmhaz in STATA, which is proposed by Jenkins
(1997). This command estimates, by maximum likelihood, two discrete time proportional hazard models one of which incorporates a gamma mixture distribution to summarise the individual unobserved heterogeneity. The two models estimated are (1) the Prentice and Gloecker (1978) model and (2) the Prentice and Gloecker (1978) model incorporating a gamma mixture distribution to summarise the unobserved individual heterogeneity, as proposed by Meyer (1990).
3.3 Sample
Analysing the Kaplan-Meier survival estimates of transition to first marriage, we highlight that the increase in age at first marriage has been experienced by cohorts of women born after 1966. Therefore, we select all women born after 1966, obtaining a sample of three cohorts born during the three 5-year periods of 1966-70, 1971-75, and 1976-80. According to the K-M estimates, 68.1% of 1966-70 cohort was married by the age of 20 compared with 56.9 and 43.3% of 1971-75 and 1976-80 cohorts, respectively.
8 In 1935, the minimum legal age for marriage was established at 15 for girls and 18 for boys (Momeni 1972). It increased to 18 for girls and 20 for boys in 1974. After the Islamic Revolution (1979), the minimum legal age for marriage reduced to 13 for girls and 15 for boys (Kazemipour 2004).

Torabi & Baschieri: Ethnic differences in transition to first marriage in Iran
40 http://www.demographic-research.org
3.4 Measures
3.4.1 Individual-level variables
We control for ethnicity, age, educational attainment, and birth cohort (see Table 1). Women in the Persian-predominated region represent the largest component of the sample. Consistent with the K-M survival estimates, we expect to find a lower probability of marriage for women belonging to the more recent birth cohorts. Ethnic groups are not similar in terms of birth cohort. The age structure of women in the Baluch- and Lur-predominated regions is younger than other groups as indicated by the higher proportion of women belonging to the most recent birth cohort (more than 40%). At the other extreme, with nearly 30% of women in the Gilak- and Mazandarni-predominated regions belonging to the first birth cohort, these groups have a relatively old age structure.
Table 1: Distribution (%) of the sample by individual-level variables included in the analysis and by ethnic-predominated region
Variable Region (in terms of the predominant ethnicity) P G M T K L B P and T Iran
Birth cohort
1966-70 27.42 31.78 30.98 26.48 27.58 22.24 23.66 29.08 27.41
1971-75 31.64 32.06 34.31 32.69 34.38 34.30 32.71 34.28 33.08
1976-80 40.94 36.16 34.71 40.83 38.04 43.46 43.63 36.64 39.51
Educational attainment
Illiterate 9.65 7.28 5.86 19.63 22.73 13.84 42.45 4.75 12.13 Primary 50.91 42.70 45.23 47.91 48.97 47.29 34.05 40.37 46.84 Secondary 21.60 28.74 28.75 17.51 15.29 20.50 13.47 27.47 22.04 High school 14.70 17.89 16.04 12.43 10.86 15.37 8.08 21.67 15.47 University 3.14 3.39 4.12 2.51 2.16 3.00 1.95 5.73 3.51
Total number of person years 205,728 24,745 23,185 127,375 51,392 53,586 21,745 53,450 698,624 Share in the sample (%) 31.67 4.36 4.54 14.65 5.25 3.42 2.14 20.20 100.00
Note: P:Persian-predominated, G:Gilak-predominated, M:Mazandarani-predominated, T:Turk-predominated, K:Kurd-predominated,
L:Lur-predominated, B:Baluch-predominated, P and T: Persian and Turk-predominated. 2124 women in the sample continued their education after marriage which is equivalent to 15,864 person years or 2.3 % of the sample. In order to avoid misclassification of women’s educational attainment during the period in which they were exposed to the risk of marriage, we have used the World Higher Education Systems data base (United Nations Educational, Scientific, and Cultural Organization 2008) and adjusted women’s education in accordance to their age.

Demographic Research: Volume 22, Article 2
http://www.demographic-research.org 41
We expect to find a lower probability of marriage for women with higher educational attainment. The level of education varies among ethnic groups. With more than 40% of women being illiterate, women in the Baluch-predominated region are the most disadvantaged group followed by those in the Kurd-predominated region with more than one in every five women being illiterate. With less than 10% illiterate, women in the Persian-, Gilak-, and Mazandarani-predominated regions are more privileged. The same pattern is reflected in ethnic patterns of educational level with a lower proportion of women in the Baluch- and Kurd-predominated regions attaining higher educational levels, compared with a higher proportion of other groups.
3.4.2 Contextual-level variables
In order to account for both spatial and temporal changes in the specific context of transition to first marriage, the contextual variables are constructed as district-level time-varying covariates based on the age of women at the time of decennial Iranian censuses. For any age, the contextual variables are derived from the census (1986 or 1996) which corresponds more closely to that age. Therefore, the contextual variables for women born between 1966 and 1970 at ages 10-24 are derived from the 1986 census, and those for ages 25-34 from the 1996 census.9 Similarly, for women born between 1971 and 1975 these variables at ages 10-19 are derived from the 1986 census and at higher ages from the 1996 census. For women born between 1976 and 1980, the contextual variables at ages less than 15 are derived from the 1986 census and at higher ages from the 1996 census.
Marriage market characteristics: The spouse supply is indicated by the district-level sex ratio as well as the ratios of the number of men who participate in the labour force (those who are either employed or are in search of employment), who are employed, and who are enrolled in education to the number of women in each marriage pool. The greater availability of economically active men and those who are not enrolled in education are assumed to increase women’s probability of marriage. Measures of marriage market for any 5-year age group10 of women are calculated as the ratio of the average number of men (with a specific characteristic) in that age group and the higher age group to the number of women in that age group. The reason for including two adjacent age groups of men is that the difference in the male and female
9 It should be pointed out that based on the aforementioned argument, the contextual variables for 1966-70 birth cohort at ages 10-14 should be derived from the 1976 census. However, due to the unavailability of the results of this census at the district level, these variables are also constructed using the 1986 census. This point should be kept in mind when interpreting the results for these women. 10 The reason for considering 5-year age groups is that the census results have been presented this way.

Torabi & Baschieri: Ethnic differences in transition to first marriage in Iran
42 http://www.demographic-research.org
mean age at first marriage has narrowed down during the past few decades. This difference was 4.4 years in 1976 but reached 3.9 in 1986 and 3.2 in 1996 (Kazemipour 2004). This way, the range of potential spouses is extended to men in the same age group as women as well as those in the higher age group.11
Women’s socio-economic status: In the analysis, we use the district-level proportions of literate women, literate women with post-primary schooling, literate women with university education, women who participate in the labour force (those who are either employed or are in search of employment), and women who are employed. This will allow us to test the potential negative effect of women’s higher socio-economic status in the area on the risk of marriage of women who live in that area.
The process of socio-economic development: we use in the analysis the proportions of urban population and population who are employed in the agricultural and industrial sectors in addition to the proportions of literate population, literate population with post-primary schooling, and literate population with university education in each district. Living in more developed areas can be associated with lower risk of marriage by improving the status of women but can also contribute to a higher probability of marriage by providing a better marriage market.
Ethnic disparity in the contextual factors is indicated in Table 2. Contextual variables are constructed as time-varying variables and their value represent changes in these variables over the period of study. Women in the Gilak- and Mazanadarani-predominated regions are highly advantaged in terms of education and socio-economic status with the former group being most likely to be economically active. Specifically, participation in the labour market in the Gilak-predominated region is 2.5 times higher than the Mazandarani-predominated region with the second highest participation, and between four and five times greater than most other groups. These two groups are quite similar in terms of other contextual factors. Women in the Persian-predominated region are highly urbanised and industrialised and live in areas with relatively favourable supply of suitable spouses. Except for women’s status, where the Lur-predominated region is more advantaged than the Baluch-predominated region, they are relatively comparable in terms of other factors. They are the most disadvantaged groups in terms of the availability of eligible men. Women’s status and marriage market are quite similar in the Turk- and Kurd-predominated regions but the former is nearly twice as industrialised as the latter.
11 We also constructed these measures based on a different type of marriage pool, where for any age group of women, men in the higher age group are considered as the potential spouses. In the final analysis, however, the measures based on the first type of marriage pool (indicated in the text) better fit the model both in terms of the direction of the effect and its statistical significance.

Demographic Research: Volume 22, Article 2
http://www.demographic-research.org 43
Table 2: Descriptive statistics (mean and standard deviation) of the contextual-level variables included in the analysis by ethnic-predominated region
Variable Region (in terms of the predominant ethnicity)
P G M T K L B P and T Iran
Marriage market characteristics
Sex ratio 0.950 (0.097)
0.938 (0.090)
0.929 (0.070)
0.938 (0.081)
0.963 (0.093)
0.914 (0.085)
0.896 (0.081)
1.003 (0.059)
0.943 (0.089)
Ratio of men participating in the labour force to women
0.470 (0.217)
0.498 (0.197)
0.458 (0.205)
0.505 (0.192)
0.522 (0.211)
0.403 (0.195)
0.436 (0.149)
0.484 (0.222)
0.473 (0.209)
Ratio of employed men to women 0.380 (0.220)
0.352 (0.184)
0.359 (0.197)
0.414 (0.194)
0.386 (0.205)
0.290 (0.180)
0.295 (0.183)
0.411 (0.220)
0.371 (0.208)
Ratio of men enrolled in education to women 0.400 (0.231)
0.379 (0.239)
0.404 (0.225)
0.370 (0.211)
0.383 (0.239)
0.445 (0.228)
0.326 (0.169)
0.456 (0.225)
0.401 (0.229)
Women’s Socio-economic status
Proportion of literate women 0.603 (0.145)
0.638 (0.096)
0.639 (0.085)
0.485 (0.162)
0.423 (0.182)
0.507 (0.156)
0.326 (0.158)
0.672 (0.090)
0.546 (0.167)
Proportion of literate women with post-primary schooling
0.352 (0.110)
0.493 (0.053)
0.449 (0.054)
0.349 (0.078)
0.399 (0.108)
0.379 (0.091)
0.366 (0.101)
0.393 (0.081)
0.370 (0.101)
Proportion of literate women with university education
0.026 (0.016)
0.028 (0.015)
0.030 (0.014)
0.024 (0.011)
0.026 (0.014)
0.023 (0.012)
0.026 (0.014)
0.022 (0.018)
0.025 (0.015)
Proportion of women participating in the labour force
0.072 (0.046)
0.224 (0.092)
0.089 (0.029)
0.056 (0.031)
0.052 (0.036)
0.049 (0.019)
0.047 (0.020)
0.045 (0.014)
0.068 (0.052)
Proportion of employed women 0.058 (0.044)
0.183 (0.092)
0.070 (0.027)
0.045 (0.030)
0.037 (0.035)
0.029 (0.011)
0.029 (0.014)
0.036 (0.014)
0.053 (0.048)
The process of socio-economic development
Proportion of urban population 0.525 (0.217)
0.421 (0.183)
0.411 (0.079)
0.470 (0.173)
0.488 (0.218)
0.412 (0.161)
0.454 (0.298)
0.670 (0.222)
0.490 (0.209)
Proportion of population employed in agriculture
0.262 (0.141)
0.448 (0.174)
0.381 (0.079)
0.371 (0.122)
0.356 (0.140)
0.376 (0.130)
0.392 (0.232)
0.111 (0.054)
0.318 (0.159)
Proportion of population employed in industry 0.132 (0.092)
0.112 (0.054)
0.104 (0.032)
0.135 (0.079)
0.063 (0.036)
0.050 (0.034)
0.049 (0.018)
0.228 (0.043)
0.115 (0.082)
Proportion of literate population 0.525 (0.217)
0.706 (0.078)
0.708 (0.069)
0.596 (0.130)
0.550 (0.147)
0.611 (0.124)
0.425 (0.140)
0.670 (0.222)
0.490 (0.209)
Proportion of literate population with post-primary schooling
0.262 (0.141)
0.501 (0.044)
0.486 (0.041)
0.366 (0.072)
0.420 (0.064)
0.432 (0.054)
0.452 (0.044)
0.111 (0.054)
0.318 (0.159)
Proportion of literate population with university education
0.132 (0.092)
0.040 (0.016)
0.047 (0.018)
0.036 (0.014)
0.036 (0.014)
0.045 (0.016)
0.041 (0.015)
0.228 (0.043)
0.115 (0.082)
Total number of person years 205,728 24,745 23,185 127,375 51,392 53,586 21,745 53,450 698,624
Note: P: Persian-predominated, G: Gilak-predominated, M: Mazandarani-predominated, T: Turk-predominated,
K: Kurd-predominated, L: Lur-predominated, B: Baluch-predominated, P and T: Persian and Turk-predominated. For each variable, the first and second figures represent mean and standard deviation, respectively.

Torabi & Baschieri: Ethnic differences in transition to first marriage in Iran
44 http://www.demographic-research.org
4. Results
We estimate eight discrete time hazard models in order to examine ethnic patterns of the influence of the social, economic, and demographic factors on women’s risk of marriage (see Table 4). Model 1 includes duration (the time since the age of 10) and ethnicity. Models 2 and 3 add, respectively, women’s birth cohort and educational attainment to Model 1. Model 4 includes all the individual-level characteristics in order to estimate the contribution of the contextual factors to the ethnic patterns of marriage timing after accounting for the individual-level covariates. Models 5-7 add to Model 4, respectively, the indicators of marriage market, women’s status, and process of development. This modeling strategy enables us to explore ethnic similarity in the contribution of the contextual factors as a result of their comparability in these factors. Model 8 incorporates the entire individual and contextual covariates to test whether accounting for these factors explains ethnic differences in women’s marriage timing.
Within each category of contextual variables, we select those variables that provide the best fit to the model. The results of gamma variance coefficients suggest that the unobserved heterogeneity should be taken into account in nearly all model specifications (see Table 4). Therefore, we only present the results of models which account for the unobserved heterogeneity. The results of likelihood ratio test (Kirkwood and Sterne 2003) provides strong evidence (p<0001) that each nested model performs better. In what follows, ethnic differences in women’s marriage timing are discussed. Then, ethnic patterns of the contribution of different factors are presented.
4.1 Ethnic differences in women’s transition to first marriage
Table 3 shows the contribution of different individual and contextual factors to the relative risk of marriage of ethnic-predominated regions, using Persian-predominated region as the baseline group. Before accounting for these factors (Model 1), women in the Baluch-predominated region have the highest risk (37.3% higher than women in the Persian-dominated region) and women in the Gilak-predominated region have the lowest risk of marriage (14.3% lower than women in the Persian-predominated region). The probability of marriage of the Mazandarani-, Lur-, and Turk-predominated regions hardly differs from that of the Persian-predominated region. Accounting for all the individual and contextual factors (Model 8) clearly changes the risk of marriage of ethnic groups. Nevertheless, the pattern of the influence of different factors varies by ethnicity. Our results are presented in two different sections: In the next section, the effect of each individual- and contextual-level covariate is elaborated (Section 4.2). In

Demographic Research: Volume 22, Article 2
http://www.demographic-research.org 45
the following section, we explore the patterns of the influence of the individual and contextual factors on the marriage timing of different ethnic groups (Section 4.3).
Table 3: Relative risk (%) of marriage of different ethnic-predominated regions compared with Persian-predominated region by model specification
Region (in terms of the predominant ethnicity)
Model 1 (Duration + ethnicity)
Model 2 (Model 1+
birth cohort)
Model 3 (Model 1+ education)
Model 4 (Model 1+
birth cohort and
education)
Model 5 (Model 4+ marriage market)
Model 6 (Model 4 + women’s status)
Model 7 (Model 4 + Develop-
ment)
Model 8 (All the
covariates)
Gilak-predominated
-14.27 -19.51 -15.04 -19.35 -17.55 -8.79 -15.46 15.83
Mazandarani-predominated
1.00 -3.25 7.57 2.22 7.36 5.02 8.65 26.41
Turk-predominated
-2.18 -1.88 -12.72 -10.77 -18.70 -5.26 -10.77 -17.88
Kurd-predominated
-5.63 -6.85 -22.43 -20.70 -25.47 -11.31 -13.32 -16.89
Lur-predominated
1.82 7.25 4.81 8.87 31.13 15.60 23.49 50.08
Baluch-predominated
37.30 45.35 20.80 29.82 42.62 52.80 44.92 52.35
Persian and Turk-predominated
24.48 25.36 36.07 34.18 34.72 28.40 16.42 10.96
Note: In this table, the results of Table 4 have been used. The relative risk of marriage has been calculated using
(100 x [exp(bt) - 1]) where b is a vector of parameter estimates of the covariate of ethnicity. The relative risks presented in Italic
have been derived from non-statistically-significant coefficients.
4.2 The role of individual- and contextual-level factors
The role of birth cohort: consistent with the results of K-M survival estimates, belonging to a more recent birth cohort reduces the hazards of marriage in all model specifications (see Table 4). After all the factors are included, the relative risk of marriage (100 [exp( ) 1])tb× − of women born between 1971 and 1975 and those born during 1976-80 are, respectively, 34.4 and 54.0% lower than that of women born between 1966 and 1970.

Torabi & Baschieri: Ethnic differences in transition to first marriage in Iran
46 http://www.demographic-research.org
The role of educational attainment: A higher educational attainment generally reduces the probability of marriage. In the final model, the relative risk of marriage of women graduated from primary school, secondary school, high school, and university are, respectively, 43.0, 60.3, 68.6, and 65.0% lower than that of illiterates.12 The lowest probability of marriage for women with a high school degree indicates that the negative effect of higher educational attainment on the risk of marriage does not extend from pre-university to university education. This finding can confirm our assumption regarding the contribution of higher educational level to the later marriage of Iranian women by delaying their transition to adulthood. For Iranian girls, this transition appears to be postponed until graduating from high school. Furthermore, assuming that obtaining a university degree can provide a better economic prospect than obtaining a high-school degree, the contribution of higher educational attainment to marriage delay by increasing the opportunity costs of marriage seems less likely.
The role of marriage market characteristics: A higher proportion of employed men in each marriage pool increases women’s risk of marriage which can be related to the more reliable economic status of employed men for supporting the newly formed family. Whereas, a higher proportion of men enrolled in education reduces this risk, suggesting that the society may regard male students not ready enough for taking up the new commitments related to family formation. The availability of suitable men in terms of age does not increase the hazards of marriage, suggesting the flexibility of marriage market (Ni-Bhrolchain 2001). In other words, the age preference in Iran seems to be more flexible than the preference for other favourable characteristics of the spouse supply.
The role of women’s socio-economic status: women living in areas where women have a higher socio-economic status (higher post-primary schooling and participation in the labour force) are less likely to get married. Higher prevalence of literate women in the area is not found to reduce the hazards of marriage. The reason can be the spread of literacy among all women regardless of their socio-economic background and place of residence which has been pursued since the Islamic Revolution. Given that 54.6% of women are literate (see Table 2), it can be expected that women’s literacy does not necessarily reflect their higher status in the society.
The role of process of socio-economic development: Higher urbanisation and industrialisation in the area increases the risk of marriage. Considering that women’s socio-economic status and the availability of suitable men in terms of age, employment, and educational enrolment have been accounted for, the higher risk of marriage of women who live in industrial and urban areas may be related to men’s better occupational opportunities or their higher income in these areas. Alternatively, this can
12 The differences between the risks of marriage of women with different educational levels are statistically significant at 1%.

Demographic Research: Volume 22, Article 2
http://www.demographic-research.org 47
be explained by the catching up on development in rural areas due to the ongoing investment in public services.
In the following section, we elaborate the specific contribution of these factors to the marriage timing of different ethnic groups.
4.3 Ethnic patterns of the contribution of individual- and contextual-level factors
The extent to which ethnic patterns of women’s marriage timing can be explained by dissimilar changes in their socio-economic setting and by their specific responses to similar socio-economic changes is addressed by comparing the coefficients of ethnicity in the successive models. We highlight the individual and contextual influences on the probability of marriage of women in the Lur- and Baluch-predominated regions, the Gilak- and Mazandarani-predominated regions, and the Turk- and Kurd-predominated regions.
Transition to marriage among women in Baluch- and Lur-predominated regions: Compared with other ethnic groups, Lur and Baluch women adhere to a more traditional family system. Yet, Lur women have experienced a remarkably later marriage than Baluch women which can partly be attributed to the better educational attainment and socio-economic status of Lur women and partly to their less traditional family patterns. As indicated in Table 3, the socio-economic factors have clearly affected the marriage timing of these women as adjusting for all factors in Model 8 results in their comparable relative risk of marriage (around 50% higher than women in the Persian-predominated region). Nevertheless, there are ethnic differences in the contribution of these factors. The marriage timing of women in the Lur-predominated region has mostly been affected by their birth cohort and the characteristics of marriage market with more than a change of 70% in their relative risk of marriage when these factors are included in the analysis13 (compare Model 1 with Model 2 and Model 4 with Model 5). More specifically, their younger age structure and less advantaged marriage market than women in the Persian-predominated region have made the most contribution to their marriage postponement.
Figure 4 compares the hazards of marriage of women in the Lur-predominated region with those of women in the Persian-predominated region and highlights changes in the hazards of marriage of the former if they lived in areas with identical values of the indicators of marriage market to the latter. Among different indicators of marriage
13 In order to quantify changes in the marriage timing of ethnic groups after accounting for the factors included in different models, we have calculated the percentage change in the relative risk of marriage of ethnic groups in different nested models. Specifically, Models 2, 3, and 8 in Table 3 have been compared with Model 1 and Models 5-7 with Model 4. For further clarification, we specify these comparisons in the text.

Torabi & Baschieri: Ethnic differences in transition to first marriage in Iran
48 http://www.demographic-research.org
market, the availability of employed men makes the largest contribution to the marriage timing of women in the Lur-predominated region. Replacing the availability of employed men in areas within the Lur-predominated region with that in the Persian-predominated region results in an 8.8% higher risk of marriage of 18-20 year-old women in the Lur-predominated region. The other two indicators have a minor effect on the risk of marriage of these women with changing their risk of marriage by only 1.2%.
Figure 4: Estimated hazards of women’s transition to first marriage by different values of the district-level sex ratio (sr), ratio of employed men to women (e), and ratio of men currently enrolled in education to women (ce), Lur-predominated region
Note: In this figure, the results of Model 5 in Table 4 have been used. The hazards at duration t years, p(t), have been calculated using the equation p(t) = exp(bx) / [1 + exp(bx)], where b is a vector of parameter estimates and x is the appropriate covariate vector. The covariate vector used in the calculations relates to women with the mean value of the contextual covariates, those belonging to the first birth cohort, and those who have primary school educational attainment.

Demographic Research: Volume 22, Article 2
http://www.demographic-research.org 49
Although women in the Baluch-predominated region are quite similar to those in the Lur-predominated region in terms of birth cohort and marriage market, their marriage timing have not been affected by these factors to the same extent. The age structure of women in the Baluch-predominated region changes their relative risk of marriage by less than 20% (compare Models 1 and 2) and the marriage market is less effective than other factors. These two groups are also quite similar in terms of urbanisation and industrialisation, yet these factors have affected the relative risk of marriage of women in the Lur-predominated region twice as much as that of women in the Baluch-predominated region (compare Models 4 and 7).
These findings show different marriage responses of these two groups to similar socio-economic settings, suggesting more resistance of women in the Baluch-predominated region to changes in marriage patterns. The lower cultural flexibility of women in the Baluch-predominated region is also confirmed by a considerably lower magnitude of the overall individual and contextual influences on their marriage timing. After accounting for these factors, changes in the relative risk of marriage in the Lur-predominated region are more than three time higher than those in the Baluch-predominated region (compare Models 1 and 8). The greater cultural rigidity among women in the Baluch-predominated region can partly be related to their lower access to education compared with women in both Persian- and Lur-predominated regions. We can assume the traditional cultural patterns to remain more intact where less access to education has restricted ideational and behavioural changes in the population. This assumption is in line with our findings, in that women’s educational attainment is the most effective factor in determining the marriage timing of women in the Baluch-predominated region followed by women’s status in the area. Accounting for these factors changes their relative risk of marriage by more than 40% (compare Model 1 with Model 3 and Model 4 with Model 6). In other words, the lower educational attainment of women in the Baluch-predominated region compared with women in the Persian-predominated region has made the largest contribution to their earlier marriage.
Transition to marriage among women in Gilak- and Mazandarani-predominated regions: Compared with other ethnicities, Gilak and Mazandarani women have less traditional family patterns. Yet, Gilak women have experienced later marriage than Mazandarani women despite their comparable socio-economic and demographic attributes. These marriage patterns can be related to ethnic-specific marriage responses to socio-economic attributes which can partly be driven by less traditional family patterns among the Gilak group. The results suggest that the marriage timing of women in the Gilak-predominated region has mostly been affected by women’s socio-economic status with more than a change of 50% in their relative risk of marriage when this factor is included in the analysis (compare Models 4 and 6). More specifically, higher status of

Torabi & Baschieri: Ethnic differences in transition to first marriage in Iran
50 http://www.demographic-research.org
women in the Gilak-predominated region compared with those in the Persian-predominated region has made the largest contribution to their marriage postponement.
Figure 5 shows changes in the hazards of marriage of women in the Gilak-predominated region if they lived in areas typical of women living in the Persian-predominated region. Among different indicators, the marriage timing of women in the Gilak-predominated region is mostly determined by women’s participation in the labour force followed by their post-primary schooling. Replacing the values of these indicators in areas within the Gilak-predominated region with those in the Persian-predominated region shows an increase of, respectively, 7.2 and 4.6% in the hazards of marriage of 18-20 year-old women in the Gilak-predominated region.
Figure 5: Estimated hazards of women’s transition to first marriage by different values of the district-level proportions of literate women (plw), women with post-primary schooling (pwpps), and women participating in the labour force (pwplf), Gilak-predominated region
Note: For information regarding the calculation of discrete time hazards, refer to Figure 4. In this figure, the results of Model 6 in Table 4 have been used.

Demographic Research: Volume 22, Article 2
http://www.demographic-research.org 51
Although women in the Gilak- and Manzadarani-predominated regions show similar socio-economic characteristics (apart from the higher participation in the labour market of the former as indicated in Table 2), the contribution of these factors to their marriage timing is different. Table 3 shows that the marriage timing of women in the Mazandarani-predominated region has mostly been affected by their educational attainment and the process of development. After including these factors, the relative risk of marriage increases by 80 and 70%, respectively (compare Model 1 with Model 3 and Model 4 with Model 7). More specifically, the better educational attainment of women in the Mazandarani-predominated region compared with those in the Persian-predominated region and to a lesser extent the lower development in the Mazandarani-predominated region has considerably influenced their risk of marriage.
Furthermore, despite their similarity in educational attainment and in the process of development with women in the Mazandarani-predominated region, including these factors in the analysis changes the relative risk of marriage of women in the Gilak-predominated region by only 5 and 20%, respectively (compare Model 1 with Model 3 and Model 4 with Model 7). The patterns of the contribution of the individual and contextual factors show a substantial role of the privileged socio-economic status of women in the Gilak-predominated region in their persistent later marriage.
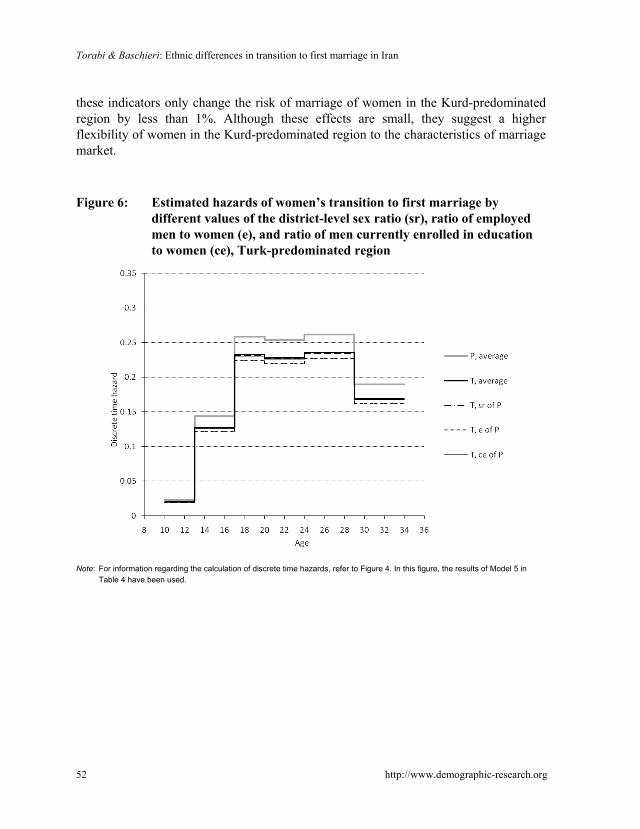
Transition to marriage among women in Turk- and Kurd-predominated regions: Turks and Kurds have experienced similar changes in their marriage timing within comparable socio-economic and cultural settings. The results suggest that the marriage timing of both groups have mostly been influenced by their educational attainment with more than 80 and 70% change in the relative risk of marriage of women in the Turk- and Kurd-predominated regions, respectively, after accounting for this factor (compare Models 1 and 3). The second most influential factor in determining the marriage timing of both groups is women’s socio-economic status with more than 50 and 40% change in the relative risk of marriage of women in the Turk- and Kurd-predominated regions, respectively, after including this factor in the analysis (compare Models 4 and 6). These two groups are similar in terms of women’s educational attainment and socio-economic status and in the effect of these factors.
However, comparable marriage market characteristics have not resulted in similar responses among these two groups with the relative risk of marriage of women in the Turk-predominated region being changed twice as much of that of women in the Kurd-predominated region when these characteristics are taken into account (compare Models 4 and 6). Figure 6 highlights changes in the hazards of marriage of women in the Turk-predominated region if they lived in areas with the same characteristics of marriage market to women in the Persian-predominated region. The availability of employed men appears to be the most important indicator of marriage market by changing the hazards of marriage of women in the Turk-predominated region by 3.7%, whereas all
Torabi & Baschieri: Ethnic differences in transition to first marriage in Iran
52 http://www.demographic-research.org
these indicators only change the risk of marriage of women in the Kurd-predominated region by less than 1%. Although these effects are small, they suggest a higher flexibility of women in the Kurd-predominated region to the characteristics of marriage market.
Figure 6: Estimated hazards of women’s transition to first marriage by different values of the district-level sex ratio (sr), ratio of employed men to women (e), and ratio of men currently enrolled in education to women (ce), Turk-predominated region
Note: For information regarding the calculation of discrete time hazards, refer to Figure 4. In this figure, the results of Model 5 in Table 4 have been used.

Demographic Research: Volume 22, Article 2
http://www.demographic-research.org 53
Table 4: Parameter estimates of discrete time hazard models for duration to women’s transition to first marriage
Covariate Model 1 (Duration + ethnicity)
Model 2 (Model 1+
birth cohort)
Model 3 (Model 1+ education)
Model 4 (Model 1+
birth cohort/
education)
Model 5 (Model 4+ marriage market)
Model 6 (Model 4 + women’s status)
Model 7 (Model 4 + Develop-
ment)
Model 8 (All the
covariates)
Duration (years since the age of 10)
0-3 (corresponds with ages 10-13)
0 0 0 0 0 0 0 0
4-7 (corresponds with ages 14-17)
1.967 (100.60)**
2.015 (98.08)**
2.219 (101.69)**
2.218 (102.99)**
1.974 (83.31)**
2.201 (101.69)**
2.209 (102.58)**
1.941 (80.99)**
8-10 (corresponds with ages 18-20)
2.406 (120.45)**
2.542 (92.77)**
2.931 (95.93)**
2.957 (101.64)**
2.704 (84.09)**
2.932 (99.72)**
2.938 (74.70)**
2.660 (82.06)**
11-14 (corresponds with ages 21-24)
2.313 (108.45)**
2.444 (63.38)**
2.999 (70.82)**
2.995 (75.14)**
2.678 (61.98)**
2.944 (72.87)**
2.958 (74.70)**
2.631 (60.47)**
15-19 (corresponds with ages 25-29)
2.137 (78.46)**
2.181 (38.26)**
3.029 (51.60)**
2.930 (52.12)**
2.721 (45.30)**
2.826 (49.40)**
2.859 (51.33)**
2.676 (44.19)**
20-24 (corresponds with ages 30-34)
1.524 (22.87)**
1.493 (15.95)**
2.571 (27.46)**
2.404 (26.04)**
2.305 (23.74)**
2.296 (24.68)**
2.323 (25.32)**
2.277 (23.40)**
Region (in terms of the predominant ethnicity)
Persian-predominated 0 0 0 0 0 0 0 0 Gilak-predominated -0.154
(-5.62)** -0.217
(-7.26)** -0.163
(-4.80)** -0.215
(-6.27)** -0.193
(-4.73)** -0.092 (-2.21)*
-0.168 (-4.90)**
0.147 (2.96)*
Mazandarani-predominated
0.010 (0.38)
-0.033 (-1.15)
0.073 (2.19)*
0.022 (0.66)
0.071 (1.78)
0.049 (1.42)
0.083 (2.45)*
0.235 (5.60)**
Turk-predominated -0.022 (-1.55)
-0.019 (-1.25)
-0.136 (-7.69)**
-0.114 (-6.44)**
-0.207 (-9.74)**
-0.054 (-2.91)*
-0.114 (-6.45)**
-0.197 (-8.80)*
Kurd-predominated -0.058 (-2.96)**
-0.071 (-3.38)**
-0.254 (-10.22)**
-0.232 (-9.30)**
-0.294 (-10.01)**
-0.120 (-4.50)**
-0.143 (-5.62)**
-0.185 (-5.95)**
Lur-predominated 0.018 (0.97)
0.070 (3.39)**
0.047 (2.00)*
0.085 (3.56)**
0.271 (9.37)**
0.145 (5.82)**
0.211 (8.43)**
0.406 (13.36)**
Baluch-predominated 0.317 (12.63)**
0. 374 (13.14)**
0.189 (5.79)**
0.261 (7.93)**
0.355 (8.74)**
0.424 (11.76)**
0.371 (11.05)**
0.421 (9.79)**
Persian and Turk-predominated
0.219 (12.32)**
0.294 (12.99)**
0.250 (10.56)**
0.298 (10.89)*
0.152 (6.38)**
0.104 (3.49)**
0.219 (12.32)**
0.294 (12.99)**
Mixed -0.068 (-4.96)**
-0.058 (-3.90)**
-0.130 (-7.55)**
-0.113 (-6.51)**
-0.080 (-3.93)**
-0.070 (-3.93)**
-0.046 (-2.63)*
0.008 (-0.41)
Birth cohort 1966-70
0 0 0 0 0 0
1971-75
-0.333
(-23.58)**
-0.353 (-23.17)**
-0.414 (-22.78)**
-0.385 (-24.73)**
-0.359 (-23.69)**
-0.421 (-23.18)**
1976-80
-0.724
(-41.96)**
-0.719 (-43.64)**
-0.739 (-37.89)**
-0.836 (-43.39)**
-0.758 (-45.33)**
-0.777 (-35.64)**

Torabi & Baschieri: Ethnic differences in transition to first marriage in Iran
54 http://www.demographic-research.org
Table 4: (Continued) Covariate Model 1
(Duration + ethnicity)
Model 2 (Model 1+
birth cohort)
Model 3 (Model 1+ education)
Model 4 (Model 1+
birth cohort/
education)
Model 5 (Model 4+ marriage market)
Model 6 (Model 4 + women’s status)
Model 7 (Model 4 + Develop-
ment)
Model 8 (All the
covariates)
Educational attainment Illiterate
0 0 0 0 0 0
Primary
- 0.523
(-27.34)** - 0.420
(-23.00)** -0.534
(-24.69)** -0.455
(-24.19)** -0.442
(-24.01)** -0.563
(-25.82)** Secondary - 0.881
(-37.18)** - 0.721
(-33.04)** -0.892
(-35.24)** -0.764
(-33.86)** -0.753
(-34.04)** -0.924
(-35.91)** High school -1.021
(-37.98)** -0.844
(-34.33)** -1.118
(-37.85)** -0.897
(-35.02)** -0.886
(-35.44)** -1.158
(-38.55)** University - 0.811
(-20.73)** - 0.680
(-18.41)** -1.011
(-23.30)** -0.728
(-19.22)** -0.727
(-19.54)** -1.051
(-24.08)** Marriage market characteristics
Sex ratio -0.468 (-3.42)*
-0.115 (-0.78)
Ratio of employed men to women
1.453 (12.35)**
0.889 (7.04)**
Ratio of men enrolled in education to women
-0.372 (-3.17)*
-0.920 (-7.32)**
Women’s Socio-economic status
Proportion of literate women
0.683 (12.65)**
0.108 (1.58)
Proportion of literate women with post-primary schooling
-0.414 (-6.31)**
-0.537 (-5.99)**
Proportion of women participating in the labour force
-0.622 (-4.21)**
-1.624 (-9.01)**
The process of socio-economic development
Proportion of urban population
0.154 (4.94)**
0.420 (8.14)**
Proportion of population employed in industry
1.266 (14.50)**
1.401 (11.92)**
Constant -4.441 (-228.31)**
-4.083 (-188.19)**
-3.963 (-153.08)**
-3.696 (-136.52)**
-3.182 (-37.51)**
-3.797 (-100.00)**
-3.897 (-129.13)**
-3.191 (-34.56)**
Gamma variance 0.000002 (0.13)
0.135 (4.613)**
0.477 (15.56)**
0. 475 (17.80)**
0.957 (27.82)**
0.512 (18.69)**
0.467 (17.61)**
0.940 (27.73)**
Log likelihood -156568.10 -154970.32 -155057.93 -153887.01 -153152.67 -153802.43 -153727.72 -152959.92
Note: Absolute value of z statistics in the parentheses. * Significant at 5%, ** significant at 1%.
Demographic Research: Volume 22, Article 2
http://www.demographic-research.org 55
5. Conclusion
In this study, we analysed ethnic patterns of the contribution of marriage market, women’s socio-economic status, and process of development to women’s marriage timing after accounting for the role of women’s individual-level characteristics. We used geographic regions as proxies for their inhabitant ethnic groups. By using time-varying contextual data, we accounted for both spatial and temporal changes in the social, economic, and demographic context of transition to first marriage among different ethnic groups.
We found a clear influence of the ethnic socio-economic settings and the characteristics of marriage market on their probability of marriage with the pattern of the contribution of the individual and contextual factors varying by ethnicity. In some cases, our findings show comparable responses in the marriage timing of ethnic groups to changes in their socio-economic setting. For instance, the risk of marriage of women in the Turk- and Kurd-predominated regions have similarly been affected by their birth cohort, educational attainment, and women’s status in the area in which both groups have been comparable. In addition, different educational attainment and women’s status in the area have affected the marriage timing of women in the Baluch- and Lur-predominated regions differently. Different levels of industrialisation among women in the Turk- and Kurd-predominated regions and the difference of women in the Gilak- and Mazandarani-predominated regions in their socio-economic status have also resulted in different marriage responses.
In other cases, we found ethnic-specific marriage responses to similar changes in the socio-economic setting, suggesting cultural sensitivity to the individual and contextual influences. For instance, despite being similar in birth cohort, marriage market, and process of development with women in the Lur-predominated region, the risk of marriage of women in the Baluch-predominated region has been less affected by these factors. These findings can be indicative of more resistance of women in the Baluch-predominated region to changes in marriage patterns despite socio-economic changes. This assumption is confirmed by the considerable impact of the educational attainment and status of women in the Baluch-predominated region on their marriage timing. The results suggest that this greater cultural rigidity can partly be related to their lower access to education. Furthermore, the comparability of women in the Gilak- and Mazandarani-predominated regions in their birth cohort, educational attainment, marriage market, and process of development has not resulted in their similar marriage responses. Finally, the similarity of women in the Turk- and Kurd-predominated regions in marriage market has not resulted in comparable influences on the risk of marriage of these groups with women in the Kurd-predominated region being more flexible in their preference for spousal characteristics.

Torabi & Baschieri: Ethnic differences in transition to first marriage in Iran
56 http://www.demographic-research.org
Our findings also suggest that the religious dissimilarity of ethnic groups (in terms of adherence to different sects of Islam) is unlikely to make a major contribution to their marriage patterns. More specifically, the Turk-predominated region mainly consists of Shiite and the Kurd-predominated region mostly of Sunni Muslims, yet the individual and contextual influences have been very similar between the two groups. On the other hand, the Gilak- and Mazandarani-predominated regions contain Shiite Muslims but they have experienced quite dissimilar patterns of the contribution of the socio-economic factors. The Lur-predominated region consists of Shiite and the Baluch-predominated region mainly of Sunni Muslims, and they have responded differently within similar socio-economic settings.
These findings highlight the dynamic of the social, economic, and demographic influences when they are studied in relation to cultural contexts. We emphasise the necessity of ethnic-specific studies of marriage timing in Iran in order to account for ethnic patterns of the contribution of socio-economic factors. Comprehensive demographic-anthropological studies seem to be important in identifying the nature of marriage patterns among ethnic groups and in understanding the attitudes and perceptions guiding ethnic patterns of the contribution of the social, economic, and demographic factors.
6. Acknowledgements
This research has partially been supported by the Iran Ministry of Science, Research, and Technology and the University of Tehran. We appreciate the invaluable comments of Professor John Cleland, Dr Lynda Clarke, Dr Mohammad Jalal Abbasi-Shavazi, Dr Andrew Hinde, and the reviewers of the paper.

Demographic Research: Volume 22, Article 2
http://www.demographic-research.org 57
References
Abbasi-Shavazi, M.J. (2000). Effects of Marital Fertility and Nuptiality on Fertility Transition in the Islamic Republic of Iran. Canberra: ANU (Working Papers in Demography: 84).
Abbasi-Shavazi, M.J., Hosseini-Chavoshi, M., and McDonald, P. (2007). The Path to Below Replacement Fertility in the Islamic Republic of Iran. Asia-Pacific Journal 22(2): 91-112.
Abbasi-Shavazi, M.J. and Jones, G.W. (2001). Socio-Economic and Demographic Setting of Muslim Populations. Canberra: ANU (Working Papers in Demography: 86).
Abbasi-Shavazi, M.J., McDonald, P., and Hosseini-Chavoshi, M. (2003). Changes in Family, Fertility Behavior and Attitudes in Iran. Canberra: ANU (Working Papers in Demography: 88).
Abbasi-Shavazi, M.J., Mehryar, A.H., Jones, G.W., and McDonald, P. (2002). Population, War and Modernization: Population Policy and Fertility Changes in Iran. Journal of Population Research 19(1): 25-46. doi:10.1007/BF03031967.
Abbasi-Shavazi, M.J. and Sadeghi, R. (2005). Ethnicity and Marriage Patterns in Iran [Persian]. Pazhuhish-i Zanan 3(1): 25-47.
Abbasi-Shavazi, M.J. and Torabi, F. (2007). Level, Trend, and Pattern of Consanguineous Marriage in Iran [Persian]. Journal of Population Association of Iran 1(2): 61-88.
Abdelrahman, A.I. and Morgan, S.P. (1987). Socioeconomic and Institutional Correlates of Family Formation: Khartoum, Sudan, 1945-1975. Journal of Marriage and the Family 49(2): 401-412. doi:10.2307/352309.
Afshar-Sistani, I. (1987). An Introduction to Understanding Iranian Tribes and Nomads [Persian]. Tehran: Moalef.
Allison, P.D. (1982). Discrete-Time Methods for the Analysis of Event Histories. In: Leinhardt, S. (ed.). Sociological Methodology. San Francisco: Jossey-Bass Publishers: 61-97.
Allison, P.D. (1984). Event History Analysis: Regression for Longitudinal Event Data. Beverly Hills: Sage Publications.
Amani, M. (2001). General Demography of Iran [Persian]. Tehran: Samt.

Torabi & Baschieri: Ethnic differences in transition to first marriage in Iran
58 http://www.demographic-research.org
Askari-Khaneghah, A. and Kamali, M.S. (1995). Turkman Iranians: An Anthropological and Demographic Research [Persian]. Tehran: Asatir.
Atabaki, T. (1993). Azerbaijan: Ethnicity and Autonomy in Twentieth-Century Iran. London: British Academic Press.
Becker, G.S. (1973). A Theory of Marriage: Part I. The Journal of Political Economy 81(4): 813-846. doi:10.1086/260084.
Becker, G.S. (1974). A Theory of Marriage: Part II. The Journal of Political Economy 82(S2): S11-S26. doi:10.1086/260287.
Blossfeld, H.P. (1995). The New Role of Women: Family Formation in Modern Societies. Boulder: Westview Press.
Doroudi-Ahi, N. (2004). Demographic Changes and the Marriage Squeeze in Iran [Persian]. In: The First Conference of the Population Association of Iran. Tehran: Centre for Population Studies and Research in Asia and the Pacific: 195-208.
Elm, B.V. and Hirschman, C. (1979). Age at First Marriage in Peninsular Malaysia. Journal of Marriage and the Family 41(4): 877-891. doi:10.2307/351487.
Erfani, A. (2005). Shifts in Social Development and Fertility Decline in Iran: A Cluster Analysis of Provinces: 1986-1996. London: Population Studies Centre (Discussion Paper: 05-12).
Greenhalgh, S. (1988). Fertility as mobility: Sinic Transitions. Population and Development Review 14(4): 629-674. doi:10.2307/1973627.
Greenhalgh, S. (1995). Situating Fertility: Anthropology and Demographic Inquiry. Cambridge: Cambridge University Press.
Harris, G.S. (1977). Ethnic Conflict and the Kurds. Annals of the American Academy of Political and Sociological Science 433(1): 112-124. doi:10.1177/000271627743300111.
Iran Ministry of Health and Medical Education (2002). Iran Demographic and Health Survey. Tehran: Iran Ministry of Health and Medical Education.
Jafari-Mojdehi, A. (2003). Imbalance in Marriage Status in Iran [Persian]. Journal of Social Sciences 5: 83-104.
Jenkins, S.P. (1995). Easy Estimation Methods for Discrete-Time Duration Models. Oxford Bulletin of Economics and Statistics 57(1): 129-138.

Demographic Research: Volume 22, Article 2
http://www.demographic-research.org 59
Jenkins, S.P. (1997). Estimation of Discrete Time (Grouped Duration Data) Proportional Hazards Models: pgmhaz. Mimeo. Colchester: ESRC Research Centre on Micro-Social Change, University of Essex.
Kazemipour, S. (2004). Changes in Women's Age at Marriage in Iran [Persian]. Pazhuhish-i Zanan 2(3): 103-124.
Kazempour, K. (1996). The Sociology of Arab Tribes of Khuzistan [Persian]. Tehran: Ame Nashr.
Kirkwood, B.R. and Sterne, J.A.C. (2003). Essential Medical Statistics. Oxford: Blackwell.
Lesthaeghe, R. (1983). A Century of Demographic and Cultural Change in Western Europe: An Exploration of Underlying Dimensions. Population and Development Review 9(3): 411-435. doi:10.2307/1973316.
Lesthaeghe, R. and Surkyn, J. (1988). Cultural Dynamics and Economic Theories of Fertility Change. Population and Development Review 14(1): 1-45. doi:10.2307/1972499.
Mahmoudian, H. (2005). The Increasing Age at Marriage: Examining the Protective Factors [Persian]. Journal of Social Sciences 24: 27-53.
McLaughlin, D.K., Lichter, J.T., and Johnston, G.M. (1993). Some Women Marry Young: Transitions to First Marriage in Metropolitan and Nonmetropolitan Areas. Journal of Marriage and the Family 55(4): 827-838. doi:10.2307/352765.
McNicoll, G. (1980). Institutional Determinants of Fertility Change. Population and Development Review 6(3): 441-462. doi:10.2307/1972410.
McNicoll, G. (1985). The Nature of Institutional and Community Effects on Demographic Behaviour: A Discussion. In: Casterline, J.B. (ed.). The Collection and Analysis of Community Data. Voorburg: International Statistical Institute: 177-184.
Meyer, B.M. (1990). Unemployment Insurance and Unemployment Spells. Econometrica 58(4): 757-782. doi:10.2307/2938349.
Momeni, D.A. (1972). The Difficulties of Changing the Age at Marriage in Iran. Journal of Marriage and the Family 34(3): 545-551. doi:10.2307/350454.
Ni-Bhrolchain, M. (2001). Flexibility in the Marriage Market. Population: An English Selection 13(2): 9-47.

Torabi & Baschieri: Ethnic differences in transition to first marriage in Iran
60 http://www.demographic-research.org
Nik-Kholgh, A.A. and Nouri., A. (1998). The Sociology of Iranian Tribes [Persian]. Tehran: Chapakhsh.
Oppenheimer, V.K. (1988). A Theory of Marriage Timing. The American Journal of Sociology 94(3): 563-591. doi:10.1086/229030.
Oppenheimer, V.K. and Lew, V. (1995). American Marriage Formation in the 1980s: How Important Was Women's Economic Independence? In: Mason, K.O. and Jensen, A-M. (eds.). Gender and Family Change in Industrialized Countries. Oxford: England: 105-138.
Pollard, M.S. and Wu, Z. (1998). Divergence of marriage patterns in Quebec and elsewhere in Canada. Population and Development Review 24(2): 329-356. doi:10.2307/2807978.
Prentice, R.L. and Gloecker, L.A. (1978). Regression Analysis of Grouped Survival Data with Application to Breast Cancer Data. Biometrics 3(1): 57-67. doi:10.2307/2529588.
Raymo, J.M. (2003). Educational Attainment and the Transition to First Marriage among Japanese Women. Demography 4(1): 83-103. doi:10.1353/dem.2003.0008.
Santow, G. and Bracher, M. (1994). Change and Continuity in Formation of first Marital Unions in Australia. Population Studies 48(3): 475-496. doi:10.1080/0032472031000147986.
Statistical Centre of Iran. (2001). The Survey of Socio-Economic Characteristics of Household in Iran. Tehran: Statistical Centre of Iran.
Statistical Centre of Iran. (2007). The Detailed Results of General Census of Individuals and Housing: National and Provincial Levels [electronic resource]. Tehran: Statistical Centre of Iran. http://amar.sci.org.ir.
Stycos, J.M. (1983). The timing of Spanish Marriages: A Socio-Statistical Study. Population Studies 37(2): 227-238. doi:10.2307/2173983.
Sweeney, M.M. (2002). Two Decades of Family Change: The Shifting Economic Foundations of Marriage. American Social Review 67(1): 132-147. doi:10.2307/3088937.
Teachman, J.D., Polonko, K.A., and Leigh, G.K. (1987). Marital Timing: Race and Sex Comparisons. Social Forces 66(1): 239-268. doi:10.2307/2578910.

Demographic Research: Volume 22, Article 2
http://www.demographic-research.org 61
Thornton, A., Fricke, T., Yang, L.S., and Chang, J.S. (1994). Theoretical Mechanisms of Social Change. In: Thornton, A. and Lin, H-S. (eds.). Social Change and the Family in Taiwan. Chicago: University of Chicago: 88-115.
United Nations Educational, Scientific, and Cultural Organization. (2008). IAU Directories–Higher Education Systems [electronic resource]. http://www.unesco.org.

Torabi & Baschieri: Ethnic differences in transition to first marriage in Iran
62 http://www.demographic-research.org