ethnic diversity, clientelistic resource distribution, and politicization
TRANSCRIPT

Zurich Open Repository andArchiveUniversity of ZurichMain LibraryStrickhofstrasse 39CH-8057 Zurichwww.zora.uzh.ch
Year: 2010
Ethnic diversity, clientelistic resource distribution, and politicization: theimpact of ethnicity on education in Africa
Weber, Anke
Abstract: Ethnic diversity is widely assumed to negatively affect a country’s education outcomes. Yet,comprehensive explanations for this link are still missing. This dissertation proposes and tests empiricallythree separate mechanisms through which ethnicity might affect educational outcomes in Sub-SaharanAfrica. In particular, in this thesis it is examined whether and how ethnic diversity affects a village’scommunity activities; to what extent it determines clientelistic resource distribution; and how its ef-fect on education outcomes is influenced by the political salience of ethnicity. These three mechanismsare tested in a two-level hierarchical model using a novel dataset of district level school enrollment in31 African countries in combination with newly coded indicators for district ethnic diversity, districtshares of presidents’ co-ethnics and existing ethnic parties. In a second step, the relevant factors causingethnicity to be a politically salient factor are established by comparing the development of the high politi-cization of ethnicity in Kenya to the low politicization in Tanzania and by tracing the impact of ethnicstructures, colonial administration, land distribution, and nation building policies on the politicizationof ethnicity. In the third part of this dissertation the impact of ethnic diversity on community activitiesis re-examined. In particular, this part focuses on the influence of ethnic diversity on the impact ofparental involvement activities on educational outcomes. This effect is estimated in a panel model usingthe school mapping dataset from Tanzania. In der Literatur wird ein negativer Zusammenhang zwis-chen der ethnischen Diversität eines Landes und dessen Bildungsniveau postuliert. Allerdings ist nichtklar, durch welche Mechanismen ethnische Diversität das Bildungsniveau beeinflusst. Diese Dissertationzeigt daher drei unterschiedliche Mechanismen auf, durch die ethnische Diversität auf Bildungsresultatein Sub-Sahara Afrika wirkt und testet diese empirisch. Im Besonderen versucht diese Dissertation zubestimmen, wie ethnische Diversität die Aktivitäten von lokalen Gemeinschaften beeinflusst, inwieweitEthnizität zu klientelistischer Ressourcenverteilung führt, und inwieweit der Einfluss von Ethnizität aufBildung abhängig davon ist, ob Ethnizität ein politisch relevanter Faktor ist. Diese drei Mechanismenwerden in einem zwei-Level hierarchischen Model mit Daten zu den Einschulungsraten auf Distrikt-Levelvon 31 Afrikanischen Ländern und selbst-kodierten Indikatoren für ethnische Diversität auf Distrikt-Level, Anteil der ethnischen Bevölkerung des Präsidenten in den Distrikten und Existenz von ethnischenParteien geschätzt. Im zweiten Teil dieser Dissertation werden die relevanten Faktoren, die dazu führen,dass Ethnizität politisch relevant ist, in einer vergleichenden Studie der hohen Politisierung von Eth-nizität in Kenia und der niedrigen Politisierung von Ethnizität in Tansania untersucht. Insbesonderewird hier die Methode des process tracing angewandt und der Einfluss von ethnischen Strukturen, kolo-nialer Vergangenheit, Landverteilung und Staatenbildungsmassnahmen untersucht. Der dritte Teil dieserDissertation beschäftigt sich vertieft mit dem Einfluss von Ethnizität auf die Aktivitäten von lokalenGemeinschaften. Insbesondere wird hier der Einfluss des Engagements von Eltern in der Schule auf dieBildungsresultate der Kinder betrachtet. Dieser Einfluss wird in einem Panel model und mit dem schoolmapping Datensatz von Tansania geschätzt.

Posted at the Zurich Open Repository and Archive, University of ZurichZORA URL: https://doi.org/10.5167/uzh-63126Dissertation
Originally published at:Weber, Anke. Ethnic diversity, clientelistic resource distribution, and politicization: the impact of eth-nicity on education in Africa. 2010, University of Zurich, Faculty of Arts.
2

Ethnic Diversity, Clientelistic Resource Distribution,
and Politicization: The Impact of Ethnicity on
Education in Africa
Thesis presented to the Faculty of Arts
of the University of Zurich
for the degree of Doctor of Philosophy by
Anke Weber
of Germany
Accepted in fall semester 2010 on the recommendation of Prof. Dr. Katharina Michaelowa and Prof. Dr. Isabel Günther
2010

2
By all ye cry or whisper,
By all ye leave or do,
The silent, sullen peoples
Shall weigh your Gods and you.
Take up the White Man’s burden –
And reap his old reward:
The blame of those ye better,
The hate of those ye guard.
(Rudyard Kipling, from The White Man’s Burden)
For whosoever has, to him shall be given; and he who has not, even what he has shall be
taken from him. (Mark 4:25)

3
Table of contents
Chapter 1: Introduction .................................................................................................................... 6
Chapter 2: The concept of ethnicity and case selection ................................................................. 11
2.1 The concept of ethnicity ....................................................................................................... 11
2.2 Case selection ....................................................................................................................... 13
2.2.1 Ethnic diversity in Africa ............................................................................................... 13
2.2.2 Education in Africa ........................................................................................................ 15
2.2.3 The cases Kenya and Tanzania ...................................................................................... 16
Appendix 2-1 .................................................................................................................................. 18
Chapter 3: The impact of ethnicity on education in Africa ............................................................ 20
3.1 Introduction .......................................................................................................................... 20
3.2 How does ethnicity affect education? ................................................................................... 21
3.3 Data and variable selection ................................................................................................... 26
3.4 Econometric results .............................................................................................................. 31
3.4.1 Results for primary enrollment ...................................................................................... 34
3.4.2 Results for secondary enrollment .................................................................................. 38
3.5 Discussion ............................................................................................................................. 39
3.6 Conclusion ............................................................................................................................ 41
Appendices 3-1 – 3-10 ................................................................................................................... 44
Chapter 4: The causes of politicization of ethnicity ....................................................................... 58
4.1 Introduction .......................................................................................................................... 58
4.2 Case selection and methodology .......................................................................................... 60
4.3 Tracing the causes of politicization of ethnicity ................................................................... 64
4.3.1 Revising the ethnic structure argument ......................................................................... 64
4.3.2 The colonialist’s burden: divide and rule ...................................................................... 69
4.3.3 Ethnic grievance over unequal land distribution ........................................................... 71
4.3.4 Nation building policies ................................................................................................. 74
4.4 Discussion ............................................................................................................................. 79
4.5 Conclusion ............................................................................................................................ 81
Appendices 4-1 – 4-7 ..................................................................................................................... 83

4
Chapter 5: Ethnic diversity and parental involvement ................................................................. 124
5.1 Introduction ........................................................................................................................ 124
5.2 Literature and hypotheses ................................................................................................... 126
5.2.1 Existing family involvement literature ........................................................................ 126
5.2.2 Family involvement in developing countries ............................................................... 127
5.3 Data and operationalization ................................................................................................ 130
5.4 Econometric analysis .......................................................................................................... 137
5.4.1 Empirical strategy ........................................................................................................ 137
5.4.2 Econometric results: Enrollment rates ......................................................................... 140
5.4.3 Econometric results: Exampassrate ............................................................................. 144
5.5 Discussion ........................................................................................................................... 148
5.6 Conclusion .......................................................................................................................... 151
Appendices 5-1 – 5-3 ................................................................................................................... 154
Chapter 6: Conclusion .................................................................................................................. 159
References .................................................................................................................................... 167

5
List of tables and graphs
Table 1: Features of prototypical ethnic groups ............................................................................. 12
Table 2: Distribution of ethnic groups in the World ...................................................................... 14
Table 3: Countries with highest and lowest ethnic diversity .......................................................... 14
Table 4: Indicators of education systems in the world ................................................................... 16
Table 5: Results for primary and secondary enrollment ................................................................ 35
Table 6: Important socio-economic indicators for Kenya and Tanzania, 1960 and 2006 .............. 60
Table 7: Population shares of ethnic groups in Kenya and Tanzania ............................................. 66
Table 8: Tanzania’s and low-income countries’ characteristics in comparison ........................... 132
Table 9: Results for enrollment .................................................................................................... 142
Table 10: Results for exampassrate .............................................................................................. 146
Graph 1: Map of Kenya and Tanzania ........................................................................................... 17
Graph 2: Marginal effect of politicization on primary enrollment as institutions and income
change ............................................................................................................................................. 37
Graph 3: Location of school mapping districts ............................................................................ 133
Graph 4: Marginal effects for enrollment ..................................................................................... 143
Graph 5: Marginal effects for exampassrate ................................................................................ 147
List of appendices
Appendix 2- 1: List of countries included in Table 2 and 4 ........................................................... 18
Appendix 3- 1: Variables and descriptive statistics ....................................................................... 44
Appendix 3- 2: Results for primary enrollment ............................................................................. 45
Appendix 3- 3: Results for secondary enrollment .......................................................................... 46
Appendix 3- 4: Correlation matrix ................................................................................................. 47
Appendix 3- 5: Country-by-country marginal effects of politicization .......................................... 48
Appendix 3- 6: Coding rules for diversity ...................................................................................... 53
Appendix 3- 7: Coding rules for co-ethnics ................................................................................... 54
Appendix 3- 8: Coding of leaders’ ethnic identity ......................................................................... 56
Appendix 3- 9: Coding of politicization ......................................................................................... 57
Appendix 4- 1: Expert interviewees ............................................................................................... 83
Appendix 4- 2: Interview protocols ................................................................................................ 84
Appendix 4- 3: Extraction tables .................................................................................................. 111
Appendix 4- 4: Thematic summary of extraction table ethnic structures .................................... 120
Appendix 4- 5: Thematic summary of extraction table colonialism ............................................ 121
Appendix 4- 6: Thematic summary of extraction table land distribution .................................... 121
Appendix 4- 7: Thematic summary of extraction table nation building ...................................... 122
Appendix 5- 1: List of regions, districts and number of wards in the school mapping dataset .... 154
Appendix 5- 2: Correlation matrix ............................................................................................... 156
Appendix 5- 3: Variables and descriptive statistics ..................................................................... 157

6
Chapter 1: Introduction
The importance of ethnic conflict, as a force shaping human affairs, as a phenomenon to be
understood, as a threat to be controlled, can no longer be denied. (Horowitz, 1985; xv)
Ethnic diversity has been widely regarded as an evil. The existence of people with different
ethnic roots, speaking different languages, practicing different religions, or possessing
different physical traits bound to live in one country and in one nation is viewed as
tantamount to the existence of ethnic conflicts. Civil wars along ethnic lines, such as the war
in Kosovo, Sudan’s Darfur conflict, the genocide in Rwanda, aggressions in Northern Ireland,
the conflict between Somalia and Ethiopia, and – unfortunately - many more, seem to support
this claim.
In addition, existence of different ethnic groups in a country has been used to explain
not only civil conflicts but also slow economic growth. Termed by Easterly and Levine
(1997), ethnic diversity is a prominent factor explaining the “growth tragedy” of Africa.
Various aspects of macroeconomic policy making are seen to be impeded by a high number of
ethnic groups. In countries with different ethnic groups, people are seen to be less likely to
cooperate efficiently and to be more prone to fraudulent use of government resources. This is
perceived to lead to increased corruption, less macroeconomic stability and to reduced
economic growth (Alesina and Drazen, 1991; Mauro, 1995; and Easterly and Levine, 1997).
Moreover, various ethnic groups living together in one territory seem to be less likely
to consent on important investments into public goods. Ethnic groups are seen to have
differing preferences for specific types of public goods. These preferences might depend on
the ethnic group’s demographic composition, location of residence or the lingua franca. In
particular, different ethnic groups seem to have difficulties agreeing on investments in local
public goods, such as waste collection, maintenance of roads, sewers, and schools. Note that
education has many characteristics of a public good, as it is to a large extent non-rival and
generates multiple externalities.
The impact of ethnic diversity on education seems particularly relevant given the
multidimensional developmental effects of education. In particular, improving the quality of
education is expected to have substantial effects on labor productivity and on earnings, and
thereby on growth rates (see, e.g. the pioneering study by Mankiw, Romer, and Weil, 1992;
the special consideration of education quality by Hanushek and Kimko, 2000; and for an
overview focussing on developing countries, see Michaelowa, 2000). Furthermore, increasing
mothers’ education is assumed to improve children’s health and reduce fertility rates. This, in

7
turn, is viewed to increase growth rates and to thereby drive development (Cochrane, 1979;
and Glewwe, 1998). Moreover, studies suggest that education plays an important role in
fighting the spread of HIV/Aids (Kelly, 2000). The development effects of education are
particularly strong for primary and lower secondary education. This is also understood by
international organizations and the donor community, who target their policies specifically on
primary education in developing countries. The Millennium Development Goal 2, for
example, targets universal primary education.
While various scholars expect a negative impact of ethnic diversity on education, the
empirical evidence on this link is still ambiguous. Studies assessing the effect of ethnic
diversity on schooling reported both negative and insignificant results. The ambiguity of the
empirical results might be due to the lack of a clear theoretical foundation of the effect of
ethnic diversity. In particular, it is still unclear through which mechanisms ethnic diversity
might affect schooling.
This dissertation, therefore, aims at identifying and assessing three important
mechanisms through which ethnic identity might affect education. In particular, this
dissertation examines whether and how ethnic diversity affects a village’s community
activities (chapter 3 and 5); to what extent it determines clientelistic resource distribution
(chapter 3); and how its effect on education outcomes is influenced by the political salience of
ethnicity (chapter 3 and 4).
The following paragraphs will provide a first overview over the theories underlying
the aforementioned mechanisms and indicate how the mechanisms will be tested in this
dissertation.
Ethnic diversity and a village’s community activities
Ethnic diversity on village level is assumed to impede effective community cooperation. In
particular, studies by Miguel (2004) and Miguel and Gugerty (2005) propose that ethnic
diversity affects the sanctioning ability of local villages. More precisely, the authors argue
that ethnically heterogeneous villages are unable to impose credible sanctions on parents that
do not contribute to the school. In particular, parents that do not belong to the predominant
ethnic group in the village are less likely to be affected by social sanctions. Therefore, if a
village is composed of a large number of different ethnic groups, it is expected to be incapable
of imposing credible sanctions. More homogenous villages, on the contrary, are expected to
exhibit higher trust and lower transaction costs, which helps them to impose sanctions (Fearon

8
and Laitin, 1996; and Alesina and La Ferrara, 2002). Therefore, higher ethnic diversity is seen
to reduce the ability to impose credible sanctions and to thereby lead to substantially lower
funding for schools.
A second aspect of the link between ethnic diversity and village level community
activities might be the role of parents in ethnically homogenous and heterogeneous
communities. Involvement of parents in the school is widely found to have beneficial effects
on children’s learning outcomes (cf. Topping, 1992; Epstein, 1992; and Henderson & Berla,
1996). However, this effect was found to be lower for parents from ethnic minorities. In
addition, parents from ethnically and linguistically diverse neighborhoods seem less likely to
become involved in schools. In particular, Delgado-Gaitan (1991) argues that parents from
ethnic minorities seem more reluctant to participate in their children’s schooling. The author
explains that language barriers and lack of specific cultural knowledge of the schools prevents
parents to become involved.
This dissertation will examine both aspects of the link between ethnic diversity and a
village’s community activities in the education sector. The first aspect will be tested
econometrically in chapter 3. This chapter draws on district level education data from the
Demographic and Health Survey (MEASURE DHS, 2008) in 31 African countries. More
precisely, in a two-level hierarchical model the effect of district level ethnic diversity on
district level enrollment rates in primary and secondary schools will be tested.
The second aspect of community activities, i.e. parental involvement, in ethnically
heterogeneous communities will be examined in chapter 5. More precisely, this chapter
employs the school mapping dataset from Tanzania, which covers over 600 communities and
contains detailed information on various family involvement activities in the schools. From
this dataset specific indicators of parental involvement are coded and the impact of family
involvement on enrollment rates and exam pass rates estimated in a panel model. Besides the
linear impact of family involvement components, chapter 5 tests whether the effect of family
involvement varies in ethnically homogenous and heterogeneous communities and how
parents’ socioeconomic status affects family involvement activities.
Ethnic identity and clientelistic resources distribution
A second mechanism through which ethnic identity can affect schooling might be clientelistic
resource distribution. Anecdotal evidence from developing countries suggests that a
government’s funds might be redistributed to a president’s ethnic clientele. Clientelism is
generally associated with an under-provision of goods to all citizens and an over-provision of

9
goods targeted to specific groups, i.e. the ethnic clientele. Since the clientelism argument has
not yet been applied to the education sector, in chapter 3, specific hypotheses on clientelistic
resource distribution in the education sector are postulated. More precisely, ethnic parties are
expected to distribute funds primarily to their co-ethnics, which lead to an improvement of
education outcomes in the region of co-ethnics.
Moreover, clear empirical evidence is so far missing (cf. Rainer and Franck, 2009;
Kasara, 2007; Miguel and Zaidi, 2003). Therefore, this dissertation strives to fill this gap by
assessing the clientelistic resource distribution in the education sector. In chapter 3
disaggregate data on 31 African countries is used to carry out an econometric analysis of the
impact of clientelistic resource distribution. More precisely, it is tested whether president’s
co-ethnics in a specific region are significantly associated with the level of enrollment rates in
primary and secondary education.
Political salience of ethnicity (politicization)
The last mechanism of the effect of ethnic identity assessed in this dissertation is the role of
political salience of ethnicity, i.e. the politicization of ethnicity. Whether ethnicity influences
education through a village’s community activities or clientelistic resource distribution might
also depend on whether ethnicity is perceived as a politically salient factor in the first place.
In particular, whether ethnicity is viewed as a relevant political factor, might affect
how members of different ethnic groups interact in a local community. If politics are strongly
divided along ethnic identities, then this division might also hamper inter-ethnic cooperation
on the village level. On the contrary, if ethnic membership is not a politically salient factor,
then ethnic diversity in the village will not be perceived as a factor hindering inter-ethnic
cooperation.
Moreover, clientelistic resource distribution is seen to be particularly pronounced in
countries where ethnic identity is politically salient (Chandra, 2004; and Posner, 2005). In
particular, the struggle for state resources is seen to encourage politicians to emphasize ethnic
affiliations to attract voters. Once a party is elected, it is then expected to distribute national
resources to its ethnic members.
This dissertation assesses the relevance of politicization of ethnicity in the following
steps. In chapter 3, the impact of politicization of ethnicity on the effect of ethnic diversity
and on clientelistic resource distribution is analyzed in a cross-country econometric study on
African countries. In particular, in this chapter a new indicator of politicization of ethnicity is
coded and its effect on primary and secondary enrollment rates tested employing a two-level

10
hierarchical model. The empirical results provide interesting and new insights into the role of
political salience of ethnicity in the education sector.
The question, however, remains why ethnic identity is politically salient in one
country and absent from politics in another. Evidence on the causes of the politicization of
ethnicity is scarce and often focuses on a country’s ethnic structure, i.e., the number and size
of ethnic groups (cf. Barkan, 1994; and Posner, 2005). In addition, some evidence exists on
the importance of nation building policies to mitigate the political salience of ethnicity (cf.
Miguel, 2004). Yet, a comprehensive discussion of other relevant explanatory factors of the
politicization of ethnicity and the interrelation between these factors is lacking so far.
Therefore, in chapter 5, evidence from a comparative case study of Kenya and
Tanzania is used to trace various explanatory factors that might have caused the differing
degree of politicization of ethnicity in these two countries. In particular, this chapter employs
a comparative case study approach and uses process tracing to identify underlying causal
paths through which the specific degree of politicization of ethnicity was generated. More
precisely, this chapter traces the evolution of politicization of ethnicity in Kenya and Tanzania
by using detailed historical narratives accompanied with case-specific causal arguments to
contribute to a more general understanding of the causes of politicization of ethnicity. The
chapter particularly focuses on the role of ethnic structure, colonial administrative approach,
land distribution, and nation building policies for the political salience of ethnicity in the two
cases.
This dissertation is organized as follows. In chapter 2, the concept of ethnicity and the
selection of the cases used in this thesis is discussed. Chapter 3 provides an econometric
analysis of 31 African countries assessing the impact of ethnic diversity, clientelistic resource
distribution and politicization of ethnicity on primary and secondary enrollment rates. Chapter
4 presents the comparative case study on the historical factors causing the degree of
politicization of ethnicity in Kenya and Tanzania. Chapter 5, then, focuses on the effect of
ethnic diversity on other village community’s activities by estimating a panel model of
parental involvement in ethnically diverse communities. Last, chapter 6 provides a summary
and conclusion of this dissertation.

11
Chapter 2: The concept of ethnicity and case selection
This dissertation focuses on identifying the relevant mechanisms through which ethnicity
affects schooling. However, the concept of ethnic identity is ambiguous and in particular with
regard to the succeeding econometric analyses, it seems necessary to provide some more
insights into the conceptualization of ethnic identity. Therefore, in section 2.1 a brief
discussion of the concept of ethnic groups will be presented.
In addition, section 2.2 presents arguments for this thesis’ regional focus. While most
theoretical concepts used in this work might be easily transferable to other developing
countries, the author chose to focus specifically on African countries. In particular, their high
number of ethnic groups (see section 2.2.1) and low educational achievements (see section
2.2.2) support the relevance of studying the link between ethnic diversity and education in this
region.
Furthermore, for the analysis in chapter 4 on the explanatory factors of politicization
of ethnicity, the two cases Tanzania and Kenya are compared. Section 2.2.3 briefly reviews
the rational for the selection of these two cases and more detailed information can be derived
from section 4.2 in chapter 4.
2.1 The concept of ethnicity
In a primordialist view, ethnic groups are fixed, and ethnic identity is inherited from the
parents and constant over time. However, more recent research on ethnic groups
acknowledges the malleability of ethnic identity (cf. Schultz, 1984; Widlok, 1996; and Elwert,
2002), the existence of various ethnic dimensions possessed by each individual, and the
impact of social, political and economic factors on perceived ethnic identity (cf. Posner,
2005). Ethnic identity may change over time (as several ethnic groups combine into a larger
tribe), may change when marrying into a family of a different tribe, and when changing the
religion or the profession (from a nomadic pastoralist’s way of life to a settled farmer’s life).
Such a constructivist view on ethnic identity is nowadays widely acknowledged and is,
therefore, applied in this dissertation.
Referring to the constructivist view on ethnic identity, it seems difficult to establish
clear rules on which are the ethnic groups in a country. Fearon (2003) proposes seven features
of a typical ethnic group. These features are depicted in Table 1 and comprise shared descent,
culture, settlement and history.

12
However, most databases containing information on ethnic identities in the world
employ more simple identification strategies. For example, Gurr’s (1996) dataset lists
minority ethnic groups at risk and Alesina et. al (2003) attempt to separate ethnic, linguistic
and religious groups. The most widely used collection of ethnic groups in the world comes
from the Atlas Naradov Mira compiled by Soviet ethnographers in the 1960s. This database
includes information on ethnic groups mainly using language as the identifier of ethnic
identity.
Table 1: Features of prototypical ethnic groups
1. Membership in the group is reckoned primarly by descent by both members and
nonmembers.
2. Members are conscious of group membership and view it as normatively and
psychologically important to them.
3. Members share some distinguishing cultural features, such as common language,
religion or customs.
4. These cultural features are held to be valuable by a large majority of members in the
group.
5. The group has a homeland, or at least “remembers” one.
6. The group has a shared and collectively represented history as a group. Further, this
history is not wholly manufactured, but has some basis in fact.
7. The group is potentially “stand alone” in a conceptual sense – that is, it is not a caste
or caste-like group (e.g. European nobility or commoners).
Source: Fearon (2003; 201)
While language seems to be a good proxy for ethnic identity, in few cases problems emerge
when groups are divided along other characteristics. One example is Rwanda, which contains
only one ethnic group in the Atlas Naradov Mira, the Banyaruanda. Based on language alone,
this dataset was not able to distinguish between the Tutsi and Hutu, which proved to be
clearly distinct ethnic groups in the 1994 genocide in Rwanda.
However, an advantage of the Atlas’ data is that this dataset contains information on
ethnic identities on the regional or district level. The other datasets described above only
provide information on ethnic groups at the national level. The disaggregation of the ethnic
group data is particularly relevant for this dissertation, since an econometric analysis is
carried out estimating the impact of ethnic diversity on district level on education (see chapter
13
3). Therefore, this dissertation, uses the data from the Atlas Naradov Mira, and corroborates
the information with other available coding of ethnic identities (see section 3.3). Moreover,
for the analysis in chapter 5, more detailed information on ethnic groups on the community
level is drawn from the census data in Tanzania and used for the econometric analysis (see
section 5.3.)
2.2 Case selection
2.2.1 Ethnic diversity in Africa
Assessing the impact of ethnic diversity on education is particularly relevant for countries that
are characterized by high numbers of ethnic groups. As indicated in section 2.1, the number of
ethnic groups might change slightly depending on the identification strategy used. Following
Fearon (2003; 204), who coded ethnic groups according to the features listed in Table 1 and
only counted ethnic groups whose population share exceeds 1 percent, 822 ethnic groups in
160 countries are identified. Table 2 depicts the descriptive statistics of Fearon’s (2003)
dataset.
As can be seen in Table 2, on average a country in the world is inhabited by 5.14
ethnic groups. Sub-Saharan African countries (SSA), however, have on average 8.16 ethnic
groups and are, therefore, inhabited by substantially more ethnic groups than the other
regions. In addition, while in all countries except Sub-Saharan African countries, the largest
ethnic group constitutes a majority and is well above 60 percent, the average population share
of the largest ethnic group in SSA countries numbers 41 percent. Moreover, as Fearon (2003;
205) demonstrates, African countries constitute only 25 percent of the World’s population but
are inhabited by more than 43 percent of the total number of ethnic groups.
The prominence of ethnic diversity in Sub-Saharan African countries is also supported when
comparing the ethnic diversity of different countries using the ethno-linguistic
fractionalization measure. This indicator measures the probability that two randomly drawn
individuals in the same district are members of different ethnic groups and is widely used to
measure a country’s level of ethnic diversity (see Appendix 3-7, ii). Calculating the ethno-
linguistic fractionalization measure for all 160 countries in Fearon’s dataset and comparing
the degree of fractionalization across countries demonstrates that African countries are by far
the most heterogeneous countries in the world.

14
Table 2: Distribution of ethnic groups in the World
World Westa
Sub-Saharan Africa
b
Asia Latin America & Caribbean
North Africa & Middle East
Ethnic groups per country
5.14 3.24 8.16 4.7 3.65 3.68
Sd 3.51 2.1 4.45 3.28 1.03 1.95 Max. number of ethnic groups
22 9 22 13 6 9
Average population share of largest ethnic group
0.65 0.85 0.41 0.72 0.69 0.68
Percentage of countries with an ethnic group > 50 % of population
71 % 100% 28% 78% 78% 84%
Percentage of countries with an ethnic group > 90 % of population
21% 62% 2% 22% 17% 21%
Source: Fearon (2003; 204) a: including Australia, New Zealand, and Japan. b: Papua New Guinea is coded as having no ethnic groups larger than 1 percent of the population. Sd denotes standard deviation Note that only groups with population shares larger than 1 percent are included in this table. For the complete list of countries in the regional categories, see Appendix 2-1.
Table 3: Countries with highest and lowest ethnic diversity
Countries with the highest
ethnic diversity
ELF Countries with the lowest
ethnic diversity
ELF
Tanzania 0.953 North Korea 0.002
Democratic Republic of Congo 0.933 South Korea 0.004
Uganda 0.93 Japan 0.012
Liberia 0.899 Tunisia 0.039
Cameroon 0.887 Italy 0.04
Togo 0.883 Portugal 0.04
South Africa 0.88 Poland 0.047
Congo 0.878 Greece 0.059
Madagascar 0.861 Netherlands 0.077
Gabon 0.857 Yemen 0.078
Kenya 0.852 Haiti 0.095
Ghana 0.846 Albania 0.097
Malawi 0.829 Norway 0.098
Guinea Bissau 0.818 Australia 0.126
Somalia 0.812 Denmark 0.128
Source: Fearon (2003; 215-219) ELF: ethno-linguistic fractionalization score Note that Papua New Guinea has an ethno-linguistic fractionalization of 1, but no ethnic group exceeds the threshold of 1 percent of the population. Therefore, it is not included in the table.

15
Table 3 depicts the 15 most and the 15 least ethnically diverse countries and their respective
fractionalization score. While the 15 least fractionalized countries are distributed around the
world (except Africa), the 15 most ethnically diverse countries are all found in Sub-Saharan
Africa.
The evidence presented above demonstrates that Africa exhibits an exceptionally high level of
ethnic diversity. This provides support for the necessity to understand the relevance of ethnic
diversity on education in this particular region. If ethnic diversity is indeed adverse for
educational outcomes, the effect is expected to be highest in this particular region of the
world.
2.2.2 Education in Africa
A second argument for this dissertation’s focus on Africa besides the high ethnic diversity in
this region, is the region’s low schooling levels. Table 4 depicts various indicators of
education systems in five regions in the world. First, information on the level of overall
education spending in the respective region is presented. Then, the level of enrollment rates,
completion rates, repetition rates, and the ratio of pupils to teachers are depicted for primary
schooling. Last, enrollment rates and the pupil-teacher ratio are presented for secondary
schooling.
As can be seen in Table 4, row 2, Sub-Saharan Africa’s overall education expenditure
(in percent of GNI) is statistically different from Western countries’ level of spending but
similar to Asia’s and Latin America & Caribbean’s education spending. However, the
comparable education expenditure level in Sub-Saharan Africa to countries in these regions
seems to translate into statistically worse educational outcomes. In particular, primary
enrollment rates are statistically significant and substantially lower than in any other region.
Besides the substantially lower enrollment rates, Sub-Saharan Africa seems to exhibit
particularly poor education quality. Primary completion rates in Africa differ significantly
from those in any other region. In addition, the ratio of primary pupils to teachers is
significantly higher than in the other regions.
For secondary schooling, a similar picture emerges. Secondary enrollment rates in
Sub-Saharan Africa are significantly lower than in any other region. The pupil to teacher ratio
in secondary schools, however, seems comparable to other regions.

16
Combining the information from the discussion on the ethnic diversity in section 2.2.1 and
from the description of the education systems in section 2.2.2, Sub-Saharan Africa emerges as
a region with exceptionally high levels of ethnic diversity and with comparably low levels of
educational achievement. Due to these two prominent characteristics, Sub-Saharan African
countries seem an adequate study area for the link between ethnic diversity and education.
Results from this dissertation might be able to explain some aspects of the low educational
achievements and shed more light on the impact of ethnic diversity on education in Africa and
other regions. Given Africa’s high level of ethnic diversity, results from this dissertation are
particularly relevant for these countries.
Table 4: Indicators of education systems in the world
West Sub-Saharan
Africa
Asia Latin America
& Caribbean
North Africa &
Middle East
Education
expenditure
(% of GNI)
5.17 [4.58 - 5.76]
3.45 [2.90 - 4.00]
2.99 [2.08 - 3.89]
3.88 [3.22 - 4.55]
4.80 [3.83 - 5.77]
Primary net
enrollment
(%)
97.89 [96.71 - 99.08]
60.04 [53.51 - 66.57]
85.60 [78.35 - 92.84]
90.78 [87.38 - 94.18]
86.00 [80.63 - 91.38]
Primary
completion
rate (%)
98.94 [96.81 - 101.07]
45.77 [35.71 - 55.83]
79.56 [68.57 - 90.55]
91.88 [85.90 - 97.87]
82.30 [73.04 - 91.55]
Primary
repetition
rate (% of
enrollment)
1.26 [.10 - 2.42]
18.48 [15.21 - 21.76]
8.11 [1.13 - 15.09]
6.95 [4.61 - 9.30]
7.67 [5.05 - 10.29]
Primary
pupil-
teacher ratio
15.41 [13.65 - 17.17]
45.23 [41.32 - 49.14]
34.53 [28.43 - 40.64]
26.26 [23.26 - 29.27]
21.31 [18.20 - 24.42]
Secondary
net
enrollment
(%)
89.92 [87.12 - 92.73]
25.72 [18.28 - 33.16]
54.02 [39.27 - 68.76]
56.83 [47.98 - 65.67]
60.72 [45.05 - 76.38]
Secondary
pupil-
teacher ratio
12.66 [11.10 - 14.22]
24.57 [20.47 - 28.67]
24.83 [20.58 - 29.07]
18.84 [15.84 - 21.85]
17.25 [13.91 - 20.60]
Note: Values denote the mean estimates and 95% confidence intervals are reported in parentheses. Source: World Bank, 2008, for the year 2000. For the complete list of countries in the regional categories, see Appendix 2-1.
2.2.3 The cases Kenya and Tanzania
Within the regional selection of this dissertation, the two cases Kenya and Tanzania are
selected to assess the causal factors leading to the politicization of ethnicity in chapter 4. In

17
particular, this chapter uses a comparative case study approach and relies on Przeworski and
Teune’s (1982) “most similar design”. Kenya and Tanzania are selected as two cases with
similar characteristics on the independent variable but different values for the dependent
variables. More precisely, both countries are former British colonies, became independent in
the 1960s, formed single-party independence governments and transformed to multiparty
systems in mid 1990s. In addition, the two countries are both presidential republics with
proportional vote, and have a similar geography (see Graph 1).
Most importantly for this dissertation, these two countries differ strikingly on the
dependent variable of the analysis, namely the politicization of ethnicity. While Kenyan
politics is strongly divided along ethnic lines, ethnicity seems invisible in Tanzanian politics.
For a detailed discussion on the differing degree of politicization of ethnicity in Kenya and
Tanzania, see chapter 4, section 4.2.
Graph 1: Map of Kenya and Tanzania
Source: Kenya Tanzania Travel Guide (2010)

18
Appendix 2-1
Appendix 2- 1: List of countries included in Table 2 and 4
Westa
Sub-
Saharan
Africa
Asia Latin
America &
Caribbean
North
Africa &
Middle
East
Australia Angola Afghanistan Argentina Algeria
Austria Benin Bangladesh Bolivia Bahrain
Belgium Botswana Bhutan Brazil Cyprus
Canada Burkina Faso Burma Chile Egypt
Denmark Burundi China Colombia Iran
Finland Cameroon Fiji Costa Rica Iraq
France
Central African Republic India Cuba Israel
Germanya Chad Indonesia Dominican Republic Jordan
Greece Congo Laos Ecuador Kuwait
Ireland
Democratic Republic of Congo Malaysia El Salvador Lebanon
Italy Djibouti Mongolia Guatemala Libya
Japan Eritrea Nepal Guyana Morocco
Netherlands Ethiopia North Korea Haiti Oman
New Zealand Gabon Pakistan Honduras
Saudi Arabia
Norway Gambia Papua New Guinea Jamaica Syria
Portugal Ghana Philippines Mexico Tunisia
Spain Guinea Singapore Nicaragua Turkey
Sweden Guinea Bissau
South Korea Panama
United Arab Emirates’
Switzerland Ivory Cost Sri Lanka Paraguay Yemen

19
UK Kenya Taiwan Peru
USA Lesotho Thailand Trinidad and Tobago
Liberia Vietnam Uruguay
Madagascar Venezuela
Malawi
Mali
Mauritius
Mozambique
Namibia
Niger
Nigeria
Rwanda
Senegal
Sierra Leone
Somalia
South Africa
Sudan
Swaziland
Tanzania
Togo
Uganda
Zambia
Zimbabwe
a: Fearon (2003) included the German Federal Republic.

20
Chapter 3: The impact of ethnicity on education in Africa
3.1 Introduction
The role of ethnicity in the development process is still poorly understood. Ever since the
work by Horowitz (1985), researchers tried to disentangle the various dimensions of ethnicity
and its impact on numerous aspects of a country’s development. Generally, ethnically diverse
countries seem to bear a particularly high burden in the development process. Ethnically
diverse countries exhibit lower macroeconomic stability (Alesina and Drazen, 1991), lower
growth rates (Easterly and Levine, 1997), and increased corruption (Mauro, 1995). Moreover,
evidence suggests that ethnicity might also hamper the provision of public goods, such as
education.
However, evidence on the impact of ethnicity on education derived from cross-country
studies is, so far, rather ambiguous (Easterly and Levine, 1997; Alesina, Baqir, and Easterly,
1999; Goldin and Katz, 1999; Easterly, 2001; Keefer, 2005; and Habyarimana et al., 2007).
Therefore, recent research started to examine the underlying mechanisms of the effect of
ethnicity.
While some authors tried to explain the effect of ethnic diversity by different
preferences of ethnic groups (Easterly and Levine, 1997; and Alesina, Baqir, and Easterly,
1999), recent research rejects a significant impact of ethnic preferences on education
(Habyarimana et al., 2007).
More convincing arguments on the underlying mechanisms of the impact of ethnicity
are provided by Miguel (2004) and Miguel and Gugerty (2005). These scholars researched
local communities in Kenya and Tanzania and emphasized the sanctioning ability of
ethnically homogenous villages. The sanctioning theory posits that ethnically diverse villages
are unable to sanction parents that do not contribute to village funding of local schools. This
leads to an under-provision of education in heterogeneous villages.
Other strands of the literature, which focus on clientelistic distribution of government
funds, have been, so far, neglected when explaining the impact of ethnicity on education.
Although the clientelism argument has not yet been applied to the effect of ethnicity in the
education sector, it provides valid explanations for government distribution patterns. More
precisely, the clientelism theory posits that ethnic parties distribute funds primarily to their co-
ethnics, which leads to an improvement of education outcomes in the region of co-ethnics.
Clear empirical evidence, however, still lacks (e.g. Rainer and Franck, 2009; Kasara, 2007;
Miguel and Zaidi, 2003).

21
Related to both, the sanctioning and the clientelism theory, is the theory of
politicization of ethnicity. This theory has, however, been formerly neglected in the
discussion. Whether ethnicity influences education through village diversity (sanctioning
theory) or distribution of government funds (clientelism theory) might also depend on whether
ethnicity is perceived as a politically relevant factor in the first place. Insights into the
mechanism of ethnic parties are provided by Posner (2005) and Chandra (2004). The theory of
politicization, hence, posits that the impact of ethnicity on education (via village sanctioning
and clientelistic distribution of state funds) depends critically on the political relevance of
ethnicity.
This chapter contributes to the literature by combining the hitherto distinct theories of
sanctioning and clientelistism and attempting to formulate a theory of politicization of
ethnicity. The theories are tested with a novel dataset and newly coded ethnic indicators. Data
on primary and secondary education on district level for 31 African countries is combined
with specific indicators of ethnic groups designed to test the distinct theories of ethnicity. In
addition, due care is paid to possible interactions between the ethnic indicators, as well as to
influences of institutional and economic factors on the impact of ethnicity. The dataset is
analyzed estimating a two-level hierarchical model.
Following this introduction, section 3.2 reviews the theories explaining the impact of ethnicity
on education and derives relevant hypotheses. The data and variables used for the
econometric analysis are briefly discussed in section 3.3 with detailed coding rules provided
in Appendices 3-7 – 3-10. Section 3.4 presents the econometric results for primary enrollment
(3.4.1) and secondary enrollment (3.4.2). Section 3.5 discusses the results and section 3.6
concludes.
3.2 How does ethnicity affect education?
The question arises, how and to which extent do the existing ethnic groups1 influence a
country’s educational outcomes. Empirical evidence has so far produced only a vague picture
of the impact of ethnicity on education. Studies conducted on the impact of national ethnic
diversity on primary and secondary education in the U.S. and Africa, mainly negative effects
of ethnicity (Easterly and Levine, 1997; Alesina, Baqir, and Easterly, 1999; Goldin and Katz,
1 In this dissertation, all social cleavages, such as race, tribe, language, and religion are subsumed in the term "ethnic group" and ethnic identity is assumed to be socially and politically constructed (see section 2.1).

22
1999; and Habyarimana, Humphreys, Posner, and Weinstein, 2007), but also insignificant
effects (Keefer, 2005), as well as effects depending on the quality of a country’s institutions
(Easterly, 2001).2
This empirical ambiguity might be due to the following problems. First, the
aforementioned studies focus on the national level ethnic diversity measured by the so-called
ethno-linguistic fractionalization (ELF) (see Appendix 3-6). In particular, by using the ELF,
the studies are not able to account for the different channels through which ethnicity may
influence education and which operate on different levels (country and district). The second
drawback is the neglect of the studies to include an indicator of the political relevance of
ethnicity, i.e. the politicization, in their regressions.
The following paragraphs, therefore, discuss the different mechanisms through which
ethnicity influences education and derives hypotheses. From the extensive literature on
ethnicity, one can identify three major theories explaining why ethnic groups might influence
education. The first theory is placed at the community level, where village funding for
schooling depends on the ability of communities to sanction non-contributors. The second
theory is based on the clientelism argument, which posits that politicians distribute funds to
their co-ethnics. Third, effects of ethnicity on education might be influenced by the role of
ethnicity in the political process. The following paragraphs outline the three effects and
present the hypotheses.3
The sanctioning effect
The first theory explaining the impact of ethnicity on education posits that ethnically diverse
villages exhibit lower school funding because they are unable to sanction non-contributors. A
number of researchers provide evidence from the U.S. on a significant negative impact of 2 Easterly and Levine (1997) estimated econometrically the effect of ethno-linguistic fractionalization on various economic and political indicators and schooling of African countries, using pooled data of the decades 1960s, 1970s, and 1980s. Alesina, Baqir, and Easterly (1999) present a theoretical model on and tested empirically the impact of ethno-linguistic fractionalization on spending on education, roads, sewers and trash pickup in U.S. cities in 1994. Goldin and Katz (1999) estimated econometrically the impact of being “Native born” (versus “foreign born”) on secondary school attendance using census data from Iowa from 1910-1930. Habyarimana et al. (2007) conducted a series of games using a random sample of 300 inhabitants of a slum in Kampala, Uganda, and thereby tested a preferences, technology and strategy selection mechanism, through which ethnic diversity might affect public good provision. Keefer (2005) assessed econometrically the impact of ethno-linguistic fractionalization on the quality of democracy and policy performance in young democracies during 1975-2000. Easterly (2001) used the dataset of Easterly and Levine (1997; cited above) and estimated the effect of ethno-linguistic fractionalization dependent on institutional quality (by including an interaction term of ethno-linguistic fractionalization with institutional quality) on various economic and political indicators and schooling. 3 Note that several authors raise the issue of different preferences of ethnic groups (Easterly and Levine, 1997; and Alesina, Baqir, and Easterly, 1999). However, more recent research rejects a significant impact of preferences on education (Habyarimana, Humphreys, Posner, and Weinstein, 2007).

23
ethnic diversity on participation in groups (Alesina and La Ferrara, 2002), on local public
goods (Vigdor, 2004), and on education spending (Cutler, Elmendorf, and Zeckhauser, 1993;
and Poterba, 1997). The most compelling argument for the impact of ethnic diversity on the
local level in developing countries is provided by Miguel and Gugerty (2005). They examine
the interethnic cooperation in the education sector of Kenyan villages. More precisely, Miguel
and Gugerty first derive a theoretical model on social sanctions in diverse communities and
then test this model econometrically using individual level data from two districts in Kenya.
In particular, the authors estimate the impact of ethno-linguistic fractionalization of the
primary school population on total primary school funds per pupil employing OLS and IV
regression models.
In the villages in Kenya, primary schooling is financed through contributions made by
the parents. Miguel and Gugerty argue that if parents do not contribute, they can be
sanctioned. Common sanctions are the exclusion from the village and, therefore, exclusion
from networks that provide social insurance. Social insurance provided by the village is
especially important in countries with otherwise weak infrastructure and poor public
insurance systems as found in Africa. Miguel and Gugerty (2005) argue that villages, being
composed of only a few different ethnic groups, are able to impose sanctions on parents that
do not contribute to the school. However, parents not being members of the predominant
ethnic group in the village are less likely to be affected by such sanctions. Therefore, villages
that are composed of a large variety of ethnic groups are unable to impose credible sanctions.4
On the contrary, more homogenous villages exhibit higher trust and lower transactions costs,
which helps them to impose sanctions (Fearon and Laitin, 1996; and Alesina and La Ferrara,
2002). According to Miguel and Gugerty (2005), lower sanctions in diverse villages, then,
translate into lower contributions for primary education. Consequently, the authors expect
villages with more homogenous ethnic composition to have higher funding for primary
schools.
As discussed in section 3.3, comparative cross-country data on education spending by
households is, however, not readily available. This chapter, therefore, relies on educational
outcomes, i.e. enrollment rates, to proxy education spending (see discussion in section 3.3).
Moreover, to directly test the sanctioning mechanism proposed by Miguel and Gugerty, one
would need comparable information on village level sanctioning activities. Since this
information is not available, this chapter indirectly tests the sanctioning mechanism through
studying the relation between ethnic diversity and educational outcomes. An insignificant or
4 A similar argument is made by Kimenyi (2006).

24
negative significant effect of ethnic diversity on educational outcomes would then reject the
validity of the sanctioning theory. Therefore, the following hypothesis is posited:
H1: Higher ethnic diversity is associated with lower education outcomes.
The clientelism effect
The second theory explaining the impact of ethnicity on education is based on the clientelism
argument. Clientelism is generally associated with an under-provision of goods to all citizens
and an over-provision of goods targeted to specific groups. 5 In the education sector,
politicians are expected to distribute state resources for education primarily to their specific
clientele, which are often their co-ethnics. Since state resource distribution is primarily
determined by the incumbent president, her co-ethnics are the likely beneficiaries. Therefore,
one could posit the following hypothesis:
H2: President’s co-ethnics are associated with higher education outcomes.
The majority of research supports the clientelism theory (Rainer and Franck, 2009; Miguel
and Zaidi, 2003; Collier and Garg, 1999; and Barkan and Chege, 1989). However, Kasara’s
(2007) study provides an interesting example of president’s co-ethnics being negatively
affected by substantially higher taxation than members of other ethnic groups. The empirical
ambiguity might be explained by the neglect of the aforementioned studies to account for the
role of ethnicity in politics, i.e. the politicization.
The effect of politicization and institutions
Although some clientelistic behavior might be found in all developing countries, Posner
(2005) and Chandra (2004) argue that clientelistic behavior might be particularly pronounced
in countries with ethnically diverse populations and parties based on ethnicity. They argue
that the struggle for state resources encourages politicians to emphasize ethnic affiliations to
attract voters. Emphasizing the ethnic identity seems necessary, since voters have only limited
information on how politicians distribute state funds. Voters expect that politicians distribute
funds primarily to their own ethnic group. As a consequence, citizens vote for the politician
5 For an overview over different types of clientelism and definitions, see Clapham (1982) and Lemarchand (1972).

25
belonging to their ethnic group.6 Once a party is elected, it is, then, expected to distribute
national resources to their ethnic members. If political parties in a country are, however, not
based on ethnic identity, then politicians are viewed to distribute state resources more evenly.
Hence, the impact of ethnicity on education via clientelistic distribution might depend
critically on the relevance of ethnicity in politics:
H3: The clientelism effect is more pronounced in countries with politicized ethnicity.
In addition, the relevance of ethnicity in politics might also influence the sanctioning ability
of villages. Whether ethnicity is perceived as a relevant political factor and a driving force in
dividing voters, might also affect how members of different ethnic groups interact in a local
community. If voters are strongly divided by ethnic identity, then this division might also
hamper inter-ethnic cooperation on the village level. On the contrary, if citizens do not vote
according to their ethnic membership, then ethnic diversity in the village will not be perceived
as a factor hindering inter-ethnic cooperation. Hence, in environments with non-politicized
ethnicity, even very diverse villages might not suffer from the inability of sanctioning non-
contributing parents (as predicted by H1).
Empirical evidence supports the relationship between the sanctioning theory and politicized
ethnicity. A comparison of the sanctioning mechanism in Kenya and Tanzania reveals
significant variation of the effect of ethnic diversity on village funding (Miguel, 2004). While
the effect was found to be strong and significant in Kenya, it was insignificant in Tanzania.
Differences in the effect of ethnicity were attributed to different nation building policies
pursued by the two countries. Miguel (2004) argues that while Tanzanian politicians
emphasized unity, Kenyan politics was strongly divided by ethnic identities. One could
therefore argue that the negative sanctioning effect in Kenya and the insignificant effect in
Tanzania are caused by the politicization and the non-politicization of ethnicity in the two
countries. From this one could posit the following hypothesis:
H4: The sanctioning effect is more pronounced in countries with politicized ethnicity.
Closely linked to the role of the political relevance of ethnicity is the role of institutional
quality. Easterly (2001) showed that the negative effect of national level ethnic diversity
6 A similar argument was made by Wantchekon (2003).

26
might be mitigated by good institutional quality. Although this interaction was established
using a national level ethnic indicator, hence neglecting the underlying mechanisms, it
provides some evidence for the relevance of institutional quality. The assumed negative
impact of ethnic parties on a country’s education outcomes might be negated by sound
institutions. Moreover, stable institutions might provide a favorable environment for village
funding, independent of a village’s diversity and for an even distribution of government
funds. Hence, institutional quality might also directly affect the impact of village sanctioning
and clientelistism in the education sector:
H5a,b: High institutional quality leads to a diminished sanctioning (H5a) and
clientelism effect (H5b).
3.3 Data and variable selection
Assessing the impact of ethnicity on education is particularly important for a country
exhibiting very diverse populations. As demonstrated in section 2.2.1, almost all countries
with high numbers of ethnic groups are found in Africa. In addition, this region is still the
least developed part of the world and in dire need of improving educational outcomes (see
section 2.2.2). This chapter will, therefore, focus on the impact of ethnicity on education in
Africa and test the posited theories by using data for African countries.
Dependent variable
Disaggregated data on district level educational outcomes for 31 African countries can be
drawn from the Demographic and Health Survey (DHS) (MEASURE DHS, 2008). Data on
school enrollment for household members between 6-10 years and 11-15 years is used from
the part “Household characteristics” of the DHS survey. According to Gardner (1998), the
official school age for primary education in the DHS surveys range from 6 to at least 10 years
and hence enrollment for children aged 6-10 is used to capture the primary enrollment rate
(primary enrollment). While pupils aged 10-15 years might also be still attending primary
school, the majority is expected to have transited to secondary schools. Therefore, enrollment
of pupils aged 10-15 is used to capture effects on secondary enrollment.
As indicated in section 3.2, the theoretical arguments on the sanctioning theory by
Miguel and Gugerty (2005) are based on education spending (by villages and the state), rather
than education outcomes. However, due to lack of comparable and disaggregated data on

27
education expenditure education outcomes are used to proxy education spending. Using
enrollment rates to proxy education expenditure might only be problematic if enrollment is
close to 100 percent, since then expenditure is likely to increase the quality and not the
quantity of education (UNESCO, 2004; 193). However, in the dataset less than 7 percent of
the observations exhibit enrollment rates greater than 90 percent and, hence, enrollment rates
seem to be a reasonable proxy for education expenditure.
School enrollment data is available at the district level with an average of 7 districts
per country.7 DHS have been carried out in different time periods (the earliest surveys dating
from 1991, Cameroon, and the most recent from 2006, Niger), and for several countries more
than one DHS has been carried out. To use all available information, all surveys of African
countries are included in this analysis (refer to Appendix 3-9, for a complete overview over
countries and years).15
Explanatory variables
To test the diversity, clientelism and politicization effect, three distinct measures of ethnicity
are coded. A detailed description of the rules for coding can be found in Appendices 3-7 – 3-
10.
Ethnic diversity
The diversity variable measures ethnic diversity of districts and is used to test the sanctioning
theory. Ethnic diversity of districts is calculated employing the widely used ethno-linguistic
fractionalization (ELF) index, which measures the probability that two randomly drawn
individuals are from distinct ethnic groups. One major advantage of the ELF is its
comparability with existing research. In addition, Vigdor (2002) derived a model on
participation in heterogeneous communities and confirms the use of the fractionalization
indicator for the study of community participation and public goods. The underlying
assumption of the fractionalization index is a linear relationship between ethnic diversity and
the dependent variable. Alternative measures of ethnic diversity, such as the polarization
index, however, have more complex functions. In particular, the polarization index reports a
maximum for two equally strong ethnic groups. In addition, note that conflict is seen to be
closely related to a bimodal distribution of ethnic groups in the population (cf. Esteban &
Ray, 1999). Therefore, polarization indices are viewed to be particularly suitable to capture
7 According to Rabe-Hesketh and Skrondal (2008, 62), the number of clusters (61 countries) and size (average 7 districts) of the underlying dataset are sufficient to estimate country- and district level variations including random slopes (as presented in section 5).

28
the generation of civil conflicts and wars and are rarely used when assessing the impact of
ethnic diversity on public good provision (Garcia-Montalvo & Reynal-Querol, 2002; 6).
Moreover, polarization indices are difficult to implement without making some arbitrary
choice of parameters (cf. Esteban & Ray, 1994). Hence, for the study of the effects of ethnic
diversity on public goods, this chapter relies on the use of the fractionalization index.
According to the sanctioning theory discussed in section 3.2, ethnic diversity should
combine information on the number and size of ethnic groups in a village. Unfortunately,
information on ethnic diversity is not readily available for villages and, hence, will be proxied
in this chapter by ethnic diversity on the district level. This needs to be kept in mind when
proceeding with the estimation, since it might create a measurement error. In particular, it
might be possible that ethnic diversity on district level is fairly high, i.e. that there are many
different ethnic groups in the district, but that these ethnic groups live clustered in ethnically
homogenous villages. Therefore, village level ethnic diversity would be very low even though
district level ethnic diversity would be high.
Information on existing ethnic groups and their location on the district level are drawn
from Cunningham and Weidmann (2008), and Cederman, Rød, and Weidmann (2007).
Districts from Cunningham and Weidmann (2008) are carefully matched with the differing
DHS districts (see Appendix 3-6). The variable diversity ranges from 0 (complete
homogeneity) to 0.99 (maximum heterogeneity).
Presidents’ co-ethnics
The co-ethnics variable measures the district population shares of presidents’ co-ethnics and
is used to test the clientelism theory. Politics and especially state resource distribution in
Africa are viewed to be primarily shaped by incumbent presidents (e.g. Kasara, 2007).
Therefore, the ethnic group of the incumbent president is the one assumed to benefit primarily
from state resource reallocation.8 Ethnic identity of the incumbent president is coded as the
identity that is politically relevant. Information on presidents’ ethnic identity is drawn from
Fearon, Kasara, and Laitin (2007) and district population shares of the presidents’ co-ethnics
are obtained from Cunningham and Weidmann (2008). The co-ethnics indicator is a
continuous variable and shares of co-ethnics range from zero to 100 percent of district
population shares (see Appendix 3-7 and 3-8).
8 In few cases the incumbent president cannot be considered as the politician governing state affairs. Following Kasara (2007), in those cases information on the effective leader was drawn from Goemans, Gleditsch, and Chiozza (2008).

29
Politicization of ethnicity
The politicization variable measures the political relevance of ethnicity and is used to test the
theory of politicization. Referring to Fearon (2006), the political relevance of ethnicity can be
measured by the degree to which political parties are formed along ethnic identity in contrast
to parties being based on ideologies. Hence, the politicization indicator measures whether the
majority of political parties (including the ruling parties) are based on ethnic identity rather
than ideology or programs.
So far, no readily available indicator of the politicization of ethnicity or the ethnic base
of parties exists. Therefore, in this chapter a new indicator specifically designed to capture the
degree of the ethnic support base of parties is coded for this chapter. In particular, information
on the formation base of parties is drawn from the section “Political Participation” in the
Polity IV Country Reports by Marshall and Jaggers (2008a-c) for the respective countries.
The information from Polity IV was used to code the politicization variable with outcome
values zero, one and two (see Appendix 3-9). The value zero denotes that parties are entirely
based on ideologies or programs. The value one denotes that voting for certain parties and a
party’s campaigning might evolve around ethnic identity. The value two denotes that there
exists an ethnic party which is supported by distinct ethnic groups and which includes ethnic
identity in its campaigning. As an example, for Kenya in 1998, the Kenya African National
Union (KANU) is coded as an ethnic party due to its “extremely narrow constituency bases”9
as well as its “ethnically based patronage rule”12. In comparison, Benin in 1996 is coded as
exhibiting moderately ethnic parties due to existence of a clear ”regional foundation”10 of
political parties but lack of specific ethnic support bases. Almost 50 per cent of the countries
studied do not exhibit characteristics of ethnic parties and are, therefore, coded as exhibiting
programmatic parties (politicization=zero).
Control variables
To ensure that the observed significant relationships between the various ethnic indicators and
education are not caused by other countries’ characteristics, variables on countries’
institutional and economic background, as well as countries’ education system characteristics,
presidents’ incumbency, and time dummies are included in the regression. In addition, some
unobserved district heterogeneity (such as urban and rural districts, population size, and
average literacy level of parents) and country level heterogeneity is assumed to be captured by
introducing random error terms at the district and country level in the regression (see section
9 Marshall and Jaggers, 2008a, Polity IV Country Report 2003, Kenya 10 Marshall and Jaggers, 2008a, Polity IV Country Report 2003, Benin

30
3.4, equations 5 and 6). The consistency of the random error models is confirmed by the
results of the fixed effects estimation depicted in Table 5, column 3 and 5.
A country’s institutional quality is proxied using data from the Freedom House index, which
measures political rights and civil liberties (Freedom House, 2008). This index is denoted as
institutions and was re-coded into the range of -2.25 to 2.75 with positive values denoting
strong institutions and negative values weak institutional quality.
Countries’ income (income) is particularly relevant for educational outcomes, with
richer countries having more resources to distribute in the education sector. To capture
variation on the district level within countries, income is approximated using the percentage
of households in the district that use “piped water” as their primary source of drinking water
(MEASURE DHS, 2008). This approach also takes into account that general GDP levels
might be reversely caused by education as education is related to increased productivity and
wages. In contrast, access to water is mainly determined by state- and district infrastructure
spending and hence will be considered as exogenous. The aggregated piped water indicator on
country level is highly correlated (0.73) with GDP (drawn from the World Development
Indicator database, World Bank, 2008).11 Hence, access to piped water can be seen as an
instrument for GDP and will be estimated in a reduced form equation.
In addition, a count variable of the years the incumbent president held power
(president’s incumbency) is included in the estimation since the effect of presidents’ co-
ethnics might depend on the lengths of her incumbency.
Following Michaelowa and Weber (2007), general characteristics of countries’
education systems, such as national education expenditure12, institutional quality, the share of
the school-aged population, pupil-teacher ratio, are considered to influence education
outcomes. Education expenditure, measured as current education expenditure in percent of
GNI (education expenditure), is included in the estimation to control for the overall level of
funds allocated to education. In addition, the share of school-age children (children) is used
to account for the demand for schooling and includes children aged 0-14 years as a percentage
of overall population. Furthermore, the pupil-teacher ratio in primary schools (pupil-teacher
ratio) is included in the estimation of primary enrollment rates. Information on education
11 The corresponding regression coefficient is highly significant at the 1 percent level and the R-square is 0.53 (not shown). 12 Note that from the theoretical part, ethnicity is expected to affect education spending on the national level not by changing the absolute amount of money spent on education but by altering the distribution of funds over country’ districts. Hence, including a measure for national education expenditure will not bias estimations of the clientelism effect.

31
expenditure; number of children and pupil-teacher ratios are available from the World
Development Indicator (WDI) database (World Bank, 2006).13
Furthermore education outcomes might increase slowly over time. Therefore,
dummies for three different five-year periods are included allowing for a general time trend
over these periods. Dummy variables for the period 1990-1994 (1990), 1995-1999 (1995), and
2000-2006 (2000) are created and 1995 and 2000 are included in the estimation.14
3.4 Econometric results
The dataset includes pooled observations of countries and multiple time points (for example
Eritrea in 1995 and Eritrea in 2002)15 and variables on district and country level. Due to the
two-level structure of the data, estimating a hierarchical model is required. Standard OLS
assumes that observations are independent. If this is not the case standard errors are too small
and effects might become spuriously significant. Because of the hierarchical structure of the
dataset, the independency assumption is not met. More precisely, estimating the similarity of
two districts in one country reveals that districts are highly correlated 0.7816, and most of the
variation of enrollment rates in the district can be explained by country level grouping
structure.
A second argument for the use of a hierarchical model (and against FE with clustered
standard errors) is the proposed variation of the district level variables coefficient of diversity
and clientelism over countries as posited in hypotheses H3-H5. Hierarchical models allow for
the inclusion of these effects by estimating to which extent country and district level variables
contribute to the variance of the dependent variable. In a first step, variations over countries of
variables are identified and random slopes for these variables containing a variable specific
error term are included. In a second step, predictors of this randomness (besides the variable
specific error term) are included. Since the district level variables, clientelism and
sanctioning, are posited to depend on national level politicization and institutions, the
interaction terms between those variables are included in the regression.
13 The few missing values in pupil-teacher ratios and income are approximated by values for the respective variable of proximate years for the same country. 14 All variables except dummy variables are grand mean centered to allow meaningful values of the regression slopes and facilitate interpretation of interaction terms in the hierarchical estimation. Descriptive statistics and correlation matrix are presented in Appendix 3-1 and 3-4. 15 Re-estimation of the final model including only the newest survey data per country (here: Eritrea 2000) yields smaller coefficients for diversity, but unchanged coefficients of all other variables (not show). 16 Intra-class correlation for primary enrollment: ρ = σ2
u0j(Country-level)/(σ2u0j(Country-level)+σ2
eij(District-level)) =482.78/(428.78+133.36), refer to Appendix 3-2, M1. Intra-class correlation for secondary enrollment: ρ = σ2
u0j(Country-level)/(σ2u0j(Country-level)+σ2
eij(District-level)) =443.85/(443.85+119.10), refer to Appendix 3-3, M1.

32
The final model for both primary and secondary enrollment was obtained estimating five
succeeding models. Econometric results of these models are presented in Appendix 3-2 and 3-
3. In the first model (M1), the variation of the dependent variable is divided into a constant
term, the district level error for district i in country j (eij) and the country level error u0j:
Enrollmentij = γ00 + eij + u0j (1)
The second model (M2) includes in equation (1) all explanatory variables at the district level
and theoretically plausible interaction terms of district level variables:
Enrollmentij = γ00 + β1jdiversityij + β2jco-ethnicsij + β3jincomeij + β4jdiversityijXco-ethnicsij (2)
+ β5jdiversityijXincomeij + β6jco-ethnicsijXincomeij + eij + u0j
Variables and interaction terms that emerged as significant predictors of enrollment in
equation (2) were retained and all explanatory variables on country level and country level
interaction terms were included in the next model (M3):
Enrollmentij = γ00 + β1jdiversityij + β2jco-ethnicsij + β3jincomeij +γ01politicizationj (3)
+ γ02institutionsj + γ03institutionsjXpoliticizationj +γ04education expenditurej
+ γ05childrenj + γ06pupil-teacher ratioj + γ071995 + γ082000
+ γ09president’s incumbencyj + eij + u0j
Again, all country level variables and interactions, which emerged with significant
coefficients, were retained for the next model (M4). In addition, random slopes were
introduced for district level variables and significant random slopes retained in model M4:
Enrollmentij = γ00 + β1jdiversityij + (γ20 + u2j)co-ethnicsij + (γ30 + u3j)incomeij (4)
+ γ01politicizationj + γ02institutionsj + γ03institutionsjXpoliticizationj
+ γ04education expenditurej + γ05childrenj + eij + u0j
In the last model (M5), predictors of the random slopes were tested and significant predictors
retained for model M5:

33
Enrollmentij = γ00 + β1jdiversityij + β2jco-ethnicsij + β3jincomeij (5)
+ γ01politicizationj + γ02institutionsj + γ03institutionsjXpoliticizationj
+ γ04education expenditurej + γ05childrenj + γ061995 + γ072000
+ γ08president’s incumbencyj + eij + u0j
β2j = γ20 + γ21politicizationj + γ22institutionsj + γ23president’s incumbencyj + u2j
β3j = γ30 + γ31politicizationj + γ32institutionsj + γ331995 + γ342000 + u3j
The assumption of normality of the error terms was tested and outliers were excluded for both
primary and secondary enrollment.17 Estimation results reported in Table 5 were obtained
estimating the model without the outliers. Coefficients do not change substantially when
outliers are excluded (see Appendix 3-2 and 3-3, column 7) and differences in estimations are
reported in footnotes under Table 5.
The sanctioning and clientelism hypothesis (H1 and H2) are tested by including diversity and
co-ethnics as explanatory variables in the regression (equation 5). Testing the relation
between politicization, institution, diversity and co-ethnics (H3, H4, and H5) requires two
steps. Since politicization and institutions are variables on the country-level, a test of their
influence on diversity and co-ethnics requires estimating the variation of the diversity and co-
ethnics variables over country. This means β1j and β2j (equation 5) are estimated as random
slopes by including the error terms u1j and u2j (equation 7 and 8). As a second step,
politicization and institutions are included as predictors for the randomness of the diversity
and co-ethnics coefficient (equations 7 and 8). Moreover, the variable income emerged as
varying significantly over countries, and this variation was tried to explain by politicization of
ethnicity and institutions (equation 9).
The final model for primary and secondary enrollment is estimated as follows (insignificant
coefficients are in brackets):
17 Outlying countries were Nigeria (1990, 1999, and 2003) and Rwanda (2000). Rwanda might be an exception due to its small size and to the unusual high foreign aid inflows after the 1994 genocide (OECD/DAC, 2008). This increased level of aid might have boosted enrollment in the succeeding years. In the case of Nigeria, the problem might be the coding of ethnicity as adopted from Kasara (2007). Kasara coded the leaders in Nigeria as being members of ”Middle Belt”, which is the association of the administrative districts in the middle part of the country. This part is inhabited by various different ethnic groups, with one being the Hausa ethnic group. In contrast to Kasara, other researchers (Miles, 1987) report presidents in Nigeria to specifically belong to the Hausa group.

34
District level model: Enrollment at the district level (Enrollmentij) depends on the ethnic
diversity, the percentage of presidents’ co-ethnics and the level of income plus district level
error for district i in country j:
Enrollmentij= β0j + β1jdiversityij + β2jco-ethnicsij + β3jincomeij + eij (5)
Country level model: In addition, enrollment depends on country level variables, namely the
politicization, institutional quality, interaction between institutions and politicization, national
education expenditure and the share of the school-aged population. In addition, the error term
u0j captures unobserved country level heterogeneity:
β0j = γ00 + γ01politicizationj + γ02 institutionsj + γ03institutionsjXpoliticizationj + (6)
γ04education expenditurej+ γ05childrenj + γ062000 + u0j
Moreover, the impact of the district level variables diversity, co-ethnics and income on
enrollment varies over countries, with parts of the variation being explained by politicization
and institutions:
β1j = γ10 + [γ11politicizationj] + [γ12institutionsj] + [u1j] (7)
β2j = γ20 + [γ21politicizationj] + [γ22institutionsj] + u2j (8)
β3j = γ30 + γ31politicizationj + [γ32institutionsj] + u3j (9)
The results from the multilevel model are re-estimated using fixed effects with clustered
standard errors on the country level. Fixed effect results are depicted in Table 5, column 3 and
5 and confirm the validity of the multilevel estimates, which include district and country level
random error terms.
3.4.1 Results for primary enrollment
Table 5, column 2, reports the results for primary enrollment. As theoretically expected,
ethnic diversity is negatively related to enrollment and co-ethnics is positively related to
enrollment. Both coefficients are strongly significant, with diversity on the 1 percent level and
co-ethnics on the 5 percent level. This provides evidence to accept hypotheses 1 and 2.

35
Table 5: Results for primary and secondary enrollment
Dependent variable:
Estimation method:
Primary enrollment
Hierarchical model
Primary enrollment
FE (clustered s.e.)
Secondary enrollment
Hierarchical model
Secondary
enrollment
FE (clustered s.e.)
Fixed Part
DiversityD -8.997*** (H1) -8.346*** (H1) -4.665** (H1) -3.840* (H1)
(<0.01)a) (0.008) a) (0.033)a)c) (0.079) a)
Co-ethnicsD 4.522** (H2) 6.601** (H2) 4.292** (H2) 6.725** (H2)
(0.043)a) (0.018) a)(0.049)a) (0.012) a)
PoliticizationC 3.903 1.122
(0.184)b) (0.719)
Co-ethnicsDXpoliticizationC insignificant d) (H3) insignificant d)
(H3)
DiversityDXpoliticizationC insignificant d) (H4) insignificant d)
(H4)
Co-ethnicsDXinstitutionsC insignificant d) (H5) insignificant d)
(H5)
DiversityDXinstitutionsC insignificant d) (H5) insignificant d)
(H5)
InstitutionsC 4.417* 2.346
(0.052)a) (0.208)a)
InstitutionsCXpoliticizationC -4.955** (H5) -3.835* (H5)
(0.019) (0.086)
IncomeDXpoliticizationC -0.073* -0.040
(0.079) (0.352)
IncomeD 0.299*** 0.231*** 0.218*** 0.158***
(<0.01)a) (<0.01)a) (<0.01)a) (<0.01)a)
Education expenditureC 4.335*** 4.236***
(<0.01)a) (<0.01)a)
ChildrenC -1.681** -0.896
(0.018)a) (0.132)a)
2000C 7.637 9.098*
(1.09) (0.076)
Random Part
σ2eij(District level) 84.41 87.22
σ2u0j(Country level)
294.30***
(<0.01)
329.37***
(<0.01)
σ2u1j(Diversity) insignificant insignificant
σ2u2j(Co-ethnics) 116.56*** 102.63*
(<0.01) (0.086)
σ2u3j(Income) 0.020
(0.114)
0.023*
(0.073)
Wald (F-test for FE) chi2(10)=116.58,
(<0.01)
F(3,60)=19.8
(<0.01)
chi2(10)=62.10,
(<0.01)
F(3,60)=7.3
(<0.01)
Log restricted-likelihood -1621.19 -1630.44
R2(within) R2(between)
- 0.239 0.205
- 0.135 0.069
N 418 418 418 418
Countries 61 61 61 61
P values in parentheses;* p<0.1, ** p<0.05, *** p<0.01. Constant term is not presented here. C denotes country level variables and D denotes district level variables.
a) p-values for directed hypotheses.
b) When outliers are included politicization turns significant at the 5 percent level (Appendix 3-2, column 7).
c) When outliers are included diversity is not significant at the 10 percent level (p-value=0.103) (Appendix 3-3, column 7).
d) The random slope for diversity did not turn significant (σ2u1j(Diversity)), which provides evidence that national level politicization
and institutions do not change the coefficient of diversity. Co-ethnics is found to significantly vary over countries (σ2u2j(Co-ethnics))
and interaction term Co-ethnicsXpoliticization and Co-ethnicsXinstitutions were included as predictors of this randomness (see
Appendix 3-2 and 3-3, model M5).
Results obtained using a restricted maximum likely method and independent covariance structures.
For an overview of variable definitions and sources, see Appendix 3-1.

Changing from a complete homogeneous district (diversity=0) to a complete heterogeneous
district (diversity = 0.99) is associated with a decrease in primary enrollment of 8.9 points18
on the scale of primary enrollment from 8.5 to 97.2. This is equivalent to a 10 percent
decrease in primary enrollment. The magnitude of the effect of ethnic diversity is substantial
even when compared to other determinants of schooling, i.e. education expenditure. More
precisely, the impact of changing from a minimum level of education expenditure to
maximum level of education expenditure increases the enrollment rate by 40 percent.19
In comparison, the maximum effect of co-ethnics is only half the size of the diversity
effect. Changing from a district with zero co-ethnics (co-ethnics=0) to a district with 100
percent co-ethnics (co-ethnics=1) is associated with an increase in primary enrollment by 4.51
points20, which is equivalent to an increase of 5 percent in primary enrollment rates.
Most interestingly, the coefficient of diversity does not appear to vary significantly
over countries (σ2u1j(Diversity) is insignificant). This indicates that the effect of diversity is
independent from country level variables, such as politicization and institutions and provides
counterevidence to the theory. More precisely, these econometric results provide evidence to
reject the hypothesis 4 and 5a, which postulated that the diversity effect depends on the level
of politicization and institutional quality.
The random slope of the co-ethnic variable, in contrast, turns significant (σ2u2j(Co-
ethnics)). However, politicization and institutions are not able to explain variations of co-ethnics.
Both interaction terms, Co-ethnicsXpoliticization and Co-ethnicsXinstitutions, appear
insignificant in the estimation. This provides evidence to reject the hypothesis 3 and 5b,
which posited a significant relationship between politicization, institutions and co-ethnics.
Besides the insignificant relation between politicization with diversity and co-ethnics, the
interaction term of politicization with institutions and with income, turns out significant.
Following Brambor, Clark, and Golder (2006) the interaction term between the three variables
politicization, income and institutions is re-estimated and significance levels for all
combination of the three variables are obtained. Graph 2 depicts the marginal effect of
politicization on primary enrollment as institutional quality and income varies. The marginal
effect of politicization is depicted on the y-axes. The x-axes depicts institutional quality,
which varies from weak (-2.25) to strong institutions (2.75). In addition, the marginal effect of
18 Maximum effect of diversity=(max_diversity - min_diversity)*β1 = (0.99-0)*-8.997. 19 Maximum effect of education expenditure=(max_education expenditure – min_education expenditure)* γ04 = (6.28 – (-1.67))*4.335 = 34.46; 34.46 on the range of enrollment rates from 8.5 to 97.2 is an increase of 38.85 percent. 20 Maximum effect of co-ethnics=(max_co-ethnics - min_co-ethnics)*β2 = (1-0)*4.522.

37
politicization is estimated for three typical income levels (mean income, and one standard
deviation above and below the mean), which is depicted by the three different lines in Graph
2. The stars denote significance at the 95 percent level.
Graph 2: Marginal effect of politicization on primary enrollment as institutions and
income change
* denotes significance at the 95% level. sd denotes standard deviation.
From Graph 2, one can infer that countries with average and good institutional quality (0-
2.75) do not exhibit significant marginal effects of politicization in none of the three income
levels.21 However, once institutional quality declines (institutions<0), politicization seems to
have a significantly positive influence on enrollment. Indeed, the change from programmatic
to ethnic parties in countries with weak institutions is associated with an increase in
enrollment rates by more than a 30 percent. For countries with low income, the marginal
effect of politicization turns significant if institutional quality is below average
(institutions<0). For wealthier countries, the marginal effect of politicization only turns
significant for very low institutional quality (institutions<-1.3). It seems, therefore, that
21 Estimating the marginal effect for countries with highest institutional quality (South Africa) reveals a significant negative effect of politicization (see Appendix 3-5, category IV).
**
*********************
********
******
******
**********************
**************************
***
**************
****
*****
*********************************************
*************************
********
******************************
**************************
*******
**********
******
**********************************
***
**************
*********
*************************************************************
****************
**************************
*******
****
******
**************************
***
****************
****************************************************
-20
-10
01
02
0
Ma
rgin
al E
ffe
ct
of
Po
litic
iza
tio
n
2.75210-1-2.25
(weak) Institutions (strong)
Marginal Effect of Politicization for Income=mean-sd
Marginal Effect of Politicization for Income=mean
Marginal Effect of Politicization for Income=mean+sd

38
politicized ethnicity compensates for negative effects of weak institutions on enrollment
rates. 22 Note that correlation between politicization and institutions is negligible (0.022)
which provides support for the independence of the measures of politicization and institutions.
Control variables of a country’s education system (education expenditure, children) enter
significantly in the regression. Furthermore, the dummy for the period 2000-2006 remains
insignificant. The Wald test indicates a good general fit of the final model and log-restricted
likelihood increases from the model including only the intercept (M1), to the final model
including district and country-level variables and random slopes (see Appendix 3-2).
3.4.2 Results for secondary enrollment
Results for secondary enrollment are presented in Table 5, column 3. As for primary
enrollment, one finds a negative effect of diversity and a positive effect of co-ethnics on
secondary enrollment, both significant at the 5 percent level. This provides evidence to accept
hypothesis 1 and 2. The maximum effect of ethnic diversity equals 4.61 points23, which
corresponds to an increase in secondary enrollment of 5.3 percent. With respect to the impact
of diversity on primary enrollment this effect is comparatively low. Again, one can compare
the magnitude of the effect of ethnic diversity to education expenditure. In particular,
changing from a minimum level of education expenditure to maximum level of education
expenditure increases the enrollment rate by 38 percent.24 Thus, compared to the impact of
education expenditure, ethnic diversity has a more moderate impact on enrollment rates.
While the effect of diversity differs from primary to secondary education, the effect of
co-ethnics seems to almost be the same for the different enrollment levels. For secondary
enrollment, one finds that the maximum effect of co-ethnics is 4.3 points25. This is equivalent
to an increase in secondary enrollment by 5 percent.
Testing the hypotheses 4 and 5 by including random slopes for the diversity and co-
ethnics variable reveals insignificant variation of diversity over countries (σ2u1j(Diversity) is
insignificant). This indicates that none of the country level variables, such as politicization
and institutions, significantly changes the diversity coefficient. Therefore, hypotheses 4 and
5a can be rejected.
22 Appendix 3-5 depicts the country-by-country plots of the marginal effects of all countries where the interaction terms turned significant in Graph 1. 23 Maximum effect of diversity=(max_diversity - min_diversity)*β1 = (0.99-0)*-4.665. 24 Maximum effect of education expenditure=(max_education expenditure – min_education expenditure)* γ04 = (6.28 – (-1.67))*4.236 = 33.67; 33.67 on the range of enrollment rates from 8.5 to 97.2 is an increase of 37.95 percent. 25 Maximum effect of co-ethnics=(max_co-ethnics - min co-ethnics)*β2 = (1-0)*4.292.

39
The co-ethnics coefficient, however, exhibits significant variation over countries
(σ2u2j(Co-ethnics) is significant). Trying to explain some of the variation of co-ethnics, by
including politicization and institutions as predictors (by including the interaction terms),
fail. This provides evidence to reject the hypothesis 3 and 5a as politicization and institutions
cannot explain the variation of co-ethnics over countries.
In addition, the interaction between politicization and institutional quality turns
significant. However, re-estimating the marginal effects of politicization on secondary
enrollment for varying degrees of institutions and income (similar to Graph 2) reveals
insignificant effects (not shown).
Countries’ national education expenditure and income have significant positive effects
on secondary enrollment and income does vary significantly over countries (σ2u3j(Income)).
However, while the share of the school-aged population is not significantly related to
secondary education, there is a significant time effect. In comparison to the omitted time
periods, a country’s secondary enrollment in the period 2000-2006 is increased. The
restricted-log likelihood and the Wald test indicate a good general fit of the final model.
3.5 Discussion
Summing up, the econometric results support hypothesis 1 and 2, reject hypothesis 3, 4 and 5,
and provide interesting insights into the role of politicization on enrollment rates.
Hypothesis 1 was supported by showing a significant negative coefficient of the
diversity variable in Table 5. Communities being composed of several ethnic groups exhibit
significantly lower enrollment rates. This lends some support for the validity of the
sanctioning theory by Miguel and Gugerty (2005). Heterogeneous communities seem, indeed,
to suffer from a collective action problem, namely the inability to sanction non-contributing
parents. This inability leads to lower school finances, which translate into significantly lower
educational outcomes.
As seen in Table 5, the coefficient of diversity is much smaller for secondary than for
primary enrollment. Since secondary enrollment comprises children going to primary and
secondary school, the difference in coefficients might be driven by the portion of children
attending secondary schools. Data from developing countries reveals that there are substantial
differences in the financing resources for primary and secondary education.26 Village funding
might be particularly important for primary and less important for secondary education.
26 Households’ contribution to primary education as percent of total expenditure ranges from about 20 percent of total education expenditure (Malawi) to nearly 50 percent (Zambia), see UNESCO (2008b), Figure 4.5, 151.

40
Primary schools are mainly located in one village, while the fewer secondary schools belong
to various communities. While village funding is particularly relevant for primary education,
secondary schooling might be mostly funded by the government. Hence, the ethnic
composition of a village plays a minor role for secondary school funding and this might have
resulted in smaller coefficients of the diversity variable for secondary enrollment.
The second hypothesis (H2) was supported by a significant positive coefficient of the
co-ethnics variable in Table 5. Districts with high shares of president’s co-ethnics exhibit
comparably higher enrollment rates. This provides strong evidence for the clientelism theory.
Incumbent politicians seem to distribute state education resources primarily to their ethnic
clientele, which then translates into higher enrollment rates of president’s co-ethnics.
Hypothesis 3 and 5b concerning the relation between clientelism with politicization
and with institutions was not supported by the econometric results. The coefficient of
clientelism varies substantially over countries, which was shown by the significant slope
variance (σ2u2j(Co-ethnics) is significant).27 However, this variation could neither be explained by
politicization nor by institutions, demonstrated by the insignificant interaction terms between
clientelism with politicization and institutions. This provides evidence for an effect of
clientelism that is independent from the degree of politicization and institutional quality.
Whether ethnicity is politically relevant does not substantially influence clientelistic
distributions of state education resources. This lends support that policies targeted at
reductions of the political relevance of ethnicity, for example through nation building policies
(Miguel, 2004), will not be able to mitigate the negative effect of the clientelistic distribution.
The role of politicization and institutions was also tested for the sanctioning effect.
Again, the hypotheses (H3 and H5a) are not supported by the econometric results as shown by
the insignificant slope variance of the diversity variable (σ2u1j(Diversity) is insignificant). This
rejects Miguel’s (2004) notion that the effect of ethnic diversity differs over countries. Miguel
argues that countries with strong nation building in the past (as in Tanzania) do not suffer
from ethnic diversity. This is rejected by the econometric results, which do not find a
significant impact of politicization on the diversity coefficient. Ethnic diversity seems to
negatively affect education outcomes independent of the political relevance of ethnicity. This
challenges Miguel’s (2004) notion that nation building policies, designed to decrease the
relevance of ethnicity in the political process, might mitigate the negative diversity effect.
Besides the insignificant influence of politicization on sanctioning and clientelism, the
econometric results provided interesting insights into the direct influence of politicization on
27 Similar results are found by Franck and Rainer (2009).

41
enrollment rates. As demonstrated by the significant marginal effects of politicization in
Graph 2, politicization is found to significantly influence primary education in countries with
weak institutions. Countries with average and below average institutional quality benefit from
higher degrees of politicization. For countries with very weak institutions and low income,
higher politicization is associated with increases in enrollment of over 30 percent.
Politicization is measured by the existence of ethnic parties. In contrast to programmatic
parties, ethnic parties seem to perform better in worse environments. They seem to maintain a
minimum level of education spending resulting in increased enrollment. This lends evidence
to the idea that ethnic parties depend more critically on rewarding their members for their
support than programmatic parties. While programmatic parties might have other means to
maintain a positive relationship with their voters, ethnic parties seem to depend mainly on
distribution of state resources. This explains why even in worst environments, ethnic parties
are associated with increased enrollment rates.
3.6 Conclusion
Countries with a high number of ethnic groups are seen to bear a particular high burden in
providing public goods. Ethnic diversity is assumed to downsize the amount of local public
goods provided. However, a clear understanding of why this is happening has been, so far, not
discovered. Detecting the channels through which ethnicity influences public good provision
is, therefore, crucial to define policies helping to overcome the burden of ethnic diversity.
This chapter contributes to these efforts by providing a test of the underlying
mechanisms driving the effect of ethnicity on education provision. In particular, the study
identified the sanctioning, clientelism and politicization theory on education provision.
Econometric results provide some support for the relevance of these theories for primary and
secondary education provision in Africa. In particular, heterogeneous communities are found
to be associated with significantly lower enrollment rates than homogeneous communities.
This might lend support to the idea that villages composed of various ethnic groups are less
able to cooperate efficiently, e.g. by sanctioning non-contributing parents.
In addition, the econometric results point to an unequal distribution of state resources
from presidents primarily to their ethnic clientele. Indeed, members of the president’s
ethnicity exhibit significantly higher enrollment rates than members of other ethnic groups.
This effect, however, varies substantially over countries and lends credit to the idea that
clientelistic distribution of state funds might be influenced by other factors still uncovered. In

42
the econometric analysis, neither politicization nor institutional quality or income was found
to explain the variation of clientelistic distribution. It is left to future research to establish
more detailed understanding of the mechanisms at work.
Furthermore, the econometric results provide interesting insights into the role of
politicization of ethnicity. The relevance of ethnicity in the political process is neither found
to influence village fund raising nor state distribution of education resources. This clearly
contrasts earlier findings, which proposed investing in nation-building policies as a cure to the
ethnicity problem (Miguel, 2004). Generally, nation building policies denote efforts to unite
the different ethnic groups in a country and create a united identity (for example by
introducing a lingua franca, such as Swahili in Tanzania). This might then lessen the political
relevance of ethnicity. Unfortunately, such policies seem neither to effectively support village
fundraising nor to lead to a more equal distribution of state resources.
A second intuition derived from the econometric estimation regarding politicization
points to a positive influence of politicization on enrollment rates in countries with weak
institutions. In contrast to programmatic parties, ethnic parties seem to maintain a minimum
level of education spending even in adverse environments.
From the discussion in this chapter it emerges that additional research in two areas might be
beneficial in understanding the role of ethnic diversity in the education sector. First, the
econometric results in this chapter provide evidence for a significant and substantial effect of
politicization of ethnicity on education. This supports current debates that the political
salience of ethnicity is an important factor for development. However, while in this chapter
politicization of ethnicity was treated as exogenous, it might be interesting to understand why
ethnic identity emerges as a politically salient factor in some countries and is absent from
politics in another. In particular, it seems valuable to understand the underlying factors
causing ethnicity to be politicized. Therefore, in the next chapter (4) possible explanatory
factors of the politicization of ethnicity will be traced.
A second interesting question emerging from the analysis in this chapter focuses on
the impact of ethnic diversity on the local level educational outcomes. In particular, ethnic
diversity was found to be significantly associated with lower educational outcomes. This was
explained referring to the impact of ethnic diversity on the sanctioning ability of local
communities. However, it seems worthwhile to establish the impact of ethnic diversity on
other local level community activities. In particular, a widely acknowledged community
activity is parental involvement in their children’s schooling. Involvement of parents in their

43
children’s education, for example by helping with homework, becoming engaged in school
functions and communicating with the school, is widely seen as an important factor
contributing to the improvement of education systems in developing countries. Therefore, in
chapter 5 the impact of parental involvement activities on educational outcomes in ethnically
diverse communities is assessed.

44
Appendices 3-1 – 3-10
Appendix 3- 1: Variables and descriptive statistics
Variable name Definition Sources Level Mean Standard Deviation
Min Max Obs.
Primary enrollment
Average district school enrollment for household members between 6-10 years
MEASURE DHS (2008) District 55.62 24.30 8.5 97.2 418
Secondary enrollment
Average district school enrollment for household members between 11-15 years
MEASURE DHS (2008) District 66.6 21.80 11.9 98.3 418
Diversity Probability that two randomly drawn individuals in the same district are members of different ethnic groups (range:0-1)
Cunningham and Weidmann (2008)
District .0019 .2521 -.409 .427 418
Co-ethnics Population-share of leader’s ethnic co-members in the district (range: 0-1)
Cunningham and Weidmann (2008), Kasara (2007), Goemans et al. (2008)
District .0029 .379 -.288 .711 418
Politicization Equals 0 if parties are not based on ethnicity; equals 1 if parties are partially based on ethnicity; equals 2 if parties are strongly based on ethnicity
Marshall and Jaggers (2008a-c)
Country .660 .660 0 2 418
Institutions Freedom House index of political rights and civil liberties (-2.25 to 2.75, whereby 2.75 denotes the highest degree of freedom)
Freedom House (2008) Country 0 1.29 -2.25 2.75 418
Income Average district percentage of households that have access to piped water
MEASURE DHS (2008) District .00238 24.60 -31.87 67.22 418
Education expenditure
National education expenditure (percent of GNI)
WDI (World Bank, 2006) Country .0609 1.66 -1.67 6.28 418
Children Population aged 0-14 years (percent of total population)
WDI (World Bank, 2006) Country -.1140 3.43 -12.29 6.09 418
Pupil-teacher ratio Pupil-teacher ratio in primary education WDI (World Bank, 2006) Country 3902 12.79 -21.76 38.05 418
President’s incumbency
Incumbency of political leader (in years) Various sources Country .384 8.17 -10.68 23.81 418
Note: Descriptive statistics are reported for grand mean centered variables and excluding outliers.

45
Appendix 3- 2: Results for primary enrollment
Dependent variable:
Primary enrollment
M1:
Intercept-only
M2:
district level
variables
M3:
country level
variables
M4:
M3+random
slopes
M5:
M4+cross-level
interactions
Final model
including
outliers
Fixed Part
Diversity -8.870*** -8.906*** -8.967*** -8.607*** -8.248*** (<0.01)
a) (<0.01)
a)(<0.01)
a)(<0.01)
a) (<0.01)
a)
Co-ethnics 5.723*** (<0.01)
a)
5.423*** (<0.01)
a)
4.898** (0.033)
a)
4.273 (0.112)
a)
4.654*** (0.039)
a)
Income 0.240*** 0.232*** 0.248*** 0.235*** 0.291*** (<0.01)
a) (<0.01)
a)(<0.01)
a)(0.001)
a) (<0.01)
a)
DiversityXco-ethnics -0.413 (0.956)
DiversityXincome -0.049 (0.650)
Co-ethnicsXincome 0.035 (0.649)
President’s incumbency 0.392 0.366 (0.157) (0.189)
Politicization 2.442 4.290 3.045 5.238** (0.414) (0.139) (0.295) (0.047)
Children -1.763** -1.712** -1.243* -1.788*** (0.011)
a)(0.011)
a)(0.053)
a) (<0.01)
a)
Education expenditure 4.618*** 4.377*** 4.771*** 3.515*** (<0.01)
a)(<0.01)
a)(<0.01)
a) (<0.01)
Pupil-teacher ratio 0.285 (0.185)
Institutions 3.674* 4.333* 4.274* 3.965* (0.081)
a)(0.054)
a)(0.059)
a) (0.065)
InstitutionsXpoliticization -4.029** (0.049)
-5.079** (0.015)
-4.413** (0.036)
-4.253** (0.035)
InstitutionsXincome -0.033 (0.246)
PoliticizationXincome -0.075* (0.089)
-0.077* (0.062)
Co-ethnicsXpresident’s incumbency
-0.354 (0.366)
IncomeX1995 0.131 (0.181)
IncomeX2000 0.064 (0.507)
Co-ethnicsXpoliticization 0.800 (0.807)
Co-ethnicsXinstitutions -1.805 (0.408)
1995 4.259 (0.485)
4.553 (0.463)
2000 7.643 (0.197)
9.956 (0.093)
5.922 (0.189)
Constant 57.15*** (<0.01)
56.89*** (<0.01)
49.51*** (<0.01)
54.02*** (<0.01)
48.65*** (<0.01)
50.78*** (<0.01)
Random Part
σ2eij(district level) 133.36 102.85 102.18 84.07 83.92 123.01
σ2u0j(country level)
482.78*** (<0.01)
398.50*** (<0.01)
276.55*** (<0.01)
287.98*** (<0.01)
276.91*** (<0.01)
273.57*** (<0.01)
σ2u1j(diversity) insignificant insignificant insignificant
σ2u2j(co-ethnics) 126.06***
(<0.01) 126.99*** (<0.01)
77.47 (0.771)
σ2u3j(income) 0.0237*** 0.0244*** 0.0098
(<0.01) (<0.01) (0.423)
Wald . chi2(6)=124.8 (<0.01)
chi2(12)=163.9 (<0.01)
chi2(8)=110.0 (<0.01)
chi2(18)=122.7 (<0.01)
chi2(10)=114.6 (<0.01)
Log restricted-likelihood -1708.65 -1652.79 -1627.27 -1624.24 -1617.77 -1785.92
N 418 418 418 418 418 445
Countries 61 61 61 61 61 65
P values in parentheses;* p<0.1, ** p<0.05, *** p<0.01. a) p-values for directed hypotheses. Results obtained using a restricted maximum likely method and independent covariance structures. For an overview of variable definitions and sources, see Appendix 3-1.

46
Appendix 3- 3: Results for secondary enrollment
Dependent variable:
Secondary enrollment
M1:
Intercept-only
M2:
district level
variables
M3:
country level
variables
M4:
M3+random
slopes
M5:
M4+cross-level
interactions
Final model
including
outliers
Fixed Part
Diversity -5.036** -4.490** -4.696** -4.524** -3.706 (0.033)
a) (0.045)
a)(0.032)
a)(0.039)
a) (0.103)
a)
Co-ethnics 4.674** (0.024)
a)
5.082*** (0.006)
a)
4.603** (0.035)
a)
5.102* (0.068)
a)
4.598** (0.040)
a)
Income 0.170*** (<0.01)
a)
0.161*** (<0.01)
a)
0.193*** (<0.01)
a)
0.193*** (<0.01)
a)
0.209*** (<0.01)
a)
DiversityXco-ethnics -5.229 (0.486)
DiversityXincome 0.026 (0.809)
Co-ethnicsXincome 0.015 (0.851)
President’s incumbency 0.137 (0.652)
0.248 (0.409)
Politicization 1.258 0.318 2.782 (0.691) (0.918) (0.331)
Children -0.882 -1.257 (0.136)
a) (0.054)
a)
Education expenditure 4.137*** 4.076*** 4.212*** 3.203** (<0.01)
a)(<0.01)
a) (<0.01)
a) (0.016)
a)
Institutions 2.217 -0.939 2.793 (0.225)
a) (0.328)
a) (0.326)
InstitutionsXpoliticization -3.513 (0.122)
-3.416 (0.119)
InstitutionsXincome -0.010 (0.722)
PoliticizationXincome -0.045 (0.327)
-0.047 (0.286)
Co-ethnicsXpresident’s incumbency
-0.133 (0.732)
IncomeX1995 0.083 (0.412)
IncomeX2000 0.010 (0.923)
Co-ethnicsXpoliticization -0.950 (0.768)
Co-ethnicsXinstitutions 0.128 (0.953)
1995 4.458 6.305 (0.509) (0.352)
2000 11.460* 10.467** 13.822** 6.998 (0.075) (0.035) (0.030) (0.153)
Constant 64.76*** (<0.01)
64.44*** (<0.01)
56.81*** (<0.01)
59.84*** (<0.01)
55.75*** (<0.01)
59.61*** (<0.01)
Random Part
σ2eij(District level) 119.10 104.82 104.00 87.21 87.57 125.47
σ2u0j(Country level)
443.85*** 404.98*** 347.25*** 335.81*** 348.74*** 326.99***
(<0.01) (0.01) (<0.01) (<0.01) (<0.01) (<0.01)
σ2u1j(diversity) insignificant insignificant insignificant
σ2u2j(Co-ethnics) 97.13***
(<0.01) 108.46*** (<0.01)
64.36 (0.298)
σ2u3j(Income) 0.0245*** 0.0271*** 0.0152
(<0.01) (<0.01) (0.247)
Wald . chi2(6)=60.5 (<0.01)
chi2(11)=79.0 (<0.01)
chi2(5)=55.7 (<0.01)
chi2(16)=57.8 (<0.01)
chi2(10)=55.7 (<0.01)
Log restricted-likelihood -1685.90 -1656.60 -1635.89 -1637.11 -1633.13 -1795.05
N 418 418 418 418 418 445
Countries 61 61 61 61 61 65
P values in parentheses;* p<0.1, ** p<0.05, *** p<0.01. a) p-values for directed hypotheses. Results obtained using a restricted maximum likely method and independent covariance structures. For an overview of variable definitions and sources, see Appendix 3-1.

47
Appendix 3- 4: Correlation matrix
Diversity Co-ethnics President’s incumbency
Politicization Income Children Education expenditure
Pupil-teacher ratio
Institutions 1995 2000
Diversity 1.00
Co-ethnics -0.456 1.00
President’s incumbency
-0.076 0.078 1.00
Politicization 0.225 -0.129 0.165 1.00
Income -0.254 0.239 0.046 -0.036 1.00
Children 0.268 -0.226 -0.020 0.110 -0.532 1.00
Education expenditure
-0.163 0.310 0.236 0.219 0.358 -0.405 1.00
Pupil-teacher ratio
0.1115 -0.169 -0.069 0.272 -0.387 0.306 -0.334 1.00
Institutions -0.060 -0.028 -0.284 0.022 0.062 -0.157 0.033 0.090 1.00
1995 0.0360 -0.034 -0.193 -0.043 0.006 0.037 -0.070 -0.213 0.002 1.00
2000 -0.063 0.057 0.026 0.066 0.052 -0.201 0.003 0.302 -0.182 -0.577 1.0

48
Appendix 3- 5: Country-by-country marginal effects of politicization
I. Countries with lowest institutional quality
Central
Southern
Southern Red Sea
Gash-Barka
Northern Red Sea
Anseba
12
13
14
15
Eff
ect
of
Po
litic
iza
tio
n o
n E
nro
lme
nt
-20 -10 0 10 20 30Income
Eritrea 2002
Centre/Sud/Est
Nord Ouest/Sud Ouest
Adamaoua/Nord/Extreme-Nord
Ouest/Littoral
11
11
.51
21
2.5
13
Ma
rgin
al E
ffe
ct o
f P
olit
iciz
atio
n o
n E
nro
lme
nt
-20 -10 0 10Income
Cameroon 1991
Centre
Extreme-Nord
SudAdamaoua
Nord
Nord-Ouest
Est
Ouest
Littoral
Sud-Oues
91
01
11
21
3M
arg
ina
l E
ffe
ct
of
Po
litic
iza
tio
n o
n E
nro
lme
nt
-20 -10 0 10 20 30Income
Cameroon 2004
Northern
Southern
Central
14
14.5
15
15.5
Marg
inal E
ffect of P
olit
iciz
ation o
n E
nro
lment
-15 -10 -5 0Income
Malawi 1992
Nord Ouest/Sud Ouest
Adamaoua/Nord/Extreme-Nord
Ouest/Littoral
Centre/Sud/Est1
0.5
11
11
.51
21
2.5
13
Ma
rgin
al E
ffe
ct
of
Po
litic
iza
tio
n o
n E
nro
lme
nt
-20 -10 0 10 20Income
Cameroon 1998
Urban_Governates
Lower Egypt
Frontier_Governates
Upper Egypt
78
91
01
1M
arg
ina
l E
ffe
ct
of
Po
litic
iza
tio
n o
n E
nro
lme
nt
20 30 40 50 60 70Income
Egypt 1995

49
II. Countries with low institutional quality
Note: The marginal effect of politicization for Urban_governates is
not significant.
Note: The marginal effect of politicization for Urban_governates is
not significant.
Note: The marginal effect of politicization for Conacry is not
significant.
Dosso
Zinder-Diffa
Niamey
Tahoua-Agadez
Maradi
12
.81
31
3.2
13
.41
3.6
Ma
rgin
al E
ffe
ct
of
Po
litic
iza
tio
n o
n E
nro
lme
nt
-25 -20 -15Income
Niger 1998
Foret
Savanes
88
.28
.48
.68
.8M
arg
ina
l E
ffe
ct
of
Po
litic
iza
tio
n o
n E
nro
lme
nt
5 10 15 20Income
Cote d'Ivoire 1994
Upper Egypt
Urban_Governates
Frontier_Governates
Lower Egypt
4.5
55
.56
Ma
rgin
al E
ffe
ct
of
Po
litic
iza
tio
n o
n E
nro
lme
nt
50 55 60 65 70Income
Egypt 2000
Urban_Governates
Lower Egypt
Upper Egypt
4.5
55
.56
6.5
Ma
rgin
al E
ffe
ct
of
Po
litic
iza
tio
n o
n E
nro
lme
nt
30 40 50 60 70Income
Egypt 1992
Upper_GuineaForest_Guinea
Conacry
Lower_Guinea
Central_Guinea
67
89
10
11
Ma
rgin
al E
ffe
ct
of
Po
litic
iza
tio
n o
n E
nro
lme
nt
-20 0 20 40 60Income
Guinea 1999

50
Note: The marginal effect of politicization for Conacry is not
significant.
Note: The marginal effect of politicization for Nairobi Area is not
significant.
Note: The marginal effect of politicization for Nairobi Area is not
significant.
Forest_Guinea
Conacry
Upper_GuineaLower_Guinea
Central_Guinea
46
81
01
2M
arg
ina
l E
ffe
ct
of
Po
litic
iza
tio
n o
n E
nro
lme
nt
-20 0 20 40 60Income
Guinea 2005
Rift Valley
Nairobi Area
Nyanza
Central
Western
Coast
Eastern
46
81
01
2M
arg
ina
l E
ffe
ct
of
Po
litic
iza
tio
n o
n E
nro
lme
nt
-20 0 20 40 60Income
Kenya 1998
Centre-South
Centre
South
North-West
Eastern
Centre-North
Tensift
77
.58
8.5
9M
arg
ina
l E
ffe
ct
of
Po
litic
iza
tio
n o
n E
nro
lme
nt
0 10 20 30 40Income
Morocco 1992
Coast
Nyanza
Nairobi Area
EasternRift Valley
Central
Western
46
81
01
2M
arg
ina
l E
ffe
ct
of
Po
litic
iza
tio
n o
n E
nro
lme
nt
-20 0 20 40 60Income
Kenya 1993
Zone_Nord
Zone_Sud
Zone_Centre
Zone_Fleuve
89
10
11
Ma
rgin
al E
ffe
ct
of
Po
litic
iza
tio
n o
n E
nro
lme
nt
-20 -10 0 10 20Income
Mauritania 2000
SouthwestNortheast
Kigali
Central/South
Northwest
89
10
11
Ma
rgin
al E
ffe
ct
of
Po
litic
iza
tio
n o
n E
nro
lme
nt
-20 -10 0 10 20Income
Rwanda 1992

51
Note: The marginal effect of politicization for Dar es Salaam is not
significant.
GitaramaButare
Gisenyi
Kigali
Northeast
Kibuye
Gikongoro
Ruhengeri
Cyangugu
89
10
11
Ma
rgin
al E
ffe
ct
of
Po
litic
iza
tio
n o
n E
nro
lme
nt
-20 -10 0 10 20Income
Rwanda 2005
Ensemble Maritime
Plateaux
Kara
CentraleSavanes
78
91
01
1M
arg
ina
l E
ffe
ct
of
Po
litic
iza
tio
n o
n E
nro
lme
nt
-20 -10 0 10 20Income
Togo 1998
Mashonaland East
Midlands
Matabeleland South
Masvingo
Mashonaland West
Matabeleland North
Manicaland
Mashonaland Central
8.5
99
.51
01
0.5
Ma
rgin
al E
ffe
ct
of
Po
litic
iza
tio
n o
n E
nro
lme
nt
-10 0 10 20Income
Zimbabwe 1999
Kigoma
Mwanza
Morogoro
Mtwara
Tanga
Dodoma
Singida
ArushaRukwa
Shinyanga
Kilimanjaro
Tabora
Zanzibar
Dar es Salaam
Ziwa Magharibi
Pwani
Ruvuma
Mbeya
Mara
IringaLindi
46
81
01
2M
arg
ina
l E
ffe
ct
of
Po
litic
iza
tio
n o
n E
nro
lme
nt
-40 -20 0 20 40 60Income
Tanzania 1992
Eastern
Central
Western
Northern
10
10
.51
11
1.5
Ma
rgin
al E
ffe
ct
of
Po
litic
iza
tio
n o
n E
nro
lme
nt
-30 -25 -20 -15 -10Income
Uganda 2000

52
III. Countries with average institutional quality
Note: The marginal effect of politicization is only significant for
districts close to mean income (=0.0023).
IV. Countries with sound institutions
Note: The marginal effect of politicization for Central is not
significant.
Ruvuma
Iringa
Dodoma
Pwani
Shinyanga
Mara
Morogoro
Dar es Salaam
Mwanza
Mtwara
Lindi
Kilimanjaro
Rukwa
Ziwa Magharibi
Tanga
Singida
Mbeya
Arusha
Kigoma
Tabora
Zanzibar
24
68
Ma
rgin
al E
ffe
ct
of
Po
litic
iza
tio
n o
n E
nro
lme
nt
-20 0 20 40 60Income
Tanzania 1996
Gauteng
KwaZulu/Natal
Mpumalanga
Eastern Cape
Western Cape
Northern
Free State
North West
Northern Cape
-15
-14
-13
-12
-11
Ma
rgin
al E
ffe
ct
of
Po
litic
iza
tio
n o
n E
nro
lme
nt
20 30 40 50 60 70Income
South Africa 1998
Southern Red Sea
Central
Anseba
Gash-BarkaSouthern
Northern Red Sea
66
.57
7.5
88
.5M
arg
ina
l E
ffe
ct
of
Po
litic
iza
tio
n o
n E
nro
lme
nt
-20 -10 0 10 20Income
Eritrea 1995

53
Specification of Appendix 3-5
The graphs depict the marginal effect of politicization on primary enrollment for those
countries that exhibit a significant interaction term as identified in Graph 2 (29 out of 61).
Calculations are performed using the regression coefficients reported in Table 5, column 2 for
primary enrollment and the following formula:
d (Primary enrollment)/d(politicization)=3.90 -4.955*institutions – 0.073*income
Appendix 3- 6: Coding rules for diversity
The diversity variable is designed to capture the heterogeneity of the population at the district
level.28 This variable has per se no political dimension but is a pure summation of all ethnic
groups in the district. To code the ethnic diversity on the district level information is needed
on (i) the districts used and (ii) the calculation of diversity. The following section will
describe the two steps (i,ii) in greater detail and concludes with a presentation of some
limitations of the data (iii).
(i) Which districts?
The districts from Cunningham and Weidmann (2008) are matched with the DHS districts.
Information on alternate names of districts and development of district organization that
permits matching of the two databases was found at the STATOIDS (2008).
(ii) Calculation of diversity
To calculate the diversity on district level, the widely used formula for the ethno-linguistic
fractionalization measure as used by Alesina et al. (2003) is used:
diversityj=1-∑Ni=1
2ij
Where sij= share of ethnic group i in country j 29.
When several smaller districts from Cunningham and Weidmann (2008) are included in a
larger district in DHS, then the calculation is as follows. First, the population of one ethnic
group in all three smaller districts is added and divided by the sum of the population of the
three smaller districts. This group-share is then used to calculate the diversity.
28 The following description draws on a personal communication with Nils Weidmann. 29 Alesina et al. (2003), 158-159.

54
(iii) Limitations of diversity data
Several limitations have to be kept in mind when working with the data from Cunningham
and Weidmann (2008). First and most important, the list of ethnic groups and their population
shares do not vary over time but is constant to the original coding of the Atlas Narodov Mira
in 1964 (Bruk, 1964). Note that consequently the diversity measure does not vary within one
country at different time points. Second, Cunningham and Weidmann’s model is not able to
account for nomadic ethnic groups (without at specific settlement area) and for overlapping of
several settlement areas.
Appendix 3- 7: Coding rules for co-ethnics
To code the share of population belonging to the ethnic group of a country’s leader on district
level, one needs information on (i) which leader, (ii) which ethnic identity, and (iii) the
geographic location of leader’s ethnic group denoted in district level population shares. The
following section will describe the three steps (i-iii) in greater detail. The complete list
reporting shares of leaders’ ethnic co-members is available upon request to
(i) Which leader?
Since the object of the co-ethnics variable is to capture possible resource distribution by the
leader to his/her ethnic group, it is necessary to measure the leader that effectively has the
power over state resources. In most cases, this is the incumbent president at the time of the
DHS survey. However, in rare cases power does not lie with the president but with other
politicians. Following Kasara’s (2007) approach, this dissertation uses the list of “effective
leaders” by Goemans, Gleditsch and Chiozza (2008).
(ii) Which ethnic identity?
Since ethnic identity varies and depends on the situation that individuals face, ethnic identity
of the leader is coded as the identity known to be politically relevant. Fortunately, Fearon,
Kasara and Laitin (2007) already coded the ethnicity of effective leader. This data on ethnic
identity of the leader is used for all surveys dating 2000 and back. For newer DHS surveys,
own coding is used, since Fearon, Kasara and Laitin’s dataset is limited to the year 2000.

55
(iii) Geographic location of leader’s ethnic group
The information on leader’s ethnic identity by Kasara (2007) was matched with district level
population shares of ethnic groups provided by Cunningham and Weidmann (2008).
Particular care was attributed to this procedure because of different names for ethnic groups
and different grouping criteria (language, tribe, ethnicity, and race), which had to be matched.
Information from the Ethnologue Country Index by Gordon (2005) was used to identify
specific groups and their geographic location. In rare cases, no information on ethnic identity
was available from Fearon, Kasara and Laitin (2007) because the dataset does not code
ethnicity of leaders after the year 2000. In addition, for some countries that clearly exhibited
ethnic conflicts (such as Rwanda, the 1994 genocide) only one ethnic group (Banyuranda)
was coded in the country in Cunningham and Weidmann (2008). In both of the two cases,
where information on ethnicity was missing, leaders’ ethnic identity was coded using other
sources (as described in Appendix 3-8).
Appendix 3-8 summarizes the list of countries (and leaders) in cases where (1) Fearon, Kasara
and Laitin’s (2007) ethnic identity matches Cunningham and Weidmann (2008) or several
smaller ethnic groups were summarized into one larger group, (2) alternative names or a
subgroup description for ethnic groups have been used, and (3) in which the author had to
code ethnic group-shares. Although, one might argue that if leader’s real ethnic identity is a
subgroup of the one used in this analysis, this approximation can still be regarded as a valid
approximation of the real ethnic identity.

56
Appendix 3- 8: Coding of leaders’ ethnic identity
(1) (2) (3)
Perfect match Alternative names or subgroup Coding Anke Weber
Burkina
Faso (1992, 1998, 2003)
Ghana
(1993,1998) Guinea
(1999, 2005) Niger (1998,
2006) Mozambique
(1997, 2003) Namibia
(1992, 2000) Zambia
(1996, 1992) South Africa
(1998) Egypt (1992,
1995, 2000) Morocco
(1992, 2003) Mali:
FKL=Mande== Mandingo+ Soninke+Susu in CW [Explanation: Mande comprises the three ethnic groups Mandingo, Soninke and Susu]
Benin: FKL=Fon = Tem in CW [Explanation: in CW all Gbe-language groups count as being a member of Ewe (Gbe is the upper-level grouping and Fon and Ewe are subgroups)]
Cameroon: FKL=Beti==Fang in CW [Explanation: Beti is upper-level grouping, and Fang is a subgroup]
Central African Republic: FKL=Sara==Bagirmi in CW [Explanation: Sara is a subgroup of Bagirmi]
Republic of Congo: FKL=Kouyou==Bakele in CW [Explanation: Scanning of geographic location of all ethnic groups in Congo in CW showed that Kouyou are located in the same region as Bakele, hence Bakele are used as an approximation of Kouyou]
Cote d’Ivoire: FKL=Baule==Akan in CW [Explanation: Baule are a sub-group of the Akan people]
Eritrea: FKL=Tigrinya==Tigrai in CW [Explanation: Tigrai is an alternative name of Tigrinya]
Ethiopia: FKL=Tigre==Tigrai in CW [The Tigre are a related ethnic group of the Tigrai in Eritrea (and located at the border to Eritrea) and can be used as an approximation of the Tigre group (see language map of Ethiopia, Gordon (2005)]
Gabon: FKL=Teke==Bateke in CW [Explanation: Bateke is alternative name for Teke]
Kenya: FKL=Kalenjin==Nandi in CW [Explanation: Nandi is a dialect of Kalenjin]
Lesotho: FKL=Sotho==Basuto in CW [Explanation: Basuto is a sub-group of Sotho]
Niger: FKL= Djerma (Zarma)== Songai in CW [Explanation: Zarma is one of the Songai-languages]
Tanzania, President Benjamin Mkapa: FKL=Ngoni==Angoni in CW
Togo: FKL=Kabre(Cabrai, B==Tem in CW [Explanation: same dialect]
Uganda: FKL=Ankole==Banyoro in CW [The tribe Banyankore is located in the Ankole region and Bayoro matches geographic location of Ankole]
Zimbabwe: FKL=Shona==Mashona in CW [Explanation: Mashona is alternative name for Shona]
Ghana, President John Agyekum Kufuor: (Antoun and Campling, 2008) =Asante=Akan in CW [Explanation: Asante is a dialect of Akan]
Madagacsar: The only ethnic group in CW is “Malagasy”. However, Malagasy comprises a number of political relevant ethnic groups, such as: Betsimisaraha, Plateau, Sakalava and Bara (Marcus, 2004; and Gordon, 2005). Geographic location and groupshare in districts were estimated using the language map of Madagascar from Gordon (2005). President Didier Ratsiraka: FKL= Betsimisaraha== Betsimisaraha; President Ratsirahonana: FKL=Merina==Plateau [Explanation: Plateau Malagasy comprises more than just the Merina people, but the other people are very close to Merina and the primary ethnic divide is between Merina and cotier. President Ravalomanana: (Africa Almanac, 2008)= Merina and Merina is approximated with Plateau ethnic group in CW.
Malawi: CW does not include Chewa (=ethnic identity of president Hastings Kamuzu Banda). Geographic location and groupshare in districts were estimated using the language map of Malawi from Gordon (2005). President Banda: FKL=Chewa==Chewa; President Muluzi=Yao==Yao.
Mauritania: FKL codes ethnic identity of President as “Bidan (White) M”, whereas CW has only one category summarizing white and black Moors, namely “West Saharan Arabs”. Recoding is necessary since ethnic conflict runs along the black Moor versus white Moor divide (Minorities at Risk Project, 2005). Since white and black moors are evenly dispersed throughout the country with no clear geographic location of either of the ethnic groups (Minority at Risk Project, 2005), the overall share of group members drawn from the Polity IV country report 2003: Mauritania (Marshall and Jaggers, 2008a) are used as group shares. The shares are as follows: White Moors and Black Moors represent 70 percent of the total Mauritanian population. 30 percent of the population is white Moors and 40 percent is black Moors. Hence 0.3/0.7=0.43 percent of West Saharan Arabs are white_Moors and 04/07=0.57 percent of West Saharan Arabs are black_Moors.
Nigeria: FKL=middle Belt, but CW has no such coding. Hence, recode all inhabitants of the Middle Belt region (= districts Adamawa, Taraba, Benue, Kogi, Kwara, Niger, Abuja, Plateau, Nassaraw (Haruna Izah, 2004) as being member of “middle Belt” and keep the ethnic groupshares of all other inhabitants not living in the Middle Belt area.
Rwanda: CW does not list Hutu and Tutsi as distinct groups but only “Banyuranda”. Recode district shares by using the following population shares: Tutsi=0.15 percent, Hutu=0.85 percent (CIA, 2008), The Twa group (approx. 1 percent is omitted). President Kagame: (Campling, 2008) = Tutsi
Tansania, Ali Hassan Mwinyi: FKL=Zanzibar, missing in CW, code district Zanzibar as 1 and all other districts as 0
Senegal, Abdoulaye Wade: Africa Almanac (2008)
FKL= Fearon, Kasara and Laitin (2007) CW= Cunningham and Weidmann (2008)

57
Appendix 3- 9: Coding of politicization
Country Year Politicization
Benin 1996 1
Burkina Faso 1992, 1998, 2003 0,0,0
Cameroon 1991, 1998, 2004 2,2,2,
Central African Republic 1994 2
Congo, Republic of the 2005 2
Cote d’Ivoire 1994 1
Egypt 1992, 1995, 2000 0,0,0
Eritrea 1995, 2002 0,0
Ethiopia 2000 2
Gabon 2000 2
Ghana 1993, 1998, 2003 0,0,0
Guinea 1999, 2005 1,1
Kenya 1993, 1998, 2003 2,2,2
Lesotho 2004 0
Madagascar 19921997, 2003 0,0,0
Malawi 1992, 2000, 2004 0,1,1
Mali 1995, 2001 2,2
Mauritania 2000 1
Morocco 1992, 2003 0,0
Mozambique 1997, 2003 0,0
Namibia 1992, 2000 2,2
Niger 1992, 1998, 2006 1,1,1
Nigeria 1990, 1999, 2003 2,2,2
Rwanda 1992, 2000, 2005 2,1,1
Senegal 1992, 2005 1,1
South Africa 1998 2
Tanzania 1992, 1996, 1999, 2004
0,0,0,0
Togo 1998 2
Uganda 1995, 2000 1,1
Zambia 1992, 1996, 2001 0,0,0
Zimbabwe 1994, 1999 0,0

58
Chapter 4: The causes of politicization of ethnicity
4.1 Introduction
Why is ethnic identity a politically relevant factor in some countries and absent from the political
sphere in other countries? While in the preceding chapter the political relevance of ethnicity, i.e.
the politicization of ethnicity, was found to significantly and substantially influence educational
outcomes, it remained unclear, under which circumstances ethnic identity emerges as a politically
salient factor in the first place. Besides the empirical evidence in chapter 3, a number of authors
suggest that it is not ethnicity per se but the role of ethnicity in the political process, i.e., the
politicization of ethnicity, which explains social conflict and democratic breakdowns (Gagnon,
1994-1995; Miguel, 2004; Chandra, 2004; and Posner, 2005). Political salience of ethnicity is
linked to increased ethnic favoritism (Posner, 2005; and Chandra, 2004) and to low inter-ethnic
cooperation at the local level (Miguel, 2004). Yet, the question remains why ethnicity emerges as
a politically salient cleavage in one country and remains absent from politics in another. More
precisely, it is still unclear which factors cause the politicization of ethnicity.
While an extensive literature exists that links ethnicity to the emergence of civil conflicts
(cf. Fearon & Laitin, 2003; Collier & Hoeffler, 2004; and Cederman & Girardin, 2007), few
authors have focused exclusively on the question under which circumstances ethnicity emerges as
a politically salient identity. Indeed, factors increasing the likelihood of an ethnic conflict may
differ substantially from factors increasing the political salience of ethnicity.
Evidence on the causes of the politicization of ethnicity is scarce and focuses often on a
country’s ethnic structure, i.e. the number and size of ethnic groups (cf. Barkan, 1994; and
Posner, 2005). Countries with few and large ethnic groups are seen to be naturally endowed with
support groups large enough to win a majority in elections. Hence, these countries are expected to
mobilize voters along ethnic lines, and, thereby, ethnicity emerges as a salient political identity.
On the contrary, in countries with a multitude of small ethnic groups, political parties seem in
need to promote national programs to attract sizable amounts of voters. The ethnic structure
argument is, however, challenged by the political ethnographic literature emphasizing the
ambiguity and contextual character of ethnic identity and thereby repudiating a direct link
between ethnic structures and the usefulness of ethnicity for political mobilization (cf. Schultz,
1984; Widlok, 1996; and Elwert, 2002).

59
Besides the ethnic structure agument, some evidence exists on the importance of nation
building policies to mitigate the political salience of ethnicity (cf. Miguel, 2004). Moreover,
authors report that colonial administrative rules might have influenced the political role of ethnic
identities (Kandeh, 1992; and Fearon, 2006). Yet, a comprehensive discussion of other relevant
explanatory factors of the politicization of ethnicity and the interrelation between these factors is,
so far, lacking.30
This chapter, therefore, poses the question, which factors influence the political salience
of ethnicity. In particular, the often voiced notion of the role of ethnic structure for the political
salience of ethnicity is reassessed using detailed information on ethnic support bases of
politicians. In addition, this chapter explores other factors that might have influenced the
politicization of ethnicity, namely the colonial administrative approach, land distribution, and
nation building policies. More precisely, the study compares the case of a highly politicized
country, Kenya, to a country with low politicized ethnicity, Tanzania. In these two cases, the
evolution of the politicization of ethnicity is traced through the colonial period and the post-
independence period by drawing on extensive archival material on ethnic groups, historical
secondary sources and expert interviews.
This chapter is organized as follows. Section 4.2 describes the case selection, and the
methodological approach of process tracing and comparative case study used to analyze the
politicization of ethnicity. The reassessment of the ethnic structure argument and the examination
of colonial rule, land distribution and nation building policies are presented in section 4.3. In
particular, evidence from Kenya and Tanzania challenges the role of the structure of ethnic
groups and confirms the importance of historical factors. More precisely, colonial rule, land
distribution and nation building policies are found to strongly influence the politicization of
ethnicity. In addition, in section 4.4 the interrelation between these three factors is discussed, as
colonial rule is seen to have influenced land distribution and nation building policies. In
particular, two critical moments when actors had the opportunity to shape the politicization of
ethnicity are identified in this section. Last, conclusions are provided in section 4.5.
30 Note that there exits also studies that attempt to explain politicization of ethnicity by economic modernization. However, as Fearon (2006; 7) argues, economic modernization is a slow-moving variable and, therefore, not able to explain rapid politicization of ethnicity after the independence of the African countries.

60
4.2 Case selection and methodology
To assess the causal factors leading to the politicization of ethnicity, this chapter uses
comparative case studies and process tracing. Using in-depth case studies helps to explore in
greater detail the underlying causes of politicization of ethnicity. As argued in section 2.2.3, this
chapter relies on Przeworski and Teune’s (1982) “most similar design”. Kenya and Tanzania
were selected as two cases with similar characteristics on the independent variable but different
values for the dependent variables. In particular, these two countries are former British colonies,
became independent in the 1960s, formed single-party independence governments and
transformed to multiparty systems in mid 1990s. In addition, the two countries are both
presidential republics with proportional vote, and have a similar geography (see graph 2, section
2.2.3 for a depiction of the location of Kenya and Tanzania). In addition, Table 6 depicts
comparative data of important socio-economic indicators for Kenya and Tanzania for the earliest
available data (1960) and most recent data (2006). Unfortunately, comparable data on the
economic activities in Tanzania around 1960 is not available. However, from the indicators on
population and health, Kenya and Tanzania seem very similar, both in 1960 and 2006.
Table 6: Important socio-economic indicators for Kenya and Tanzania, 1960 and 2006
1960 2006
Kenya Tanzania Kenya Tanzania
GDP per capita (constant 2000 US$)
260.87 - 440.09 334.56
Household final consumption expenditure per capita (constant 2000 US$)
243.97 - 344.03 212.16
Population, total 8114687 10072047 36553490 39458709
Population ages 0-14 (% of total) 46.55 45.84 42.63 44.37
Population growth (annual %) 3.08 2.89 2.65 2.52
Life expectancy at birth, total (years)
46.69 43.73 53.44 51.89
Fertility rate, total (births per woman)
8.00 6.80 4.97 5.26
Death rate, crude (per 1,000 people)
19.94 20.45 12.07 13.23
Hospital beds (per 1,000 people) 1.25 1.49 - -
Physicians (per 1,000 people) 0.09 0.05 - - Source: World Bank (2008) Note: 1960 is the earliest year for which data is available. Data on literacy rates and total GDP around 1960 is not available.

61
At the same time, these two countries differ strikingly on the dependent variable of the analysis,
namely the politicization of ethnicity. While Kenyan politics is strongly divided along ethnic
lines, ethnicity seems invisible in Tanzanian politics. An analysis of the 2007 general election in
Kenya describes the voting pattern as a mere ‘ethnic census’ (Bratton & Kimenyi, 2008). Parties
are found to draw their support from distinct and separated ethnic groups.31 President Kibaki’s
Party of National Unity (PNU) was mainly supported by the Kikuyu, Embu and Meru ethnic
group. The Orange Democratic Movement (ODM), which combined several opposition groups,
was headed by Raila Odinga and was supported by Luo, Luhya and Kalenjin ethnic group.
In contrast, ethnic identity seems largely absent from the political sphere in Tanzania.
Widely cited evidence emphasizes that the majority of Tanzanians identify themselves with
occupational categories (76 percent) rather than with ethnic categories (3 percent) (Afro-
Barometer Network, 2002; 38). Furthermore, closer examination of foundation bases of parties
and party manifestos reveals that parties in Tanzania do not instrument ethnic symbols or ethnic
language to attract specific groups of voters (NCCR MAGEUZI, 2000; Tanzanian Labour Party
(TLP), 2000; Civic United Front (CUF), 2000; and Chama Cha Mapinduzi (CCM), 2000).
The causes for this strikingly different politicization of ethnicity in Kenya and Tanzania are
assessed by using the approach of process tracing (cf. George & Bennett, 2005; 205-232). This
research method is particularly suitable to identify underlying causal paths through which
specific outcomes were generated. This chapter traces the evolution of politicization of ethnicity
in Kenya and Tanzania by using detailed historical narratives accompanied with case-specific
causal arguments to contribute to a more general understanding of the causes of politicization of
ethnicity and to postulate future research avenues based on the factors identified in the
comparative case studies (George & Bennett, 2005; 211). In particular, the case studies assess the
development of the politicization of ethnicity starting when Kenya and Tanzania (by that time
called British East Africa and German East Africa, later Tanganyika)32 came into existence as
geographical and political entities at the turn of the 20th century. The analysis focuses primarily
on the colonial period and the post-independence government in both countries, since these
31 The unfortunate eruption of ethnic clashes after the 2007 general election provides additional evidence for the ethnic support bases of political parties. An overview over the support base of parties can be found in Makolo (2005, 25) and Chweya (2002, 96-97). 32 Note that the United Republic of Tanzania came only into existence in 1964 when the mainland of Tanzania (then called Tanganyika) formed a union with Zanzibar.

62
decades are considered to have laid the foundation of the perception of ethnic identification and
to have influenced the course that politics took after these decades.
To include all relevant aspects of politicization, this study draws on a variety of sources.
Extensive archival material was combined with historical secondary sources and results were
corroborated with interviews conducted with local experts. In a first step, the study relies on
government reports, population census data, party manifestos and historical accounts of the
colonial history, the independence movement, and the post-independence government period in
Kenya and Tanzania. From these documents, three different explanatory factors of the
politicization of ethnicity were identified, namely the role of colonial rule, land distribution, and
nation building policies.
In a second step, experts in Kenya and Tanzania were questioned on their opinion on the
potential causes of politicization of ethnicity and on suggestions for further sources of
information. Complementing the existing information from compiled archival material and
historical secondary sources with experts’ knowledge seems particularly important in an
environment where documentation on important political events is limited or inaccessible. Hence,
the expert interviews served three critical goals. First, interviewees helped to review the list of
potential causes of politicization of ethnicity derived in the first step. Second, through the
interviews, information established from the archival material and historical sources could be
corroborated and underlying causal path understood more clearly. Third, the interviews helped to
prioritize the collected archival and historical material and to access hitherto unknown sources.
Sampling of the local experts was designed to include persons with access to knowledge
about the historical factors causing the politicization of ethnicity in Kenya and Tanzania. In
particular, this analysis followed a purposive sampling method (cf. Judd et al., 1991) and in later
stages used a chain-referral sampling method to identify further potential experts (cf. Babbie,
1992). In the first step, relevant experts were selected according to their expertise. In a second
round, these experts were asked to identify individuals that may contribute to the research but
have not been included in round one of the sampling process. The chain-referral method was
particularly helpful in overcoming the very high costs of finding the rare experts in the two field
locations. Note that the chain-referral sampling methods might produce a bias since the method
reduces the likelihood of receiving a representative sample. Therefore, this sampling method was
used after the purposive sampling methods and only employed to generate additional experts

63
apart from the initial ones identified with the purposive sampling method. Thereby, these
methods are seen to have generated a most complete list of experts and to have mitigated
potential omission variable bias. In particular, the interviewees’ field of expertise included
history, cultural anthropology, political science, conflict studies, and development economics,
and interviews were carried out between October 2008 and June 2009 by the author. In Tanzania,
interviews were conducted with five senior researchers from the university, two senior
government officers and one representative of a local NGO. In Kenya, questions were directed at
four representatives of local NGOs, one senior researcher from the university, one senior
government officer and one representative of an international development organization.
Appendix 4-1 depicts the organization and area of expertise of the interviewees. Open questions
were posed on experts’ opinions on possible causes of politicization of ethnicity in today’s
politics in Kenya and Tanzania and interviews were transcribed into memory minutes (interview
protocols are depicted in Appendix 4-2).33 The interviews were analysed separately for Kenya
and Tanzania employing Gläser and Laudel’s (2009a) methodology and their “collection of
macros for qualitative content analysis” (MIA) program.34 In a first step, statements from the
memory minutes were extracted and categorized using the four different factors: ethnic structure,
colonial rule, land distribution, and nation building policies. These four categories were identified
as relevant in the existing literature on ethnic structures, colonial rule and nation building policies
and through the frequent statements by interviewees on the relevance of land distribution
policies. The information from the extraction tables was, then, compiled in four extraction tables
retaining the source (see Appendix 4-3). In a second step, experts’ statements were categorized
into various sub-topics of the four different factors in thematic summary tables (see Appendices
4-4 – 4-7). In the last step, the arguments depicted in the thematic summary tables were
compared to the results drawn from the archival material and the historical sources, and
information from the interviews was included in the analysis of the chapter.
33 The interviewer decided to take notes while interviewing and to transcribe these notes into complete memory minutes immediately after the interview. While recording of interviews and transcription of the recordings might be superior to memory minutes in studies interested in “how” things were said, this anlaysis is particularly concerned with the collection of information on potential factors of politicization. In addition, taping interviews is hardly practicable when posing questions on politically sensitive issues such as ethnicity and political relevance of ethnicity. Interviewees might feel intimidated when their answers are recorded and might decide to leave out critical or deviating information (cf. Gläser & Laudel, 2009a; 157). 34 MIA is an open source program provided by Gläser and Laudel (2009b). For a detailed description of content analysis of interviews and extraction tables see Gläser an Laudel (2009a; 197-260).

64
4.3 Tracing the causes of politicization of ethnicity
The following sections trace the causes of politicization of ethnicity by examining the impact of
the four identified factors, namely (1) ethnic structures, (2) colonial history, (3) land distribution,
and (4) nation building policies. While the latter three factors, i.e. colonial administrative rule,
land distribution, and nation building policies, are likely to be interlinked, these factors are
discussed separately in this section. The interrelation between these factors and two critical
moments depending on the colonial rule and land distribution policies are, then, identified in
section 4.4.
4.3.1 Revising the ethnic structure argument
The most often voiced argument why ethnicity is a politically salient factor in a country refers to
the country’s ethnic structure, i.e. the number and size of ethnic groups (cf. Posner, 2005; and
Barkan, 1994). A politician is seen to build his support base from specific ethnic groups and to
distribute resources that he accessed through his political position to his co-ethnics. The ethnic
group that forms the support base must, therefore, be large enough to constitute a winning
majority. More precisely, Bates (1983; 164-165) describes ethnic groups as “a form of minimum
winning coalition, large enough to secure benefits in the competition for spoils but also small
enough to maximize the per capita value of these benefits”. The argument of a minimum winning
coalition seems to link a country’s ethnic structure to its politicization of ethnicity. In countries
inhabited by few and large ethnic groups, politicians might attract a winning majority by
focussing exclusively on one ethnic group. However, in countries with a high number of small
ethnic groups, politicans are unable to mobilize supporters on the bases of ethnicity and might,
therefore, decide to focus on broader national programs to form a winning majority.
This simple rule of thumb, however, relies on static ethnic structures and well defined
ethnic grouping characteristics. It, thereby, neglects the ambiguity and formability of the structure
of ethnic groups (cf. Schultz, 1984; Widlok, 1996; and Elwert, 2002). While ethnic groups seem
like homogenous and distinct entities within a greater nation state, most ethnic groups might be
deliberately re-grouped both into smaller sub-tribes and also into a larger super-tribe.
The following paragraphs will trace the impact of ethnic structure on the politicization of
ethnicity in Kenya and Tanzania. It seems particularly relevant not only to consider the overall
ethnic structure and the ethnic support bases chosen by politicians but also the potential for ethnic

65
mobilization in a country. Table 7 provides an overview over the development of the population
shares of the various ethnic groups in Kenya and Tanzania.
The overall ethnic structure in Kenya and Tanzania seems indeed to differ substantially
with Kenya being populated by few and large ethnic groups and Tanzania by a multitude of small
ethnic groups (cf. Barkan, 1994; 10). However, a closer look at the ethnic support bases in Kenya
and Tanzania challenges the relevance of ethnic structures for the political salience of ethnicity.
Some Kenyans seem convinced that if their first president, Jomo Kenyatta, had come
from a small ethnic group, like Tanzania’s President Nyerere, instead of coming from the large
ethnic group (Kikuyu), the politicization of ethnicity in Kenya would have been substantially
lower (Appendix 4-4, Kenya, 1.1 and 2.; and Tanzania, 1.1). President Nyerere is argued to have
pursued programmatic politics since his own ethnic group – the Zanzaki – were too small to build
a minimum winning coalition. While it is argued that the Zanzaki ethnic group was too marginal
to be used as an ethnic support base, evidence from Kenya challenges this view. In particular, the
ethnic group of Kenya’s President arap Moi – the Tugen - is of similar size as the Zanaki (see
Table 7, shaded rows). Both ethnic groups are negligible with population shares below 1.5
percent. 35 Most interestingly, President Moi used his ethnic group to mobilize voters by
constructing the super-tribe Kalenjin out of Tugen’s cousin ethnic groups. After President
Kenyatta’s era in 1987, President arap Moi came to power supported by the Kalenjin ethnic
group. However, before the electoral campaign of President Moi, the Kalenjin ethnic group was
non-existent (see Table 7, shaded rows). To build a strong support base, Moi deliberately united
several smaller ethnic groups and created what is now called the Kalenjin tribe (Kiondo, 2001;
260-261). Five distinct ethnic groups, the Nandi, Kipsigis, Elgeyo, Marakwet, and Pokot, were
united with Moi’s Tugen ethnic group to form the greater Kalenjin ethnic group (Ogot, 2005;
290). Evidence on the re-grouping of smaller tribes into the larger Kalenjin tribe is also supported
by the expert interviews (Appendix 4-4, Kenya, 1.2). In particular, experts argue that Moi
combined the tribes in the greater Kalenjin super-group starting when he was Member of
Parliament in the Riftvalley and tried to mobilize voters. Moreover, experts explain the use of the
five groups by pointing to the similar language of these groups.
35 The Tugen constitute around 1.3 percent of the Kenyan population and the Zanaki constitute around 0.3 percent of the Tanzanian population (United Republic of Tanzania, 1971; and Kenya, 1964).

66
Table 7: Population shares of ethnic groups in Kenya and Tanzania
Kenya Tanzania
Ethnic group 1962 1969 1979 1989 Ethnic group 1967
Kikuyu 19.628 20.120 20.897 20.779 Sukuma 13.325
Meru 5.258 5.065 5.484 5.073 Nyamwezi 3.536
Embu 1.143 1.078 1.177 1.197 Makonde 4.147
Luo 13.726 13.905 12.761 12.376 Chagga 3.834
Luhya 12.986 13.281 13.830 14.378 Haya 3.591
Kamba 11.155 10.945 11.258 11.417 Ha 3.336
Kisii 6.435 6.412 6.160 6.148 Hehe 3.141
Mijikenda 4.959 4.757 4.781 4.698 Gogo 3.137
Turkana 2.168 1.857 1.352 1.323 Nyakyusa 2.672
Masai 1.842 1.416 1.575 1.759 Sambaa 2.365
Ogaden 1.454 0.824 0.167 0.651 Luguru 2.242
Kalenjin 0.052 0 10.780 11.463 Bena 2.194
Tugen 1.311 1.190 0 0 Zanaki 0.309
Pokot 0.915 0.854 0 0 Turu 2.145
Nandi 2.033 2.394 0 0 Zaramo 1.983
Marakwet 0.800 0.728 0 0 Yao 1.780
Elgeyo 1.206 1.014 0 0 Iragw 1.729
Kipsigis 4.085 4.308 0 0 Iramba 1.689
Hawiyah 1.009 0.037 0.010 0.127 Zigua 1.616
Taita 0.999 0.991 0.999 0.948 Pare 1.593
Iteso 0.865 0.784 0.864 0.832 Mwera (L) 1.583
Boran 0.697 0.311 0.449 0.374 Fipa 1.414
Samburu 0.583 0.501 0.480 0.499 Makua 1.408
Kuria 0.501 0.547 0.582 0.523 Rangi 1.308
Tharaka 0.460 0.474 0.063 0.431 Jita 1.304
Mbere 0.456 0.450 0.403 0.471 Luo 1.173
Gurreh 0.414 0.450 0.542 0.373 Kuria 1.076
Pokomo/Riverine 0.363 0.322 0.259 0.273 Rundi 0.998
Sabaot 0.335 0.388 0.000 0.000 Kaguru 0.991
Ajuran 0.238 0.142 0.144 0.126 Ngindo 0.986
Nderobo 0.172 0.192 0.047 0.000 Ngoni 0.913
Rendille 0.164 0.171 0.142 0.124 Pangwa 0.873
Orma 0.139 0.149 0.210 0.212 Matengo 0.838
Gabbra 0.137 0.147 0.199 0.167 Kinga 0.832
Bajun 0.135 0.223 0.241 0.257 Sumbwa 0.801
Swahili/Shirazi 0.103 0.091 0.037 0.065 Pogoro 0.799
Other Somali 0.089 0.243 1.016 0.210 Arusha 0.783
Gosha 0.087 0.027 0.012 0.010 Ndali 0.740
Taveta 0.058 0.058 0.050 0.067 Nyiha 0.723
Boni/Sanye 0.057 0.036 0.027 0.051 Safwa 0.700
Njemps 0.056 0.060 0.049 0.074 Masai 0.694
Sakuye 0.020 0.040 0.012 0.050 Rufiji 0.679
Dorobo 0 0 0 0.114 Ndengereko 0.591
Degodia 0 0.589 0.607 0.468 Nguu 0.566
Basuba 0 0 0.389 0.503 Nyasa 0.546
El Molo 0 0 0.004 0.017 Matumbi 0.528
Bulji 0 0 0 0.028 Other (<0.5%) 14.530
Dasnachi-Shangil 0 0 0 0.002 Source: United Republic of Tanzania, 1971; Kenya, 1964; Republic of Kenya, 1970, 1981, and 1994 Note: Numbers depicted in the table are percent of total population.

67
In addition, referring to the population census data in Table 7, it can be shown that in the
earliest censuses (1962 and 1969), the six Kalenjin sub-groups appeared separately and with none
of them exceeding five percent of the total population. While the 1962 census lists some 0.052
percent of Kenyans identifying themselves as Kalenjin, this ethnic category does not even appear
in the 1969 census. However, the census, which preceded President Moi’s election, records a
jump from zero to 10.78 percent of Kalenjin membership, while the Nandi, Kipsigis, Elgeyo and
Marakwet disappeared from the list of ethnic groups in Kenya (see Table 7, shaded rows). In the
most recent available census, the Kalenjin ethnic groups appear as the third largest ethnic group
in Kenya.36
A second example for a deliberate re-grouping of ethnic subgroups comes from Kenya’s
first and third president, Kenyatta and Kibaki. These presidents are members of the Kikuyu
ethnic group. However, the Kikuyu are not sufficiently large to constitute a winning majority by
themselves. The census data from 1989 in Table 7 shows that only 21 percent of the Kenyan
population identify themselves as being Kikuyu. To attract a winning majority, the Kikuyu
politicians used various Kikuyu’s cousin ethnic groups, namely the Embu and Meru to form a
greater support base (the Gikuyu, Embu, Meru Association (GEMA); Ogot, 2005; 338)37 38. Only
after the inclusion of the Embu and Meru into the wider super-tribe GEMA, did this ethnic
support base add up to around 27 percent of the total population (see Table 7, shaded rows).
Besides the described examples of the construction of the Kalenjin and GEMA, other
large ethnic groups in Kenya, such as the Luhya and the Mijikenda were artificially created by
combining several smaller groups in the population censuses (Makoloo, 2005; 11). In addition,
researchers argues that even more ethnic groups, such as the Maasai and Samburu (both Maa
speakers) have the potential to unite to become politicially noticeable (Ogot, 2005; 291).
Examining Tanzania, the potential for regrouping various smaller ethnic groups and, thereby,
creating a minimum winning majority seems similar to the situation in Kenya. In particular, the
Tanzanian expert in the field of cultural anthropology reports that there exists an ethnic identity
36 The most recent population census data from 1999 (Republic of Kenya, 2001) could not be used since the shares of the ethnic groups were not published due to the argument that information on ethnic groups has been repeatedly misused (Makoloo, 2005; 11). 37 More insights into the working and the political ambitions of GEMA can be found in Karimi and Ochieng (1980; chapter 5). 38 Note that also the smaller cousin ethnic groups have been reorganized by the colonial powers from smaller sub-tribes The British government created an Embu district comprising the sub-tribes Embu and Mbeere (Ogot, 2005; 279-280). Through this administrative demarcation a new tribe, Embu, was ‘invented’.

68
in Tanzania that is large enough to build a large political support base (Appendix 4-4, Tanzania,
1.2). More precisely, he explains that the Sukuma and Nyamwezi, which are reported as distinct
ethnic groups, are in fact cousin ethnic groups speaking a common language (called Sukuma and
Nyamwezi respectively). Hence, the expert argues, these two groups could be mobilized on the
bases of their common language and united into a larger super-tribe that would constitute about
one fourth of the total population (see Table 7, shaded rows). Most interestingly, this group
would be as large as the Kikuyu in Kenya – who have been repeatedly declared the largest group
in Africa.39 In addition, the Tanzanian expert provides a multitude of examples in which the
ethnic grouping labels employed in the population census are distorted. The Chagga are reported
as one ethnic group, but consists, indeed, of different ethnic tribes, such as the Rombo. In
addition, the Maasai subsumes approximately 10 different tribes and the Zaramo consist of three
different tribes. Moreover, the Pare group, which is listed in the census as one group, subsumes
two groups with distinct languages. Last, the Rufiji and Ndengereko, which are listed separately
in the census, can, in fact, be considered as one group.
This evidence from Kenya and Tanzania challenges the argument that the potential use of ethnic
groups for political support bases is different in Kenya and Tanzania. In particular, the evidence
on the similar size of Kenya President Moi’s and Tanzania President Nyerere’s ethnic group and
the potential to build a minimum winning ethnic coalition from the Nyamwezi and Sukuma group
in Tanzania demonstrates that ethnic groups can be deliberately regrouped into sufficient support
bases. Hence, one can conclude that the ethnic structure in Kenya and Tanzania is not sufficient
by itself to determine the politicization of ethnicity.
This leaves the question which factors trigger the use of ethnicity in politics. The
following paragraphs will, therefore, explore various other factors that might have contributed to
the divergent politicization of ethnicity in Kenya and Tanzania, namely the colonial
administration (3.2), land distribution (3.3) and nation building policies (3.4).
39 The Kikuyu constitute 20 percent of the total Kenyan population (Republic of Kenya, 1994) and the Nyamwezi plus Sukuma constitute 17 percent of the total Tanzanian population (United Republic of Tanzania, 1971).

69
4.3.2 The colonialist’s burden: divide and rule
The degree of ethnic animosities existing in Tanzania and Kenya can be traced back to the
administrative approach used by the colonial rulers to govern these two countries. Although these
two countries share a common period of colonization by the British, colonialist’s attention was
focused primarily on Kenya as the center of the East African development (Barkan, 1994; 12).
Therefore, measures were taken to build up a strong agricultural export sector which involved the
expropriation of Kenyan farmers (discussed in section 4.3.3) and the prevention of the Kenyan
population to unite against the colonial rules. Tanzania, on the other hand side, received only
little colonial attention and was merely governed as a byproduct of the major project in Kenya.
The British administration in Kenya followed the ‘divide and rule’ policy. To facilitate
administration, the British rulers set out to divide the population and create ethnically
homogenous entities. Through this policy, formerly fluid and contextual ethnic identities were
frozen and tribes were deliberately ‘invented’. The aim was to create “self-sufficient, closed,
static and homogenous linguistic and ethnic units” (Ogot, 2005; 267). For example, by
deliberately combining the settlement area of the culturally and physically distinct Tigania,
Igembe, Imenti, Miutini, Igoji, Mwimbi and Muthambi tribes into a greater district, the British
administration invented the Meru ethnic group (Ogot, 2005; 280).
In addition to the clear demarcation between ethnic entities, the British colonialists settled
Europeans in between neighboring ethnic entities to effectively prevent inter-ethnic cooperation.
As Ogot (2005; 268) argues this policy increased ethnic consciousness through the feeling of
exclusiveness. The creation of closed and cut off ethnic units enabled the British colonialists to
effectively rule the Kenyan population without having to fear a united resistance. Attempts of
Kenyans to organize a cross-ethnic resistance, for example in the East African Association, were
immediately banned by the colonial rulers stating that they would only allow an association with
members from one ethnic group (Voll, 1995; 279). Through the prohibition to organize
nationally, the Kenyan population was left with the option to develop locally restricted ethnic
asscoiations (Chweya, 2002; 91). Thereby, ethnic nationalism was encouraged and the foundation
for today’s ethnic representation in politics sown by the British administration.
Experts’ opinions on the colonial approach support the critical role of the colonial ruler on
the political salience of ethnicity (Appendix 4-5, Kenya, 1. and 2.). While some experts qualify
the colonialist’s relevance by referring to pre-colonial ethnic clashes, there is strong agreement

70
by the experts that the colonial rulers instrumented ethnicity for their purposes and intentionally
segregated ethnic groups to prevent them from uniting against the colonial ruler.
In Tanzania, however, the colonial rulers used a different administrative approach. The country
came under British colonial administration only after the end of the First World War, and until
then, was ruled by the German colonial administration. While the Germans attempted to classify
the Tanzanian population into different ethnic groups, their approach was less vigorous than
Britain’s approach in Kenya. Information on different tribes was collected and the German
administration strove to maintain relatively homogenous ethnic entities (Jerman, 1997; 188).
However, these ethnic entities were not governed by local ethnic leaders but by African agents,
the so-called maakida, mostly well-educated Muslims from the coastal area who spoke Swahili
(Tripp, 1999; 38). The imposition of these foreign Tanzanian leaders governing the population
entities that spoke a different vernacular hindered the development of strong ethnic consciousness
as arisen in Kenya. After World War I, the mandate to administer today’s Tanzania was conferred
on the United Kingdom. As Jerman (1997; 262) describes the following phase in the Tanzanian
colonial history, the British colonial rulers sought to replace the maakida by local ethnic leaders
because the maakida were seen to have “accelerated the disintegration of ‘tribal customs’”. In
addition, the fight by the Tanzanian population against the German colonial oppression
(including the Maji Maji rebellion in 1905-1907) was seen to have increased national instead of
distinct ethnic feelings. The British colonial rulers, therefore, tried to reverse this trend by
creating distinct ethnic entities and by imposing local ethnic leaders. However, even within the
British administration, several opposing opinions existed about how administrative structures
should be implemented. In this respect, Tanzania benefited from the experience of British
colonial rulers in Kenya. For example, Charles Dundas, the Secretary for Native Affairs,
advocated regional instead of ethnic-based administrative boundaries. With reference to Graham
(1976; 5), Jerman (1997; 227) explains Dundas’ behavior by “his long experience in East
Africa”. In addition, “Dundas called for the development of village and regional policies rather
than the scientifically advocated creation of ‘tribes’” (ibid).
Besides the longer and more intense colonial experience in Kenya than in Tanzania, the
two countries also differed in their strategic importance for Britain. Kenya was meant to develop
as the economic center of East Africa, and policies were implemented to guarantee that white
settlers were granted access to land and provided with sufficient infrastructure. Since the Kenyan

71
population had to bear the costs of these policies, the British administration undertook measures
to ensure that they would not unite and rebel against the colonialists. Conversely, Tanzania was
home to only few European settlers demanding relatively little infrastructure. Since the
Tanzanian population was not burdened with heavy costs, there was less need to oppress them
systematically. This led to the formation of regional and national associations comprising various
ethnic groups, such as the Mbeya District Original Tribes Association and the Kuria Union
emerged (Tripp, 1999; 39). Most importantly, the roots of the nationalist movement in Tanzania
lay in the Tanganyika African Association, a truly national association uniting all ethnic groups.
Tanzanian experts only rarely mentioned the relevance of the colonial rule on political
salience of ethnicity (Appendix 4-5, Tanzania, 1). This might in itself provide evidence for the
negligible impact of colonial administration on politicization of ethnicity in Tanzania.
Information derived from an interview with a Kenyan expert, indeed, supports the relatively low
strategic role of Tanzania for the British colonial rulers, which translated in less fierce
administrative measures and more freedom to mobilize across ethnic identities.
Comparing the colonial history and the administrative policies enacted in Kenya and Tanzania, it
seems that colonial rulers laid the foundation of strong ethnic consciousness in Kenya and
reduced ethnic consciousness in Tanzania.
4.3.3 Ethnic grievance over unequal land distribution
Much of the grievance that is at present felt in Kenya against the Kikuyu, President Kibaki’s
ethnic group, stems from the deep-rooted conviction that after independence the Kikuyus were
unrightfully allocated land to. The majority of the ethnic violence after the election in 2007 broke
off precisely in the areas where Kikuyus were resettled after the independence (Konrad Adenauer
Foundation, Dialogue Africa Foundation Trust, 2009; 58-65). Scholars support the notion that
ethnic tensions stem from unequal wealth distribution (cf. Gurr, 1970). In particular, consumption
of wealth by one ethnic group and exclusion from prosperity of other tribes is viewed to increase
the consciousness of one’s own ethnic identity. In agricultural societies, such as Kenya and
Tanzania in the 20th century, access to wealth was mainly achieved through access to land and
farming. Hence, unequal distribution of land is seen to increase the likelihood of ethnic conflicts
and the pronouncement of ethnic identities (Amisi, 2009; 23).

72
The two countries, Kenya and Tanzania, exhibit very divergent patterns concerning land
distribution. While Tanzania followed a socialist approach resulting in equal access to land,
Kenya experienced a period of expropriation and redistribution of land.
Kenya became British protectorate in 1895. Shortly after the establishment of the
protectorate and the readjustment of the borders between Kenya and Uganda, British colonialists
started expropriating the Kenyan population of the most fertile lands and distributing this land to
white settlers. Land was distributed to European settlers to build up economic prosperity through
a strong export sector of agricultural products (Low, 1965; 22). The then called ‘white highlands’
were traditionally inhabited by the Kikuyu ethnic group but also populated by nomadic groups,
such as the Kalenjin, Maasai, and Turkana (Wamwere, 2008; 20). 40 After Kenya became
independent, white settlers left the country and sold their farms to the Kenyan state. Many of the
Kikuyu, who were originally chased off their land, took this opportunity and bought former white
farms. Unfortunately, some of the farmland the Kikuyus bought was formerly property of the
Kalenjin or the Maasai, especially farmland in the Riftvalley.41 As a consequence of the Kikuyu
dominance of land buyers and the resulting re-settlement in formerly predominantly Kalenjin
areas, ethnic animosities between the Kikuyu and other ethnic groups increased (Barkan, 1994,
11). In addition, through the possession of fertile farm land, the Kikuyus had the means for
political mobilization and consolidated their domination in the political sphere.
Information derived from expert interviews supports the critical role of land distribution
on the politicization of ethnicity (Appendix 4-6, Kenya). In particular, President Kenyatta is seen
to have supported the settlement of Kikuyu after the independence in former Kalenjin areas (the
Riftvalley) and experts relate the ethnic clashes that erupted after the election in 2007 to this
40 Other sources state that the land taken amounted to only 10 percent of the total land owned by the Kikuyu (cf. Middleton, 1965; 340). However, these 10 percent were the most fertile and suitable for coffee production. Furthermore, Middleton (1965) points to another explanation of Kikuyu’s land grievance. He argues that “the drawing of a boundary round the land occupied by the Kikuyu at the turn of the century, and calling it a reserve meant that there was no room to expand into the many almost unused areas to the west and south” (Middleton, 1965; 340). In addition, local experts report that the Maasai were relocated from Riftvalley to Lakipia and that former pastoralist areas were transformed into national parks in the post-independence period (Appendix 4-6, Kenya, 1. and 2.) 41 The debate whether Kikuyus rightfully bought land is still prevailing in today’s Kenyan discourse. Some see pure ethnic favoritism by Kenya’s first president Jomo Kenyatta in the dominance of Kikuyu buyers of white farmland. Others argue that only a small elite of Kikuyus was provided with farm land and that the vast majority of Kikuyus struggled hard to raise funds to buy the land (Wamwere, 2008; 15). However, the dominance of Kikuyus buyers might be explained by a combination of several factors. First, Kikuyus have traditionally been farmers and, hence, strove to own farm land (cf. Middleton, 1965; 339). Second, the proximity of Kikuyus to missionaries and their work on white farms exposed them earlier than other African tribes to capitalist values. According to the Kenyan Section of the International Commission of Jurists (2008; 90), this early exposure to capitalism led to the founding of unions which supported the land pruchases of the Kikuyu.

73
settlement pattern (Appendix 4-6, Kenya, 2 and 3.). In general, the experts argue that unequal
access to resources is strongly related to increased politicization of ethnicity (Appendix 4-7,
Kenya, 5.b)).
The development in Tanzania followed a very different path. The first factor contributing to the
divergent development is that British colonialists had only a minor interest in the Tanzanian
agricultural production (Brett, 1973). In contrast to the expropriation of Kenyan population and
the redistribution of land to white settlers, the British administration in Tanzanian felt that “the
first duty of the Government was to the native” (Brett, 1973; 224). While Kenyans were not
allowed to grow cash crops, but urged to work on Europeans’ farms to be able to pay heavy
taxes, Tanzanian farmers were explicitly encouraged to cultivate cash crops. Through the
existence of the Tanzanian farmers who were supported by the British administration, Tanzania
was less interesting for European farmers than Kenya. Therefore, compared to Kenya, only few
Europeans settled in Tanzania. This freed the Tanzanian post-independence government of the
need to re-distribute land to the population.
A second important factor to the equal land distribution was President Nyerere’s quest for
ujamaa (Swahili for familyhood). Julius Nyerere formulated a socialist vision for Tanzania,
which comprised the much disputed villagization policy of establishing ujamaa villages (Nyerere,
1966a). Formerly the Tanzanian population lived in relatively scattered clusters, which made it
difficult for the government to provide these clusters with basic infrastructures (such as education
and health facilities). Nyerere’s administration set out to build villages with appropriate
infrastructure and communal farm land and, then, to regroup the population into these larger
villages. Nyerere’s intention was to create self-supporting entities. The majority of the population
resisted this policy, since they didn’t want to leave their own farms. However, through forced
resettlements, by 1976 almost 80 percent of the Tanzanian population was living in ujamaa
villages (Barkan, 1994; 20). Although almost all scholars agree that the policy of ujamaa set the
wrong incentives for economic growth, its effects on equal land distribution seem favorable. No
ethnic group was favored in the redistribution of land. In addition, areas that produced cash crops,
such coffee and tea, where heavily taxed and these revenues where used to support areas with
lower production outputs (Barkan, 1994; 23).
The Tanzanian experts made repeated reference to Nyerere’s policies, especially his focus
on national unity (discussed at length in section 4.3.4.) and the introduction of socialism but did

74
not make direct statements on the relevance of land distribution policies on political salience
(Appendix 4-6, Tanzania). This might again confirm the evidence that redistribution of land after
the colonial rule was widely perceived as being of minor importance.
Furthermore, the differing colonial land distribution in Kenya and Tanzania had important
consequences for the independence movement in the two countries. Due to the numerous
expropriations of the Kikuyus in Kenya, this ethnic group was the first to rebel against colonial
authority. Kenya’s independence movement started off as a primarily Kikuyu nationalist
movement with the Kikuyu organization, the Mau-Mau. This organization initially demanded a
change of the land laws that favored the white settlers but soon fought for liberalizing Kenya
from the colonial rulers (Krabbe & Mayer, 1991). This firmly set apart the Kikuyu from other
ethnic groups and contributed to the ethnic nationalism in Kenya. In Tanzania, however where
the oppression by the colonial rulers was felt evenly by the population, the independence
movement was supported by all ethnic groups. The Tanganyika African Association (TAA) was
founded as nationalist movement with cross-ethnic members (Tripp, 1999; 40).
Comparing the land distribution in Kenya and Tanzania provides evidence that unequal access to
land in Kenya increased ethnic animosity whereas equal access to resources in Tanzania
promoted peaceful co-existence of ethnic groups.
4.3.4 Nation building policies
Besides the colonial history and the land distribution, specific nation building policies envisioned
primarily by Tanzanian’s first President Julius Nyerere, and the lack of such policies in Kenya
influenced the politicization of ethnicity in the two countries. This section will present arguments
on the impact of the two most important nation building policies on the politicization of ethnicity,
namely (1) the promotion of Swahili and (2) the quota system in the education sector.
(1) The promotion of Swahili
The national language of Kenya is Swahili. However, compared to its neighboring country
Tanzania, Swahili is used to a lesser degree. In Kenya, Swahili is competing with the official
language English and a multitude of vernacular languages, such as Kikuyu, Kalenjin, Dholuo,

75
and Kikamba. The weak promotion of Swahili in Kenya might be rooted in the colonial history
and the post-independence language policies. Education policies during the colonial period
insisted on the use of local vernaculars as the language of instruction. Thereby, the Kenyan
population was effectively denied a common language to communicate and organize nationally
(which was part of the ‘divide and rule’ policy of the British colonials, see section 4.3.2)
(Ochieng', 1972; 258, cited in Voll, 1995; 263). In the post-independence period, the Kenyan
government placed more emphasis on the use of local vernaculars and English than of Swahili.
Kenyan experts provide further evidence for the use of vernaculars in the education system
(Appendix 4-7, Kenya, 2.). The Kenyan education policy foresaw that teachers use local
vernaculars for instruction in primary schools and Swahili and English in secondary schools
(Appendix 4-7, Kenya, 2.). Although Swahili was taught in primary schools as a subject it was
not considered important enough to be included as an examinable subject for the primary school
leaving exam until the late 1980s (Appendix 4-7, Kenya, 2.). Since the majority of Kenyan school
children receive only primary education this education policy led to a very low understanding of
Swahili throughout the country.42
Another consequence of the language policy voiced by the experts is the need for local
teachers to speak the vernacular of the particular area where they teach primary school students.
Thereby, teachers were effectively restricted to work in their home provinces, since otherwise
they would have to learn another vernacular to be able to teach (Appendix 4-7, Kenya, 2.
and°3.).43
The severe consequences of the use of vernaculars for the national unity have been also
identified in the so-called Ominde Report (Republic of Kenya, 1964; 29): “We believe that the
secret of a national feeling which over-rides tribal and local loyalities lies in bringing about much
more consciousness mixing within our educational system than is at present practised.” In
particular, the Ominde Report suggests that teachers work two years in a foreign province before
starting their work in their home area. To facilitate this, English should be promoted as a national
language.
In addition, vernaculars seem to be frequently used in offices and in the political sphere
(Appendix 4-7, Kenya, 2.). In particular, experts stress that Kenya’s first President Kenyatta
42 In 2000, only 33 percent of children attended secondary schools (World Bank, 2008).
43 Note that this poses a tight constraint on areas with only few schools. To increase their student numbers, these areas are required to produce disproportionately high numbers of school leavers that might then become teachers and return to their home areas.

76
sometimes addressed the population in his mother tongue Kikuyu even if people did not belong to
the Kikuyu ethnic group and hence were not able to understand him (Appendix 4-7, Kenya, 2.).
In addition, the liberalization of the media in 2002 and the spread of vernacular radio stations,
such as Inooro FM and Kameme FM (Kikuyu ethnic group), and Kass FM (Kalenjin ethnic
group), is seen to pronounce the use of vernaculars and, thereby, to increase ethnic consciousness
and animosity (Wamwere, 2008; 41). In the post-election period, these radio stations provided a
platform for hate-speeches and, thereby, crucially contributed to the ethnic violence experienced
in 2008 (Konrad Adenauer Foundation, Dialogue Africa Foundation Trust, 2009).
Tanzania, on the contrary, is widely cited for its universal use of Swahili, which led to a more
united population according to local experts (Appendix 4-7, Tanzania, 1).44 The first president of
Tanzania, Julius Nyerere, stressed that “we need to break up [the] tribal consciousness among the
people and [..] build up a national consciousness” (Nyerere, 1966b; 39). The most important
factor for the realization of national consciousness was the promotion of Swahili throughout
Tanzania. In particular, the use of a Bantu45-rooted language instead of the language inherited by
the former colonial rulers (English) to create a national language is seen by researchers and local
experts as having enhanced its acceptance in the country (Laitin, 1992; 8; Appendix 4-7,
Tanzania, 2.). Over the years, Swahili “has evolved in its own political idiom, nurturing the
development of a national political culture” (Barkan, 1994; 10).
After Tanzania became independent and embarked on the socialist way envisioned by
Julius Nyerere, the government pushed for a quick promotion of Swahili throughout the
country.46 Education policies clearly targeted the use of Swahili as a national language. More
precisely, while vernaculars and English were used as the language of instruction under British
colonial rule, Tanzania adopted Swahili as the common language of instruction in all primary
schools (Jerman, 1997; 251, and Laitin, 1992; 139). In secondary schools, Swahili continued to
be an examinable subject and teaching was carried out in English (Kessler, 2006; 49).
Moreover, the use of ethnic vernaculars was abandoned from the political and
professional sphere and restricted to the social and personal sphere (Appendix 4-7, Tanzania, 2.).
Local ethnic languages were strongly discouraged to be spoken in government offices and 44 This is also supported by Laitin (1992), Barkan (1994), and Miguel (2004). 45 Bantu languages originate from central and southern Africa. 46 The effectiveness of the implementation of Swahili by Nyerere was supported by other factors, such as the use of Swahili for administrative purposes during the German and British colonial period (cf. Tripp, 1999; Jerman, 1997; Laitin, 1992; and Appendix 4-7, Tanzania, 2.).
77
national businesses (Whiteley, 1969; 111 cited in Tripp, 1999; 54). People were expected to
communicate and work together using Swahili as their common language. The necessity of
communicating in Swahili was also increased by the ujamaa villagization policy (described in
section 4.3.3). People from various ethnic groups were drawn together in the ujamaa villages
and, hence, the need for a common language significantly increased (Kessler, 2006; 49).
Another factor contributing to the national identity developed in Tanzania is the use of the school
curriculum to teach national values. Today, Kenyan experts strongly advocate the implementation
of new education policies that include conflict studies in the curriculum (Appendix 4-7, Kenya,
5.a)).47
(2) The quota system
“Abolish quota system, says Kalonzo” titled the Standard on March 27th, 2009 (The Standard,
2009). Kenya’s Vice-President Kalonzo Musyoka was reported to have pledged for an
abolishment of the quota system because of its adverse effects on inter-ethnic cooperation: “We
must revert to the old system in which students were admitted to schools away from their homes
to enable them mingle at an early age. This is a way of fighting negative ethnicity.” (The
Standard, 2009).
The quota system was enacted by President Moi in 1978 to regulate the admission of
students to Kenya’s secondary school. It foresaw that 85 percent of a schools’ students come
from the school’s local area and only 15 percent of the students admitted are allowed to come
from outside the local area (Appendix 4-7, Kenya, 3.).48 This policy was enacted to “strengthen
local interest and commitment towards development and maintanance of their schools” (Republic
of Kenya, 1988; 29). However, the main reason for the introduction of the quota system is widely
perceived to be President Moi’s wish to increase secondary education for his people – the
47 The importance of school curricula is supported by Miguel (2004; 336). He argues that the Tanzanian government employed the school curriculum to stress nation values and to promote national unity. On the contrary, the the Kenyan government failed to pursue similarly approaches 48 Kenya’s secondary education system comprises three different types of schools, namely national, provincial and district secondary schools. The best students are admitted to the few national schools. Students with slightly lower test scores can attend provincial secondary schools and students with very low grades are confinded to district secondary schools. For provincial schools 85 percent of the students come from the province and 15 percent from outside the province. For national schools, 85 percent of students are admitted from their respective district and 15 percent from outside the district. (Republic of Kenya, 1988; 29)

78
Kalenjin (Amutabi, 2003). Under President Kenyatta, the majority of schools were built in
Central Province – home to the Kikuyu49. Once Moi came to power, he re-allocated education
resources away from Central province to other provinces and especially to his ethnic group. The
new schools built in the homeland of the Kalenjin, however, were then equally populated by
other ethnic groups, who formerly went to schools in Central province. To increase access of his
own people to secondary schools in their own province, Moi enacted the quota system. He,
thereby, effectively prohibited that large numbers of people from other ethnic groups attented
these secondary schools. As some scholars argue, an immediate consequence of the quota system
was its reinforcement of ethnic identity and regionalism: “Good or bad performance of a school is
not longer viewed as that of the individual school but rather as a school from a particular
ethnicity”(Amutabi, 2003; 135).
In addition, the quota system had consequences on the use of English as the language of
instruction in secondary schools. The quota system produced fairly ethnically homogenous
classes in secondary schools. Therefore, as Kenyan experts argue, instead of teaching in English,
lectures could be held in local vernaculars (Appendix 4-7, Kenya, 2.). Thus, vernaclars were even
spoken and promoted during secondary education and increased in importance.
Tanzania also introduced a quota system. However, this system was not designed to separate
different ethnic groups and to guarantee access to education to specific ethnic groups, but to
equalize educational attainment across ethnic groups (Cooksey et al., 1994; 216). In addition, the
majority Tanzania experts pointed to the government policy to mix secondary school students
(Appendix 4-7, Tanzania, 3.). In particular, they state that the government forced secondary
school students to study in provinces far away from their home areas. Thereby, Tanzania took the
exact opposite direction as Kenya. While Kenya restricted students to study in their home area,
Tanzanian students were sent far away to communities that spoke a different vernacular
language. The forced commingeling of students from different ethnic groups strongly promoted
the use of Swahili to communicate, and provided the future elite of the country with a truely
national perspective. Another factor increasing inter-ethnic cooperation and the use of Swahili
was the regulation to post civil servants outside of their home region (Tripp, 1999; 45).
49 Whether this was a consequence of Kenyatta’s favoring his own ethnic group, or the Kikuyu’s greater efforts to access education is debatable.

79
From the above discussion one can conclude that nation building policies, such as promotion of a
national language and fostering inter-ethnic cooperation through the education system seem to
have reduced the perceived role of ethnicity and, thereby, lessen the politicization of ethnicity.
4.4 Discussion
The analysis of the ethnic structure, colonial history, land distribution, and nation building
policies permits to draw interesting lessons for the development of politicization of ethnicity. In a
first step this chapter analyzed the relevance of ethnic structure for the politicization of ethnicity.
A country’s ethnic structure has been repeatedly viewed to influence the role of ethnicity in the
political process. However, examining the structure of ethnic groups in Kenya and Tanzania
reveals that the potential for mobilizing an ethnic majority is similar in the two countries.
Examples of deliberate re-grouping of ethnic tribes into larger entities demonstrates that ethnic
structures are far from being static, but ethnicity is instrumented by politicians to form a
minimum winning coalition. This challenges the repeatedly voiced intuition that a country’s
ethnic structure determines in itself ethnicity’s usefulness for political mobilization.
In a second step, this chapter explored other factors, which might have influenced the
politicization of ethnicity in Kenya and Tanzania. In particular, the colonial administration, land
distribution policies by the colonial ruler and the post-independence governments, and nation
building policies by the first presidents in Kenya and Tanzania are found to have substantially
influence the political salience of ethnicity in the two countries.
More precisely, Britain’s aim to transform Kenya into the center of East Africa and its
strategy to develop a strong Kenyan export sector led to the widespread settlement of Europeans
in the most fertile areas in Kenya. The settlement policies of the British government could only
be implemented by expropriating several ethnic groups living in these areas. The ethnic groups
which bore the major burden of this policy were Kalenjin, Maasai and in particular the Kikuyu.
The strong grievance over the expropriation of their land led to the Kikuyu’s pioneering role in
the independence movement and impeded a cross-ethnic national resistance. In addition, the
large-scale expropriations by the British obligated the post-independence government to
redistribute the former settlers’ land. At this point the government led by Kenyatta had the
opportunity to redistribute this land equally. However, the major beneficiaries from the land
distribution were the Kikuyus, who settled primarily in areas formerly occupied by other ethnic

80
groups, such as the Kalenjin. These ethnic groups felt grievance over the land lost to the Kikuyu
that still persists today and contributes to an increase in politicization of ethnicity. Further
policies implemented by the post-independence governments, such as the quota system in the
education sector and the promotion of local vernaculars, additionally spurred ethnic
consciousness and, thereby, increased political salience of ethnicity.
In contrast, the development in Tanzania led to a low level of political salience of ethnicity. The
British colonial ruler showed only little interest in the occupation of Tanzania due to its focus on
Kenya as the strategic center of East Africa. This resulted in a low influx of European settlers
and, as a consequence, in little need to expropriate and systematically oppress the Tanzanian
population by the colonial administration. In addition, the experience made in Kenya in
combination with administrative personnel sympathetic to the African population led to a more
lenient administrative approach in Tanzania which did not rely on a systematic separation of
ethnic groups. This was a favorable environment for cross-ethnic resistance which resulted in a
cross-ethnic national independence movement and provided the first post-independence president
Nyerere with an opportunity to pursue his vision of a united Tanzania. Furthermore, through the
low influx of white settlers in Tanzania, President Nyerere was freed from the need to redistribute
land after the independence. Moreover, he pursued the ujamaa policy, which granted equal access
to land to the Tanzanian population regardless of their ethnic identity. In addition to the equal
resource distribution, Nyerere implemented strong nation building policies focusing on the
promotion of Swahili and fostering inter-ethnic cooperation. Thereby, ethnic identity was
effectively barred from the political sphere.
From the discussion of the development of the politicization of ethnicity one can identify two
critical moments in the history of Kenya and Tanzania when actors had the opportunity to shape
the political salience of ethnicity. The first critical moment was the approach British colonial
rulers took to govern the two colonies, and the second was the approach pursued by the first
independence government to distribute land and to unite the country.
In particular, the oppressive colonial approach in Kenya including land expropriation and
the demarcation policy critically increased the ethnic consciousness. More precisely, the colonial
approach led to a Kikuyu-driven independence movement and burdened the post-independence
government to re-distribute the former white highlands. In contrast, Britain’s low interest in

81
Tanzania and the absence of strong colonial oppression and expropriation of land led to a cross-
ethnic nationalist movement and provided the first independence government with a favorable
environment to pursue nation building policies.
The second decisive moment in the history of Kenya and Tanzania were the actions taken
by the independence government. In Kenya, President Kenyatta’s government was left with the
task to redistribute the white highlands once the European settlers left the country. This could
have been an opportunity to provide all ethnic groups with an equal access to resources.
However, distribution of land was heavily skewed towards the Kikuyu, which caused persistent
grievance by the other ethnic groups and substantially increased the political salience of ethnicity.
In addition, education policies implemented by the government increased ethnic tensions further
by hindering inter-ethnic cooperation and emphasizing local ethnic identities.
Tanzania, on the contrary, was less burdened by the colonial period and, therefore, able to
grant equal access to land and to pursue long-lasting nation building policies. The question,
however, remains whether President Nyerere could have implemented these nation building
policies successfully in an environment less favorable such as in Kenya.
4.5 Conclusion
The comparative analysis of the historical events leading to the differing degree of politicization
of ethnicity in Kenya and Tanzania offers interesting lessons on the causes of politicization. In
particular, the analysis challenges the long standing notion that politicization is determined by the
number and size of ethnic groups in a country. Evidence from the two cases demonstrates that
ethnic groups were deliberately re-grouped into larger entities by politicians to form a political
support base. This finding may provide support to redirect scholarly attention to historical factors
that influence the politicization of ethnicity. A first effort is provided in this chapter by assessing
the impact of colonial rule, land distribution, and nation building policies on the political salience
of ethnicity. All three factors are found to have substantially influenced the politicization of
ethnicity in Kenya and Tanzania. The specific colonial rule and the policies to distribute land are
found to have increased ethnic tensions in Kenya, but decreased ethnic consciousness in
Tanzania. In addition, the analysis demonstrates that fully implemented nation building policies
have the potential to lastingly mitigate the political salience of ethnicity. In particular, the

82
promotion of a national language throughout the country and the intermingling of secondary
school students emerge as favorable factors to create a united country.
Yet, the question remains under which circumstances can nation building policies be fully
implemented. Evidence from the low politicized case, Tanzania, points to an interrelation
between colonial approach and feasibility of implementation of nation building policies. The
colonial approach in Tanzania induced lower ethnic consciousness than in Kenya and, thereby,
provided a more favorable environment for the post-independence government to launch policies
to unite the country. In Kenya, on the contrary, the first post-independence government was
heavily burdened with increased ethnic consciousness through the colonial demarcation and land
distribution policies. The question to which extent Kenya’s post-independence policies directly
resulted from the colonial burden is, however, left to further research.
The discussion of the interrelation between colonial rule and post-independence
governments’ actions suggest promise for a more in-depth analysis of the necessary and sufficient
conditions for the politicization of ethnicity. Further research might expand the historical
comparative case studies presented in this chapter by assessing the impact of colonial rule, land
distribution and nation building policies in complementary cases. This information could, then,
be used to perform a more rigorous test of the necessary and sufficient conditions leading to the
politicization of ethnicity employing a Qualitative Comparative Analysis (QCA) framework. In
addition, including further cases on the range of politicization of ethnicity might serve to
corroborate the results derived from the benchmark cases of a highly politicized country, Kenya,
and a low politicized country, Tanzania.

83
Appendices 4-1 – 4-7
Appendix 4- 1: Expert interviewees
Organization of interviewee Field of expertise Date of
interview
Coding for
Appendices 4-4
– 4-7
Tanzania, Dar es Salaam
Friedrich Ebert Foundation Nationalism process in Tanzania 10/08/08 TN1
Institute of Development Studies (IDS), University Dar es Salaam Ethnic conflicts, Tanzanian history 10/07/08 TP3
Institute of Development Studies (IDS), University Dar es Salaam Agricultural development, income
distribution
10/06/08 TP2
National Electoral Commission, Election Management Department Organization of political parties in
Tanzania, the role of ethnicity in
political campaigning
10/12/08 TG4
National Electoral Commission; Research and Education for
Democracy in Tanzania (REDET)
Elections in Tanzania 10/16/08 TP5
Prime Minister’s Office, Registrar of Political Parties Organization of political parties in
Tanzania
12/01/08 TG6
University of Dar es Salaam, Political Science and Public
Administration
Political parties in Tanzania 10/29/08 TP7
University of Dar es Salaam, Sociology and Anthropology Department Ethnic groups in Tanzania 10/25/08 and
10/30/08
TP8-1 and
TP8-2
Kenya, Nairobi
Ecumenical Centre for Justice and Peace (ECJP) Civic education, peace building 05/27/09 KN7
Embassy of the Federal Republic of Germany, Nairobi Economic cooperation and
development
05/05/09 KD5
Hans Seidel Foundation Civic education, conflict prevention,
political dialogue
05/15/09 KN2
Konrad Adenauer Foundation International cooperation 05/06/09 KN1
Konrad Adenauer Foundation Political parties in Kenya 05/06/09 KN4
Member of Parliament Pastoralist ethnic groups 06/18/09 KM3
University of Nairobi, Education Communication and Technology Civic education 05/18/09 KP6
Note: Names of interviewees are not disclosed to maintain confidentiality.

84
Appendix 4- 2: Interview protocols
Interview: TN1
• He does his PhD at IDS, Uni Dar and works at FES
• He did his master thesis on leadership and code of conduct (ethics)/accountability
• He owns books on education published by Hakelimu
• Says: after independence ethnicity was significant
• More than 130 ethnic groups in Tanzania
• But no tribalism in Tanzania
• Does not know whether there exists literature on the different existing ethnic groups in
Tanzania
• Nationalism process in Tanzania => he made a presentation on that for a conference
• 1960s Nyerere had vision on unit of the people Swahili as a national language and a
national culture (he says: adopting a foreign/colonial language (e.g. English) does not work to
create a united culture and to build a nation)
• Education system had two characters that eliminate ethnicity:
o Use of Swahili
o Cross-Cutting if students come from Mtwara primary school they have to go to a
secondary school in a different district
As a result people employed in the education ministry and teachers come from various
ethnic groups
• Nationalization of religious schools =>after independence the elite came from missionary
schools (because that were the only schools); but the Muslim couldn’t get education (only
Islamic education) => hence there were sharp difference between Christians (protestants and
Catholics) and Muslims Nyerere reacted to that by nationalizing the schools
• Demand side effect??==> he says: “Muslims did not care for education”
• Mkapa is Makua (from bigger Machinga tribe) from the Masasi/Mtwara region, Mkapa’s
electoral district is Masasi (Nanyumbu)
• The only clientelistic resource distribution: former Prime Minister and Minister of Finance
(Cleopa David Msuya) comes from Mwanga district (Kilimanjaro region) Prime Minister
distributed some funds of electricity/power to his home region

85
• Position of the prime minister is very powerful (he is chief executive)
• Prime minister of Mkapa was Frederick Sumaye (for 1995-2005) and he is from Manyara
Region (Babat district) and his tribe is the Barabeig (=hunters???)
• Literature: Information on ethnicity can be received from the Institute of Kiswahili,
Department of History
• 1995-2005: no coalition partner, only CCM; some local governments were under control of
opposition parties (mayors etc.)
• Post-Prime minister Edward Luanza is from Monduli district (Masai people)
• I asked whether parliament is relevant for political decisions:
o Parliament was not relevant because it could not discipline the parties
o 1965-1992: one party system (CCM): parliament was not important
o 1995-2005: although multiparty system there was a one party dominance with CCM
having over 80% of the seats: parliament had not really and influence; also: members
of parliament who did not vote according to CCM lines were not chosen for the next
election (strong party discipline)
o Since 2005: serious change because no party discipline (one example for the change is
that the prime minister resigned in Feb. (??) 2008 because of allegations of
corruption)
• University bookshop: book: “People’s representatives: Theory and Practice of Parliamentary
Democracy in Tanzania, by Mukandala & Mushi & Rubagumya”
Interview: TP2
• Nyerere policy to send children from north to south to mix the nation and to use Swahili
• 1970s: vernacular languages not allowed to be spoken in offices or school
• Mkapa is from Mtwara/Lindi, Masasi district
• I asked to which ethnic group Mkapa belongs to “he might be from Malawi/ he might not
even by Tanzanian”
• Orginial tribes from Tanzania: Barbaikes

86
Interview: TP3
• He is historican
• In the colonial period some tribes were favored to get education, namely the tribes that grew
cashcrops (such as coffee); the favored tribes were: Haya, Chagga (Kilimanjaro region),
Nyakyusa
• Even in later periods, these tribes (Haya, Chagga (Kilimanjaro region), Nyakyusa) were
favored
• After independence, there was an effort to minimize the difference between ethnic groups, for
example the policy in 1967 (??) nationalized all schools to minimize differences between
ethnic and religious groups
• He says Mkapa is a Makua from the Masasi district (maybe from the Nauimbu ward =
electoral ward of Mkapa (??))
• He says: Mkapa has been critized that he did not distribute enough resources to his district
(Masasi) despite him being in a powerful position as a president
• Mkapa built the “Mkapa bridge” that leads to his region and facilitates trade and transport and
also the Tamak road from Dar es Salaam to Lindi (the road goes across the Mkapa bridge)
• Archive of newspaper article might be found in the university or national library
• Maps of Tanzania, see Atlas Tanzania
• Books published by TP3:
o Ethnic conflict in the region of the great lakes, origins and prospects for change
o Beyond Conflicts in Burundi (co-edited with Mr. Massasu)
• TP3 did much research on elections in Zanzibar
• Kikwete is from Bagamoyo district
• Nyerere is from Mara region
• Literature recommended:
o Political Science: REDET books
o TEMKO (Tanzanian election monitoring committee) reports might have election
results

87
Interview: TG4
• He answered my questionnaire:
Questionnaire
1. Are political parties allowed to use vernaculars in the political campaigning?
TG4: They are not allowed (which is written in the code of conduct (2005 and even before)). In
the 1995 and 2000 election vernaculars were not allowed, but sometimes they
(parties/candidates) did use vernaculars to attract voters.
2. Did the use of vernaculars differ in the 1995, 2000 elections (e.g. more use of vernaculars
in 1995 than in 2000)?
TG4: 1995 more use of vernaculars, because first multiparty election and parties tried to attract
voters.
3. For the 1995 and 2000 election: Do some political parties attract primarily voters from
one ethnic group, one region or one religion?
TG4:
• In general: you can detect the support base of the various parties by looking at the election
results and that some parties draw support primarily from one region
• Also: ethnic focus of parties depends on the ethnic identity of their leaders
• CUF: Coastal area/Muslims
• NCCR (1995 election): Kilimanjaro region (Chagga)
• CHADEMA: Kilimanjaro region
• UDP: top leaders are from Shinyanga
4. Can you list the regional/ethnic/religious base of the following parties?:
a. CCM
b. NCCR-Mageuzi
c. TLP
d. CHADEMA
e. CUF
f. DP
g. NRA
h. PONA

88
i. UMD
j. UPDP
k. UDP
l. TADEA
TG4: see replies in 3)
5. a) For the 1995 and 2000 elections: Do you think that ethnicity (tribe, clan, and religion)
is used in Tanzania for political campaigning to mobilize voters?
TG4: Sometimes it was used, not for political campaigning, i.e. that people vote for a specific
party, but to mobilize people to vote and to participate in the political process; appeals to
traditional leaders
b) If not, what do you think was the cause of the minor role of ethnicity in the political
process?
TG4: Differences between Kenya and Tanzania in the role of ethnicity in the political process
because of different history of Tanzania and Kenya. Tanzania focused on national unity. In
Tanzania, if you start your party on tribalism, the people will not accept that. Example of MPs
not coming from the region: In Dar es Salaam, most MPs are not from Dar es Salaam. MP for
Kagera is from Musoma region (~1000 miles distance), MP for Ubungo is from Kilimanjaro
region.
c) Are there any specific policy measures that were used to oppress the use of ethnic
identity in the political process?
TG4: -
Interview: TP5
• He teaches courses on local governments
• For the 1995 presidential election there exists only data on the national level and not on the
district or constituency level. TP5 knows Dr. Sisti at NEC and commissioned him to compile
the data. However, the former director of NEC did not think it was necessary to collect
disaggregated data, i.e. data on district and constituency level. TP5 argues that the former
director is „still from the time of the one party system and a bureaucrat”, meaning that “the
president’s constituency is the whole country“

89
• Constituencies=/= districts several constituencies can be found in one district, e.g. in
Kinondoni there are three constituencies
• And constituencies changed over time: e.g.
o 1995 around 231 constituencies (??) – 2000: 230 (??) and 2005: 231 constituencies
(??)
o Reason for changes:
1. Geography: e.g. Kilimanjaro has two constituencies: South and North
2. Population number
3. Communication system: e.g. Mongoli (?) and Lilondo (?) not densely
populated but very vast land and therefore the constituency was split
(otherwise MP couldn’t reach all people)
• Ethnicity in politics:
o In small constituencies it might matter which ethnic group politicians belong to (e.g.
local ethnic group or other), e.g. when they campaign to become mayor
o Look at Afrobarometer: Tanzanians identify with Tanzania and not with specific
ethnic groups [Anke: TP5 seemed very proud of that]
o Nyerere “discouraged ethnicity”
o Nyerere abolished local chiefs and these old chiefs were given administrative districts
to work there
o TP5 is from the Kilimanjaro region but in his school there were children from other
ethnic groups
o Introduction of Swahili as a national language
o (1995-2005): not by law but as a general understanding it was not allowed to use
vernacular languages in political campaigns
o Minimum requirement for candidates for MP was to be able to read and write in
Swahili
o Literature on election campaigns:
1. At NEC: Memorandum of Understanding of Do’s and Don’t’s in election
campaigns ~Code of conduct signed by most political parties
2. Party manifesto:

90
• CCM; CUF; Chadema ask parties directly or ask Max Muya or
NEC or Register of Political Parties (Building close to National
Museum)
• Register of Political Parties is supposed to keep copies of manifesto
o I asked whether he thinks that parties do what they write in their manifesto, he said:
CCM tries to implement its manifesto…
o Ethnicity might be used on the local level but it is rare and no role of ethnicity on the
national level
o “ Balancing Act” by the government result: ministers come from different ethnic
groups
o Prime Ministers:
1. Sumaye from Arusha (tribe Mburu )
2. Hadi = Masaii (??)
• Somebody working on ethnicity at the university he did not know, maybe in the sociology
department
• role of religion?
o Muslims, Christians, Pagans Sukuma land (??)
o After independence: 50% Muslim – 50% Christian
o Now: more Christians than Muslims
o Branding of CUF as predominantly Muslim was costly because they did not get votes
from the mainland
o “People have a religion – the state has no religion”
o Maybe in Zanzibar religion matters (if you are a Christian)
o The national president is elected by the mainland and Zanzibar
o The national parliament has 55 MPs from Zanzibar
o The Zanzibar President is only elected by Zanzibarians
o Total MP = 231 + 03.*231 women + 50 from Zanzibar + 5 Zanzibarian household
representatives + 10 directly appointed by the president

91
Interview: TG6
Regulations of ethics of Political Parties of 2007 (~Code of Conduct). Why was it enacted?
• In 2004 the process of enacting the code of conduct started with a discussion of the
regulations including all stakeholders (political parties). It was not enacted in 2005 because of
the election
• To be enacted there had to be an amendment of the political parties act to enable the minister
to impose this regulation 12.11 Prime Minister signed the amendment (??). All political
parties agreed to the code of conduct (since they were involved in its drafting)
Change of role of ethnicity over time?
• In the single-party system ethnicity didn’t matter. In multi-party system it is more important
to mobilize voters but because of the regulation/code of conduct it was made sure that
ethnicity will not become more important
Issues of ethnicity in party manifestos?
• No regional bias. Party manifestos are important in political campaigning.
Are vernaculars allowed in political campaigning?
• Always vernacular AND Swahili and a translator. Vernaculars are used in political
campaigning
Do political parties have a regional base?
• UDP:
o High concentration of voters in Shinyanga (especially in the Bariadi district, because
the chairperson comes from this region and is himself a Sukuma). In Shinyanga =
Sukuma tribe
o Also Mwanza, Tabora, lake regions
• CHADEMA:
o Kilimanjaro region (Chagga). Chairman=Mboje (comes from Kilimanjaro). Secretary
General comes from Arusha. Major political centers: Moshi town, Haya district,
Karatu district.

92
o In 2005 campaign they tried to have a policy of regionalism, e.g. that the region must
have its own regional influence and its money should not be re-distributed to other
districts (~they want to keep revenues generated in the region)
• NCCR:
o After Mrema (now in TLP??) left the party, the party got a new face because of the
new leader’s ethnic identity
• CCM:
o Has members throughout the country. Dominant party for 30 years
o No regional/geographical base
• CUF:
o It has been caught in a religious issue. CUF is dominant in Zanzibar/concentrated in
Pemba/Zanzibar town (Stone town), Islamic dominant areas. CUF has a strong Islamic
base and spread along the coast because there live Muslims
Any actions against parties that have a tribal base?
No, so far, no action has been taken against parties that are viewed to use ethnic identity to
mobilize voters. He said that this would have discouraged these young parties and would have a
negative impact on the multiparty system
How does he compare Tanzania and Kenya with respect to role of ethnicity in the political
process?
• Tanzania:
o no ethnic problems. In secondary school, kids are sent to different schools and had to
interact with children from other tribes. Vernaculars cannot be used often for political
campaigning because of mixed areas where people will not understand one
vernacular. Tribal affiliation is not used as instrument in political campaigning
I would like to talk to returning officers
• 2000 not easy but 2005 should work
• Returning officers work in the district office (=are district officials). NEC is directly involved
with returning officers, so I need to talk to Director of Election (or Principal Legal Officer)
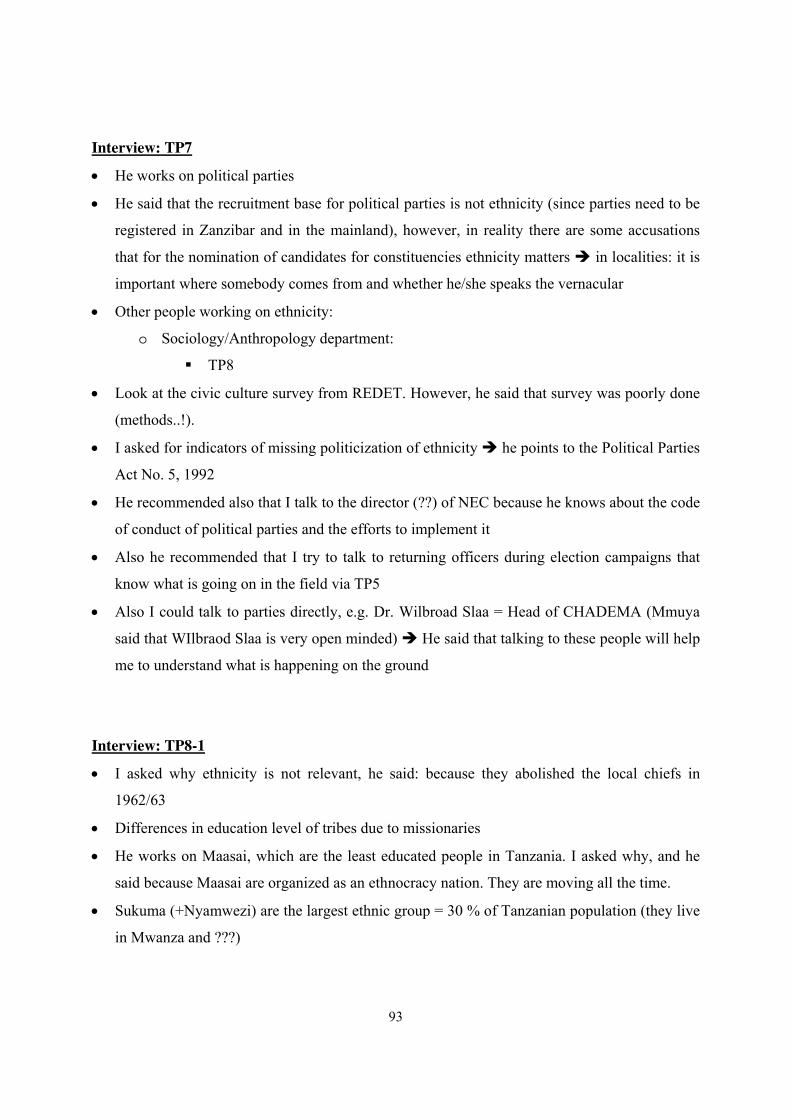
93
Interview: TP7
• He works on political parties
• He said that the recruitment base for political parties is not ethnicity (since parties need to be
registered in Zanzibar and in the mainland), however, in reality there are some accusations
that for the nomination of candidates for constituencies ethnicity matters in localities: it is
important where somebody comes from and whether he/she speaks the vernacular
• Other people working on ethnicity:
o Sociology/Anthropology department:
TP8
• Look at the civic culture survey from REDET. However, he said that survey was poorly done
(methods..!).
• I asked for indicators of missing politicization of ethnicity he points to the Political Parties
Act No. 5, 1992
• He recommended also that I talk to the director (??) of NEC because he knows about the code
of conduct of political parties and the efforts to implement it
• Also he recommended that I try to talk to returning officers during election campaigns that
know what is going on in the field via TP5
• Also I could talk to parties directly, e.g. Dr. Wilbroad Slaa = Head of CHADEMA (Mmuya
said that WIlbraod Slaa is very open minded) He said that talking to these people will help
me to understand what is happening on the ground
Interview: TP8-1
• I asked why ethnicity is not relevant, he said: because they abolished the local chiefs in
1962/63
• Differences in education level of tribes due to missionaries
• He works on Maasai, which are the least educated people in Tanzania. I asked why, and he
said because Maasai are organized as an ethnocracy nation. They are moving all the time.
• Sukuma (+Nyamwezi) are the largest ethnic group = 30 % of Tanzanian population (they live
in Mwanza and ???)

94
• Chagga is not one ethnic group but consists of different ethnic tribes (with different
dialects??), such as the Rombo and ??
• Maasai => same ethnicity but 10 different tribes
• Particularly good education level in mountain areas (where missionaries where): Bukoba,
Kiluan, Pare, Meru, Lushoto (Usambare), Rungwe (Tukuyu), Musoma (parts)
• Most districts are still mono-ethnic, thus if I get ethnic shares of the old population census I
could approximate the shares of today’s ethnic population
• Ethnic group of Zaramo are in Dar es Salaam (~Zaramo land) and constitute approximately
20% of the population also the Zaramo comprise 3 different tribes.
• He said that in Kenya it was not a conflict along ethnic lines but about oppressor and
oppressed, because even the Kikuyu attacked their own (Kikuyu) leaders
• In Tanzania ethnicity is to some extent relevant, but since the country is large ethnic groups
cannot mobilize
• Paper by TP8 language is not an explanation of why ethnicity does not matter in Tanzania
he said “Is Zanzibar more united than Mainland because they speak on language No!”
• TP8 writes papers on small ethnic groups such as the Wachubugu and Maasai and on peasants
and rural development
• Vernacular languages are very distinct
• “No ethnic group has the resources to dominate the rest of the population”
• Pemba is neglected Zanzibarian government neglects Pemba
• Prime minister Sumaye is from Iraqw (Mbulu, no bantu group); Sumaye was Mkapas friend
• There was never a president from a bigger ethnic group, but always from backward small
tribes
• Muslim refused to go to schools
• Makap is a Makua (=matrilian tribe)

95
Interview: TP8-2
Are shares of tribes from the population census still valid or did they change a lot over time via
internal migration?
Yes, shares of tribes are still valid, the largest group is still the Sukuma, and the
Sukuma+Nyamwezi taken together comprise over ¼ of the population. Not much internal
migration, 70% of the areas and there was not much migration. Also, since some districts have
only one tribe you can use the 2002 population census to estimate the population growth of this
particular tribe by looking at the population in the specific district, e.g. Mwanza= Sukuma tribe.
In all towns the majority of people is from the biggest tribe in the district (e.g. Moshi=Chagga)
Are villages homogeneous in terms of ethnic diversity?
The majority of villages comprise only one group; especially in Morogoro, Mtware, Lindi and
western part of the country the villages are more homogeneous
Problem of village heterogeneity?
It is more a problem of farmers versus nomads. One example shows that in a village with a
previously bantu, farming inhabitants where Masai people settled, the former village gave the
Masai people their own village next to them because they didn’t wanted to live together in one
village. However, from administrative boundaries these two villages are still one village. Whether
or not heterogeneous villages have problems depends on specific local politics; it is more a
question of nomadic tribe versus crop growing tribe; this is especially important in the Dodoma
region, Manyara, Morogoro, Mbeya, Iringa. The Masai regard all other tribes as “Waswahili”
because they are crop-growers. No problem between Muslim and Christian. Also sometimes
problems within one tribe between different clans: one clan accused the other of witchcraft, e.g.
in Tabora, Mwanza, Shinyanga (Nyameza, Shukuma).
Ethnic identity of Frederick Sumaye?
Sumaye is Iraque; Others: Sokoine = Masai; Mwinyi is from coastal region, not really Zanzibar
Regrouping of ethnic groups into larger groups
Mostly the ethnic groups living closely together share a similar language [TP8 uses language as
characteristic of tribe]. Sukuma and Nyamwezi have the same language. Pare (as one ethnic

96
group in census) is actually 2 distinct languages. Rufiji and Ndengereko are one group. Arusha
and Masai are one group. He said that Kikuyu (from Kenya) are not the largest ethnic group in
Africa, but the Sukuma (from Tanzania) are larger
Which ethnic groups as formation base of political party?
To understand which ethnic groups are the support bases of the parties depends on the
politicians who lead the party! CCM= fraction which has the power is Coastal
people/Swahili/Muslims; but support base in whole country; NEC=coastal people. NCCR=whole
country. CUF=dominated by Pemba because they started there, otherwise
Coastal/Swahili/Muslims. UDP=Sukuma, Nyamwezi. CHADEMA= started with Christian and
Chagga but now whole country. TADEA=?. One party started by Kambona had followers from
Lake Nyasa. PONA=Nakyusa tribe. TLP=whole country
Why do ethnic groups not mobilize along their ethnic identity?
Two answers: Because they don’t have enough resources (education and money) and because
they don’t want to. Chagga is the most educated group, but Haya have even more resources
Other
Tanzania has a simple majority system (and not proportional vote). Economic power (as from
cotton, coffee, gold, trade) is not in Dar es salaam but in Mwanza (=nowadays, 7 out of every 10
USD come from Mwanza)
Interview: KN1
‐ The German colonialists implemented Swahili as the lingua franca in Tanzania and changed
the script of Swahili from Arabic to Latin, so that they could read it
‐ In Kenya, the Kikuyu ethnic group was the first to go to missionary schools, since these
schools were located in the Highlands, where the Kikuyu lived. (The areas with the best
climate in Kenya and Tanzania are the areas at the bottom of the mountains (Tanzania) and
the Highlands (Kenya). In these areas most of the schools were located). In addition, the
Kikuyus worked on white farms. The Kikuyus sent their children to school and therefore the
children needed to do homework. To have enough light to do homework, the Kikuyu changed
the architecture style of their house from round (without windows) to square houses with

97
windows. Moreover, since Kikuyus went to Church and wanted to read the Bible, they had to
go to school. In addition, to give money to the church (collect), the Kikuyu needed to earn
money.
‐ In Kenya, the British colonial rulers didn’t want that different ethnic groups unite against
them. The British colonial rulers were less interested in Tanzania than in Kenya because there
are no white farms in Tanzania.
‐ The Konrad Adenauer Foundation has an archive of journals/magazines
‐ The Chadema party has its support base in the North of Tanzania
‐ In July 2008, a new party law was enacted (~a minimum of 5 out of 7 provinces need to be
represented when founding a party). In addition, this law also prohibits ethnic parties.
However, this does not impede parties to instrument ethnicity.
‐ Manifestos of parties might be downloaded from the web. Some manifestos needed to be
revised after the enactment of the party law. At the office “Register for Political Parties”
today 37 parties are registered.
‐ Party-N-Kenya = Kikuyu party
‐ The ethnicity of the party leader is the ethnicity of the party
I asked whether KN1 could imagine measure to de-ethnicize politics?
‐ Nkenya tried to attract voters from different ethnic groups, but it didn’t work out
‐ NK1 says that it is difficult to find someone that is ready to do something about the high
importance of ethnicity in politics here in Kenya.
‐ In the long run, it seems important to make some ethnic groups feel less excluded and
disadvantaged, e.g. Luo and Luya feel disadvantaged
‐ Since the president decides who will become governor in a district/province, he puts his
people in these positions
‐ Odinga (ODM) wants to fill 50 % of the posts with his people
‐ The ethnic identity or the home region of people in Kenya is written in their passport
‐ Ethnicity is used for political campaigning, not explicitly, but more “we want a coalition of
the Kalenjin-Kukuyu” or that e.g. Wiliam Hutu threats to take “his” people (the Kalenjin) and
leave the ODM and forms a new party
‐ Vote-buying is not that easy as in other countries, e.g. Senegal

98
‐ In the parliament ODM has the majority, but in the presidential elections ODM received
fewer votes
‐ Parliament is not much influence. The members of parliament don’t really have an own
opinion but follow the opinion of the party. There are not many content based discussions.
‐ There is not really a feedback mechanism from the politicians and their ethnic clientele the
Kikuyuys have not gained much from their Kikuyu president
‐ When in 2002 the rainbow coalition won there was some drive and euphoria for a real
change, but nothing really changed afterwards
‐ The villages in Kenya are rather homogeneous
Interview: KN2
I told him about my research
I asked what the HSF does?
‐ He said they do civic education, security politics, human rights training, corruption
prevention, and dialogue between Christians and Muslims.
‐ He suggested that I talk to
o KN7, since he works on civic education, human rights education and conflict
prevention
o KM3 = head of the coalition of pastoralists
‐ KANU is probably the most democratic party, since all other parties don’t even have intern
elections for the party positions. Raila’s party is a dictatorship
I asked whether there are any conflicts along religious lines:
‐ There will be conflicts between Muslims and Christians
‐ Muslims = African Muslims (which still vote according to their ethnic identity) versus
Swahili and Somali, CIPC (who do not vote along ethnic lines)
‐ Missionaries have been everywhere = no influence of colonial time on the situation now
‐ There are cultural differences whether ethnic groups are receptive to education, e.g. Luos are
the intellectual, reason: they didn’t have a chance to work in other sectors (e.g. industry,

99
government posts), since they were excluded from these sectors by the dominant ethnic
group.
‐ Also difference in the work morale of different ethnic groups. Kikuyu are seen to be very
industrious versus the Swahili people, who are seen to be always late for work
‐ In the future, ethnicity will probably play a minor role in politics since the younger generation
of the Luo ethnic group are striving for an equal distribution of wealth and not for a re-
distribution of wealth from one ethnic group to another.
‐ Churches are not independent, but support their respective ethnic group. The catholic church
supports Kibaki and the most influential bishops are all Kikuyu. The churches apologized for
their open ethnic support during the post-election violence in 2008.
‐ Elections in the villages are dictated by the chief in the village “You need to vote for X, since
this person is the only one who can help us”
‐ In particular, pastoralist ethnic groups are disadvantaged
‐ Candidates for the member of parliament need to take up around 150.000 – 200.000 USD
loans to finance the election campaign
‐ Members of parliament earn around 300.000 USD per month, but every time they go to their
village they have to spend 2000-4000 USD on emergencies in the village
‐ The dead need to be buried in their homeland
‐ There is no birth control because of church and of political leaders: „The more Luo [or other
ethnic group] the better“
‐ In central province there were many missionary schools and very few new schools were built
by the central government but many private, parent-run schools built in central province
‐ Look at the newspaper STANDARD around January 24th, 2009 they published education
expenditure data because of the teacher protests
Interview: KM3
What do you do?
Member of Parliament of the Turkana district and member of several other committees (such as
the ARMANI Forum (=Peace building??), Pastoralist Parliamentary Group … to bring attention
to the needs of the pastoralist society

100
What are the pastoralist groups here in Kenya?
Pokot, Maasai, Samburu, Marakwet, Turkana and many more
….and in Tanzania?
Same
Are the pastoralists different in Kenya and Tanzania? How?
no
What is the difference between pastoralists versus nomads?
Pastoralists are people that derive income almost exclusively from herding (husbandry). And
most of these people have been nomads but since the beginning of the century these people are
more settled, e.g. the Maasai are settled
Are pastoralist groups different from other tribes? If yes, how?
Other tribes don’t understand the way of living of the pastoralists ethnic groups.
Do pastoralists speak Kiswahili well? And English?
At least this is what they learn in school: He said that they start with Kiswahili as the instruction
language until P3 and then they use English.
Did pastoralists suffer from colonial rule? If yes, how?
He quoted from a book about the Maasai from 1903, where colonialist said. “In 100 years, the
Maasai will become Kikuyu”, this means that the colonialist thought the nomadic way of life was
transitory.
Maasai were removed from Rift valley and placed in Lakipia
In the early 70s, some areas were transformed into national parks, but these areas were formerly
pastoralist areas.
About education and pastoralist groups: I heard pastoralists have low enrollment rates. In your
opinion this is due to what?
Because they don’t see the benefit of schooling

101
Also government neglects marginalized groups that have few political support (means some
tribes do have support, some don’t)
Different in Kenya and Tanzania?
No difference, they are marginalized in Kenya and in Tanzania
The role of the government in accommodating the needs of nomadic groups?
There is a draft for nomadic policy, but generally there are no specific policies. Oxfam helped
much by establishing schools in nomadic districts
How do you see inter-ethnic cooperation with other tribes? Better if two pastoralist tribes?
Some cattle raids…
Problems between pastoralists and farmers?
Some problems, but since there are only few places where these two groups live together it is not
that relevant
Demand side effects: Do pastoralists have preferences for specific types of schools or specific
curricula?
School kids would need accommodation when their family leaves them in the school and the
family moves on with the animals
He said that the school curriculum should reflect the need of the people, and that everybody
should learn a bit about the pastoralist culture and hence this should be included in the curriculum
Do parents refuse to send their children to school? If yes, why?
Yes, because they don’t see the need for formal schooling; He tries to tell them that they should
send half of their kids to school. But once first generation of kids are out of school they might see
the benefits of schooling and hence the situation will improve.
I heard about the “traditional schooling”. What is it?
He said there is no traditional schooling

102
Consequences on formal schooling?
-
Does the government try to accommodate the needs of the pastoralist groups? If yes, how?
No. He guessed that there are around 200(?) schools in Turkana with only 50 being allowed to
perform the Kenyan primary leaving exam (??)
Would you agree that ethnicity plays a prominent role in today Kenyan’s politics?
Yes, Kenya is a deeply divided country.
If yes, what is the role of ethnicity in politics? Can you describe it? In your opinion, what are the
causes of the politicized ethnicity? If not mentioned, what do you think was the role of the
colonial administration, independence movement, land distribution, lack of nation building
policies? In your opinion, what measures should be taken to de-tribalize politics?
He said one should start with educating the leaders (the Members of Parliament) and include
conflict studies in the school curriculum so that the students learn about the ethnic conflicts
Anything else you would like me to know?
-
Thank you very much.
Interview: KN4
He is a colleague of KN1 and an expert in party politics
‐ Moi was in power for 24 years
‐ Moi’s regime changed a lot in the education sector, for example he introduced the “Quarter
system” (which is now abolished??)
‐ Quarter system: Ask Education Ministry about that!
o Student intake:
‐ Around end of 1970s, if you leave primary school in district X you had to
attend secondary school in the same district

103
‐ Quarter system refers to the quarter of students from outside of the district that
were admitted to a district school
o Teacher intake:
1. Teachers were posted to their home villages (where they went to primary
school) and not to villages with a different ethnic group than theirs
o Instruction language:
1. Local languages (vernaculars) are used at least until P4 (=4te grade of the
primary school) as the language of instruction, but since most of the time the
students and the teachers are from the same region, the vernacular will be used
even in higher grades
2. In secondary schools, Kiswahili and English are used
3. Until the late 1980’s Kiswahili was sometimes used and taught in primary
schools but was not a subject to be examined
‐ You are allowed to talk vernaculars in the office
‐ Most villages are very homogenous, even in Nairobi there is a certain ethnic clustering with
ethnic group X living in this area and ethnic group Y in a different area
‐ Contact that might know more about my research topic: KP6, he is located on Ngongo Road
(part of the university), www.darajacif.org (Organization)
‐ In 1992 the single-party system was changed to a multiparty system, and the new leaders that
emerged where seen from an ethnic side. The first party (FORD) included members of the
Kikuyu, Luo, Luya and Coast(??) but they immediately split up into different groups
following their own ethnicity
‐ 1995 Ralia (Luo)
‐ Election results can be obtained from NCCK, IED (Institute of Education and Democracy
also look at their websites) and ICAD (Contacts can be established by asking KN4)
‐ Example of how politicians change the parties but the ethnic group follows their leader (no
matter which party he is in):
o Raila: 1992 = FORD Kenya
o 1995= NDP
o 1997=LDP, with LDP Raila becomes presidential candidate
o 2002: NARC (=LDP and NAK( Party of Kibaki) in coalition)

104
o 2002-2005: Raila: coalition does not work out the way Raila wants it (=he doesn’t
become prime minister (??))
o NARC splits into “Banana” and “Orange” over referendum
o 2007: Orange becomes ODM (Orange democratic movement) and Kibaki’s party
becomes NARC-K and then renamed into PNU
‐ If the education outcomes of one region (=ethnic group) are not good enough, their
publication is delayed; also the poverty ratings of the different districts have been falsified
because the poorer a district is the more money it receives from the state
‐ Get report on the 1997 general elections in Kenya, by IED
I asked him whether he could think of any policy to de-ethnicize politics:
He said:
‐ Let people go to their ethnic region because right now people of different ethnic groups
cannot live together. And after all ethnic groups are separated a new education policy needs
to be introduced
Interview: KD5
‐ I told him about my research project
He says:
‐ It is worth looking at the history of Kenya
‐ The British instrumented ethnicity for their purposes. They sought that:
o Kikuyu are business people
o Kamba are soldiers
o Luo are soldiers and civil servants
o Masai and Kalenjin are watchmen
‐ In the 50th, there was the Mau-Mau uprising (=Kikuyu) = battle for independence. After the
violent suppression of the revolt, many Kikuyu were killed by the British and Kenyatta was
arrested by the British
‐ After Kenya’s independence, the Kikuyu were seen as the major contributors to the
independence; Kenyatta became president

105
‐ However, Kenyatta did rather work with the Kikuyu, who allied with the British, than with
the Kikuyu who led the resistance movement (Mau-Mau).
‐ Kenyatta made sure that the Kikuyu were “well provided for”
‐ After the British left Kenya, many Kikuyu bought former white land. However, those farms
were in former Kalenjin land (Rift valley). Therefore, after independence many Kikuyu
settled in former Kalenjin land
‐ After that Moi came to power. He is a Kalenjin. Therefore, the Kalenjin were then favored.
An example for this favoritism is the international airport in Eldoret, the Moi hospital in the
Rift valley (one of the best hospitals in Kenya) and the Moi university
‐ Political parties are the vehicles of the local politicians with strong ethnic connotation.
‐ Kibaki founded his party in September 2007 and with this party he was elected in the election
three months later
‐ There is a new party law (~December 2008). It states that under certain conditions (e.g. at
least X % of the votes from 5 out of the 7 provinces) party alliances can be transformed into
parties
Where there ever attempts to de-ethnicize politics?
• Yes, the rainbow coalition tried to attract voters from different ethnic groups, but the
“Mount Kenya Mafia” (= Kikuyu, Meru, Embu…) prevented that
• They promised a new constitution, there was already a participatory process for the
formulation of a draft of a new constitution, but the political elite prepared a different
draft that was then put to a referendum
• The group against the referendum was called the orange-movement
• The group in favor of the referendum was called banana-movement
• The referendum was rejected and as a consequence the opposition leader was dismissed
from the government (??)
‐ No nation building policies in Kenya
‐ With these many ministries in Kenya (=42) there is no way to find an agreement
‐ In 2003-2004 there was much euphoria that change was possible

106
‐ There is no code of conduct, but there is an informal code of conduct, meaning that
newspapers do not publish the ethnic identity of people but only their home region
‐ The new census should be conducted on August 24.-25. and include questions on the ethnic
identity
‐ Vernaculars are allowed to be used in office and in political campaigns
‐ Ethnic identity is written in the passport
Where could I receive the election results?
‐ ECK (Electoral Commission Kenya) was disintegrated after 2007
‐ Since last week (??) there is the interim electoral commission (IIECK)
‐ Check the report by the Kriegler-commission on the election. The ECK was disintegrated
because of this report
‐ “Politicians change parties like shirts”
Interview: KP6
What do you do?
‐ He is a teacher, has a BA in Education and MA from Kenyatta University, PhD from
University of Nairobi in education. He works on teacher training (together with KN4 from
KAF), changes the curriculum for history of secondary teachers and included there a part on
civic education (=what is the government and how are laws made). He has a background in
history, government, geography and arts
Do you think there is a difference between Kenya and Tanzania in the political relevance of
ethnicity?
‐ Yes
If yes, in which way is it different?
‐ In Kenya ethnicity is more pronounced; after independence Kenyatta used ethnicity to rule
the country and he gave privileges to his group: out of the cabinet with 18 members 11 were
from his own ethnic group (Kikuyu), e.g. Kikuyu people were in key positions: Minister of

107
Finance, of Home Affairs, of Foreign Affairs, of Security, and Attorney General, Chief of
Police and Chief of Army
‐ Land was the first problem in Kenya: settlers came to Highlands because it was cool and
fertile and settled there, Kenyatta let the Kikuyu settle in the Rift valley (which was former
Kalenjin land) this land issue also caused the ethnic clashes after the election
‐ Also companies that were formerly owned by the British, when they left after independence
Kikuyu bought them because they had access to loans
‐ Also former National and Greenlace Bank which became after independence the Kenya
Commercial Bank and then the shares were sold to Kenyans (but mostly Kikuyus)
‐ Also former Kenya bus company was deliberately collapsed after independence and then new
companies emerged, which were owned by Kikuyus
‐ In all sectors Kikuyu are favored
‐ Also: Nyerere in Tanzania came from a very small group, but the first president in Kenya
came from a very large group
‐ British built a railway to connect the coast and Uganda (Kenya = former British East Africa)
‐ Moi came from a small tribe (a subtribe of the Kalenjin) but he used the bigger tribe Kalenjin
for mobilization. Moi “created” the Kalenjin, he was member of parliament in Riftvalley and
looking for votes. Hence he made up the Kalenjin out of these tribes: “Nandi, Kipsigis,
Elgeyo (Keyo), Marakwet, Tugen (Moi’s own group) to have a larger support base. These
ethnic groups have similar languages. (“They come from the same father…”) Check
population census that before 1982 no Kalenjin and after 1982 Kalenjin as second largest
ethnic group in Kenya.
‐ Luo worked in large numbers for the colonial government (civil service)
‐ In Tanzania, Nyerere promoted Swahili and socialist approach versus Kenyatta even
sometimes addressed people that were not Kikuyu in Kikuyu language
‐ “Ethnicity starts with individualism” =/= socialism Individuals then close relatives then
tribe after that the sympathies stop
‐ “Agenda 4” ensure that Kenya gets a new constitution]
Can you think of any policy that could de-ethnicize politics?
‐ Maybe religion, but churches are associated with specific ethnic groups. Even votes for
bishops are ethnicized

108
‐ if ruler would come from a smaller community like Nyerere, also if there was an
“enlightened” ruler
‐ Democracy will not solve this in the beginning because democracy = majoritarian rule and
this is what politicians build on now = majority by their big ethnic group. Maybe democracy
helps in the end
‐ Kenya is heading to problems like in Somalia
‐ Policies to de-ethnicize politics = policies that tone down inequality/biased access to
resources
‐ People want to get resources and they use ethnicity as a tool to come to power and hence to
come to resources “How do we tone done the greed?”
“Our politics is just ethnic balancing”
‐ Strong nationalism is lacking in Kenya
Did the degree of politicization change over time?
‐ Ethnic tensions are increasing
‐ Young members of parliament are more ethnicized than older ones
‐ Even the university is ethnicized election of student organization determined by ethnic
votes
How has politics affected education?
‐ Moi distributed education to Rift valley (but also Rift valley was underprivileged before Moi
came to power)
Education system:
‐ Best schools are National Secondary Schools (#20) which receive the best students of the
country and they all receive scholarships; Provincial schools are also former missionary
schools
‐ Provincial secondary schools(~#1000) are slightly worse than national secondary schools
‐ District secondary schools (~#2200) are the worst schools
‐ Private schools majority of students from national schools went previously to private
primary schools (which cost much)

109
‐ District teachers might be promoted to province schools and province teachers want to be
promoted to national schools
‐ Areas of Kikuyu have more national, provincial and district schools than other districts
‐ Moi promoted that his people grow tea through tea they had more income, with more
income they started schools and then told the government to come and finance teachers. If
members of parliament are from the country’s ethnic group they then approve and legalize the
school
Other comments
‐ Only 1/3 of Kenya’s land is arable
‐ There are stipends for students that want to study abroad (~300.000 USD (??)) but this
money is only given to the Ministry’s ethnic group
‐ From the Bible “Those who have will be added, those who have little, even the little they
have will be taken away"
Interview: KN7
Is there a difference between Tanzania and Kenya?
‐ Big differences
‐ Tanzania is a lot poorer (due to socialism) than Kenya but is recently picking up
‐ Also education standards are higher in Kenya than in Tanzania
‐ Political system is different in Tanzania and Kenya Tanzania is ethnically more united
because of the political system by Nyerere (and by the introduction of socialism); Tanzania
was able to built a cohesive state
‐ Nyerere called Kenya a “man-eat-man society”
Education system in Kenya
‐ Late 70s: structural adjustment program by the IMF/World Bank education became more
expensive because government introduced cost-sharing Consequence: communities raised
funds for children to go to school.
‐ There is a lot of inter-ethnic cooperation in financing of schools (hospitals, wells)

110
‐ If there are children from different ethnic groups in one school then Kiswahili is used as an
instruction language
Politicization of ethnicity
‐ “Ethnic hatred has been brought by politics”
‐ Politicians don’t even adhere to their manifestos
Policies to tone down ethnicity?
‐ Distribute resources more evenly
‐ Preventing people from speaking the mother tongue is not an option since these people would
refuse it
‐ And Kiswahili is easily learned by everyone since it is a Bantu language
‐ Do common projects together and talk with each other to build cohesive country
Did the role of ethnicity change over time?
‐ There is positive and negative ethnicity
‐ What they (ECJP) teach in their civic education classes is that it is good to be born in one
ethnic group “unity in diversity”
‐ He personally advocates: everyone should pay their taxes but then also everyone should get
access to public services
Anything else?
‐ Colonial rulers did not intensify ethnic clashes through ethnic demarcation (=administrative
boundaries around ethnic entities), because even before there were ethnic clashes (cattle raids
etc.)

111
Appendix 4- 3: Extraction tables
Extraction table: Ethnic structures
Actor Time point Fact Reason Consequence Comments Source
Kenya
Nyerere came from a small ethnic group, but first president
of Kenya came from a very large group
\KP6.-13\
Moi came from a small tribe, a subtribe of the Kalenjin,
but used the bigger tribe Kalenjin for mobilization.
Moi “created” the Kalenjin. He made up the
Kalenjin out of these tribes: Nandi, Kipsigis, Elgeyo
(Keyo), Marakwet, Tugen (Moi’s own group).
These ethnic groups have similar languages.
population census that before 1982 no Kalenjin and
after 1982 Kalenjin as second largest ethnic group in
Kenya.
he was member of
parliament in
Riftvalley and
looking for votes,
and created the
Kalenhin for a larger
support base.
Before 1982 there is
no Kalenjin group
but after 1982
Kalenjin appears as
the second largest
ethnic group in
Kenya.
\KP6.-15\
if ruler comes from a smaller community, like
Nyerere
to de-ethnicize
politics
\KP6.-23\
Tanzania
more than 130 ethnic groups in Tanzania but no tribalism
(TN1-6)
\TN1.-5\
Sukuma
and
Nyamwezi
are together the largest ethnic group in Tanzania,
about 30 percent of the total population
\TP8-1.-4\
Chagga is not one ethnic group but consist of different
ethnic tribes, such as the Rombo etc.
\TP8-1.-5\
Maasai includes 10 different tribes \TP8-1.-6\

112
Zaramo are in Dar es Salaam and constitute approximately
20 percent of the population, also the Zaramo
comprise three different tribes
\TP8-1.-9\
there was never a president from a bigger ethnic
group, but always from backward small tribes
\TP8-1.-19\
Sukuma
and
Nyamwezi
comprise together over 1/4 of the population \TP8-2.-2\
Pare counted as one ethnic group in the census is actually
two distinct languages.
\TP8-2.-14\
Rufiji and
Ndengerek
o
are one group \TP8-2.-14\
Arusha and
Maasai
are one group \TP8-2.-14\
Kikuyu (in
Kenya)
are not the largest ethnic group in Africa, but the
Sukuma from Tanzania are larger
\TP8-2.-14\
Extraction table: Colonialism
Actor Time point Fact Reason Consequence Comments Source
Kenya
Kikuyu were the first to go to missionary
schools
schools were built in Highlands,
the area where Kikuyus lived
best climate in
the Highlands
\KN1.-2\
British did not want that different ethnic
groups unite against them
\KN1.-6\

113
British were less interested in Tanzania no white farms in Tanzania not KN1-6 (=against
united ethnic groups)
\KN1.-6\
Missionaries have been everywhere no influence of colonial
time on situation now
\KN2.-13\
British instrumented ethnicity for their
purposes
examples see
KD5-5
\KD5.-4\
British did not intensify ethnic clashes
through demarcation
even before there were ethnic
clashes, cattle raids etc.
\KN7.-24\
Tanzania
colonial period (and
also in later periods,
see TP3-3)
tribes that grew cashcrops,
namely Haya, Chagga,
Nyakyusa, were favored to get
education
\TP3.-2\
Missionaries caused differences in education
levels of different tribes
\TP8-1.-2\
Extraction table: Land grievance
Actor Time point Fact Reason Consequence Comments Source
Kenya
Maasai were removed from Riftvalley and placed in
Lakipia
((by British
colonial
regime))
\KM3.-16\
early 1970s former pastoralist areas were transformed into
national parks
\KM3.-17\

114
Kikuyu after British left the
country
bought land left by British, which where
situated in Kalenjin-areas, Riftvalley
Kikuyu settled in
formerly traditional
Kalenjin areas
\KD5.-13\
British settled in Highlands because it was
cool and fertile
\KP6.-8\
Kenyatta let Kikuyus settle in former Kalenjin-area, the
Riftvalley
also caused the ethnic
clashes after the
election ((2007))
\KP6.-8\
Tanzania
Extraction table: Nation building
Actor Time point Fact Reason Consequence Comments Source
Kenya
Germans ((German
colonial regime))
implemented Swahili as lingua
franca in Tanzania
\KN1.-1\
Luo and Luya feel disadvantaged politicization of
ethnicity
try to make ethnic groups
feel less disadvantaged to
de-ethnicize politics
\KN1.-17\
ethnic identity/home region
depicted in ID
\KN1.-21\
future educate the leaders, the
members of parliament, and
include conflict studies in the
school curriculum
students should learn about
ethnic conflicts
to de-ethnicize
politics
\KM3.-57\
Moi introduced the quarter system \KN4.-4\

115
end of 1970s students must attend secondary
school in their home district
quarter system \KN4.-7\
Quarter system means that only
one quarter of students in one
school are allowed to come from
a different district
\KN4.-8\
teachers were posted to their
home region and not regions
with different ethnic groups
Quarter system \KN4.-10\
vernaculars are used at least
until P4 as instruction language,
but even used in higher grades
(see reason)
quarter system: most
students and teachers come
from one region
\KN4.-12\
Kiswahili and English are used
in secondary schools
\KN4.-13\
Until late 1980s Kiswahili was used and taught
in primary schools but it was not
a subject to be examined
\KN4.-14\
vernaculars are allowed in office \KN4.-15\
future let different ethnic groups live
separately
they can't live together de-ethnicize
politics
\KN4.-34\
future introduce new education policy de-ethnicize
politics
\KN4.-34\
no nation building policies in
Kenya
\KD5.-25\
vernaculars are allowed to be
used in offices and in political
campaigns
\KD5.-34\

116
ethnic identity depicted in the ID \KD5.-35\
Nyerere promoted Swahili and a social
approach
\KP6.-17\
Kenyatta addressed people that were not
Kikuyu in Kikuyu language
\KP6.-17\
future religion to de-ethnicizes politics But right now churches
support specific ethnic
groups
\KP6.-22\
future policies to tone down
inequality/biased access to
resources
de-ethnicize
politics
\KP6.-27\
strong nation building is lacking
in Kenya
\KP6.-32\
Nyerere implemented political system
and introduced socialism
Tanzania is more
united, Tanzania
was built as a
cohesive state
\KN7.-4\
future distribute resources evenly de-ethnicize
politics
\KN7.-14\
preventing people to speak
vernacular is not an option to de-
ethnicize politics
people would
refuse it
\KN7.-15\
Kiswahili is easily learned by
everyone
it is a Bantu language \KN7.-16\
do common projects together
and talk to each other
to build a cohesive
country
\KN7.-17\
Tanzania

117
Nyerere 1960s
had a vision to unite the people;
Swahili as a national language
and a national culture
adopting a foreign/colonial
language, e.g. English,
does not work to create a
united culture and to build
a nation
\TN1.-9\
use of swahili eliminates
ethnicity
\TN1.-10\
cross-cutting: students finishing
primary school have to go to a
secondary school in a different
district
people employed
in the education
sector (ministers
and teachers)
come from various
ethnic groups
\TN1.-10\
Nyerere nationalized religious schools after independence
the elite came
from missionary
schools and
Muslims couldn't
get education.
There was a sharp
difference between
Christians and
Muslims.
\TN1.-14\
Nyerere his policy to send children from
North to South
to mix the nation
and to use Swahili
\TP2.-2\
vernaculars not allowed to be
spoken in offices or schools
\TP2.-3\

118
after
independence
policy to nationalize all schools to minimize the difference
between ethnic and
religious groups
\TP3.-4\
different role of ethnicity in
Kenya and Tanzania
different history: Tanzania
focused on national unity
\TG4.-35\
Nyerere abolished local chiefs and these
old chiefs were given
administrative districts to work
there
\TP5.-14\
TP5 is from Kilimanjaro region but
in his school there were children
from other ethnic groups
\TP5.-15\
1995-2005 not by law but as a general
understanding it was not allowed
to use vernacular languages in
political campaigns
\TP5.-17\
minimum requirement for
candidates for member of
parliament was to be able to read
and write in Swahili
\TP5.-18\
"Balancing Act" by the
government
ministers come
from different
ethnic groups
\TP5.-26\
starting in 2004
(see TG6-2 and
TG6-3)
code of conduct to make sure that
ethnicity will not
become more
important
\TG6.-5\

119
no actions against parties that
are viewed to use ethnic identity
to mobilize voters
actions against parties
would have discouraged
these young parties and
have a negative impact on
the multiparty system
\TG6.-28\
secondary students are sent to
different schools and had to
interact with children from other
tribes
\TG6.-31\
vernaculars cannot be used often
for political campaigning
mixed areas where people
will not understand one
vernacular
\TG6.-31\
1962/63 abolished local chiefs ethnicity is not
relevant
\TP8-1.-1\
Language is not an explanation
of why ethnicity does not matter
in Tanzania
counter-evidence from
Zanzibar, where people
speak one language but
TP8 said that Zanzibar is
not more united than the
Mainland
\TP8-1.-13\

120
Appendices 4-4 – 4-7: Thematic summary of extraction tables
The first three letters of the code of the source identify the interviewee and the number following the hyphen identifies the paragraph in the interview protocol (not
shown in Appendix 4-2).
Appendix 4- 4: Thematic summary of extraction table ethnic structures
Kenya Source Tanzania Source
1. Description of the ethnic structure 1. Description of the ethnic structure
1.1. General 1.1. General
• Kenyan’s presidents always came from large ethnic groups
\KP6.-13\ • Tanzanian’s presidents always came from small
ethnic groups
\KP6.-13\, \TP8-1.-19\
• Kikuyu are not the largest ethnic group in Africa Sukuma + Nyamwezi in Tanzania are larger
\TP8-2.-14\
1.2. Re-grouping of ethnic groups 1.2. Re-grouping of ethnic groups
• President Moi came from a small tribe (Tugen), a subtribe of the Kalenjin. When he was member of parliament in the Riftvalley and looking for votes he created the Kalenhin group to have a larger support political base. He combined the following tribes into the Kalenjin ethnic group: Nandi, Kipsigis, Elgeyo (Keyo), Marakwet, and Tugen, since these ethnic groups have similar languages.
\KP6.-15\
• Sukuma and Nyamwezi are together the largest ethnic group in Tanzania, about 25-30 percent of the total population and are larger than Kikuyu in Kenya (see \TP8-2.-14\)
\TP8-1.-4\, \TP8-2.-2\
• Chagga is not one ethnic group but consist of
different ethnic tribes, such as the Rombo etc. \TP8-1.-5\
• Maasai includes 10 different tribes \TP8-1.-6\
• Zaramo comprise three different tribes \TP8-1.-9\
• Pare counted as one ethnic group in the census is actually two distinct languages. Rufiji and Ndengereko are one group and Arusha and Maasai are one group
\TP8-2.-14\
2. Consequences of ethnic structure 2. Consequences of ethnic structure
• If president comes from small ethnic group decreased political relevance of ethnicity
\KP6.-23\ • More than 130 ethnic groups in Tanzania but no
tribalism \TN1.-5\

121
Appendix 4- 5: Thematic summary of extraction table colonialism
Kenya Source Tanzania Source
1. General impact of colonialism 1. General impact of colonialism
• Colonialist increased ethnic tensions: o they did not want that ethnic groups unite
against them o they instrumented ethnicity for their purposes
\KN1.-6\ \KD5.-4\
• Colonialists were less interested in Tanzania, since there were no white farms no need to hinder ethnic groups from uniting (see Kenya, \KN1.-6\)
\KN1.-6\
• Low impact of colonialist on ethnicity: o Missionaries have been everywhere in countryo Even before colonialist there were ethnic
clashes
\KN2.-13\ \KN7.-24\
2. Colonialist’s impact on education 2. Colonialist’s impact on education
• Schools were built in Highlands (best climate) and ethnic group there (Kikuyu) were first to attend school
\KN1.-2\ • Missionaries caused different education levels
of ethnic groups \TP3.-2\, \TP8-1.-2\
Appendix 4- 6: Thematic summary of extraction table land distribution
Kenya Source Tanzania Source
1. Colonial land policy 1. Colonial land policy
• Settlers in Highlands, because the area was cool and fertile
\KP6.-8\
• Maasai were removed from Riftvalley and placed in Lakipia
\KM3.-16\
2. Post-independence land policy 2. Post-independence land policy
• Supported by Kenyatta, the Kikuyu settled in Riftvalley (former Kalenjin country)
\KD5.-13\, \KP6.-8\
• Former pastoralist areas were transformed into national parks
\KM3.-17\
3. Consequences of land policies 3. Consequences of land policies
• Settlement of Kikuyu in traditional Kalenjin areas caused ethnic clashes after the election in 2007
\KP6.-8\

122
Appendix 4- 7: Thematic summary of extraction table nation building
Kenya Source Tanzania Source
1. General 1. General
• no nation building policies in Kenya \KD5.-25\, \KP6.-32\
• Nyerere implemented political system and introduced socialism Tanzania is united
\KN7.-4\, \KP6.-17\
• Tanzania focused on national unity different
role of ethnicity in Kenya and Tanzania \TG4.-35\
2. Language policies 2. Language policies
• Kenyatta used vernaculars to communicate \KP6.-17\ • Germans implemented Swahili as a lingua
franca \KN1.-1\
• vernaculars are used at least until P4 as instruction language, but even used in higher grades because students and teachers come from the same district (see quota system)
\KN4.-12\
• Swahili as a national language and a national culture adopting a foreign/colonial language, e.g. English, does not work to create a united culture and to build a nation
\TN1.-9\
• Until late 1980s, Kiswahili was used and taught in primary schools but it was not a subject to be examined
\KN4.-14\
• Swahili: o Mitigates relevance of ethnicity o Language not an explanation for united
country counter-evidence from Zanzibar, where people speak one language but are not more united than the Mainland
\TN1.-10\ \TP8-1.-13\
• vernaculars are allowed to be used in offices and in political campaigns
\KD5.-34\, \KN4.-15\
• vernaculars not allowed to be spoken in offices, schools, or political campaigning
\TP2.-3\, \TP5.-17\
• preventing people to speak vernacular is not an option to de-ethnicize politics, since people would refuse this
\KN7.-15\ • minimum requirement for candidates for
member of parliament was to be able to read and write in Swahili
\TP5.-18\
• Kiswahili and English are used in secondary schools \KN4.-13\
• Kiswahili is easily learned by everyone, since it is a Bantu language
\KN7.-16\
3. Cross-ethnic interaction & quota system 3. Cross-ethnic interaction & quota system
• System was introduced by Moi \KN4.-4\
• Nyerere’s policy: students finishing primary school had to go to a secondary school in a different district people employed in the education sector (ministers and teachers) come from various ethnic groups
\TP2.-2\, \TN1.-10\, \TP5.-15\,
\TG6.-31\
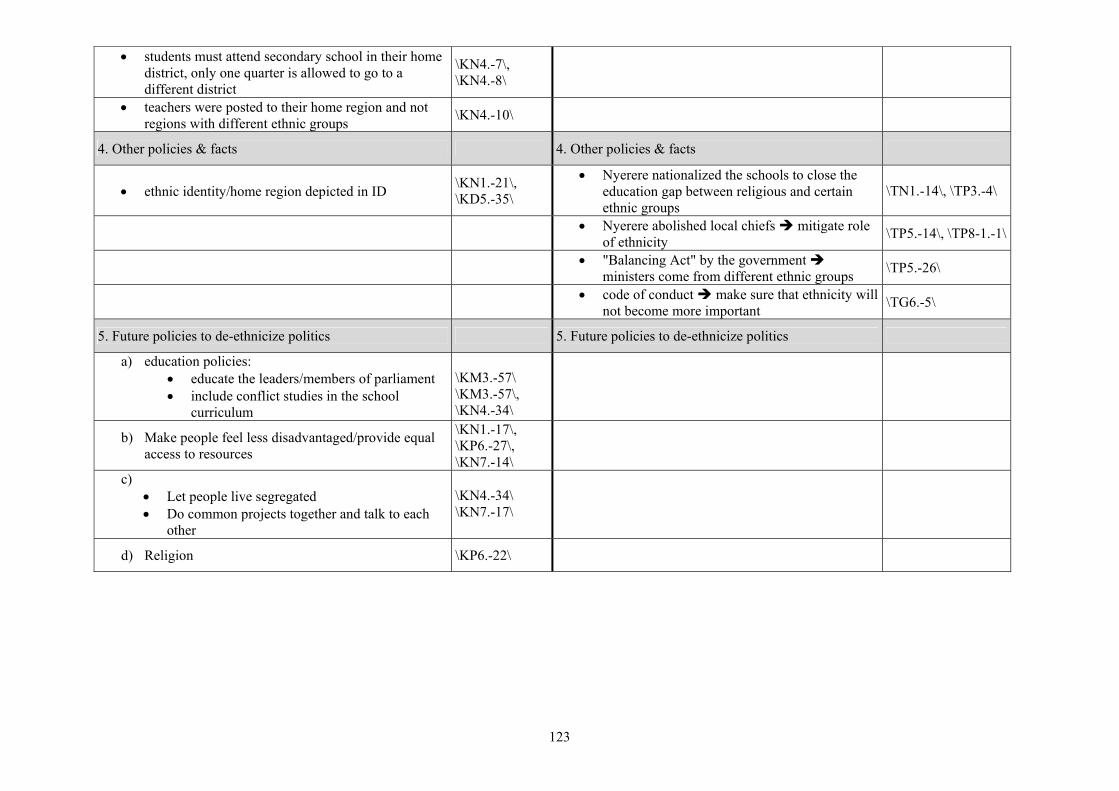
123
• students must attend secondary school in their home district, only one quarter is allowed to go to a different district
\KN4.-7\, \KN4.-8\
• teachers were posted to their home region and not regions with different ethnic groups
\KN4.-10\
4. Other policies & facts 4. Other policies & facts
• ethnic identity/home region depicted in ID \KN1.-21\, \KD5.-35\
• Nyerere nationalized the schools to close the education gap between religious and certain ethnic groups
\TN1.-14\, \TP3.-4\
• Nyerere abolished local chiefs mitigate role
of ethnicity \TP5.-14\, \TP8-1.-1\
• "Balancing Act" by the government
ministers come from different ethnic groups \TP5.-26\
• code of conduct make sure that ethnicity will
not become more important \TG6.-5\
5. Future policies to de-ethnicize politics 5. Future policies to de-ethnicize politics
a) education policies:
• educate the leaders/members of parliament
• include conflict studies in the school curriculum
\KM3.-57\ \KM3.-57\, \KN4.-34\
b) Make people feel less disadvantaged/provide equal access to resources
\KN1.-17\, \KP6.-27\, \KN7.-14\
c)
• Let people live segregated
• Do common projects together and talk to each other
\KN4.-34\ \KN7.-17\
d) Religion \KP6.-22\

124
Chapter 5: Ethnic diversity and parental involvement
5.1 Introduction
As demonstrated in chapter 3, ethnic diversity in communities is found to have a significant
negative impact on school attendance rates. This chapter will provide more insights into the
relevance of community activities in local schools. A widely acknowledged community level
activity is parental involvement in their children’s schooling. Involvement of parents in their
children’s education, for example by helping with homework, becoming engaged in school
functions and communicating with the school, is widely seen as an important factor contributing
to the improvement of educational outcomes in developed countries.
Most developing countries are committed to achieve universal primary education by 2015
as specified in the Millennium Development Goal No. 2. However, increasing enrollment rates
and the quality of primary education requires substantial additional financial resources currently
lacking in these countries. Hence, other strategies, which might help to increase educational
outcomes and spare a country’s finances, are sought for. In particular, existing equipment and
input factors should be used more efficiently to spur educational outcomes. Here, parental
involvement activities might be the missing link to efficiently improve attendance rates and
learning outcomes.
Extensive literature, mostly from the U.S., demonstrates that higher involvement of
families in schooling is beneficial for children’s educational outcomes (cf. Walberg, 1984;
Topping, 1992; Epstein, 1992; Henderson & Berla, 1996; Sui-Chu & Willms, 1996; and Sheldon,
2003). Indeed, family involvement was found to generate positive effects even for less educated
and poor parents. While these parents might still had a certain number of school years, less
educated parents in African countries are likely to be illiterate and have not attend any school.
Whether there still exists a positive effect of family involvement for less educated and poor
parents in Africa remains subject to examination in this chapter.
Empirical evidence on the link between family involvement activities and educational
outcomes in African countries is, so far, scarce. Scholars acknowledge the relevance of active
participation by the community in schools, e.g. via school associations, on teachers’ behavior and
children’s learning outcomes (Michaelowa, 2000; Glewwe and Kremer, 2006, 997; and Banerjee
& Duflo, 2006). Moreover, some scholars specifically acknowledge the role of parental

125
involvement in developing countries (Cohn & Rossmiller, 1987; and O'Toole, 1989). However,
little evidence is presented for the impact of family involvement activities in ethnically diverse
communities in developing countries.
In addition, rigorous empirical studies assessing the impact of parental involvement on
children’s education are mostly inhibited by the lack of appropriate indicators of parental
involvement. Studies proposing a link between parental involvement and their children’s learning
outcomes are mostly bound to rely on proxies, such as mother’s or father’s years of education,
and are, therefore, subject to possible omitted variable bias (see Glewwe and Kremer, 2006; 988).
Scattered empirical evidence testing specific indicators of parental involvement, such as school
associations or monitoring of teachers’ attendance, provide mixed evidence on the impact of
parental involvement in the education sector (Michaelowa, 2000; and Banerjee & Duflo, 2006).
This chapter will contribute to the scholarly debate by testing specific family involvement
indicators on children’s educational outcomes in low-income countries and provide evidence on
the impact of family involvement activities in diverse communities. In particular, this chapter
discusses the existing literature on family involvement and identifies three relevant components
of family involvement in low-income countries. These components are, then, tested using specific
parent involvement indicators from school mapping data from Tanzania. More precisely, the
effect of the three parental involvement activities, i.e. monitoring school attendance by the
parents, increasing the family-school relationship, and providing lunch at school, on enrollment
rates and the quality of education is estimated in a panel model for Tanzanian villages. In
addition, this chapter estimates the effect of parental involvement conditional on parents’ income
and education level and the degree of ethnic diversity of the community.
Following this introduction, section 5.2 presents the literature on family involvement (5.2.1) and
specific hypotheses for low-income countries (5.2.2). The dataset and parental involvement
indicators used in the econometric analysis are discussed in section 5.3. Section 5.4 presents the
estimation strategy (5.4.1), the econometric results for primary enrollment rates (5.4.2) and for
the quality of education (5.4.3). The discussion of the econometric results is presented in section
5.5, and the conclusion in section 5.6.

126
5.2 Literature and hypotheses
5.2.1 Existing family involvement literature
The role of parental involvement in children’s education has received continuous scholarly
attention over the past two decades. Family involvement 50 encompasses a wide range of
activities, such as parent’s efforts at home (helping with homework, and establishing a supportive
learning environment), communication between the school and the parents, and volunteering of
parents in school functions (such as parent-teacher associations, school boards, or local
improvement councils) (cf. Epstein, 1992; and Horn & West, 1992; 11-37). While most studies
on the impact of family involvement on educational outcomes report positive effects (cf.
Walberg, 1984; Topping, 1992; Epstein, 1992; Henderson & Berla, 1996; Sui-Chu & Willms,
1996; Sheldon, 2003)51 , the magnitude of these effects seem to vary substantially with the
population of the study. In particular, growing evidence suggests that parents’ socioeconomic
status (SES), which includes parents’ level of education, income and occupational status, and
ethnicity, drives the variation of the effect of community involvement.
Studies point tentatively to a positive impact of SES on the extent to which families
become involved in their children’s education (cf. Eagle, 1989; and Sui-Chu & Willms, 1996).
Involvement of working-class families in schools is found to be substantially lower than
involvement of families from the middle class (Lareau, 1987 and 1989). Furthermore, higher
education of parents is seen to increase participation of parents in their children’s education
(Lareau, 1987; Stevenson & Baker, 1987; and Useem, 1992).
Parents with high SES seem not only to become more involved in their children’s
education, but the effect of this involvement also tends to be higher than the effect of
involvement of low-SES families (Stevenson & Baker, 1987; Henderson & Berla, 1996, 8-12;
and McNeal, 1999). Parents with higher income and educational attainment seem to be more
familiar with the procedures at schools, are able to comply with teachers’ requirements in parent-
teacher relationships, and tend to have more positive personal experiences with schooling
(Lareau, 1989). Through these channels, the effect of parental involvement is strengthened in
high SES families.
50 By employing the term family involvement instead of parent involvement it is acknowledged that besides parents, other family members, neighbors and friends might collectively contribute to the child’s development. 51
Some authors also report negative effects of parental involvement on educational outcomes but explain this
phenomenan by reverse causation (cf. Milne et al., 1986; and Horn & West, 1992). Parents are likely to get more involved in their child’s education if the child is not doing well in school.

127
In addition, Delgado-Gaitan (1991) argues that parents from ethnic minorities seem to be
more reluctant to participate in their children’s schooling. The author explains that language
barriers and lack of specific cultural knowledge of schools prevents parents to become involved.
The argument that low-SES families feel intimidated when dealing with school staff might,
therefore, explain why parents from ethnically and linguistically diverse neighborhoods are less
likely to become involved in schools. In particular, while McNeal (1999) reports significant
lower effects of parental involvement for minority students than for white students, other scholars
find large variations of the involvement effect for different ethnic groups depending on the type
of parental involvement (Milne et al., 1986; and Sui-Chu & Willms, 1996).
In sum, increasing family involvement in schooling seems to generate positive effects on
educational outcomes. In addition, socioeconomic status (SES) emerges as an important predictor
for the effects of family involvement. Parents from the middle-class with high income and high
education are particularly strongly involved in their children’s education. This increased
involvement for high SES families also translates into a disproportionately high effect of parental
involvement on educational outcomes. The effect of family involvement is seen to be highest for
parents with high SES and for parents coming from ethnically homogenous communities.
5.2.2 Family involvement in developing countries
Despite the evidence on the high relevance of family involvement on educational outcomes,
empirical evidence on the impact of family involvement in developing countries is surprisingly
scarce. Even international agencies focus primarily on the role of families and the community in
the management of financial resources in the education sector and, thereby, neglect potential
beneficial effects of other components of family involvement, such as family-school
communication, and volunteering of parents in school committees (cf. Naidoo, 2005, 73-89; and
UNESCO, 2008a; 153-163).
Scholars have acknowledged that besides physical inputs, such as teachers, books and
school buildings, other inputs might explain some of part of the residual variance in student
achievement (cf. Fehrler et al., 2009, 1556; and Glewwe & Kremer, 2006; 988). Proposed
additional explanatory factors are teachers’ motivation (cf. Michaelowa, 2001; Somech & Drach-
Zahavy, 2000), teachers’ attendance (cf. Banerjee & Duflo, 2006), and accountability and efforts

128
by teachers (cf. Fehrler et al., 2009). Moreover, scholars propose an impact of active participation
by the community in schools, e.g. via school associations, on teachers’ behavior and children’ s
learning outcomes (Michaelowa, 2000; and Banerjee & Duflo, 2006). In particular, Glewwe and
Kremer (2006; 997) argue that local communities might know most about their children’s needs
and, hence, have a strong motivation to actively contribute to the local school. In addition, the
overall relevance of parental involvement in developing countries is specifically acknowleged by
Cohn and Rossmiller (1987) and O'Toole (1989).
However, rigorous empirical studies assessing the impact of parental involvement on
children’s education are often impeded by lack of adequate measures of parental involvement. As
Glewwe and Kremer (2006; 988) argue, parents‘ motivation and ability to help their children with
school work, are often proxied by mother’s or father’s years of education. Empirical evidence for
a related family involvement activity, namley existence of school associations, is presented in
Michaelowa (2001). Drawing on cross-country data from francophone African countries, the
author presents evidence on an adverse effect of active school associations on student
achievement (Ibid, 1708). In particular, the author argues that involvement of parents in the
schooling might distract teachers from their teaching activities. In addition, some evidence exists
on a positive impact of parents monitoring contract teachers’ activities in Africa (Bourdon et al.,
2010) and on parents’ role in helping children with their homework (Chinapah, 2003).
However, most theories on family involvement propose that such activities might be
particularly fruitful to increase educational outcomes in environments with low financial
resources. Drawing on Epstein’s (1992; 1141) review of the parental involvement literature, one
can argue that family involvement might be able to compensate for the negative effect of low
family income and parents’ low education level on educational outcomes. Active involvement of
parents in their children’s education might, thus, be a mechanism through which parents in low-
income countries might effectively increase their children’s education.
One possibility for parents in developing countries to become involved in their children’s
education might be to actively support and monitor their children’s attendance at school. Parents’
monitoring of their children is reported to have positive effects on educational outcomes in the
U.S. (McNeal, 1999; and Epstein & Sheldon, 2002). In addition, this involvement activity seems

129
promising to be promoted in a developing country setting.52 Actively monitoring children’s
school attendance requires only a minimum of time and no other prerequisites are necessary.
Hence, fostering monitoring activities might be readily implemented in developing countries.
A second family involvment component, which might be particularly suitable in the
developing country setting, is the improvement of the relationship between the school and the
community. Evidence from the U.S. indicates that enhanced family-school relationships have
significantly positive effects on rates of absenteeism (Sheldon & Epstein, 2004) and on test
scores (Sheldon, 2003). In developing countries, in turn, strengthening the exchange and
communication between the parents and the school might enable parents to monitor their
children’s progress more closely and to communicate their children’s needs to the teachers.
Again, this involvement activity is nearly free of cost and requires only limited amounts of time
by the parents. In addition, policy programs advocating stronger relations between the family and
the school, e.g through parent-teacher conferences or other school activities involving the
community, might be readily implementable.
A third involvement activity potentially beneficial in developing countries is the provision
of lunch at school by the community. School-feeding programs are advocated by scholars and
international agencies as a means to increase enrollment, cognitive performance and learning
outcomes of children (cf. Levinger, 1986; and Epstein & Sheldon, 2002). Additional nutrition
intake through lunch at school might have particular benefical effects on educational outcomes of
children from poor families in low-income countries. While the first two family involvment
activities involve only little time and financial resources, providing lunch at school by the
families requires at least a minimum of additional income and organizational skills. However, the
cooperated effort by the all parents in the community to provide lunch at school might
substantially reduce the per child costs of school lunch. In addition, if all parents in the
community agree to provide lunch at school, this might also have incentives for parents to enroll
their children who are currently not attending school. Hence, policies advocating the provision of
school-lunch might be implemented in low-income countries at only minor costs and
organizational requirements, and are seen to considerably increase children’s educational
outcomes.
52 For related evidence on monitoring of teachers’ attendance by external monitors, see Banerjee and Duflo (2006).

130
From the hitherto theoretical discussion, one can deduct hypotheses on the impact of the three
family involvment components on educational outcomes in developing countries. In particular,
increasing the involvement of families through monitoring school attendance of children,
improving the relation between the school and the families, and providing lunch at school, is
assumed to be beneficial for educational outcomes:
H1a: Increased monitoring of children’s school attendance raises educational outcomes.
H1b: Enhanced family-school-relationship raises educational outcomes.
H1c: Increased provision of school lunch raises educational outcomes.
In addition to the linear effects of the three family involvement components (H1a-c), several
demographic characteristics have been identified in the parental involvement theory (section
5.2.1), which might influence the impact of family involvement on educational outcomes. First,
the effect of family involvement is seen to be substantially higher in families with high SES,
defined by high education, income and occupational status:
H2: The effect of family involvement on educational outcomes (H1a-c) increases with parents’ SES.
The second influential factor on family involvement is the ethnic diversity of the community. As
argued in section 5.2.1, evidence from developed countries demonstrates that parents from
minority ethnic groups seem more reluctant to participate in their children’s schooling due to
language barriers and lack of cultural capital (Delgado-Gaitan, 1991; Sui-Chu & Willms, 1996;
and McNeal, 1999). The existence of ethnic minorities in a society is proxied in this chapter by a
measure of ethnic diversity in a community. Therefore, one can posit the following hypothesis:
H3: The effect of family involvement on educational outcomes (H1a-c) decreases as ethnic
diversity of the school community increases.
5.3 Data and operationalization
Understanding the impact of family involvement and the relation between family involvement
and ethnic diversity seems particularly important for low-income countries and countries with

131
high numbers of ethnic groups. Moreover, to test the hypotheses on parental involvement,
specific indicators on these three involvement activities are necessary.
The school mapping dataset from Tanzania collected in 1999-2002 provides detailed
information on family’s involvement in the school, a school’s equipment and financial resources,
teacher’s qualifications, and general community characteristics on the ward level (see discussion
below). This information is crucial to carry out a rigorous study on the role of parental
involvement in the education sector. In addition, as demonstrated in section 2.2.1, Table 3,
Tanzania is the most ethnically diverse country in the world. Therefore, the dataset from
Tanzania is used to estimate the effect of parental involvement activities on educational outcomes
in ethnically diverse communities.
To determine to which extend results obtained from the study of Tanzanians communities
is transferable to other low-income countries, Tanzania’s economic, population and education
characteristics are compared to average characteristics of low-income countries (Table 8). As can
be seen in Table 8, GDP per capita and received development aid from Tanzania seems
comparable to other low-income countries. Moreover, in comparison to other low-income
countries, a higher share of the Tanzanian population seems to be employed in agriculture.
Furthermore, Tanzania’s life-expectancy is only marginally lower than average. In addition,
Tanzania’s total population and the age structure seem comparable for low-income countries.
Turning to the education system characteristics, Tanzania’s performance in the education system
compares to the mean estimates of the low-income countries. Net enrollment rates and
completion rates of Tanzanian children, as well as the ratio of pupils to teachers in primary
schools are similar to mean values for low-income countries.
In general, Tanzania seems to possess economic, population, and education system
characteristics that are comparable to other low-income countries. This provides some confidence
that results obtained from the study of parental involvement in Tanzanian communities might be
comparable to other low-income countries.

132
Dataset
The study employs the school mapping data, which was collected in Tanzania by the Ministry of
Education and Culture (MoEC) and the Japanese International Cooperation Agency (JICA) in
two waves during 1999 - 2002 (MoEC/JICA, 2002a, 2002b).53 The dataset contains information
on over 600 wards in Tanzania. A ward is the second smallest administrative unit in Tanzania and
in the dataset a ward comprises on average 6.6 villages and 8174 people.54 Graph 3 depicts the
location of the districts studied during the school mapping project and Appendix 5-1 lists the
name and number of wards covered. Information on all wards from 30 districts in 13 regions (out
of 20) was collected. 14 out of the 30 districts in the sample are urban districts, which account for
one third of the population in this area.
Table 8: Tanzania’s and low-income countries’ characteristics in comparison
Country’s characteristics Low-income countries
mean
Tanzania
GDP per capita (in 2000 USD) 322.68 [278.41 - 366.96]
268.23
Aid per capita (in 2000 USD) 39.66 [24.45 - 54.86]
30.11
Employment in agriculture (in % of total employment)
57.26 [49.81 - 64.70]
82.1
Life expectancy at birth, total (in years)
54.45 [52.19 - 56.72]
49.13
Population, total 41200000 [1746791 – 80600000]
33800000
Population ages 0-14 (% of total) 42.75 [41.42 - 44.09]
44.48
School net enrollment primary (in %)
64.40 [58.50 - 70.30]
53.43
Primary completion rate (in % of relevant age group)
51.14 [43.38 - 58.91]
54.79
Pupil-teacher ratio in primary schools
41.86 [38.23 - 45.49]
41.35
Note: Values denote the mean estimates and 95% confidence intervals are reported in parentheses. Source: World Bank, 2008; for all countries in the classification “low-income” (N=52), for the year 2000 (missing values are approximated by values for proximate years)
53 Information from earlier school mapping projects by the UNICEF could not be included in this study due to the lack of questions on family involvement and differing implementation of the school mapping study (MoEC/JICA, 2002B; 8-17 ). 54 Tanzania’s primary administrative unit is region, the secondary is district, and the tertiary is ward.

133
Graph 3: Location of school mapping districts
Note: Own depiction, information drawn from MoEC/JICA (2002b).
Comparing the urban-rural sampling distribution with population census data from 2000 confirms
the representativeness of the sample for the whole country of Tanzania.55
Most importantly for this analysis, the school mapping dataset contains detailed
information on family’s involvement in the school, a school’s equipment and financial resources,
teacher’s qualifications, and general community characteristics on the ward level. Data was
collected through two survey instruments – a village leader survey and a head teacher survey. In
particular, village leaders and head teachers were asked to complete the questionnaires by
drawing on existing data at schools or by interviewing school committees and parents
55 The 2002 population census reports that 23.1 % (76.9 %) of the population lives in urban (rural) areas (Tanzania National Bureau of Statistics, 2009).

134
(MoEC/JICA, 2002b; 25). Village leaders visited each household in the community to assess the
number of children in the community, whether they are enrolled in school, and the reason for not
going to school. In addition, head teachers completed questionnaires by using their own records
and interviewing teachers, pupils and members of the school committee. The information from
the village leaders and head teachers was corroborated by data from ward and district officers.
Dependent variables
To capture the impact of family involvement on the quantity and quality of education, two
different measures of educational outcomes are employed. First, the variable enrollment
measures the net enrollment rate of students in primary schools in Tanzania. It captures the
percentage of children of official primary school age, who are enrolled in primary education, and,
thereby, indicates how many children currently attend school.
However, increased family involvement might not only raise attendance rates of students,
but also the quality of schooling. Therefore, the variable exampassrate is used to capture the
quality of primary education. Exampassrate measures the percentage of students which
completed seven years of primary school and successfully passed the primary school leaving
exam (PSLE) assessed at ward level. Note that students need to register to take the PSLE. The
variable exampassrate measures, then, the percentage of registered candidates for the PSLE that
successfully passed the PSLE. The registered candidates and the number of pupils are highly
correlated (0.88) and on average 10 % of the pupils enrolled in the primary school register for the
PSLE. 56 Since only successful candidates of the PSLE are eligible to attend secondary school,
exampassrate seems a suitable measure of the quality of primary education.
Family involvement variables
Data on the family involvement activities in the ward was drawn from the section “community
related factors” of the village leader questionnaire. Village leaders were asked to select from a list
of “some of the efforts” by the community “to make children attend school” (MoEC/JICA,
2002b; A5-17). The list given to the village leaders included, inter alia, the three following
points: “d) Provision of lunch at school”, “e) Monitoring of school attendance by the community” 56 Note that the use of the exam pass rate of the 10 % registered students does not entail a selection bias due to the following reasons. Whether students register for the final exam seems to be influenced heavily by parents’ willingness to pay the additional costs for the exam (exam fees, travel costs, tutoring). In addition, there is still a high variation of values for the variable exampassrate and on average only 20 % of the registered students pass the final exam (see Apppendix 5-3).

135
and “g) Enhancement of school-community relationship” (italics added).57 Village leaders were
expected to fill out the questionnaire by consulting the village council, parents and pupils in their
village. Villages, where families generally agreed that efforts (i.e. school lunch, monitoring, or
school-community relationship) have been made, denoted this with a 1 (zero otherwise). The
dataset, then, reports the number of villages in a ward where communities affirmed the existence
of efforts, and the total number of villages in a ward. The respective family involvement variable
on ward level is, then, calculated by dividing the number of affirmative villages by the total
number of villages. The indicator, hence, reports the percentage of villages in a ward, where
familiy involvment activities are pursued.
The first hypothesis, H1a, postulating a positive impact of parents’ monitoring of their
children’s attendance, is assessed by employing the indicator monitoring. This variable reports
the percentage of villages in a ward, where families confirmed that they monitor their children’s
school attendance (see point e) above). The second hypothesis on the impact of stronger school
community relations on educational outcomes (H1b) is tested using the indicator family-school
relation. This variable measures the percentage of villages in a ward, where families try to
improve the relation between the school and the community (see point g) above). Last,
hypothesis H1c on the impact of the provision of school lunch is assessed by using the variable
school-lunch. This indicator measures the percentage of villages in a ward, where the families
affirmed that they provide lunch at school (see point d) above).
Socioeconomic status and ethnic diversity
Besides the linear impact of the three components of family involvement, socioeconomic status
and ethnic diversity are postulated to have an impact on the efficacy of family involvement
activities (H2 and H3). The socioeconomic status of parents is captured by an indicator of parents’
level of education (parent’s education) and of parents’ income (parents’ income).58 Parent’s
education is measured by the percentage of adults (older than 14 years) in the ward that are
literate. In addition, since no direct measure of parent’s income is readily available in the school
57 The complete list reads as follows: “a) Provision of accessible and safe water, b) Provision of medical/health services c) Provision of shopping facilities at school, d) Provision of lunch at school, e) Monitoring of school attendance by the community, f) Enforcement of the bye-law in respect of compulsory schooling, g) Enhancement of school-community relationship, h) Others , i) No effort has made” (MoEC/JICA, 2002B; A5-17). 58 The third dimension of the socioeconomic status, i.e. occupational status of parents (see section 2.1), is not included in the estimation due to its high correlation with parents’ income (0.79) and since it was used to impute the missing values for parent’s income.

136
mapping dataset, families’ financial resources are proxied by the percentage of houses in the
ward that are equipped with electricity.
Furthermore, to test hypothesis H3 on the role of ethnic diversity on the impact of
involvement the indicator ethnic diversity is used. Since the Tanzanian government restricted
collection of information on ethnic identities after 1967, and the school mapping dataset,
therefore, does not include information on ethnicity, this chapter draws on information of district
level ethnic identity from the 1967 population census (United Republic of Tanzania, 1971).
While the absolute size of the population has increased during the last decades, experts assume
that the relative size of the ethnic groups and their location remained fairly constant.59 The data
on ethnic identity from the population census is only available on the district and not on the
community level. However, higher ethnic diversity on the district level is assumed to proxy
increased ethnic diversity on the ward level. As in chapter 3, the variable ethnic diversity is
calculated relying on the ethno-linguistic fractionalization indicator (see Appendix 3-7 ii)).
Control variables
Besides family involvement and the socioeconomic status, financial resources of the school,
equipment and quality of teachers are conventionally used to explain variations in educational
outcomes (cf. Fehrler et al., 2009; and Glewwe & Kremer, 2006). Therefore, variables are
included to measure the financial contributions by parents and by the state (parents’ spending,
state spending-1), the school equipment (books), and the quality of teachers (teachers). Parents’
spending is proxied by the amount of school fees paid in a ward in the year of the survey.
Information on education spending of the state is not available in the school mapping dataset but
had to be drawn from the Tanzanian budget accounts (United Republic of Tanzania, 1998a,
1998b). The variable state spending-1 measures the sum of recurrent and construction spending
per 100 school children on district level in the previous year (see also discussion in section 5.4.1).
Since it is expected that the effect of spending on educational outcomes is increasing at a
decreasing rate, and, hence, non-linear, both spending variables are entered in logarithmic form.
The variable equipment measures the amount of available textbooks for mathematics,
Kiswahili, English, science, skills studies and social studies in a ward. The indicator teachers
59
Personal communication with Prof. Sam Maghimbi, University of Dar es Salaam, Dar es Salaam, Tanzania
(11/25/2008).

137
captures the percentage of teachers, who have a high teaching qualification (diploma or grade A)
in the ward60. Data on both variables are drawn from the school mapping dataset.
In addition, various demographic and education system characteristics of the wards are included
in the regression, such as school-age population (children), whether children need less than 30
minutes to walk to school (distance), number of villages (villages), number of schools (schools),
and number of private schools (private-schools). To keep the depiction of the regression results
well-arranged, these five variables are not depicted separately in the regression tables. Whether
these five variables are included in the estimation is depicted by “Yes” in the row ward controls
in the regression tables (Table 9 and 10).61
Since the school mapping dataset contains most complete information, only the variable parents’
income contained missing values (ca. 26%). These were imputed with variables measuring
occupational status, access to water and number of households equipped with telephones from the
school mapping dataset. A correlation matrix is depicted in Appendix 5-2 and a detailed
description of variables’ definitions and sources is provided in Appendix 5-3.
5.4 Econometric analysis
5.4.1 Empirical strategy
As described in section 5.3, the school mapping dataset contains information on wards, which are
nested in districts (and districts are nested in regions). The nested structure of the dataset is
accounted for by estimating a panel model and treating the wards (t) as the repeated measurement
within the same district (n). Most variables of the dataset are on ward-level with the exception of
state spending-1 and ethnic diversity. While these latter two variables capture some variation on
the district level, district-specific effects are included in the regression to control for unobserved
heterogeneity on the district level. Due to the invariance of state spending-1 and ethnic diversity
across wards of the same district, a random-effects (RE) model is estimated and consistency of
60 The survey list four categories of teachers’ qualification: Diploma, Grade A, B, C. According to personal communications with the Ministry of Education and Vocational Training, Dar es Salaam, Tanzania (11/14/08), Diploma and Grade A are the highest qualifications. 61 The school mapping dataset contains information on urban and rural districts. However, a dummy variable for urban districts was excluded from the regression due to its very high correlation with other ward controls (schools (-0.49), villages (0.42)) and with the explanatory variables parents’ income (0.46) and ethnic diversity (0.56)) (results not shown).

138
the RE-model is tested by the hausman test. In addition, potential unobserved heterogeneity on
the regional level is captured for by the inclusion of regional dummies (region dummies).
Through the insertion of district random effects and regional dummies, variations of the
dependent variable are assumed to arise only from ward level heterogeneity. Therefore,
conventional explanatory variables of educational outcomes, such as financial resources by the
state and by parents allocated to a school, and the school’s equipment with books, and the quality
of teachers, are included in the regression. The variable state spending-1 is inserted in the
regression as lagged by one year. The rational for this step is that distribution of resources by the
state might possibly be influenced by the quality of schools. Through the insertion of the lag of
the state spending variable, a possible reverse causation running from educational outcomes to
state spending is foreclosed.
The information on parents’ spending is only available for the same year as the dependent
variables. However, since the amount of school fees is fixed, parents’ only response to the quality
of schooling is to take their child from the school and not to pay less tuition. Therefore, the
variable parents’ spending is expected not to be reversely affected by educational outcomes.
In addition to the spending variables, the two input variables, books and quality of the
teachers, are included. While these indicators might partially be substitutes for the financial
endowment of a school, the variables are nevertheless included to account for residual effects of
other financial sources and control additionally for unobserved heterogeneity on the ward level.
Besides the financial and physical input variables, various indicators of a ward’s
characteristics (ward controls), such as the number of children, distance to school, number of
villages and schools, and number of private schools are included to control for additional
variation of the dependent variables.
The remaining variation of educational outcomes in wards is sought to be explained by
the inclusion of the three family involvement components, i.e. monitoring, family-school relation,
and school-lunch, in the regression. These involvement activities are carried out by senior
members of the community, which completed their schooling years ago. While young, educated
school-leavers might readily see the need to become involved in education, they are not the
decision-makers in the community. Hence, the quality of today’s schooling does not
systematically affect the willingness of parents to become involved in their children`s schooling
and, thus, reverse causation from the dependent variables to the family involvement indicators
can be excluded.

139
The general form of the regression is depicted in equation (1). To test hypotheses H1a-c, the
family involvement variables (Iit) enter as linear terms in the regression. In addition, hypotheses
H2 and H3 are tested by successively including interaction terms between the family involvement
components (Iit) and the SES variables and ethnic diversity (Sit). The regression also includes the
financial resources and school inputs (Eit), the ward controls (Wit) and the regional dummies (Ri):
Educationit = Iit β1+ Sit β2 + IitSit β3 + Eit β4 + Wit β5+ β6Ri + (αi + εit) (1)
where (αi + εit) is the combined error uit for the tth ward in the ith district.
To assess whether the family involvement components add to the explanation of the variation of
the educational outcomes variables, five succeeding models are estimated. First, a baseline model
containing all variables, except the family involvement indicators, is estimated (Table 9 and 10,
model 1). Next, a model, containing the linear effects of the family involvement variables, is
estimated (model 2). In the three succeeding models, the interactions of all family involvement
variables with parents’ education (model 3), parents’ income (model 4), and ethnic diversity
(model 5), are estimated.
The relevance of the family involvement variables and the interaction with family’s SES
and ethnic diversity is sought to be determined in the following way. First, model 2 including the
family involvement indicators is tested against the baseline model (model 1) without the family
involvement variables (Table 9 and 10, Wald (against model 1)). This test indicates whether
family involvement indicators increase the overall explanatory power of the model.
In a next step, the relevance of the SES and ethnic diversity variables to explain variations
in the effect of family involvement will be assessed. In particular, significant coefficients of the
interaction terms in the models 3-5 might indicate that the marginal effects of the family
involvement components depend on average on family’s SES and ethnic diversity. However,
since in model 3-5, the three family involvement components are interacted with the same SES or
ethnic diversity variable, possible multicollinearity might blur the significance of the coefficients
of the interactions. Therefore, the relevance of the interaction terms is corroborated by
performing a Wald test. In particular, the three models including the interaction terms between
the SES and ethnic diversity and the family involvement components are tested against the linear

140
model (model 2) of family involvement. The Wald test is depicted in Table 9 and 10, under Wald
(against model 2).
Next, in the cases, where the interaction between the family involvement components and
the SES and ethnic diversity variables turn significant, the marginal effects are computed
following Brambor et al.’s estimation approach (2006).
Last, the assumption of normality of the error terms was tested and could not be rejected. It was
also ensured that the results were not driven by individual outliers.
5.4.2 Econometric results: Enrollment rates
The econometric results for net enrollment rates are depicted in Table 9. Throughout the models
(1) – (5), the conventionally used explanatory factors report the expected sign. Parents’ financial
contributions to the school are positive and significant (or close to significance) at the 10 % level.
The variable state spending-1 is positive and turns highly significant when the interaction terms
are included (model 3 – 5). The coefficients for the variables teachers and books remain
insignificant, which suggests that input variables are less relevant for enrollment.
In addition, the socioeconomic status of parents emerges as a significant predictor of
educational outcomes. In particular, the linear coefficients of parents’ education and income are
positive and significant at the 1 % level throughout the models.
The ethnic diversity of wards emerges with a negative coefficient significant at the 20 %
level in the baseline and linear model, and turns significant (or close to significance) at the 10 %
level when the interaction terms are included in model 3 and 4. The negative impact of ethnic
diversity on primary enrollment rates confirms earlier econometric results reported in chapter 3.
Moreover, from the ward controls, the variables children and distance emerge with
significant coefficients and the expected sign (results not shown). The R-squares and the overall
Wald test indicates a good general fit of all models and the hausman test confirms the consistency
of the use of the random-effects estimation method.
Now, turning to the question whether family involvement can explain some part of the variation
of the enrollment rates, model 2 including the linear terms of the family involvement variables is
compared to the baseline model (model 1). The Wald test rejects the joint null hypothesis that the

141
three family involvement coefficients are zero at the 10 % level. It, thereby, provides some
evidence for the necessity to account for family involvement in explaining enrollment rates.
Next, the significance of the interaction terms in model 3-5 is assessed. As can be
seen from Table 9, model 3-5, only the interaction term between monitoring and parents’ income,
and school-lunch and parents’ income, turn significant at conventional levels (Table 9, model 4).
The relevance of these interaction terms is corroborated by the Wald test (against model 2).62
The interaction term between parents’ income and family-school relation remains,
however, insignificant. Therefore, the effect of family-school relation on enrollment can be
drawn from the linear coefficient of this variable. As can be seen from model 2 and 4, the
coefficient for family-school relation does turn significantly positive at the 5 percent level in
model 2. Improving the relationship between the parents and the school seems to be favorable for
enrollment rates. More precisely, the maximum effect of improving the family-school relation
(from zero to 100), increases enrollment rates by 7 percent.63
Next, marginal effects for the significant interaction terms between parents’ income and
monitoring and school-lunch are estimated following Brambor et al.’s (2006) approach. The
marginal effects of the two family involvement components, i.e. monitoring and school-lunch, for
varying levels of parents’ income are reported in Graphs 4 a) and b). The marginal effect of the
family involvement components on enrollment rates is depicted on the y-axes. Parents’ income,
which varies from low (zero) to high (100), is depicted on the x-axes. The confidence interval for
the 95 % level is denoted by small dots and the marginal effect turns significant if both, the upper
and the lower bound of the confidence interval, are above (or below) zero.
Graph 4 a) depicts the marginal effect of monitoring on enrollment rates. While the
marginal effect of monitoring varies substantially for different levels of parents’ income (the
slope of the marginal effect is substantially decreasing), the confidence intervals around the
marginal effect demonstrate that the effect is not significant.
62 As depicted in Table 9 (Wald (against model 2)), only the model including the interaction terms of family involvement variables with parents’ income (model 4) provides a significant better fit of the data than the linear model (model 2) (Prob>chi2=0.0028). 63 The maximum effect of family-school relation is calculated as: (coefficient of family-school relation*range of family-school relation)/range of enrollment rates = (0.052*(100-0)) / (98-24) = 0.07 (conservative results from model (2)).

142
Table 9: Results for enrollment
Constant term not reported; p values in parentheses; * p<0.10, ** p<0.05, *** p<0.01 D denotes district level variables and W denotes ward level variables. a) Ethnic diversity does not vary over wards. Hence, neither the fixed-effects estimation nor hausman test is performed. b) Wald test of model 2 against model 1. c) Wald test of the respective model against model 2. For an overview of variable definitions and sources, see Appendix 5-3
(1) Baseline (2) Iit (3) IitSit
Sit: parents’
education
(4) IitSit
Sit: parents’
income
(5) IitSit
Sit: ethnic
diversity
parents‘ educationW 0.338*** 0.335*** 0.450*** 0.328*** 0.331***
(<0.01) (<0.01) (<0.01) (<0.01) (<0.01)
parents‘ incomeW 0.127*** 0.130*** 0.119*** 0.318*** 0.126***
(<0.01) (<0.01) (<0.01) (<0.01) (<0.01)
ethnic diversityD -0.111 -0.096 -0.073* -0.063 -0.040
(0.148) (0.192) (0.063) (0.108) (0.647)
family-school relationW 0.052**
(0.011)
0.088
(0.356)
0.071***
(<0.01)
0.042
(0.391)
monitoringW -0.012 0.096 0.018 0.018
(0.472) (0.246) (0.375) (0.640)
school-lunchW -0.002 0.045 0.012 0.043
(0.920) (0.564) (0.543) (0.271)
Sit*family-school
relationW
-0.0003
(0.797)
-0.0004
(0.636)
0.0003
(0.652)
Sit*monitorW -0.001 -0.001** -0.0004
(0.204) (0.029) (0.477)
Sit*school-lunchW -0.001
(0.433)
-0.002**
(0.013)
-0.001
(0.118)
parents‘ spendingW 0.611* 0.580 0.595 0.603* 0.583
(0.093) (0.110) (0.102) (0.096) (0.111)
state spending-1D
9.291 10.035 11.556*** 11.126*** 11.587***
(0.160) (0.114) (<0.01) (<0.01) (<0.01)
teachersW -0.008 -0.019 -0.048 -0.050 -0.043
(0.848) (0.641) (0.228) (0.205) (0.281)
booksW 0.001 0.001 0.001 0.001 0.001
(0.281) (0.317) (0.136) (0.159) (0.160)
ward controlsW Yes Yes Yes Yes Yes region dummies Yes Yes Yes Yes Yes
Wald (overall)
chi2(25)= 238.75 chi2 (28)= 253.64 chi2 (31) =
547.51
chi2 (31) =
560.98
chi2 (31) =
549.81
Prob > chi2 (<0.01) (<0.01) (<0.01) (<0.01) (<0.01)
R-sq (within) 0.235 0.242 0.241 0.250 0.238
(between) 0.854 0.873 0.884 0.886 0.896
(overall) 0.469 0.480 0.486 0.492 0.487
Hausman Prob > chi2 =
0.893
Prob > chi2 =
0.868
Prob > chi2 =
0.249
Prob > chi2 =
0.994 a)
Wald (against model
1)b)
- Prob > chi2 =
0.074
- - -
Wald (against model
2)c)
- - Prob > chi2 =
0.557
Prob > chi2 =
0.028
Prob > chi2 =
0.353
Number of wards 612 612 612 612 612
Number of districts 30 30 30 30 30

143
Graph 4: Marginal effects for enrollment
a) Marginal effect of monitoring by parents’ income level
b) Marginal effect of school-lunch by parents’ income level
Note: For specification, see Table 9, model 4.
For all levels of parent’s income the upper bound of the 95 % confidence interval is above zero
and the lower bound is below zero. Thus, the effect of monitoring does not seem to depend on the
level of parents’ income. Independent of parents’ income, the effect of parents’ monitoring
appears insignificant. Therefore, it appears that at least based on the indicator available for this
study parents’ monitoring of the children’s school attendance does not significantly influence
enrollment rates.
Next, the marginal effect of the school-lunch is depicted in Graph 4 b). The marginal
effect turns significant for only the 10 % richest parents in the sample (63 out of 612
-.2
-.1
5-.
1-.
05
0.0
5
marg
inal eff
ect
of
monito
ring o
n e
nro
lmen
t
0 10 20 30 40 50 60 70 80 90 100
parents' income
marginal effect of monitoring
95% confidence interval
-.2
-.1
0.1
marg
inal eff
ect of
scho
ol-lu
nch o
n e
nro
lment
0 10 20 30 40 50 60 70 80 90 100
parents' income
marginal effect of school-lunch
95% confidence interval

144
observations). In these families, increasing school-lunch (from zero to 100) is associated with a
decrease in enrollment of 10 %.64 However, for the majority of the observations (549/612), the
coefficient of school-lunch remains insignificant for all levels of parents’ income. The negative
significant effect of school-lunch on enrollment rates for the 10% richest parents might be
explained by the following. One could imagine that increasing the provision of school-lunch is a
signal for richer parents that the school puts more emphasis on poor families and their children.
For those poorer children, an additional meal at school might be crucial. Hence, the provision of
school-lunch signals parents that the school focuses on feeding the children with food and not
necessarily with knowledge. As a result, parents with higher income might decide to send their
children to relatives in urban areas for the children to be enrolled in other and possible better
schools. This might explain the decrease in enrollment rates for higher levels of school-lunch
provision and parents with higher income.
5.4.3 Econometric results: Exampassrate
The econometric results for exampassrate are depicted in Table 10. School’s financial resources
and the input factors emerge with the expected signs. While parent’s spending coefficient
remains positive, albeit insignificant, state spending-1 emerges significantly positive at the 10 %
(or close to the 10 %) significance level in models 4 and 5. In addition, teachers and books
emerge as strong predictors of the exampassrate. The coefficient of teachers’ qualification
(teachers) turns significantly positive at the 1 % level and the variable books turns significantly
positive at the 5 % level (or 10 % for model 4 and 5).
While the linear terms of parents’ education appear mostly insignificant (except model 1),
parent’s income emerges as a significant predictor of variations in the exampassrate. The
coefficient of parents’ income is significantly positive on the 1 % level (or 5 % level in model 4).
The linear term of ethnic diversity does not turn significant, as depicted in the baseline
model (model 1) and model 2. However, when the interaction terms are entered in model 3 and 4,
ethnic diversity turns significantly positive at the 10 percent level. This provides cautious
evidence that ethnic diversity might not have an adverse effect on the quality of education.
In addition, from the ward controls, the variables distance, villages and privateschools
emerge with significant coefficients and the expected sign (results not shown). For all models, the
64 The maximum effect of school-lunch is calculated as: (average marginal effect of school-lunch*range of school-lunch)/range of enrollment rates = (-0.077*(100-0)) / (98-24) = -0.104.

145
R-square and the overall Wald test indicates a good general fit and the consistency of the random
effects is supported by the hausman test.
Again, turning to the question whether family involvement can explain some part of the variation
of the exampassrate, the baseline model is tested against model 2, which includes the linear terms
of the family involvement variables. The inclusion of the linear terms of the family involvement
variables does not provide a significantly better fit of the model than the baseline model
(Prob>chi2=0.176). This result might indicate that the linear terms of family involvement
variables are not sufficient to explain variations in exampassrate and that inclusion of interaction
terms with parents’ SES and ethnic diversity are necessary.
When including interactions between family’s SES and ethnic diversity variables in
models 3-5, only the interactions of parents’ education level and parents’ income with school-
lunch turn significant. The overall relevance of the interactions between the family involvement
variables with parents’ income and education level is confirmed in the Wald test (see Table 10,
Wald (against model 2): Prob>chi2=0.007 and 0.071).
While the effect of school-lunch seems to depend on parents’ SES, family-school relation
and monitoring can be assessed by interpreting their linear coefficients. As can be readily seen in
model 2 (as well as in model 3 and 4), neither the coefficient of family-school relation nor of
monitoring turns significant. Thus, the available evidence does not lend support for a significant
impact of improving family-school relation and monitoring on the exam pass rates.
To determine the effect of school-lunch on exampassrate, the marginal effects of the
interaction terms with parents’ income and education level are calculated according to Brambor
et al.’s (2006) approach. Marginal effects are depicted in Graphs 5 a) and b). On the y-axes, the
marginal effect of school-lunch on exampassrate is depicted. Graph 5 a) depicts the marginal
effect of school-lunch and parents’ education. Here, parents’ education varies from low (24) to
high (100) and is shown on the x-axes. Graph 5 b) presents the marginal effect of school-lunch
and parents’ income. Parents’ income is depicted on the x-axes and varies from low (zero) to high
(100).
As can be seen in Graph 5 a), the marginal effect of school-lunch on exampassrate turns
significantly positive for parents with education levels below average (<76; 140/612
observations).

146
Table 10: Results for exampassrate
(1) Baseline (2) Iit (3) IitSit
Sit: parents’
education
(4) IitSit
Sit: parents’
income
(5) IitSit
Sit: ethnic
diversity
parents‘ educationW 0.077*
(0.090)
0.071
(0.113)
0.175
(0.167)
0.055
(0.253)
0.058
(0.231)
parents‘ incomeW 0.268*** 0.270*** 0.251*** 0.220** 0.242***
(<0.01) (<0.01) (<0.01) (0.038) (<0.01)
ethnic diversityD 0.082 0.079 0.083* 0.081* 0.028
(0.443) (0.688) (0.063) (0.072) (0.781)
family-school
relationW
0.001
(0.948)
-0.014
(0.895)
0.002
(0.956)
-0.032
(0.571)
monitoringW 0.023 0.046 0.019 0.035
(0.191) (0.623) (0.399) (0.420)
school-lunchW 0.039** 0.286*** 0.026 0.025
(0.047) (<0.01) (0.258) (0.576)
Sit*family-school
relationW
0.0003
(0.771)
0.001
(0.376)
0.001
(0.352)
Sit*monitorW -0.0002 0.001 -0.0001
(0.830) (0.513) (0.850)
Sit*school-lunchW -0.004***
(<0.01)
-0.001*
(0.090)
-0.0003
(0.635)
parents‘ spendingW 0.280 0.255 0.167 0.150 0.131
(0.474) (0.512) (0.685) (0.718) (0.755)
state spending-1D
8.540 8.253 5.354 6.299 7.336*
(0.348) (0.620) (0.180) (0.114) (0.066)
teachersW 0.144*** 0.147*** 0.149*** 0.157*** 0.159***
(<0.01) (<0.01) (<0.01) (<0.01) (<0.01)
booksW 0.001** 0.001** 0.001** 0.001* 0.001*
(0.032) (0.028) (0.032) (0.080) (0.054)
ward controlsW Yes Yes Yes Yes Yes region dummies Yes Yes Yes Yes Yes
Wald (overall)
Prob > chi2
chi2(25) = 237.63
(<0.01)
chi2(28) = 206.93
(<0.01)
chi2 (31) = 592.28
(<0.01)
chi2 (31) = 582.53
(<0.01)
chi2 (31) = 571.41
(<0.01)
R-sq (within) 0.242 0.249 0.241 0.235 0.228
(between) 0.791 0.774 0.828 0.827 0.824
(overall) 0.479 0.473 0.506 0.502 0.497
Hausman Prob>chi2 = 0.320 Prob > chi2
=0.194
Prob > chi2 =
0.814
Prob > chi2 =
0.298 a)
Wald (against
model 1)b)
- Prob > chi2
=0.176
Wald (against
model 2)c)
- - Prob > chi2 =
0.007
Prob > chi2 =
0.071
Prob > chi2
=0.704
Number of wards
Number of districts
612
30
612
30
612
30
612
30
612
30
Constant term not reported; p values in parentheses; * p<0.10, ** p<0.05, *** p<0.01 D denotes district level variables and W denotes ward level variables. a) Ethnic diversity does not vary over wards. Hence, neither the fixed-effects estimation nor hausman test is performed. b) Wald test of model 2 against model 1. c) Wald test of the respective model against model 2. For an overview of variable definitions and sources, see Appendix 5-3.

147
For least educated parents, increasing school-lunch (from zero to 100) is associated with an
increase in exampassrate by 26 %. 65 In addition, the marginal effect of school-lunch turns
negative for parents with very high levels of education (>94; 131/612 observations). For highest
educated parents, increasing school-lunch (from zero to 100) is associated with a decrease in
exampassrate by 9 %.66
Graph 5: Marginal effects for exampassrate
a) Marginal effect of school-lunch by parents’ education level
Note: For specification, see Table 10, model 3.
b) Marginal effect of school-lunch by parents’ income level
Note: For specification, see Table 10, model 4.
65 The maximum effect of school-lunch for least educated parents is calculated as: (max. marginal effect of school-lunch*range of school-lunch)/range of exam pass rates = (0.2*(100-0)) / (77-0) = 0.259. 66 The maximum effect of school-lunch for highest educated parents is calculated as: (max. marginal effect of school-lunch*range of school-lunch)/range of exam pass rates = (-0.072*(100-0)) / (77-0) = -0.093.
-.1
0.1
.2.3
marg
inal eff
ect of schoo
l-lu
nch o
n e
xam
passra
te
24 30 40 50 60 70 80 90 100
parents' education
marginal effect of school-lunch
95% confidence interval
-.3
-.2
-.1
0.1
marg
inal eff
ect of schoo
l-lu
nch o
n e
xam
passra
te
0 10 20 30 40 50 60 70 80 90 100
parents' income
marginal effect of school-lunch
95% confidence interval

148
In addition, turning to Graph 5 b), one can see that the marginal effect of school-lunch also
depends on the level of parents’ income. For parents with income levels below average (<11;
369/612 observations), the marginal effect of school-lunch turns significantly positive. In
particular, increasing school-lunch (from zero to 100) for poor parents is associated with an
increase in exampassrate by 6 %.67
The pattern observed for the impact of school-lunch on exam pass rates depending on
parents’ SES is similar to the results for enrollment rates (see section 5.4.2). For children from
families with low income and low education levels, increasing the provision of school-lunch has
significantly positive effects on the quality of education for those children. However, for children
from families with highest SES increasing the provision of school-lunch significantly decreases
the quality of education. As indicated in the discussion for enrollment rates (section 5.4.2), this
effect might be due to the following. Increasing the provision of school-lunch might lead to an
influx of poorer and less-educated children. Providing these children with an additional meal
seems to help them to improve their learning outcomes. In addition, schools, which offer school-
lunch, might be seen by the community as focusing specifically on the poor and less educated
children. This combined with a possible increased influx of poorer children in the school might
lead teachers to center their attention on these children and, thereby, to neglect the children from
better off and more educated families. Hence, those families with higher SES, might decide that
their children are not learning enough at the current school and, therefore, decide to send their
children to another school (in a different ward). Since children from more educated parents are
likely to have comparably higher levels of education than children from poorer and less educated
parents, the “crowding-out” of the better educated children to different schools, might lead to a
decrease in the overall exam pass rate in the current school.
5.5 Discussion
In sum, the econometric results provide mixed support for the relevance of the family
involvement variables and their interactions with parents’ socioeconomic status to increase
children’s educational outcomes.
Hypothesis H1a concerning the impact of the monitoring variable on educational outcomes
could not be supported by the econometric results. Neither for enrollment rates nor for the exam
67 The maximum effect of school-lunch for parents with income below average is calculated as: (mean significant marginal effect of school-lunch*range of school-lunch)/range of exam pass rates = (0.049*(100-0)) / (77-0) = 0.063.

149
pass rates did monitoring of children’s school attendance emerge as a significant explanatory
variable (see Table 9, model 2 and Graph 4a); and Table 10, model 2-4). Monitoring of children’s
school attendance by parents does neither seem to increase attendance at school nor improve the
quality of education. This provides some indication that parents’ monitoring of their children’s
school attendance has only a marginal effect on their children’s schooling and cannot alter
education outcomes substantially.
Hypothesis H1b on the impact of family-school relation on educational outcomes was
supported for enrollment rates by the positive significant coefficient of family-school relation in
Table 9 (model 2 and 4). For the exampassrate, however, the family-school relation variable does
not turn significant (see Table 10, model 2-4). Hence, these results provide some indication for
the potential of enhancing the relations between the school and the families to increase
enrollment. In addition, immediate effects of improved family-school relation on the quality of
education are not found in this study. However, communities’ efforts to increase the family-
school relation and, thereby, to increase attendance might translate in the long run into improved
educational quality. Therefore, policies advocating enhanced relations between families and the
school might be, indeed, beneficial in developing countries.
The third hypothesis (H1c) on the effect of school-lunch on educational outcomes can be
tentatively confirmed by the econometric results (see Table 9, model 4 and Graph 4b); and Table
10, model 3 and 4, and Graph 5a) and 5b)). While providing school lunch does not seem to
influence enrollment rates for most parents (except the richest 10 %), there is strong evidence for
an impact of provision of school lunch on the exam pass rates. Whether children perform well at
school seems to depend critically on their nutritional intake during the day. Increasing the
nutritional status of children by offering school lunch seems to translate into accelerated pass
rates at the primary school leaving exam
In addition, hypothesis H2 concerning a positive impact of parents’ socioeconomic status
on the effect of the family involvement components is rejected by the econometric results. While
the interaction terms between SES variables and monitoring and family-school relation remain
insignificant for enrollment and exampassrate, there seems to be a significantly negative impact
of parents’ SES on school-lunch. In particular, providing school-lunch seems to have a positive
significant impact on educational outcomes for the poor and least educated parents, and to have
negative effects for children coming from families with high levels of income and education
(Graph 4b) and Graph 5a) and b). As argued in section 5.4.2 and 5.4.3, parents with higher SES

150
might decide to send their children to a different school, if the current school increases the
provision of school-lunch and, thereby, substantially increases the population of children from
poorer and less educated families. Parents with lower socioeconomic status, i.e. low education
level or low income, are the main beneficiaries of enhanced involvement in their children’s
education. In particular, families benefit substantially from the provision of additional food at
school and the higher nutritional intake is translated into accelerated exam pass rates.
So far, it is not clear what the combined effect of the two trends is. Policies advocating the
provision of lunch at school by parents might be very valuable for poor and less educated
families. However, a possible crowding out of richer and more educated children might decrease
in the long run the overall quality of the education in the school.
The mixed econometric results for the family involvement components (in particular the
insignificant results for monitoring and family-school relation) might also depend on the
indicators used to measure family involvement. In particular, as discussed in section 5.3, the three
different components of family involvement are drawn from a specific village questionnaire.
Here, two issues emerge. First, the village questionnaire was supposed to be filled out by the
village leaders. More precisely, village leaders were asked to report whether – according to
his/her opinion – the community carried out certain involvement activities. However, since on
average a village comprises around 1200 inhabitants68, it might be that village leaders have only
an incomplete knowledge of all the households and their activities in the community. Hence,
there might be a certain measurement error in the reporting of community activities. The second
problem might arise from the list of community activities included in the questionnaire. Besides
six activities, including the family involvement components used in this chapter, and “No effort
made”, the list reports also “Other”. This residual category might, indeed, capture other family
involvement components that parents chose instead of the three family involvement activities
proposed in this chapter. This might have led to the mixed econometric results in this chapter.
Last, the econometric results show that ethnic diversity does not significantly influence the
impact of the family involvement components on educational outcomes. The interaction terms
between family involvement variables and ethnic diversity do neither turn significant for
68 As reported in section 5.3, a ward comprises around 6.6 villages and 8174 people. Hence, a village comprise around 8174/6.6 = 1238 people.

151
enrollment rates (Table 9, model 5) nor for exampassrate (Table 10, model 5). Hence, the results
suggest that a community’s ethnic diversity does not influence whether parents become involved
in their children’s education.
In addition, the empirical evidence on the linear term of ethnic diversity confirms the
results found in chapter 3. In particular, the results in Table 9 for enrollment rates confirm the
evidence on a negative, significant effect of ethnic diversity on primary enrollment rates (see
Table 5, column 2). Furthermore, new empirical evidence is derived for the impact of ethnic
diversity on exam pass rates. In Table 10, ethnic diversity emerges with a positive but mostly
insignificant coefficient. Hence, ethnic diversity does not seem to have adverse effects on the
quality of education.
The mainly insignificant econometric results of ethnic diversity might result from a
measurement error of the ethnic diversity variable. As discussed in section 5.3, due to data
limitations of the school mapping dataset, ethnic diversity on ward level is measured by district
level ethnic diversity. However, it might be possible that ethnic diversity on district level is fairly
high, i.e. that there are many different ethnic groups in the district, but that these ethnic groups
live clustered in ethnically homogenous communities. Therefore, ward level ethnic diversity
would be very low even though district level ethnic diversity would be high.
5.6 Conclusion
A developing country’s inability to ensure universal primary education and to substantially
increase the quality of primary schooling is often attributed to its limited financial resources.
Hence, other activities that might improve educational outcomes without requiring additional
public funding, such as family involvement, might solve the developing country’s dilemma.
However, while over two decades of evidence from industrialized countries propose beneficial
effects of family involvement on children’s educational outcomes, studies focusing specifically
on the impact of family involvement on education in developing countries are surprisingly scarce.
This chapter contributes to the literature on development and family involvement by
testing the family involvement theory in a low-income country setting. In particular, the effect of
three different family involvement components, i.e. improved family-school relation, monitoring
of school attendance, and provision of school lunch, on the quantity and quality of education in
Tanzania are examined. Indeed, in the econometric analysis, family involvement activities

152
emerge as possible factors driving enrollment rates and the quality of education in Tanzania. In
particular, enhanced relation between the families and the school, and the provision of lunch at
school by the parents are seen to increase enrollment rates and the quality of education. While
strengthening the family-school relationships is particularly important for enrollment rates,
providing lunch at school substantially increases the pass rates at the primary exams. However,
increasing school-lunch might also lead to a crowding out of more educated and richer children.
Policies advocating the two family involvement activities, i.e. school-lunch and family-school
relation, should, therefore, take into account possible distributional effects among children from
families with different SES.
In addition, a third family component, monitoring children’s school attendance, does not
emerge as a significant explanatory factor for educational outcomes. Parents’ behavior at home
does neither significantly increase enrollment rates nor the quality of education. This result might
be partly due to a measurement error of the family involvement components as discussed in
section 5.5. Future research should additionally investigate whether other dimensions of family
involvement at home currently not included in this chapter, such as helping with homework or
establishing a supportive learning environment, help to explain variations in educational
outcomes.
Furthermore, the econometric results point to a strong impact of parents’ socioeconomic
status, i.e. education and income, on the effects of family involvement activities. The effect of
family involvement activities seems particularly strong for poor and less educated families. This
suggests that parents might be able to overcome their disadvantaged situation (low education, low
income) and increase their children’s educational outcomes by becoming more involved in
educational activities.
Moreover, ethnic diversity on community level was not found to significantly influence
family involvement. Parents’ involvement in their children’s education does not vary with ethnic
diversity. Ethnically heterogeneous communities seem to have as much parental involvement as
ethnically homogenous communities. This result might be partially due to a measurement
problem of ethnic diversity. Future research should, therefore, strive to include ethnic diversity
on the community level to confirm the aforementioned econometric results. So far, differing
parental involvement in ethnically diverse communities does not emerge as a plausible causal
mechanism through which ethnic diversity affects educational outcomes. These results provide
support for the relevance of the first mechanism identified in chapter 3, i.e. the sanctioning ability

153
of villages. In chapter 3, ethnic diversity was found to reduce educational outcomes in primary
and secondary schooling. This was explained by ethnically diverse villages’ inability to sanction
parents, who do not contribute financially to the school. In the light of the regression results in
chapter 5, this mechanism seems more relevant than the differing degree of parental involvement
in ethnically diverse communities. Future research might test the impact of ethnic diversity on
parental involvement directly by using parental involvement strategies as the dependent variable
and ethnic diversity as the independent variable. This would complement the econometric results
derived in chapter 3 and 5, and provide more insights into the influence of ethnic diversity on
parents’ involvement in their children’s education.
Generally, the econometric results in this chapter suggest that low-income countries are
the main beneficiaries from implementing policies targeted at promoting family involvement
activities. Increasing family involvement might, hence, help developing countries to substantially
increase educational outcomes.

154
Appendices 5-1 – 5-3
Appendix 5- 1: List of regions, districts and number of wards in the school mapping dataset
Region District Number of wards
Arusha Arumeru 37
Arusha Urban 15
Babati 21
Karatu 13
Mbulu 16
Dodoma Dodoma Urban 15
Iringa Iringa Urban 13
Njombe 27
Kagera Bukoba Rural 41
Bukoba Urban 14
Muleba 31
Kigoma Kigoma Urban 11
Kilimanjaro Moshi Rural 31
Moshi Urban 15
Mwanga 16
Rombo 20
Lindi Lindi Urban 9
Mara Musoma Urban 13
Mwanza Mwanza Urban 20
Rukwa Sumbawanga Urban 13
Shinyanga Bukombe 14
Kahama 34

155
Maswa 18
Shinyanga Urban 13
Shinyanga Rural 36
Singida Singida Urban 13
Tabora Nzega 37
Tabora Urban 21
Tanga Pangani 13
Tanga Urban 22

156
Appendix 5- 2: Correlation matrix
family-
school
relation
monitoring school-
lunch
parents‘
education
income ethnic
diversity
parents‘
spending
state
spending-1
teachers books children distance schools villages private
schools
family-
school
relation
1.00
monitoring 0.18 1.00
school-
lunch
-0.21 -0.30 1.00
parents‘
education
0.04 0.10 0.14 1.00
income -0.11 0.05 0.13 0.50 1.00
ethnic
diversity
-0.18 -0.10 0.13 0.04 0.39 1.00
parents‘
spending
0.09 0.06 0.06 0.07 -0.001 -0.06 1.00
state
spending-1
-0.08 -0.003 0.12 0.41 0.35 0.20 0.01 1.00
teachers 0.02 0.03 -0.01 0.35 0.35 0.14 0.07 0.10 1.00
books 0.13 0.05 0.16 0.17 -0.03 -0.26 0.14 -0.19 0.001 1.00
children 0.07 0.06 -0.03 -0.03 -0.15 -0.10 0.06 -0.42 -0.02 0.61 1.00
distance 0.03 0.04 0.04 0.27 0.23 0.10 -0.05 0.21 0.15 0.02 -0.04 1.00
schools 0.10 0.04 -0.002 -0.15 -0.38 -0.35 0.09 -0.41 -0.15 0.68 0.64 -0.12 1.00
villages -0.08 0.06 -0.18 0.11 0.17 0.27 -0.07 -0.02 0.27 0.07 0.30 0.16 -0.006 1.00
private
schools
0.001 -0.05 0.13 0.09 0.23 0.11 0.08 -0.06 0.13 0.07 0.05 -0.05 -0.06 0.05 1.00

157
Appendix 5- 3: Variables and descriptive statistics
Variable Definition and source Mean Standard
deviation
Min Max
enrollment Std. I - VII net enrollment rate in percent 68.33 14.71 24 98
exampassrate Percentage of candidates that successfully
passed the primary school leaving exam
(PSLE)56
20.19 17.01 0 77
family-school
relation
Percentage of villages in a ward, where
the community tries to improve the
relation between school and the
community
73.98 23.86 0 100
monitoring Percentage of villages in a ward, where
school attendance is monitored by the
community
52.84 29.89 0 100
school-lunch Percentage of villages in a ward, where
the community provides school lunch
39.70 33.91 0 100
parents‘ education Percent of literate adult population (14
years +)
79.18 15.66 24 100
parents‘ income Percentage of houses in the ward that are
equipped with electricity
16.34 21.38 0 100
ethnic diversity Probability that two randomly drawn
individuals in the same district are
members of different ethnic groups (100
denotes a probability of 1)
Source: United Republic of Tanzania,
1971
Level: district
56.40 25.54 9.83 91.87
parents‘ spending Logarithm of school income per pupil
generated through the collection of school
fees, in 100 TShs
9.29a) 21.68a) 0a) 489.97a)
state spending-1 Logarithm of the sum of recurrent and
construction (e.g. construction and
maintenance of primary schools and
classrooms, and construction of teacher
houses) spending for the financial year 1st
July 1998 until 30th June 1999 per pupil in
the district, in 100 Tshs, deflated (2000)
Source: United Republic of Tanzania,
235.36a) 70.06a) 105.73a) 426.37a)

158
1998a and 1998b.
Level: district
teachers Percentage of teachers, who hold a
diploma plus teachers, who have a Grade
A qualification60
52.12 13.45 0 88
books Amount of textbooks (mathematics,
Kiswahili, English, science, skills studies,
and social studies), in 100 books
25.61 15.73 1.04 102.66
children Age 7 - 13 population of the ward, per 100
people
18.35 11.88 0.86 129.65
distance Percentage of students, who need between
0 – 30 minutes to reach the school
62.78 20.53 0 100
villages Total number of villages per ward 6.60 5.77 1 50
schools Number of primary schools per ward 4.50 2.56 1 19
private-schools Percentage of private schools in the ward 6.21 15.34 0 77.77
Note: If not stated otherwise the source of the data is MoEC/JICA (2002a) and on ward level. a) The descriptive statistics are reported for non-logarithmized variables.

159
Chapter 6: Conclusion
This dissertation set out to answer the following question: How does ethnic diversity affect
schooling in African countries?
Ethnic diversity has been widely regarded as an evil and the existence of people with different
ethnic roots living in one country is viewed tantamount to the existence of ethnic conflicts.
Civil wars along ethnic lines in the Kosovo, Sudan, Rwanda, Northern Ireland, Somalia and
so forth seem to support this claim. In addition, existence of different ethnic groups in a
country has been used to explain not only civil conflicts but also slow economic development,
macroeconomic instability and high levels of corruption. Besides the link between ethnic
diversity and conflict, and ethnic diversity and economic development, recent studies assessed
the impact of ethnic diversity on public good provision.
In particular, various ethnic groups living together in one territory seem to be less
likely to consent on important investments in public goods. Ethnic groups are seen to have
differing preferences for specific types of public goods. More precisely, ethnic groups seem to
have difficulties to agree on investments in local public goods, such as waste collection,
maintenance of roads, sewers, and schools.69
This dissertation chose to focus on the link between ethnic diversity and education,
given the multidimensional developmental effects of education. Improving the quality of
education is expected to foster labor productivity and economic growth, and to reduce the
spread of HIV/Aids.
While various scholars propose a negative impact of ethnic diversity on education, the
empirical evidence on this link still remains ambiguous. The ambiguity of the empirical
results might be due to the lack of a more clear theoretical foundation of the effect of ethnic
diversity and a clear understanding of the particular mechanisms through which ethnic
diversity might affect schooling.
This dissertation contributes to the current discussion on the impact of ethnic diversity on
education in the following way. First, this research identified and assessed three different
mechanisms, through which ethnic diversity is viewed to affect educational outcomes. In
particular, this research established that ethnic diversity affects community activities on
69 A school is a (near) public good, since education fails to fulfill the requirement of non-excludability for a public good, since children can be excluded from the classroom. However, education is to a large extent non-rival and generates multiple externalities.

160
village level; that ethnic identities determine clientelistic resource distribution; and that ethnic
identity, which is politically salient, affects educational outcomes.
A second contribution of this dissertation is the extensive research carried out on the
relevance of political salience of ethnicity, i.e. the politicization of ethnicity. In particular,
chapter 4 demonstrated that ethnic structures are not sufficient to explain differing degrees of
politicization, but that colonial administrative rule, land distribution and nation building
policies contribute to the explanation of why ethnicity becomes a politically salient factor.
Last, this research provided detailed insights into activities on the community level,
which might affect educational outcomes. As demonstrated in the first part of this dissertation
(chapter 3), ethnic diversity negatively affects village level community activities and, thereby,
is associated with decreased educational outcomes. In addition, in chapter 5, a more detailed
analysis was carried out linking community level activities to ethnic diversity. In particular,
this research focused on the impact of parental involvement activities on village level
enrollment and learning outcomes, and assessed whether the effect of community activities is
lower in ethnically diverse villages.
In the following paragraphs the main findings of these three aspects of the dissertation will be
reviewed and connected to answer the question of interested posed at the beginning of this
chapter: How does ethnic diversity affect schooling in African countries?
Chapter 3 presented an overview over the three different mechanisms through which ethnic
diversity might affect education. In particular, this chapter combined the hitherto distinct
theories of sanctioning and clientelistism, suggested a theory of politicization of ethnicity, and
tested these theories using a novel dataset and specifically coded ethnic indicators.
The first theory explaining the impact of ethnicity on education posits that ethnically
diverse villages exhibit lower school funding because they are unable to sanction non-
contributing parents. As prominently argued by Miguel and Gugerty (2005), parents are
expected to contribute financially to local schools in rural Kenya. Here, social sanctions, such
as the exclusion from social networks in a village, are used to punish parents, who do not
contribute to the school. However, such sanctions are viewed to be only effective if parents
come from the major ethnic group. Therefore, it is posited that higher levels of ethnic
diversity lead to lower school funding, and, thereby, to lower levels of enrollment rates.
The second mechanism through which ethnic diversity might affect education is
through clientelistic resource distribution. Clientelism is generally associated with an under-

161
provision of goods to all citizens and an over-provision of goods targeted to specific groups.
In particular, in the education sector, ethnic parties are expected to distribute funds primarily
to their co-ethnics, which lead to an improvement of educational outcomes in the region of
co-ethnics.
Related to both, the sanctioning and the clientelism mechanism, is the politicization of
ethnicity. Whether ethnicity influences education through a community’s activities or
clientelistic resource distribution might also depend on whether ethnicity is perceived as a
politically salient factor in the first place. In particular, whether ethnicity is a politically
relevant factor, might affect how members of different ethnic groups interact in a local
community. Therefore, it is argued that if politics are strongly divided along ethnic identities,
then this division might also hamper inter-ethnic cooperation at the village level. Moreover, it
was expected that clientelistic resource distribution is particularly pronounced in countries,
where ethnic identity is politically salient.
These three mechanisms were tested in chapter 3 using a novel dataset and specifically
coded ethnic indicators. Data on primary and secondary education on district level for 31
African countries was combined with specific indicators of ethnic groups designed to test the
distinct theories of ethnicity. In particular, the sanctioning mechanism was tested using ethnic
diversity on district level. The second mechanism, clientelism, was examined by using data on
presidents’ co-ethnics. The last mechanism, politicization, was tested by employing an
indicator measuring the existence of ethnic parties in the country in the regression. The
dataset was analyzed using a two-level hierarchical model.
The econometric results strongly support the relevance of these three mechanism
through which ethnicity affects primary and secondary education in Africa. In particular,
communities seem to suffer from increased ethnic diversity by their inability to raise
sufficient funds for schooling. Lower school funding, then, translates into substantially lower
enrollment rates. In addition, the econometric results point to an unequal distribution of state
resources from presidents primarily to their ethnic clientele. Indeed, members of the
president’s ethnic group exhibit significantly higher enrollment rates than members of other
ethnic groups. This effect, however, varies substantially over countries and lends credit to the
idea that clientelistic distribution of state funds might be influenced by other factors still
uncovered.
Moreover, the econometric results provide interesting insights into the role of
politicization of ethnicity. The relevance of ethnicity in the political process was neither found
to influence the effect of ethnic diversity on village level nor clientelistic resource

162
distribution. A second intuition derived from the econometric estimation regarding
politicization points to a positive influence of politicization on enrollment rates in countries
with weak institutions. In contrast to programmatic parties, ethnic parties seem to perform
better in worse environments. They seem to maintain a minimum level of education spending
resulting in increased enrollment. This lends evidence to the idea that ethnic parties depend
more critically on rewarding their members for their support than programmatic parties.
While programmatic parties might have other means to maintain a positive relationship with
their voters, ethnic parties seem to depend mainly on the distribution of state resources. This
might explain why even in worst environments, ethnic parties are associated with increased
enrollment rates.
From the econometric results in chapter 3, two interesting questions arise. First, the
econometric results provide evidence for a significant and substantial effect of politicization
of ethnicity on education. This supports current debates that the political salience of ethnicity
is an important factor for development. However, while chapter 3 treated politicization of
ethnicity as exogenous, it is interesting to understand why ethnic identity emerges as a
politically salient factor in some countries and is absent from politics in another. Therefore, in
chapter 4 possible explanatory factors of the politicization of ethnicity were traced.
A second interesting question emerging from the analysis in chapter 3 focuses on the
impact of ethnic diversity on educational outcomes in local communities. In particular, ethnic
diversity was found to be significantly associated with lower educational outcomes. While in
chapter 3 it is expected that ethnic diversity reduces the sanctioning ability of local
communities, it seems worthwhile to examine alternative channels through which this effect
could work, e.g. via parental involvement in their children’s schooling. Involvement of
parents in their children’s education, for example by helping them with homework, becoming
engaged in school functions and communicating with the school, is widely seen as an
important factor contributing to the improvement of education systems in developing
countries. Therefore, in chapter 5 the impact of parental involvement activities on educational
outcomes in ethnically diverse communities is assessed.
Chapter 4 focused on the question which factors influence the political salience of ethnicity.
In particular, this chapter examined potential explanatory factors of politicization, namely a
country’s ethnic structure, the colonial administrative rule, land distribution and nation
building policies. To assess the relevance of the proposed explanatory factors, the

163
development of politicization of ethnicity was traced in a comparative case study of Kenya
and Tanzania using extensive archival material on ethnic groups, historical secondary sources
and expert interviews. The two countries, Kenya and Tanzania, were selected following a
most similar design strategy. In particular, Kenya and Tanzania are very similar regarding a
variety of economic, political and geographic factors, but differ in their degree of
politicization of ethnicity. While Kenyan politics is strongly divided along ethnic lines,
ethnicity seems invisible in Tanzanian politics.
The comparative analysis of the historical events leading to the differing degree of
politicization of ethnicity in Kenya and Tanzania offers interesting lessons on the causes of
politicization. Indeed, the analysis challenges the long standing notion that politicization of
ethnicity is determined by the number and size of ethnic groups in a country. Evidence from
the two cases demonstrates that ethnic groups were deliberately re-grouped into larger entities
by politicians to form a political support base.
In addition, chapter 4 provides evidence on the relevance of colonial rule, land
distribution and nation building policies on the political salience of ethnicity. All three factors
were found to have substantially influenced the politicization of ethnicity in Kenya and
Tanzania. The specific colonial rule and the policies to distribute land were found to have
increased ethnic tensions in Kenya, but decreased ethnic consciousness in Tanzania. In
addition, the analysis demonstrated that fully implemented nation building policies have the
potential to lastingly mitigate the political salience of ethnicity.
Moreover, the evidence from the low politicized case, Tanzania, pointed to an
interrelation between colonial approach and the feasibility to implement nation building
policies. The colonial approach in Tanzania induced lower ethnic consciousness than in
Kenya and, thereby, provided a more favorable environment for the post-independence
government to launch policies to unite the country. In Kenya, on the contrary, the first post-
independence government was heavily burdened with increased ethnic consciousness through
colonial demarcation and land distribution policies.
While chapter 3 posited that ethnic diversity negatively affects educational outcomes through
the lower sanctioning ability of diverse villages, there might also be other mechanisms
through which ethnic diversity affects education. Hence, chapter 5 focused on identifying the
impact of parental involvement activities on educational outcomes and examined the impact
of ethnic diversity on the effect of parental involvement. Extensive literature from developed
countries demonstrated that higher involvement of families in schooling is beneficial for
164
children’s educational outcomes. Indeed, scholars report that family involvement generates
positive effects even for less educated and poor parents. However, the involvement of parents
in their children’s education is reported to be more beneficial for parents with higher
socioeconomic status, i.e. education and income, and to be decreasing with a community’s
ethnic diversity. In particular, scholars demonstrate that the effect of parental involvement is
lower for parents from ethnic minorities. In addition, parents from ethnically and
linguistically diverse neighborhoods seem less likely to become involved in schools.
Chapter 5 assessed the link between parental involvement and primary education in an
econometric analysis drawing on the school mapping dataset from Tanzania. The econometric
analysis assessed the impact of three family involvement activities and provided evidence on
the role of a community’s ethnic diversity and parents’ socioeconomic status on the effect of
the involvement activities. In particular, this chapter focused on three parental involvement
activities, namely monitoring school attendance by the parents, increasing the family-school
relationship, and providing lunch at school.
The econometric results provided some support of the relevance of family
involvement activities for enrollment rates and the quality of education in Tanzania. In
particular enhanced relations between the families and the school, and the provision of lunch
at school by the parents are seen to increase enrollment rates and the quality of education.
While strengthening the family-school relationships is particularly important for enrollment
rates, providing lunch at school substantially increases the pass rates at the primary exams.
However, policies advocating these two family involvement activities should take into
account possible distributional effects on children from families with different SES, i.e.
education and income levels.
In addition, a third family component, monitoring children’s school attendance, did
not emerge as a significant explanatory factor for educational outcomes. Parents’ behavior at
home did neither appear to significantly increase enrollment nor the quality of education.
Furthermore, the econometric results pointed to a strong impact of parents’
socioeconomic status, i.e. education and income, on the effects of family involvement
activities. The effect of family involvement activities seems particularly strong for poor and
less educated families.
Moreover, ethnic diversity on community level was not found to significantly
influence the effect of family involvement activities. Parents’ involvement in their children’s
education did not vary with ethnic diversity. Ethnically heterogeneous communities seem to
have as much parental involvement as ethnically homogenous communities. Thereby,

165
differing parental involvement in ethnically diverse communities did not emerge as a
plausible causal mechanism through which ethnic diversity affects educational outcomes.
These results provided support for the relevance of the first mechanism identified in chapter 3,
i.e. the sanctioning ability of villages. In chapter 3, ethnic diversity was found to reduce
educational outcomes in primary and secondary schooling. This was explained by the inability
of ethnically diverse villages to sanction parents, who do not contribute financially to the
school. In the light of the regression results in chapter 5, this mechanism seems more relevant
than the differing degree of parental involvement in ethnically diverse communities.
Now, turning back to the main question guiding this research: How does ethnic diversity affect
schooling in African countries?
Ethnic diversity was found to negatively influence educational outcomes in African
countries in chapter 3. In particular, ethnic diversity of the local community seems to
adversely affect enrollment rates in primary and secondary education. The underlying rational
of this effect might be that ethnically diverse communities are unable to impose credible
sanctions to non-contributing parents and, hence, have substantially lower school funding.
This is, then, viewed to translate into lower enrollment rates.
A second result from this dissertation is the result on parental involvement activities in
ethnically diverse communities in chapter 5. Parental involvement activities, such as
improving the relation between the family and the school, and providing school lunch were
found to increase enrollment and the quality of education in the low-income country
Tanzania. Moreover, the results demonstrated that the effect of parental involvement is not
significantly different in ethnically homogenous and heterogeneous communities. Thus, while
ethnic diversity seems to directly affect enrollment rates, local level community activities,
such as parental involvement, are not adversely affected by higher ethnic diversity.
A second mechanism through which ethnic diversity was found to affect educational
outcomes is clientelistic resource distribution. In particular, as demonstrated in chapter 3, co-
ethnics of presidents in the African countries are associated with significantly higher levels of
educational attainment. This provides some support for a biased resource distribution in the
education sector along ethnic lines.
The last mechanism to explain the impact of ethnic diversity is the political salience of
ethnicity, i.e. the politicization of ethnicity. Here, some mixed evidence emerged from this
dissertation. First, as shown in chapter 3, politicization of ethnicity did neither influence the

166
effect of ethnic diversity nor of clientelistic resources distribution. Ethnic diversity and
clientelistic resource distribution turned significant independent of whether ethnicity is a
politically salient factor in a country. However, the econometric results pointed to a direct
effect of politicization of ethnicity on enrollment rates. In particular, in low-income countries
with weak institutions, higher degrees of politicization of ethnicity were associated with
significantly higher enrollment rates. This result raised the question which factors determine
whether ethnicity emerges as a politically salient factor in one country and remains absent
from politics in another. Here, chapter 4 provided interesting insights into the role of ethnic
structures, colonial administrative approach, land distribution and nation building policies to
increase the politicization of ethnicity. The often voiced argument that a country’s ethnic
structure determines the political relevance of ethnicity was refuted by the comparative case
study. In particular, the evidence on the similar size of President Moi’s (Kenya) and President
Nyerere’s (Tanzania) ethnic group and the potential to build a minimum winning ethnic
coalition from the Nyamwezi and Sukuma group in Tanzania showed that ethnic groups can
be deliberately regrouped into sufficient support bases, and, thereby, demonstrated that ethnic
structures in Kenya and Tanzania are not sufficient to determine the politicization of ethnicity.
Moreover, the evidence from Kenya and Tanzania confirmed the importance of the colonial
administrative rule, the distribution of land and the successful implementation of nation
building policies to explain differing degrees of politicization of ethnicity.

167
References
Africa Almanac. (2008). Africa Almanac. Retrieved August 8, 2008, from Africa's Historical
Timeline: http:://www.africaalamac.com/history.html
Afro-Barometer Network. (2002). Afro-Barometer Round I: Compendium of Comparative
Data from a Twelve-Nation Survey. Afro-Barometer Paper No. 11.
Alesina, A., & Drazen, A. (1991). Why Are Stabilizations Delayed? American Economic
Review , 81 (5), pp. 1170-1188.
Alesina, A., & La Ferrara, E. (2000). Participation in Heterogeneous Communities. Quarterly
Journal of Economics , 115 (3), 847-904.
Alesina, A., Baqir, R., & Easterly, W. (1999). Public Goods and Ethnic Divisions.
Washington: World Bank Research Working Paper No. 2108.
Alesina, A., Devleeschauwer, A., Easterly, W., Kurlat, S., & Wacziarg, R. (2003).
Fractionalization. Journal of Economic Growth , 8 (2), pp. 155-194.
Amisi, K. B. (2009). Conflict in Rift Valley and Western Kenya - Towards and Early Warning
Indicator Identification. Retrieved May 13, 2009, from
http://www.payson.tulane.edu/conflict/Cs%20St/AMISIFIN2.html
Amutabi, M. N. (2003). Political Inference in the Running of Education in Post-Independence
Kenya: A Critical Retrospection. International Journal of Educational Development ,
23, 127-144.
Antoun, N., & Campling, L. (2008). John Agyekum Kufuor Biography - The Development of a
Political Mind, In and Out of National Politics. Retrieved August 9, 2008, from
http://biography.jrank.org/pages/2864/Kufuor-John-Agyekum.html
Babbie, E. (1992). The Practice of Social Research, 6th ed. Belmont: Wadsworth Publishing
Company.
Banerjee, A., & Duflo, E. (2006). Addressing Absence. Journal of Economic Perspectives ,
20 (1), pp. 117-132.
Barkan, J. D. (1994). Divergence and Convergence in Kenya and Tanzania: Pressures for
Reform. In J. D. Barkan, Beyond Capitalism vs. Socialism in Kenya & Tanzania.
Nairobi: East African Educational Publishers.
Barkan, J. D., & Chege, M. (1989). Decentralising the State: District Focus and the Politics of
Reallocation in Kenya. Journal of Modern African Studies , 27 (3), pp. 431-453.
Bates, R. H. (1983). Modernization, Ethnic Competition, and the Rationality of Politics in
Contemporary Africa. In D. Rothchild, & V. A. Olorunsola (Eds.), State Versus Ethnic
Claims: African Policy Dilemmas. Boulder: Westview Press.
168
Bourdon, J., Frölich, M., & Michaelowa, K. (2010). Teacher Shortage, Teacher Contracts and
Their Impact on Education in Africa. Journal of the Royal Statistical Society, Series A
, 173 (1), pp. 93-116.
Brambor, T., Clark, W. R., & Golder, M. (2006). Understanding Interaction Models:
Improving Empirical Analyses. Political Analysis , 14 (1), pp. 63-82.
Bratton, M., & Kimenyi, M. S. (2008). Voting in Kenya: Putting Ethnicity in Perspective.
Afrobarometer Working Papers No. 95.
Brett, E. A. (1973). Colonialism and Underdevelopment in East Africa - The Politics of
Economic Change 1919-39. Nairobi: Heinemann.
Bruk, S. I. (1964). Atlas Narodov Mira. Moscow: Academy of Science USSR.
Campling, L. (2008). Paul Kagame Biography - A Refugee's Childhood, Uganda and the
National Resisitance Movement. Retrieved August 8, 2008, from
http://biography.jrank.org/pages/2859/Kagame-Paul.html
Cederman, L. E., Rød, J. K., & Weidmann, N. (2007). Geo-Referencing of Ethnic Groups:
Creating a New Dataset. Chicago, IL: paper presented for the Annual Convention of
the International Studies Association.
Chama Cha Mapinduzi (CCM). (2000). Ilani ya uchaguzi kmuu Oktoba 2000 (party
manifesto). Dodoma.
Chandra, K. (2004). Why Ethnic Parties Suceed - Patronage and Ethnic Head Counts in
India. Cambridge: Cambridge Universiyt Press.
Chinapah, V. (2003). Monitoring Learning Achievement (MLA) Project in Africa. Mauritius:
paper prepared for the ADEA Biennial Meeting, December 3-6.
Chweya, L. (Ed.). (2002). Electoral Politics in Kenya. Nairobi: Claripress Limited.
CIA. (2008). CIA - World Factbook. Retrieved August 7, 2008, from
http://www.cia.gov/library/publications/the-world-factbook/
Civic United Front (CUF). (2000). Ilani ya uchaguzi mkuu 2000 (party manifesto).
Clapham, C. (1982). Clientelism and the State. In C. Clapham, Private Patronage and Public
Power: Political Clientelism and the Modern State. London: Frances Printer.
Clark, W. R., Doces, J. A., & Woodberry, R. D. (2006). Aid, Protestant Missionaries, and
Growth. paper presented at the Leitner Political Economy Workshop, Yale University,
Oktober 2006.
Cochrane, S. H. (1979). Fertility and Education: What Do We Really Know? Baltimore: John
Hopkins University Press.

169
Cohn, E., & Rossmiller, R. A. (1987). Research on Effective Schools: Implications for Less
Developed Countries. Comparative Education Review , 31 (3), pp. 377-399.
Collier, P., & Garg, A. (1999). On Kin Groups and Wages in the Ghanian Labour Market.
Oxford Bulletin of Economics and Statistics , 61 (2), pp. 133-151.
Collier, P., & Hoeffler, A. (2004). Greed and Grievance in Civil War. Oxford Economic
Papers , 56 (October), pp. 563-95.
Cooksey, B., Court, D., & Makau, B. (1994). Education for Self-Reliance and Harambee. In J.
D. Barkan (Ed.), Beyond Capitalism vs. Socialism in Kenya & Tanzania. Nairobi: East
African Educational Publishers .
Cunningham, K., & Weidman, N. B. (2008). Shared Space: Ethnic Groups, State
Accommodation and Local Conflict. San Francisco, CA: paper presented at the
Annual Meeting of the International Studies Association, March 26-29.
Cutler, D. M., & Glaeser, E. L. (1997). Are Ghettos Good or Bad? Quarterly Journal of
Economics , 112 (3), 827-872.
Cutler, D. M., Elmendorf, D. W., & Zeckhauser, R. J. (1993). Demographic Characteristics
and the Public Bundle. NBER Working Paper No. 4283.
Dahlberg, M., & Johansson, E. (2002). On the Vote-Purchasing Behavior of Incumbent
Governments. American Political Science Review , 96 (1), pp. 27-40.
Delgado-Gaitan, C. (1991). Involving Parents in the Schools: A Process of Empowerment.
American Journal of Education , 100 (1), pp. 20-46.
Eagle, E. (1989). Socioeconomic Status, Family Structure, and Parental Involvement: The
Correlates of Achievement. Paper presented at the Annual Meeting of the American
Educational Research Association, San Francisco, March 27-31.
Easterly, W. (2001). Can Institutions Resolve Ethnic Conflict? Economic Development and
Cultural Change , 49 (4), pp. 687-706.
Easterly, W., & Levine, R. (1997). Africa's Growth Tragedy: Policies and Ethnic Divisions.
Quartely Journal of Economics , 112 (4), pp. 1203-1250.
Elwert, G. (2002). Switching Identity Discourses: Primordial Emotions and Social
Construction of We-Groups. In G. Schlee (Ed.), Imagined Differences: Hatred and the
Construction of Social Identities. Hamburg: LIT.
Epstein, J. L. (1992). School and Family Partnerships. In M. C. Alkin (Ed.), Encyclopedia of
Educational Research, 6th ed. New York: Macmillan.

170
Epstein, J. L., & Sheldon, S. B. (2002). Present and Accounted for: Improving Student
Attendance Through Family and Community Involvement. Journal of Educational
Research , 95 (5), pp. 308-318.
Esteban, J., & Ray, D. (1999). Conflict and Distribution. Journal of Economic Theory , 87 (2),
pp. 379-415.
Esteban, J.-M., & Ray, D. (1994). On The Measurement of Polarization. Econometrica , 62
(4), pp. 819-851.
Fearon, J. D. (2003). Ethnic and Cultural Diversity by Country. Journal of Economic Growth
, 8 (2), 195-222.
Fearon, J. D. (2006). Ethnic Mobilization And Ethnic Violence. In B. R. Weingast, & D.
Wittman (Eds.), Oxford Handbook of Political Economy. Oxford: Oxford University
Press.
Fearon, J. D., & Laitin, D. D. (1996). Explaining Interethnic Cooperation. American Political
Science Review , 90 (4), pp. 715-735.
Fearon, J. D., & Laitin, D. D. (2000). Violence and Social Construction of Ethnic Identity.
International Organization , 54 (4), pp. 845-877.
Fearon, J. D., & Laitin, D. D. (2003). Ethnicity, Insurgency, and Civil War. American
Political Science Review , 97 (1), pp. 75-90.
Fearon, J. D., Kasara, K., & Laitin, D. D. (2007). Ethnic Minority Rule and Civil War Onset.
American Political Science Review , 101 (1), pp. 187-193.
Fehrler, S., Michaelowa, K., & Wechtler, A. (2009). The Effectiveness of Inputs in Primary
Education: Insights from Recent Student Surveys for Sub-Saharan Africa. Journal of
Development Studies , 45 (9), pp. 1545-1578.
Francken, N., Minten, B., & Swinnen, J. F. (2005). Listen to the Radio! Media and
Corruption: Evidence from Madagascar. LICOS Centre for Transition Economics
Discussion Paper No. 115.
Freedom House. (2008). Freedom House. Retrieved July 11, 2008, from Freedom House
Country Ratings: http:://www.freedomhouse.org/ratings/index.htm
Gagnon, V. P. (1994-1995). Ethnic Nationalism and International Conflict. International
Security , 19 (3), pp. 130-166.
Garcia-Montalvo, J., & Reynal-Querol, M. (2002). Why Ethnic Fractionalization?
Polarization, Ethnic Conflict and Growth. UPF Economics and Business Working
Paper No. 660.

171
Gardner, R. (1998). Education, DHS Comparative Studies (Vol. 29). Calverton, Maryland:
Macro International Inc.
Gelman, A., & Hill, J. (2007). Data Analysis Using Regression and Multilevel/Hierarchical
Models. Cambridge: Cambridge University Press.
George, A. L., & Bennett, A. (2005). Case Studies and Theory Development in Social
Sciences. Cambridge: MIT Press.
Gläser, J., & Laudel, G. (2009a). Experteninterviews und qualitative analyse [Expert
interviews and qualitative ananlysis], 3rd ed. Wiesbaden: VS Verlag für
Sozialwissenschaften.
Gläser, J., & Laudel, G. (2009b). Expert interviews, MIA. Retrieved October 15, 2009, from
http://www.laudel.info/buchdateien.html
Glewwe, P. W. (1998). Why Does Mother's Schooling Raise Child Health in Developing
Countries? Evidence from Morocco. Journal of Human Resources , 1 (34), pp. 124-
159.
Glewwe, P., & Kremer, M. (2006). Chapter 16: Schools, Teachers, and Education Outcomes
in Developing Countries. In E. Hanushek, & F. Welch (Eds.), Handbook of the
Economics of Education, Volume 2. Amsterdam: Elsevier.
Goemans, H. E., Gleditsch, K. S., & Chiozza, G. (2008). ARCHIGOS - A Data Set on Leaders
1875-2004, Version 2.9. Retrieved August 8, 2008, from
http://mail.rochester.edu/~hgoemans/Archigos.pdf
Goldin, C., & Katz, L. F. (1999). Human Capital and Social Capital: The Rise of Secondary
Schooling in America, 1910-1940. Journal of Interdisciplinary History , 29 (4), 683-
723.
Gordon, R. G. (2008). Ethnologue: Languages of the Word, Fifteenth Edition. Retrieved
August 8, 2008, from http://www.ethnologue.com/
Graham, J. D. (1976). Indirect Rule: The Establishment of "Chiefs" and "Tribes" in
Cameron's Tanganyika. Tanzania Notes and Records , 77-78.
Gurr, T. R. (1970). Why Men Rebel. Princeton: Princeton University Press.
Gurr, T. (1996). Minorities at Risk III Dataset: User's Manual. CIDCM, University of
Maryland.
Habyarimana, J. P., Humphreys, M., Posner, D. N., & Weinstein, J. M. (2007). Why Does
Ethnic Diversity Undermine Public Goods Provision? American Political Science
Review , 101 (4), pp. 709-725.

172
Hanushek, E. A., & Kimko, D. D. (2000). Schooling, Labor-Force Quality, and the Growth of
Nations. American Economic Review , 90 (5), pp. 1184-1208.
Haruna, I. (2004). The Middle Belt: History and Politics. Retrieved August 9, 2008, from
Nasaraw State Weekly Newspaper:
http://www.nasarawastate.org/newsday/news/culture/11129114540.html
Henderson, A. T., & Berla, N. (1996). A New Generation of Evidence - The Family Is Critical
to Student Achievement. Washington: National Committee for Citizens in Education.
Horn, L., & West, J. (1992). A Profile of Parents of Eight Graders: Statistical Analysis
Report, NCES 92-488. National Center for Educational Statistics.
Horowitz, D. L. (1985). Ethnic Groups in Conflict. Berkley: University of California Press.
Jerman, H. (1997). Between Five Lines: The Development of Ethnicity in Tanzania with
Special Reference to the Western Bagamoyo District. Uppsala: Nordiska
Afrikainstituet.
Judd, C. M., Smith, E. R., & Kidder, L. H. (1991). Research Methods in Social Relations, 6th
ed. Fort Worth: Holt, Rinehart and Winston, Inc.
Kandeh, J. D. (1992). Politicizationof Ethnic Identities in Sierra Leone. African Studies
Review , 35 (1), pp. 81-99.
Karimi, J., & Ochieng, P. (1980). The Kenyatta Succession. Nairobi: Transafrica Press
Limited.
Kasara, K. (2007). Tax Me If You Can: Ethnic Geography, Democracy, and the Taxation of
Agriculture in Africa. American Political Science Review , 101 (1), pp. 159-172.
Keefer, P. (2005). Clientelism, Credibility and the Politics of Young Democracies.
Asscociation, paper presented at the annual meeting of the American Political
Science, 01 September 2005 . Washington D.C. Retrieved September 7, 2008, from
www.allacademic.com/meta/p40131_index.html
Kelly, M. J. (2000). The Encounter between HIV/AIDS and Education. Harare, Zimbabwe:
UNESCO, Sub-Regional Office for Southern Africa.
Kenya. (1964). Kenya Population Census, 1962, Advance Report of Volumes I & II. Nairobi:
Economics and Statistics Division, Ministry of Finance and Economic Planning.
Kenya Tanzania Travel Guide. (2010). Kenya Tanzania Travel Guide. Retrieved July 14,
2010, from http://www.kenyatanzaniatravelguide.info/east_africa_map.jpg
Kenyan Section of the International Commission of Jurists. (2008). Ethnicity, Human Rights
and Constitutionalism in Africa. Nairobi, Kenya.

173
Kessler, I. (2006). What Went Right in Tanzania: How Nation Building and Political Culture
Have Produced Forty-Four Years of Peace. Retrieved June 10, 2009, from
http://dspace.wrlc.org/bitstream/1961/3688/1/Kessler_Ilana_Thesis.pdf
Khemani, S. (2003). Partisan Politics and Intergovernmental Transfers in India. World Bank
Policy Research Working Paper No. 3015.
Kimenyi, M. (2006). Ethnicity, Governance and the Provision of Public Goods. Journal of
African Economies , 15 (AERC Supplement 1), pp. 62-99.
Kiondo, A. S. (2001). Group Differences in Political Orientation: Ethnicity and Class. In S. S.
Mushi, R. S. Mukandala, & M. L. Baregu (Eds.), Tanzania's Political Culture: A
Baseline Study. Dar es Salaam: Department of Political Science and Public
Administration, University of Dar es Salaam.
Konrad Adenauer Foundation, Dialogue Africa Foundation Trust. (2009). Kriegler & Waki
Reports on 2007 Elections - Summarised version, revised edition. Nairobi: Primark
Ventures.
Krabbe, G., & Mayer, H.-P. (1991). Die Schwarze Familie. Wie Entwicklungshilfe die
schwarzafrikanische Familie und die Rollen ihrer Mitglieder verändert hat. (The
Black Familiy. How Development Has Changed the African Family and the Role of
Family Members). New York: Peter Lang.
Laitin, D. D. (1992). Language Repertoires and State Construction in Africa. Cambridge:
Cambridge University Press.
Lareau, A. (1987). Social Class Differences in Family-School Relationships: The Importance
of Cultural Capital. Sociology of Education , 60 (2), pp. 73-85.
Lareau, A. (1989). Home Advantage: Social Class and Parental Intervention in Elementary
Education. London: Falmer Press.
Lemarchand, R. (1972). Political Clientelism and Ethnicity in Tropical Africa: Competing
Solidarities in Nation-Building. American Political Science Review , 66 (1), pp. 68-90.
Levinger, B. (1986). School Feeding Programs in Developing Countries: An Analysis of
Actual and Potential Impact. Aid Evaluation Special Study No. 30. Washington: U.S.
Agency for International Development.
Low, D. A. (1965). British East Africa: The Establishment of British Rule, 1895-1912. In V.
Harlow, E. M. Chilver, & A. Smith (Eds.), History of East Africa, Vol. II. London:
Oxford University Press.
Makoloo, M. O. (2005). Kenya: Minorities, Inidgenous Peoples and Ethnic Diversity.
Retrieved June 3, 2009, from Minority Rights Group International:

174
http://www.minorityrights.org/1050/reports/kenya-minorities-indigenous-peoples-and-
ethnic-diversity.html
Mankiw, N. G., Romer, D., & Weil, D. N. (1992). A Contribution to the Empirics of
Economic Growth. Quaterly Journal of Economics , 107 (2), pp. 407-437.
Marcus, R. R. (2004). Political Change in Madagascar: Populist Democracy or
Neopatrimonialism by Another Name? South Africa: Institute for Security Studies
(ISS) Paper No. 89.
Marshall, M. G., & Jaggers, K. (2008a). Polity IV Country Reports 2003. Retrieved August 8,
2008, from http:://www.systemicpeace.org/polity/polity06.htm
Marshall, M. G., & Jaggers, K. (2008b). Polity IV Country Reports 2005. Retrieved August 8,
2008, from http:://www.systemicpeace.org/polity/polity06.htm
Marshall, M. G., & Jaggers, K. (2008c). Polity IV Country Reports 2006. Retrieved August 8,
2008, from http::www.systemicpeace.org/polity/polity06.htm
Mauro, P. (1995). Corruption and Growth. Quarterly Journal of Economics , 110 (3), pp. 681-
712.
McNeal, R. B. (1999). Parental Involvement as Social Capital: Differential Effectiveness on
Science Achievment, Truancy, and Dropping Out. Social Forces , 78 (1), pp. 117-144.
MEASURE DHS. (2008). MEASURE DHS. Retrieved March 8, 2008, from Demographic and
Health Surveys: http:://www.statcompiler.com/
Michaelowa, K. (2000). Returns to Education in Low Income Countries: Evidence for Africa.
Annual meeting of the Committee on Developing Countries of the German Economic
Association. Hamburg Institute of International Economics, Germany.
Michaelowa, K. (2001). Primary Education Quality in Francophone Sub-Saharan Africa:
Determinants of Learning Achievement and Efficiency Considerations. World
Development , 29 (10), pp. 1699-1716.
Michaelowa, K., & Danielsson, J. (2005). Public Goods Characteristics and Their
Implications on Trade. Hamburg, Germany: Hamburg Institute of International
Economics, mimeo.
Michaelowa, K., & Weber, A. (2007). Aid Effectiveness in the Education Sector: A Dynamic
Panel Analysis. In S. Lahiri, Theory and Practice of Foreign Aid (pp. 357-385).
Amsterdam: Elsevier.
Middleton, J. (1965). Kenya: Administration and Changes in African Life 1912-45. In V.
Harlow, E. M. Chilver, A. Smith, & M. Perham (Eds.), History of East Africa, Volume
II. London: Oxford University Press.

175
Miguel, E. (2004). Tribe or Nation? Nation Building and Public Goods in Kenya versus
Tanzania. World Politics , 56 (3), pp. 327-362.
Miguel, E., & Gugerty, M. K. (2005). Ethnic Diversity, Social Sanctions, and Public Goods in
Kenya. Journal of Public Economics , 89 (11-12), pp. 2325-2368.
Miguel, E., & Zaidi, F. (2003). Do Politicians Reward Their Supporters? Regression
Discontinuity Evidence from Ghana. Retrieved June 8, 2008, from
http://www.sscnet.ucla.edu/polisci/wgape/papers/2_MiguelZaidi.pdf
Miles, W. F. (1987). Partitioned Royality: The Evolution of Hausa Chiefs in Nigeria and
Niger. Journal of Modern African Studies , 25 (2), pp. 233-258.
Milne, A. M., Myers, D. E., Rosenthal, A. S., & Ginsburg, A. (1986). Single Parents,
Working Mothers, and the Educational Achievement of School Children. Sociology of
Education , 59 (3), pp. 125-139.
Minorities at Risk Project. (2005). Minorities at Risk Project. Retrieved April 7, 2008, from
Assessment for Black Moors in Mauritania:
http://www.cidcm.umd.edu/mar/assessment.asp?groupId=43502
MoEC/JICA. (2002a). Tanzanian School Mapping Dataset . Dar es Salaam: Ministry of
Education & Vocational Training.
MoEC/JICA. (2002b). The Study on School Mapping and Micro Planning in Education in the
United Republic of Tanzania, Final Report, Volume I. Dar es Salaam: PADECO Co.
Naidoo, J. P. (2005). Educational Decentralization and School Governance in South-Africa:
From Policy to Practice. Paris: UNESCO International Institute for Educational
Planning.
NCCR MAGEUZI. (2000). Ilani ya uchaguzi (party manifesto). Dar es Salaam: Yudef
Printers.
Nyerere, J. K. (1966a). Ujamaa - The Basis of African Socialism. In Freedom and Unity, A
Selection from Writings and Speeches 1952-65. Dar es Salaam: Oxford University
Press.
Nyerere, J. K. (1966b). Oral Hearing at the Trusteeship Council, 1955. In Freedom and Unity,
A Selection from Writings and Speeches 1952-65. Dar es Salaam: Oxford University
Press.
Ochieng', W. (1972). African Chiefs - Were They Primarily Self-Seeking Sccoundrels? In B.
A. Ogot (Ed.), Politics and Nationalism in Colonial Kenya. Nairobi: EAPH.
OECD/DAC. (2008). International Development Statistics (IDS) Databank. Retrieved June 8,
2008, from http://www.oecd.org/dataoecd/50/17/5037721.htm

176
Ogot, B. A. (2005). History as Destiny and History as Knowledge: Being Reflections on the
Problems of Historicity and Historiography. Kisumu: Anyange Press Limited.
O'Toole, B. (1989). The Relevance of Parental Involvement Programmes in Developing
Countries. Child: Care, Health and Development , 15 (4), pp. 329-342.
Posner, D. N. (2005). Institutions and Ethnic Politics in Africa. Cambridge: Cambridge
University Press.
Poterba, J. M. (1997). Demographic Structure and the Political Economy of Public Education.
Journal of Policy Analysis and Management , 16 (1), pp. 48-66.
Primo, D. M., Jacobsmeier, M. L., & Milyo, J. (2007). The Practical Researcher, Estimating
the Impact of State Policies and Institutions with Mixed-Level Data. State Politics and
Policy Quarterly , 7 (4), pp. 446-459.
Przeworski, A., & Teune, H. (1982). The Logic of Comparative Social Inquiry. Malabar:
Krieger Publishing Company.
Rabe-Hesketh, S., & Skrondal, A. (2008). Multilevel and Longitudinal Modeling Using Stata.
Texas: StataCorp LP.
Rainer, I., & Franck, R. (2009). Does the Leader's Ethnicity Matter? Ethnic Favoritism,
Education and Health in Sub-Saharan Africa. paper presented at the Annual Meeting
of the Public Choice Society March 2009. Las Vegas.
Reinikka, R., & Svensson, J. (2001). Explaining Leakage of Public Funds. World Bank
Research Working Paper No. 2709.
Republic of Kenya. (1964). Kenya Education Commission Report, Part I. Nairobi:
Government Printer.
Republic of Kenya. (1970). Kenya Population Census, 1969, Volume I. Nairobi: Statistics
Division, Ministry of Finance and Economic Planning.
Republic of Kenya. (1981). Kenya Population Census, 1979, Volume 1. Nairobi: Central
Bureau of Statistics.
Republic of Kenya. (1988). Presidential Working Party on Education and Manpower
Training for the Next Decade and Beyond. Nairobi: Government Printer.
Republic of Kenya. (1994). Kenya Population Census 1989, Volume I. Nairobi: Government
Printer.
Schultz, E. (1984). From Pagan to Pullo: Ethnic Identity Change in Northern Cameroon.
Africa , 54 (1), pp. 46-64.
Sheldon, S. B. (2003). Linking School-Family-Community Partnerships in Urban Elementary
Schools to Student Achievement on State Tests. Urban Review , 35 (2), pp. 149-165.

177
Sheldon, S. B., & Epstein, J. L. (2004). Getting Students to School: Using Family and
Community Involvement to Reduce Chronic Absenteeism. School Community Journal
, 14 (2), pp. 39-56.
Somech, A., & Drach-Zahavy, A. (2000). Understanding Extra-Role Behavior in Schools:
The Relationship Between Job Satisfaction, Sense of Efficacy, and Teachers' Extra-
Role Behavior. Teaching and Teacher Education , 16 (5-6), pp. 649-659.
STATOIDS. (2008). Administrative Divisions of Countries Website. Retrieved June 26, 2008,
from http://www.statoids.com/statoids.html
Stevenson, D. L., & Baker, D. P. (1987). The Family-School Relation and the Child's School
Performance. Child Development , 58 (5), pp. 1348-1357.
Sui-Chu, E. H., & Willms, J. D. (1996). Effects of Parental Involvement on Eight-Grade
Achievement. Sociology of Education , 69 (2), pp. 126-141.
Tanzania National Bureau of Statistics. (2009). Statistics for Development. Retrieved
February 23, 2010, from United Republic of Tanzania in Key Statistics:
http://www.nbs.go.tz/index.php?option=com_content&view=article&id=97&Itemid=1
15
Tanzanian Labour Party (TLP). (2000). Ilani ya uchaguzi, mwaka 2000 (party manifesto). Dar
es Salaam.
The Standard. (2009, March 27). Abolish Quota System, Says Kalonzo. Retrieved May 13,
2009, from http://www.eastandard.net/InsidePage.php?id=1144009938&cid=159&
Topping, K. J. (1992). Short- and Long-Term Follow-Up of Parental Involvement in Reading
Projects. British Educational Research Journal , 18 (4), pp. 369-379.
Tripp, A. M. (1999). The Political Mediation of Ethnic and Religious Diversity in Tanzania.
In C. Young (Ed.), The Accomodation of Cultural Diversity: Case Studies. London:
Macmillan Press Ldt.
UNESCO. (2004). EFA Global Monitoring Report, From Targets to Reform: National
Strategies in Action. Retrieved June 10, 2008, from
www.unesco.org/education/efa_report/2003_pdf/chapter5.pdf
UNESCO. (2008a). EFA Global Monitoring Report 2009, Overcoming Inequality: Why
Governance matters. Paris: UNESCO.
UNESCO. (2008b). EFA Global Monitoring Report, Education for All by 2015: Will We
Make It? Retrieved June 9, 2008, from
http://unesdoc.unesco.org/images/0015/001547/154743e.pdf

178
United Republic of Tanzania. (1971). 1967 Population Census, Volume 3: Demographic
Statistics. Dar es Salaam: Bureau of Statistics, Ministry of Economic Affairs and
Development Planning.
United Republic of Tanzania. (1998a). Appendices to Volume III Estimates of Public
Expenditure Supply Votes (Regional). Dar es Salaam: Government Printer.
United Republic of Tanzania. (1998b). Kitabu Cha Nne, Makadirio ya Fedha za Serikali
(Sehemu B), Mipango ya Maendeleo ya Halmashauri za Wilaya na Miji [Volume 4,
Estimates of the Government Budget (Part B), Development Plans of the Councils of
the Districts and Cities]. Dar es Salaam: Government Printer.
Useem, E. L. (1992). Middle Schools and Math Groups: Parents' Involvement in Children's
Placement. Sociology of Education , 65 (4), pp. 263-279.
Vigdor, J. L. (2004). Community Composition and Collective Action: Analyzing Initial Mail
Response to the 2000 Census. Review of Economics and Statistics , 86 (1), pp. 303-
312.
Voll, K. (1995). Politik und Gesellschaft in Kenia: zur Evolution einer afrikanischen
Gesellschaft während der britischen Kolonialherrschaft (Politics and Society in
Kenya), Berliner Studien zur Politik in Afrika (11). Frankfurt am Main: Peter Lang
GmbH.
Walberg, H. J. (1984). Families as Partners in Educational Productivity. Phi Delta Kappan ,
65 (6), pp. 397-400.
Wamwere, K. W. (2008). Towards Genocide in Kenya - The Curse of Negative Ethnicity.
Nairobi: MvuleAfrica Publishers.
Wantchekon, L. (2003). Clientelism and Voting Behavior - Evidence from a Field Experiment
in Benin. World Politics , 55 (3), pp. 399-422.
Whiteley, W. H. (1969). Swahili: the Rise of a National Language. London: Methuen.
Widlok, T. (1996). Ethnicity in the Post-Apartheid Era: A Namibian 'San' Case Study. In L.
de la Gorgendière, K. King, & S. Vaughan (Eds.), Ethnicity in Africa. Roots,
Meanings and Implications. Edinburgh: University of Edinburgh.
World Bank. (2006). World Development Indicators CD-ROM . Washington D.C.
World Bank. (2008). World Development Indicators CD-ROM . Washington D.C.

179
ANKE WEBER
Born August 2, 1982, in Saarbrucken, Germany
EDUCATION
Zurich, Switzerland UNIVERSITY OF ZURICH Since 09/2006
Ph.D. candidate: Department for Political Science
New York, USA NEW SCHOOL FOR SOCIAL RESEARCH 09/2004 – 05/2005
Graduate exchange student: Department of Economics
Frankfurt, Germany GOETHE-UNIVERSITY 10/2001 – 08/2006
German Diploma in Economics
PROFESSIONAL EXPERIENCE
Washington, USA WORLD BANK 06/2010 – 07/2010
Intern: Africa Region, Human Development Unit
Zurich, Switzerland UNIVERSITY OF ZURICH Since 09/2006
Research assistant: Political Economy and Development
Butare, Rwanda NATIONAL UNIVERSITY OF RWANDA 06/2007 – 07/2007
Guest lecturer: Department for Political Science
Frankfurt, Germany KFW DEVELOPMENT BANK 08/2005 – 10/2005
Intern: Economic Reform Unit
Conakry, Guinea GERMAN EMBASSY CONAKRY 12/2003 – 01/2004
Intern
SCHOLARSHIPS
09/2009 – 03/2010 Swiss Academy of Humanities and Social Sciences (SAGW), travel
grants
09/2004 – 05/2005 New School University, Graduate Faculty, study grant
09/2004 – 01/2005 German Academic Exchange Service (DAAD), study grant