ethnic favoritism in education in kenya - daniel n....
TRANSCRIPT

Quarterly Journal of Political Science, 2016, 11: 1–58
Ethnic Favoritism in Education inKenyaEric Kramon1 and Daniel N. Posner2∗
1Department of Political Science, George Washington University, 2115G St. NW, Washington, DC 20052, USA; [email protected] of Political Science, University of California, Los Angeles,4289 Bunche Hall, Los Angeles, CA 90095-1472, USA;[email protected]
ABSTRACT
We test the claim that African leaders favor members oftheir own ethnic groups by studying ethnic favoritism in theeducation sector in Kenya. We use data on the educationalattainment of more than fifty thousand Kenyans dating backto the colonial era, as well as information about the ethnicidentities of Kenyan presidents, cabinet members, and high-level education bureaucrats since the 1960s. Consistent withprevious work, we find that having a coethnic as presidentduring one’s school-age years is associated with an increasein the schooling that children acquire. In contrast to recentstudies, we find that multiparty political competition hasno impact on the degree of ethnic favoritism in the educa-tion sector. We also go beyond prior work in three ways.First, we show that coethnics of the minister of educationalso acquire more schooling than children from other ethnicgroups — evidence that ministerial appointments come with
∗The authors thank members of the Working Group in African Political Economy(WGAPE) and seminar participants at Dartmouth, Georgetown, MIT, NBER, Oxford,Penn, Princeton, Rochester, Stanford, Virginia, Columbia, Hebrew University, the
Supplementary Material available from:http://dx.doi.org/10.1561/100.00015005_suppMS submitted on 8 January 2015; final version received 15 September 2015ISSN 1554-0626; DOI 10.1561/100.00015005© 2016 E. Kramon and D. N. Posner

2 Kramon and Posner
real power to impact distributive politics. Second, we inves-tigate the effects of coethnicity using different definitionsof the president’s ethnic community and provide evidencethat the beneficiaries of ethnic favoritism can shift with theintroduction of democratic electoral competition. Third,we examine several mechanisms through which having acoethnic president might matter and find much greater sup-port for mechanisms emphasizing the supply of inputs tocoethnics than those emphasizing the demand by coethnicsfor greater educational opportunities.
Keywords: Political economy; comparative politics; executive politics;the bureaucracy.
The belief that people in positions of political power will use theiroffices to favor their ethnic kin is widespread in Africa. The assumptionof ethnic favoritism is reflected in the results of public opinion pollsconducted across the continent (KIPPRA Research Team, 2012) andundergirds the leading theories that have been advanced to explainvoting behavior (Bates, 1983; Carlson, 2015; Ferree, 2006; Ichino andNathan, 2013; Posner, 2005), economic policymaking (Easterly andLevine, 1997), and the structure of clientelist networks (Wantchekon,2003), among other outcomes. However, while anecdotal examples ofethnic favoritism abound, the volume of systematic empirical workdocumenting its existence is incommensurate with the importance ofthe phenomenon in our understanding of African affairs. This paperjoins a small but growing number of studies that employ large-scalequantitative data to document the extent and study the patterns ofethnic favoritism in an African setting.
We focus on ethnic favoritism in educational outcomes both becausethis is an important topic in its own right (Alwy and Schech, 2004;
World Bank, and the Juan March Institute, as well as two anonymous reviewers andthe QJPS editors, for their helpful comments. We also thank Antony Munene andJennifer Doherty for their research assistance. Kramon acknowledges support fromthe Air Force Office of Scientific Research (AFOSR) under Award No. FA9550-09-1-0314 and thanks the Center on Democracy, Development, and the Rule of Law forits support of this research. Posner thanks the Center for Advanced Study in theBehavioral Sciences for its support during the paper’s initial stages.

Ethnic Favoritism in Education in Kenya 3
Kramon and Posner, 2014) and because it provides a window ontothe broader phenomenon of ethnic favoritism by political leaders. Byprobing its sources and uncovering its patterns we can glean valuablelessons about how distributive politics operates in an African setting.1
We study the subject in Kenya because of the salience of ethnicityin the country’s political affairs (Wrong, 2009) and because of theavailability of comprehensive data on educational attainment and otherrelevant outcomes, which makes it possible to undertake analyses thatare broader and deeper than those presented in prior (and especiallycross-national) work.
Ethnic favoritism, of course, is not the only factor that drives cross-group differences in schooling outcomes. A central challenge, therefore,is to separate out the effects of ethnic favoritism from the effects of otherfactors that also affect educational attainment. Our empirical strategy,elaborated below, controls for these other individual- and group-levelfactors in order to isolate the impact on schooling outcomes of having acoethnic in a position of political power.
We use data from five separate Demographic and Health Surveys(DHS) conducted in Kenya between 1989 and 2009 to construct atime-series cross-sectional dataset that includes information on theeducational attainment of more than fifty thousand individuals datingback to before the country’s independence in 1963. These data permitus to analyze the impact on educational attainment of having a coethnicin a position of political power during one’s primary and secondaryschool years. In keeping with the findings of other research on ethnicfavoritism by Kenyan presidents (Barkan and Chege, 1989; Burgess etal., 2015; Jablonski, 2014; Morjaria, 2011; Nellis, 1974), we find evidencethat the president’s ethnic kin are in fact favored with respect to theireducational achievements.2 Specifically, we find that having a coethnicas president during one’s school-aged years is associated with an increaseof 0.36 years of primary schooling and 0.12 years of secondary schooling(increases of roughly 6 and 12 percent, respectively). These results are
1We must be cautious, however, in making general claims about distributivepolitics from the patterns of ethnic favoritism we observe in the education sector, aspatterns of favoritism may differ in other areas (Kramon and Posner, 2013).
2These main findings are also in keeping with the results of cross-national studiesof ethnic or regional favoritism by political leaders, such as Franck and Rainer (2012),Hodler and Raschky (2014), and De Luca et al. (2015).

4 Kramon and Posner
robust to multiple measures of educational attainment, out-of-sampletests using census data with more than 3 million observations, and a testin which we analyze educational outcomes among the subset of Kenyanchildren who were enrolled in primary or secondary school during thethree years immediately preceding and following the transitions fromPresident Jomo Kenyatta to President Daniel Arap Moi in 1978 andfrom President Moi to President Mwai Kibaki in 2002. These resultsare bolstered by the fact that we find no effect in a placebo test inwhich we move that six-year window to the periods before or after thesepresidential transitions.
Along with Burgess et al. (2015), we also investigate how ethnicfavoritism varies across democratic and non-democratic moments ofKenya’s political history. In contrast to that study, but in keepingwith the cross-national result reported in Franck and Rainer (2012) andDe Luca et al. (2015), we find no evidence that patterns of favoritismby the president to his ethnic group were altered by the shift fromsingle-party to multiparty politics.
We go beyond previous research in three important respects. First,we investigate the impact on schooling outcomes of having a coethnicserving as the minister or permanent secretary of education, and ofhaving coethnics in other important cabinet positions. These analysesare motivated by evidence from prior research which shows that Africanelites often strategically allocate cabinet positions to members of otherethnic groups in exchange for regime support (Arriola, 2009). Whilethis is well established, there is no empirical research on the distributiveconsequences of these cabinet allocations. Accounting for the potentialethnic favoritism of these actors, in addition to the president, is thuscrucial to understanding how ethnicity shapes the allocation of publicgoods in African countries. We find strong evidence that these actorsmatter: for every one of an individual’s primary school years thatcorresponds with the tenure in office of a coethnic minister of education,that individual completes an average of 0.06 more years of primaryschooling. This amounts to slightly more than an additional third of ayear of schooling if a coethnic served as minister of education duringall of a child’s primary school years — an effect roughly comparableto having a coethnic president. We also find that having a coethnicminister of education during the whole of a child’s secondary schoolyears is associated with an additional 0.09 years of secondary schooling —

Ethnic Favoritism in Education in Kenya 5
about a ten percent increase. These findings complement those reportedin Francois et al. (2015), who show that African presidents appointministers from other ethnic groups but do not provide evidence ofwhether or not this matters for patterns of resource distribution. Wedemonstrate that it does.
Second, in investigating the impact of sharing an ethnic tie with thepresident, we explore the implications of modifying the way we definethe president’s ethnic group. In most analyses of ethnic favoritism,coethnicity with the patron is defined in terms of common membershipin an ethnic census category. However, the communal bonds that matterin practice could equally well stem from more localized connections(such as belonging to the same ethnic sub-group or clan) or from moreencompassing associations (such as membership in a broad, ethnicallydefined political coalition that includes multiple census category groups).We therefore supplement our main estimates of ethnic favoritism withadditional analyses in which we vary the definition of the president’sethnic group, both more narrowly and more broadly. Our results, whichsuggest both that culturally-defined sub-groups within the president’sethnic community sometimes benefit disproportionately and also thatbroader ethnic coalitions are sometimes the relevant unit of politicalfavoritism — and that whether or not they do varies with the sizeof the president’s own ethnic group and the nature of the politicalregime — challenge existing, and overly simplistic, understandings ofhow ethnicity matters for distributive politics.
In further contrast to prior work, we present evidence to adjudicateamong several mechanisms that might account for the patterns ofethnic favoritism we identify. Drawing on five decades of district-leveldata on school construction, we test whether the channel throughwhich presidents favor their coethnics lies in preferential access toschooling inputs. Using data on infant mortality and female adultheights (a proxy for child nutrition), we test whether the causal linklies in favoritism in other domains that may have an indirect impact oneducational attainment. We also draw on a variety of other analyses toinvestigate whether the mechanism lies in expectations about changes tothe economic returns to schooling when a coethnic enters or exits power.Our findings provide evidence only for the first mechanism, which weinterpret as suggesting that the higher educational attainment of thepresident’s coethnics is due to their greater access to educational inputs.
6 Kramon and Posner
1 Data
DHS are periodic, nationally representative surveys that collect infor-mation on population, health, and nutrition at the household level inmore than 85 developing countries. We pool the individual-level datafrom the DHS from the Kenyan survey years of 1989, 1993, 1998, 2003,and 2008–2009. The DHS interviews every woman in the households itsamples, along with male household members in a randomly selectedsub-sample of households. We combine the male and female data sets,generating a master data set with more than 50,000 observations thatincludes age cohorts, based on the year in which an individual beganprimary or secondary school, that stretch from the mid-1950s to theearly-2000s.3
Our main dependent variables, which come straightforwardly fromthe DHS data, are the number of years of primary and secondaryschooling that an individual has received.4 To get a sense of thevariation we seek to explain, Panels A and B of Table 1 present theaverage number of years of primary and secondary schooling completed,broken down by each of Kenya’s major ethnic groups and by decade. Asthe last columns make clear, average rates of schooling in Kenya varymarkedly across ethnic groups. For example, Kikuyu children, the mostadvantaged group according to the data, have had about 16 percentmore primary schooling and 72 percent more secondary schooling thanKalenjin children (6.59 years vs. 5.67 years and 1.31 years vs. 0.76years, respectively) and nearly 40 percent more primary schooling and68 percent more secondary schooling than children from other ethniccommunities (that is, ethnic groups other than the five largest ones —6.59 years vs. 4.78 years and 1.31 years vs. 0.78 years). Table 1 alsomakes clear that the sizes of the gaps among Kenya’s ethnic groupshave varied over time. Kikuyu children have the highest rates of schoolattainment in all periods, but the distance between them and the other
3We correct for the imbalance in female and male sample sizes by weighting inanalyses that report raw education outcomes and by including a control variablefor respondent’s gender in all regressions. We also explicitly test for cross-genderdifferences in Table 12, below.
4Until 1985, Kenyan students attended primary school for seven years. Thereafter,the system was changed to an 8-4-4 system, adding an eighth year to primary schooling.Thus the variable ranges from 0 to 7 prior to 1985 and from 0 to 8 afterwards. Thesecondary school-years variable ranges from 0 to 4.

Ethnic Favoritism in Education in Kenya 7
major groups has shifted over the years. Whereas Kikuyu children inthe 1960s completed an average of 47 percent more years of primaryeducation than Kalenjin children and 39 percent more years of primaryeducation than Luo children, these gaps narrowed to just 8 percentand 5 percent, respectively, in the 1980s. Gaps in secondary schoolingnarrowed as well. Part of this is no doubt due to the natural processof catch-up, as groups with little exposure to formal education duringthe colonial era were incorporated into the national education systemafter independence. But the pattern also raises questions about whethersomething about the nature of politics that varied across the decadesmay have also contributed to the changes over time in the comparativefortunes of children from different ethnic communities.
Some initial evidence for this conjecture is provided in Panels C andD of Table 1, where we break down the average schooling attainmentof each major ethnic group by political regime. While average primaryschooling in Kenya increased between the Kenyatta and Moi presiden-cies, it increased particularly strongly among Moi’s Kalenjin coethnics(and also among the Luo) and decreased relative to the national averageamong the Kikuyu, Kenyatta’s coethnics (see Panel C). Then, when thepresidency was transferred back into the hands of a Kikuyu, PresidentMwai Kibaki, in 2003, the strongest increase relative to the nationalaverage was among the Kikuyu — an increase all the more noteworthygiven the fact that Kikuyus, by that time, were already approachingthe ceiling of 8 years of primary schooling, so improvements were muchharder to attain. Similar patterns are evident at the secondary schoollevel as well. The largest increase in secondary schooling attainmentbetween the Kenyatta and Moi years was among the Kalenjin (seePanel D), who experienced a 54 percent increase relative to the na-tional average. And following the transition from Moi to Kibaki, aperiod in which secondary schooling rates declined overall, Kibaki’sKikuyu coethnics, along with the Kalenjin and the Luo, experiencedthe smallest reduction.5 These patterns are highly suggestive of the
5The fact that the Luo received such a large bump in their secondary schoolingoutcomes following the transition from Moi to Kibaki may be explained by the factthat the Luo were in a political coalition with the Kikuyu during the early yearsof the Kibaki presidency. We return to the issue of spillover of benefits to politicalcoalition partners below.

8 Kramon and Posner
Table 1: Average years of primary and secondary school completed, by ethnic group,time period and political regime.
Panel A: primary school years by decadeColonial 1960s 1970s 1980s 1990s 2000s All years
Kalenjin 3.02 3.75 5.16 6.68 6.65 6.90 5.67Kamba 3.37 4.86 5.86 6.92 6.88 6.97 6.11Kikuyu 4.19 5.50 6.43 7.20 7.42 7.75 6.59Luhya 3.86 4.44 5.65 6.74 6.68 6.84 5.98Luo 3.18 3.97 5.46 6.87 7.04 7.21 5.97Others 2.74 3.42 4.39 5.52 5.29 5.62 4.78All Kenyans 3.38 4.25 5.39 6.48 6.42 6.59 5.71Observations 4,678 4,820 13,265 15,701 11,002 3,659 53,136
Panel B: secondary school years by decadeColonial 1960s 1970s 1980s 1990s 2000s All years
Kalenjin 0.18 0.32 0.61 0.94 0.86 0.79 0.76Kamba 0.20 0.43 1.02 1.14 0.92 0.78 0.93Kikuyu 0.31 0.70 1.42 1.46 1.36 1.29 1.31Luhya 0.37 0.63 1.10 1.07 0.94 0.76 0.94Luo 0.28 0.50 0.85 0.86 0.93 0.92 0.84Others 0.33 0.50 0.80 0.91 0.84 0.65 0.78All Kenyans 0.29 0.53 0.98 1.07 0.97 0.85 0.93Observations 1,5038 3,823 10,575 15,146 13,938 8,140 53,136
Panel C: primary school years by political regime% change vis-à-vis
Kenyatta Moi Kibaki national average(1964–1978) (1979–2002) (2003–2008) Kenyatta to Moi Moi to Kibaki
Kalenjin 4.56 6.60 6.78 +15 +2Kamba 5.44 6.85 6.63 −3 −4Kikuyu 6.10 7.23 7.66 −11 +5Luhya 5.18 6.67 6.64 −0 −1Luo 4.87 6.87 7.00 +12 +1All Kenyans 4.01 5.35 5.57Observations 14,924 30,887 2,636
Panel D: secondary school years by political regime% change vis-à-vis
Kenyatta Moi Kibaki national average(1964–1978) (1979–2002) (2003–2008) Kenyatta to Moi Moi to Kibaki
Kalenjin 0.48 0.88 0.83 +54 +11Kamba 0.76 1.02 0.76 +5 −8Kikuyu 1.09 1.41 1.31 0 +11Luhya 0.90 0.99 0.75 −20 −6Luo 0.70 0.89 0.92 −2 +20All Kenyans 0.67 0.86 0.61Observations 14,510 33,468 5,147
Note: Children are coded as having attended primary or secondary school during a givenperiod if they spent the majority of their school years (i.e., ≥4 years for primary; ≥2 yearsfor secondary) during that period. The colonial era is the mid-1950s to 1963.

Ethnic Favoritism in Education in Kenya 9
role that ethnic favoritism by the president may have played in shapingschooling outcomes in Kenya.
To test this claim more rigorously, we turn to individual-level data onschool attainment. Our main independent variable, presidential ethnicmatch, is an indicator variable that takes a value of 1 if the individualwas a member of the same ethnic group as the president during thetime the individual attended primary (or secondary) school, and avalue of 0 otherwise. Following Franck and Rainer (2012), we code thisvariable by connecting the ethnicity of the individual to the ethnicity ofthe president when the individual was between 6 and 13 years old forprimary school and between 14 and 17 years old for secondary school.6
Integrating a two-year time lag into our coding rule to account for thefact that policies put in place by a president are not likely to havean immediate impact (and that policies put in place by a president’spredecessor are likely still to shape educational outcomes for a periodof time after he has left office), we code a presidential ethnic matchbased on the ethnicity of the president when the respondent was aged4–11 (for our primary schooling analyses) and 12–15 (for our secondaryschooling analyses).7 If a change in the president occurred during achild’s primary or secondary school-aged years, the match is coded basedon the ethnicity of the president who was in power for the majority ofthe time that the child was at that level of schooling (that is, for fouror more years for primary and two or more years for secondary, subjectto the two year lag).
A drawback of using the DHS data for our purposes is that theDHS surveys are administered to adults, whereas the outcome weare interested in, educational attainment, took place when the survey
6The Kenyan primary education system is designed for students to begin atage six (or sometimes seven) and to last for 7 (until 1985) or 8 (after 1985) years.Primary school age is thus roughly age 6 to 13; secondary school age is roughly 14to 17. To the extent that students delay entry into formal schooling or withdrawfor a period and return when they are older, this will bias our analyses againstfinding an effect of ethnic favoritism. In coding the ethnic match variable, we usethe self-reported ethnic group membership of the survey respondent in our mainanalyses. While the ethnic group categories used in the DHS surveys vary somewhatacross the five survey rounds we employ, the categories for the ethnicities of eachKenyan president (Kalenjin and Kikuyu) are stable throughout, so these changes donot affect the coding of the ethnic match variable.
7Our results are robust to various changes in the lag (see Appendix A).

10 Kramon and Posner
respondents were children or teenagers. Since a survey respondent’scircumstances may have changed between childhood and the time thathe or she was interviewed, we cannot use most of the rich individual-and household-level information that the DHS collects to control forthe circumstances facing an individual’s family at the time he/she wasof school age. Our models are therefore by necessity spare, althoughwe can and do control for the individual’s gender, religion (Catholic,Muslim, or Protestant) and for whether the individual spent his/herchildhood (and thus attended primary school) in a rural area, since theDHS collects information about this issue.
2 Empirical Strategy
A major challenge in estimating the impact of political favoritism oneducational attainment is to isolate the effects of such favoritism fromindividual- and group-specific factors that might also affect schoolingoutcomes. For example, if we found that members of the president’sethnic group completed more years of primary schooling on average thanmembers of other ethnic groups (as indeed we find under presidentsKenyatta and Kibaki — see Table 1), it would be difficult to knowwhether this association was a product of ethnic favoritism by thepresident or of deeper causes such as the group’s earlier exposure tocolonial education (Gallego and Woodberry, 2010; Nunn, 2011; Oyugi,2000; Rothchild, 1969), its proximity to the national capital, its normsabout girls’ education, its higher than average wealth or greater jobopportunities (both of which might affect the cost-benefit decisionsfamilies make about whether to send their children to school), or someother group-specific natural advantage.
Our strategy for solving this inferential problem is to leveragechanges in the ethnicity of the president (which happened in 1978,when Kenyatta, a Kikuyu, was succeeded by Moi, a Kalenjin, and in2002, when Moi was succeeded by Kibaki, a Kikuyu) and to run ourmodels with ethnic group fixed effects, which control for unchanginggroup-specific factors that may predispose members of one group toover- or under-perform others.8 This approach allows us to study the
8Burgess et al. (2015), Franck and Rainer (2012), Jablonski (2014), Hodler andRaschky (2014) and Morjaria (2011) employ a similar strategy.

Ethnic Favoritism in Education in Kenya 11
changing fortunes of each group over time, comparing the group’s schoolattainment during periods when it has a president in the state houseand when it does not, holding group-specific characteristics constant.
A potential concern is that the change in leadership may be endoge-nous to the rising educational fortunes of the new president’s ethnicgroup. In the case of the transition from Kenyatta to Moi, this concernis minimized by the fact that Kenyatta’s departure from power wascaused by his death in office. Moreover, Moi was permitted to assumethe presidency precisely because his ethnic group was viewed as econom-ically and educationally backward, and his succession as unthreateningto Kikuyu interests (Branch, 2011; Hornsby, 2012). Moi’s politicalopponents believed (incorrectly as it turns out) that this would make iteasy for them to control him. Hence, Moi’s ascension to the presidencycannot plausibly be attributed to the expanding educational attainmentof his ethnic group. In the case of the transition from Moi to Kibaki,this concern looms larger. Indeed, as Arriola’s (2012) analysis makesclear, financial support from well-educated Kikuyu business elites wascentral to Kibaki’s electoral victory in 2002. However, the Moi-Kibakitransition plays only a small part of our analysis, and our results areunchanged if we drop the data from the Kibaki presidency.9
In addition to ethnic-group fixed effects, each model also includesyear of birth fixed effects, whose inclusion helps to control for time-specific shocks that might impact primary education attainment dif-ferently across age cohorts. This might be an issue if, for example, apresident’s tenure in office coincided with a severe economic downturnthat caused parents to keep their children home from school becausethey could not afford school fees or uniforms or so that the childrencould contribute to household income. In such a scenario, it wouldbe impossible to separate out the impact of the president’s efforts tohelp his group from the impact of the negative shock that happened tocoincide with his presidency.10 We also include robust standard errors
9The lesser importance of the Moi-Kibaki transition stems from the fact the thatmost recent available DHS survey was conducted in 2008–2009, just five years afterthe start of the Kibaki presidency. This means that the number of individuals in oursample who had completed the majority of their primary or secondary school yearsunder Kibaki is small — just under five and ten percent of our sample, respectively.
10Our results are also robust to the addition of both linear and quadratic ethnicgroup-specific time trends (see Appendix B). Including such group-specific time

12 Kramon and Posner
clustered at the ethnic group-president level (since this is the level atwhich the treatment — presidential favoritism — is applied).11 Theequation we estimate is therefore
Yijt = α+ θMijt + βXi + γj + δt + εijt ,
where Yijt is the educational outcome for the individual i in ethnicgroup j born in year t; M , our ethnic match indicator, takes a valueof 1 if people from ethnic group j born in year t spent the majority oftheir primary or secondary school-aged years with a coethnic president;X is a vector of individual-level controls (gender, religion, born in arural area); γ are ethnic group fixed effects; and δ are the year of birth(cohort) fixed effects. All models are estimated using OLS.12
3 Results
3.1 Evidence for Presidential Ethnic Favoritism
In column 1 of Table 2, we test for the impact of presidential ethnicfavoritism on an individual’s number of primary school years. Thepresidential ethnic match variable is statistically significant, with apoint estimate of 0.36. The interpretation is that, controlling for anindividual’s religion, urban or rural upbringing, gender, ethnic groupmembership, and year of birth, having a president from one’s own ethnicgroup in power during one’s primary school years is associated with an
trends would allow us to control for time-varying factors that affect school enrollmentrates but that, due to ethnic groups’ geographic segregation, economic specialization,or other factors, affect ethnic groups differently. For example, the boom in coffeeprices in the mid-1970s raised income in Kikuyu areas (where coffee production isconcentrated) but had a much smaller impact on the incomes of members of otherethnic groups. To the extent that household incomes are related to educationalattainment, the coffee boom plausibly affected Kikuyu children’s schooling outcomesmore strongly than that of children from other ethnic communities. The inclusion ofthese group-specific time trends will, however, absorb some of the effects of having acoethnic president (which is, of course, another group-specific time varying factor),so we do not include them in our main specification.
11This is a conservative specification. Our results are identical in an alternatespecification in which we cluster at the ethnic group-age cohort level (see Appendix C).The results are also robust to bootstrapped standard errors, as suggested by Bertrandet al. (2004).
12Appendix D replicates the main results using logistic regression.

Ethnic Favoritism in Education in Kenya 13
Tab
le2:
Preside
ntiale
thnicfavo
ritism
andprim
aryed
ucationou
tcom
es.
(7)
(8)
(1)
(2)
(3)
(4)
(5)
(6)
Primary
Primary
Primary
Primary
Primary
Primary
Primary
Primary
years
completion
years
years
attend
ance
attend
ance
completion
completion
(census)
(census)
Presidentialethn
icmatch
0.359∗∗
∗0.054∗∗
∗0.031∗∗
∗
(0.032)
(0.008)
(0.005)
#of
presidential
0.049∗∗
∗0.008∗∗
∗0.003∗∗
ethn
icmatch
years
(0.010)
(0.001)
(0.001)
Districtethn
icmatch
0.221∗∗
∗0.018∗
(0.049)
(0.010)
Observation
s47,275
47,275
47,275
47,275
47,275
47,275
3,236,101
3,236,101
R-squ
ared
0.270
0.270
0.230
0.229
0.117
0.117
0.359
0.173
Rob
uststan
dard
errors,c
lustered
atethn
icgrou
p-presidentlevel.Colum
ns1–6includ
eethn
icgrou
pfix
edeff
ects,a
gecoho
rt(year-of-birth)
fixed
effects,a
ndcontrolsforchild
hood
inrurala
rea,
gend
er,a
ndrelig
ion.
Colum
ns7–8includ
edistrict
andagecoho
rt(year-of-birth)fix
edeff
ects
andstan
dard
errors
clusteredby
district.Allmod
elsareestimated
usingOLS.
∗∗∗ p
<0.01,∗∗
p<
0.05,∗ p
<0.1

14 Kramon and Posner
increase of just over a third of a year of primary schooling. This is asubstantively meaningful effect: since the average Kenyan in our samplehas 5.71 years of primary schooling, this is equivalent to a 6.3 percentincrease in the number of primary school years that a child receives. Incolumn 2, we revisit this result but redefine our ethnic match variableslightly to reflect the number of years (from among a child’s seven oreight primary school-age years) in which a coethnic was president, andgenerate a nearly identical finding.13
Thus far, we have investigated the impact of having a coethnicpresident on the intensive margin: the number of years of primaryschooling a child completes. In columns 3 and 4 of Table 2, we test forthe impact of having a coethnic president on the extensive margin: thelikelihood that a child has any primary schooling at all. We find here thathaving a coethnic president is associated with a 5.4 percent increase inthe likelihood that a child attends at least some primary school. However,while just about all children start school, not everyone completes it, andthe results in columns 5 and 6 suggest that having a coethnic president isassociated with whether or not one does. Inasmuch as finishing primaryschool may be necessary for certain employment, this measure has theadvantage of capturing something tangible and potentially importantfor real world outcomes. However, unlike the primary years variable,the primary completion measure cannot distinguish between childrenwho completed six years of primary school and children who completednone, which may be quite important for the level of skills that a childacquires in school. In any case, the results are very similar: measuredeither in terms of whether a coethnic was president for a majority ofone’s primary school-age years (as in column 5) or in terms of thenumber of years in which a coethnic was president during one’s primaryschool-age years (as in column 6), we find that having a president fromone’s own group in power is associated with a significant increase in achild’s likelihood of having completed primary school.
13The two operationalizations are identical for the majority of individuals whoseprimary school-age years coincide with the tenure of a single president (subject tothe two year lag). Only in situations where an individual’s primary school-age yearsoccurred under two different leaders (as is the case for children born between 1974and 1983 and after 1997) does the number of presidential ethnic match years variablegenerate a slightly different result, but this is a quite small share of our sample.

Ethnic Favoritism in Education in Kenya 15
While primary schooling is critically important from a developmen-tal standpoint and, as a consequence, is highly demanded, secondaryeducation is perhaps even more powerfully associated with job oppor-tunities. Space in secondary schools is also much more limited thanspace in primary schools. Hence, at least for those who have completedprimary school, and thus qualify to continue their schooling, secondaryschool attendance may be even more powerfully subject to political(and ethnic) favoritism. Secondary schooling also has the advantage ofbeing less affected by ceiling effects: even the group with the highestrates of secondary school attendance and completion, the Kikuyu (42percent secondary school attendance rate and 25 percent secondaryschool completion rate), still have much room for improvement.
We test for the impact of having a coethnic president on secondaryschool attendance and completion in Table 3. Columns 1 and 2 report,using slightly different operationalizations of the dependent variable,that having a coethnic as president during one’s secondary school-agedyears is associated with the completion of an additional 0.12 years ofsecondary school. Given that the average Kenyan completes just 0.93years of secondary school, this amounts to a 12.4 percent increase insecondary schooling years. We find, similarly, that individuals are 3.3percentage points more likely to attend secondary school when they havea coethnic in power during their secondary school-age years (columns3 and 4). We find no effect, however, of having a coethnic in thepresidency on rates of secondary school completion (columns 5 and 6).
The size of these estimated effects are comparable to those reportedin several education-related interventions in developing countries. Forexample, Miguel and Kremer (2004) find that administering de-wormingdrugs to Kenyan pupils decreases absenteeism by 7 percentage points.Evans et al. (2009) find that distributing free school uniforms increasesattendance by about 6 percentage points. Duflo (2001) finds that eachschool constructed per 1000 children in Indonesia increases schoolingby between 0.12 to 0.19 years. Schultz (2004) finds that the cashpayments to parents under the PROGRESA program in Mexico increasesenrollments by about 3 percentage points. And Angrist et al. (2002) findthat a lottery in Colombia that randomly subsidized private schooling forsome students increases completion of the eighth grade by 10 percentagepoints. The fact that ethnic favoritism by the president can generateeffects on educational attainment that are roughly the same magnitude

16 Kramon and Posner
Tab
le3:
Preside
ntiale
thnicfavo
ritism
andsecond
aryed
ucationou
tcom
es.
(7)
(8)
(1)
(2)
(3)
(4)
(5)
(6)
Second
ary
Second
ary
Second
ary
Second
ary
Second
ary
Second
ary
Second
ary
Second
ary
years
completion
years
years
attend
ance
attend
ance
completion
completion
(census)
(census)
Presidentialethn
icmatch
0.115∗∗
∗0.033∗∗
∗0.010
(0.036)
(0.011)
(0.008)
#of
presidential
0.032∗∗
∗0.009∗∗
0.003
ethn
icmatch
years
(0.010)
(0.003)
(0.002)
Districtethn
icmatch
0.016
0.005
(0.037)
(0.009)
Observation
s46
,042
46,042
47,275
47,275
47,275
47,275
3,402,305
3,430,909
R-squ
ared
0.093
0.093
0.085
0.085
0.072
0.072
0.117
0.102
Rob
uststan
dard
errors,c
lustered
atethn
icgrou
p-presidentlevel.Colum
ns1–6includ
eethn
icgrou
pfix
edeff
ects,a
gecoho
rt(year-of-birth)
fixed
effects,a
ndcontrolsforchild
hood
inrurala
rea,
gend
er,a
ndrelig
ion.
Colum
ns7–8includ
edistrict
andagecoho
rt(year-of-birth)fix
edeff
ects
andstan
dard
errors
clusteredby
district.Allmod
elsareestimated
usingOLS.
∗∗∗ p
<0.01,∗∗
p<
0.05,∗ p
<0.1.

Ethnic Favoritism in Education in Kenya 17
as interventions explicitly designed to improve schooling outcomesattests to the importance of the phenomenon we are studying.
3.2 Out of Sample Validation
To validate our main results outside of the DHS sample, we employ a5 percent sample from each of Kenya’s decennial censuses conductedbetween 1969 and 2009 (Minnesota Population Center, 2014). Weinclude only individuals who were of primary or secondary school ageafter independence, giving us a total sample size of just over 3 millionpeople. A disadvantage of the census data is that the Kenyan governmentwithholds individual-level information about ethnicity due to its politicalsensitivity. Hence, we combine information about district-level ethnicdemographics (gathered separately) with respondents’ district of birthto create a district ethnic match variable. This measure captureswhether or not each respondent was born in a district in which themajority ethnic group shared an ethnicity with the president duringthe respondent’s school-age years.14 Note that the use of census data(and district level outcomes) is less advantageous than the DHS data,which provides individual level estimates without making an ecologicalinference. However the census data has the advantage of dramaticallyincreasing our sample size and providing an out of sample robustnesstest.
Columns 7 and 8 of Tables 2 and 3 present the main results (forprimary/secondary school years and completion) from our analysis ofthe census data. Our estimates include controls for the respondent’sgender and district of birth (which play a role in the analysis analogousto ethnic group fixed effects in the DHS specifications), along withage cohort fixed effects. Standard errors are clustered at the districtlevel. This specification, which replicates the main specification inthe Burgess et al. (2015) study of district-level road construction inKenya, allows us to interpret the district ethnic match coefficient asthe effect of being born in a district with an ethnic connection to the
14Our analyses assume that the person attended primary school in his/her districtof birth and that the person’s admission to secondary schooling is affected by his/herdistrict of origin. As in our other analyses, we use a two year lag in accounting forthe president under whom individuals attended school. The results are robust tochanges in this lag.
18 Kramon and Posner
president. Consistent with our findings using the DHS data, we findthat being born in a district with such a connection is associated withan increase in a child’s primary schooling of 0.22 years and an increasein the probability of completing primary school of 1.8 percentage points(columns 7–8, Table 2). We find no statistically significant effects onsecondary schooling using these data, however (columns 7–8, Table 3).
3.3 Narrowing the Window of the Analysis
As an additional, and particularly stringent, test, we narrow the windowof our analysis to the period immediately before and after the politicaltransitions from President Kenyatta to President Moi and from PresidentMoi to President Kibaki. If the patterns described thus far are reallydue to presidents favoring their ethnic kin, then we would expect tosee differences in the educational attainment of Kikuyu and Kalenjinchildren in the years immediately preceding and following these politicaltransitions. We should see the educational attainment of Kalenjinchildren improve after Moi comes to power and decline after Kibakitakes over, and we should see the educational attainment of Kikuyuchildren drop when Moi takes office and then begin to rise again underKibaki. To test whether this is the case, we narrow our sample to includeonly those individuals who would have started or finished primary orsecondary school in the three years immediately before or after the twopolitical transitions (subject to the two year lag).15 We code respondentsas being an ethnic match with the president based on the identity of thepresident when respondents were 6 or 14 years of age — the years theyare likely to have started primary or secondary school, respectively. Forthe purposes of estimating the impact of having a coethinc presidenton school completion, we identify the year in which our presidentialethnic match variable switches from indicating a majority of primaryor secondary school-age years under one president to a majority underthe other. We then constrain the sample to include only the final threecohorts who would have spent a majority of their primary school-aged
15Kenyatta died in August 1978, so we code Moi’s first year in office as 1979.Kibaki won the 2002 election but did not take office until 2003. So we code his firstyear in office as 2003.

Ethnic Favoritism in Education in Kenya 19
years under Kenyatta (Moi) and the first three cohorts who would havespent a majority of their primary school-aged years under Moi (Kibaki).
Table 4 presents the results for the Kenyatta-Moi transition. Col-umn 1 presents the main results, with different outcomes presentedin Panels A–D. We find that, even among children who would havestarted or finished their schooling during this narrow time windowaround the Kenyatta-Moi transition, an ethnic match with the presidentsignificantly increases the probability of completing primary school andattending secondary school.16
We also conduct a set of placebo tests. In a first set of tests,we replicate our analyses while “incorrectly” coding the Kenyatta-Moitransition as having occurred in 1976, three years before the de factotransition. In a second set of tests, we “incorrectly” code the transitionas having taken place in 1982, three years after the de facto transition. Ifour main analyses are picking up real changes in educational attainmentthat result from having a coethnic in power, we should not find thatour incorrectly coded ethnic match variables predict school attendanceor completion. As the results in columns 2 and 3 demonstrate, they donot. Indeed, in the case of primary school completion (our strongestfinding in this part of our analysis), the estimated effect of having acoethnic president is significant and negative if we “incorrectly” code theKenyatta-Moi transition as having taken place three years later than itactually occurred.
In Table 5, we replicate these analyses for the Moi-Kibaki transition.Given that the most recent available DHS is from 2008–2009 and thatindividuals had to be at least 15 years old to have been included in the2008–2009 DHS sample, we have no observations of individuals whostarted primary school after Kibaki came to power. We therefore arenot able to examine primary school attendance in these analyses. Wealso have too few observations of individuals who would have completedprimary school or attended or completed secondary school in three yearsbefore and after 2005 to carry out the second placebo test. We can,however, estimate the other outcomes of interest for the Moi-Kibaki
16The results for primary school attendance, while substantively meaningful, falljust below traditional levels of statistical significance (at p < 0.2).

20 Kramon and Posner
Table 4: Educational attainment around the Kenyatta-Moi transition.
(1) (2) (3)Main analysis Placebo test Placebo test
Panel A: Attendance three Attendance three Attendance threeprimary years before and years before and years before andattendance after transition after 1976 and after 1982
Presidential ethnic 0.015 0.010 −0.003match at age 6 (0.009) (0.011) (0.005)
Observations 10,968 9,745 9,085
Panel B: Completion three Completion three Completion threeprimary years before and years before and years before andcompletion after transition after 1976 and after 1982
Presidential ethnic 0.025∗∗∗ 0.010 −0.015∗
match (primary years) (0.009) (0.015) (0.009)Observations 8,159 8,911 8,782
Panel C: Attendance three Attendance three Attendance threesecondary years before and years before and years before andattendance after transition after 1976 and after 1982
Presidential ethnic 0.020∗ 0.010 −0.002match at age 14 (0.012) (0.020) (0.010)
Observations 8,083 7,718 8,771
Panel D: Completion three Completion three Completion threesecondary years before and years before and years before andcompletion after transition after 1976 and after 1982
Presidential ethnic −0.006 −0.007 0.034match (secondary years) (0.028) (0.039) (0.022)
Observations 2,545 1,877 2,954
Each model includes age cohort fixed effects, ethnic group fixed effects, and the covariatesincluded in Tables 2 and 3. Panel A, column 1 includes only those individuals who wouldhave started school during the final three years of the Kenyatta era and the first threeyears of the Moi era. Panel B, column 1 includes the last three cohorts with a majorityof their primary school-age years under Kenyatta and the first three with a majority ofprimary school-age years under Moi. Panel B also only includes those who attended anyprimary school. Panel C, column 1 includes only individuals who would have started sec-ondary school during the final three years of the Kenyatta era and the first three years ofthe Moi era. Panel D, column 1 includes the last three cohorts with a majority of theirsecondary school-age years under Kenyatta and the first three with a majority of their sec-ondary school-age years under Moi. Panel D also only includes those who attended at leastsome secondary school. Robust standard errors clustered by ethnic-group-year-of-birth inparentheses. ∗∗∗p < 0.01, ∗∗p < 0.05, ∗p < 0.1.

Ethnic Favoritism in Education in Kenya 21
Table 5: Educational attainment around the Moi-Kibaki transition.
(1) (2)Main analysis Placebo test
Panel A: Completion three Completion threeprimary completion years before and years before and
after transition after 1999
Presidential ethnic 0.078∗∗∗ 0.008match at age 6 (0.028) (0.030)
Observations 3,091 4,471
Panel B: Attendance three Attendance threesecondary attendance years before and years before and
after transition after 1999
Presidential ethnic 0.012 0.001match (primary years) (0.038) (0.022)
Observations 4,471 6,540
Panel C: Completion three Completion threeprimary completion years before and years before and
after transition after 1999
Presidential ethnic 0.183∗∗∗ −0.166∗∗∗
match at age 14 (0.036) (0.021)Observations 1,663 2,107
Each model includes age cohort fixed effects, ethnic group fixed effects, and the covariatesincluded in Tables 2 and 3. Panel A, column 1 includes the last three cohorts with themajority of their primary school years under Moi and the first three with the majority underKibaki (with no lag). Panel A also includes only those who attended at least some primaryschool. Panel B, column 1 includes only individuals who would have started secondaryschool during the final three years of the Moi era and the first three years of the Kibaki era.Panel C, column 1 includes the last three cohorts with a majority of their secondary school-age years under Moi and the first three with a majority of their secondary school-age yearsunder Kibaki. Panel C also only includes those who attended at least some secondary school.Robust standard errors clustered by ethnic-group-year-of-birth in parentheses. ∗∗∗p < 0.01,∗∗p < 0.05, ∗p < 0.1.
transition using this approach. We find strong effects on primary andsecondary completion in column 1 and null or significant negative effectsfor the placebo tests in column 2. The fact that our main results holdup in these analyses for both transitions underscores the robustness ofour findings.

22 Kramon and Posner
3.4 Narrowing (and Broadening) the Definition of theEthnic Group
In generating our presidential ethnic match variable, we followed stan-dard practice in the literature and matched survey respondents andpresidents based on the ethnic categories used in the DHS (which, inturn, adopted the standard ethnic categories used in the Kenyan cen-sus). Thus, Presidents Kenyatta and Kibaki were coded as Kikuyuand President Moi was coded as Kalenjin. However, Kenyatta andKibaki were each from different Kikuyu districts, Kiambu and Nyeri,each with its own distinct client networks, clan identities, and politicalallegiances (Throup and Hornsby, 1998). And while Moi was indeeda Kalenjin, he came from a particular sub-tribe of that larger umbrellacategory, the Tugen, centered in Baringo district. So while it is reason-able to investigate whether Kenyatta and Kibaki favored the Kikuyuand whether Moi favored the Kalenjin — these, after all, are the broad,politically meaningful units to which most Kenyans expected to see re-sources channeled by these presidents — it is also reasonable to wonderwhether the real favoritism might have been toward each president’ssub-group.
To test this intuition, we return to the census data and conductanalyses in which we interact the district ethnic match variable withdummy variables indicating birth in each president’s home district:Kiambu for Kenyatta, Baringo for Moi, and Nyeri for Kibaki. We focuson the census data because the sample size is large enough to provide thestatistical power required to determine whether families living in eachpresident’s home district benefited disproportionately from presidentialethnic favoritism in the education realm. In the DHS sample, there aretoo few individuals from each of these districts to carry out this test.
Columns 1 and 2 of Table 6 present these results for our mainoutcomes of interest: years of primary and secondary schooling. Takingprimary schooling outcomes first, we find that the positive effect onschooling attainment of living in a district dominated by the president’scoethnics is magnified considerably if we look at the presidents’ ownhome districts. Living not just in a Kikuyu-dominated district butin Kiambu (during Kenyatta’s presidency) or Nyeri (during Kibaki’spresidency) doubles and triples, respectively, the effect for Kikuyuchildren of having a Kikuyu in the statehouse. This home district effectis even greater under Moi. During the Moi presidency, children living

Ethnic Favoritism in Education in Kenya 23
Tab
le6:
Narrowingan
dbroade
ning
thede
finitionof
theethn
icgrou
p.
(1)
(2)
(3)
(4)
(5)
(6)
Primary
Second
ary
Primary
Second
ary
Primary
Second
ary
years
years
years
years
years
years
(cen
sus)
(cen
sus)
(DHS)
(DHS)
(DHS)
(DHS)
Districtethn
icmatch
0.156∗∗
−0.002
(0.052)
(0.037)
Districtethn
icmatch
∗ Kiambu
0.159∗∗
−0.122∗∗
(0.061)
(0.051)
Districtethn
icmatch
∗ Baringo
0.615∗∗
∗0.440∗∗
∗
(0.115)
(0.104)
Districtethn
icmatch
∗ Nyeri
0.293∗∗
0.111
(0.120)
(0.157)
Preside
ntiale
thnicmatch
0.365∗∗
∗0.116∗∗
∗0.362∗∗
∗0.116∗∗
∗
(0.024)
(0.035)
(0.029)
(0.035)
Ethniccoalitionpa
rtne
rmatch
0.106∗∗
∗0.006
0.018
−0.000
(0.032)
(0.042)
(0.051)
(0.045)
Ethniccoalitionpa
rtne
rmatch
∗Moi
era
0.515∗∗
0.019
(0.188)
(0.040)
Observation
s3,236,101
3,402,305
47,275
46,042
47,275
46,042
R-squ
ared
0.359
0.117
0.287
0.094
0.287
0.094
Not
e:Allmod
elsestimated
usingOLS.
Colum
ns1an
d2includ
edistrict
andagecoho
rt(year-of-birth)fix
edeff
ects
andstan
dard
errors
clusteredby
district.Colum
ns3-6includ
eethn
icgrou
pfix
edeff
ects,agecoho
rt(year-of-birth)fix
edeff
ects,an
dcontrols
forchild
hood
inruralarea,gend
er,an
drelig
ion,
withrobu
ststan
dard
errors
clusteredat
ethn
icgrou
p-presidentlevel.
Colum
ns5-6includ
eadu
mmyfor
theMoi
era.
∗∗∗ p
<0.01,∗∗
p<
0.05,∗ p
<0.1.

24 Kramon and Posner
in Moi’s home district of Baringo (largely members of Moi’s Tugen sub-group) received an average of 0.8 years of additional primary schooling —a fivefold increase over children living in other Kalenjin districts.
Our examination of secondary schooling also generates interestingresults. In the census-based analyses presented earlier, we found noeffect on secondary schooling outcomes of living in a district dominatedby the president’s coethnics. However, when we narrow the focus to thepresident’s own home district, we do find significant effects — but onlyunder Moi. Specifically, we find that even though Kalenjin in general didnot benefit in terms of their secondary schooling attainment, Kalenjinliving in Barengo received an additional 0.4 years of secondary schoolingduring the Moi years. Kikuyu living in Nyeri or Kiambu, meanwhile,either received no additional bump from being in the president’s homedistrict or, as in the case of the latter, appear to have acquired feweryears of secondary schooling than other Kikuyu children. One reasonfor this difference (as well as the much greater home district effects forMoi’s sub-group in the primary schooling analyses) may be that thebroader Kalenjin ethnic identity is a relatively recent construction thatresulted from coalition-building among linguistically similar and smallerethnic groups living in the Rift Valley Province (Lynch, 2011). As aresult, the cultural difference between Moi’s group, the Tugen, and theother Kalenjin sub-groups may be more politically meaningful than isthe difference between the Kikuyu clans.
“Ethnic” categories that extend beyond the ethnic group — oftento include other groups from the same region or from the same broadlanguage family — may also be relevant for understanding patterns ofresource allocation (Ahlerup and Isaksson, 2015). While “Kikuyu” and“Kalenjin” may be meaningful ethnographic classifications, membersof these communities tend to coalesce with other groups in politics(Hornsby, 2012). The Kikuyu have historically joined forces with theEmbu and Meru in an ethnic political coalition called GEMA (forthe Gikuyu-Embu-Meru Association, a cultural/political organizationformed after independence to promote the interests of the Kikuyu andassociated communities). The Kalenjin, meanwhile, have historicallybanded together with the Masaii, Turkana and Samburu in a groupdubbed KAMATUSA (Kalenjin, Maasai, Turkana, Samburu). Hence,it is reasonable to inquire whether the favoritism we have documented

Ethnic Favoritism in Education in Kenya 25
thus far might mask a broader pattern of favoritism toward the broaderGEMA or KAMATUSA coalitions.
We investigate this possibility in columns 3 and 4 of Table 6 byadding an ethnic coalition partner match variable that captures whetherthe respondent was Embu or Meru under Kenyatta/Kibaki or Maasai,Turkana, or Samburu under Moi, and including this variable alongsidepresidential ethnic match.17 The significant coefficient on this variablein column 3 indicates that ethnic coalition partners are, in fact, favoredalongside the president’s more narrowly defined coethnics, at least withrespect to primary schooling. We find no evidence, however, that ethnicfavoritism in secondary schooling extends to the broader ethnic coalition(see column 4).
If we break down the primary schooling results by presidentialregime, as we do in column 5 through the addition of an interactionterm, we see that all of ethnic coalition effect is coming from the Moiera (the ethnic coalition partner match coefficient is now zero). Whereasthe children of Moi’s Masai, Turkana and Samburu coalition partnersbenefit from his tenure, the children of Kenyatta and Kibaki’s Meruand Embu partners would appear not to. A plausible explanation isthat because President Moi was from a smaller ethnic group, he felt theneed to redefine the boundaries of his support coalition to include otherethnic communities. Presidents Kenyatta and Kibaki, on the otherhand, were members of Kenya’s largest ethnic group and felt no suchneed to expand their ethnic coalition. These results validate Posner’s(2004) argument that the desire to build viable political coalitions, notsimply ethnographic similarity, is what drives patterns of redistributionin settings like Kenya.
3.5 Is This Just Catch-Up?
A potential concern with the findings we have presented thus far is thatthey stem not from ethnic favoritism but from the fact that the countrywe study happens to be one in which a president from an educationallyadvantaged group was replaced by a president from an educationallydisadvantaged group. In such a situation, the increase in schoolingof the less advantaged group in the second period could be simply due
17Sample sizes are large enough when we pool members of the different groups tobe able to return to the DHS data for these analyses.

26 Kramon and Posner
to the natural process of catch-up, and this effect would be magnified ifthe educational attainment of the more advantaged group had reachedan upper bound by the time of the transition.
Although these facts might seem to describe the Kenyan case, fourpieces of evidence point against such an alternative account. First,although Kikuyu children had come close to reaching the ceiling onprimary schooling by the time of the Kenyatta-Moi transition, theywere nowhere near that ceiling with respect to secondary schooling.Thus the fact that our findings hold for both primary and secondaryschooling is inconsistent with this explanation. Second, the results ofthe analysis in which we narrow the time window, in which we find asignificant difference in the educational achievements of children fromdifferent ethnic groups in the three years immediately before and aftereach presidential transition, suggest that catch-up by disadvantagedgroups (a long-term process) is unlikely to be responsible for our findings.Furthermore, the fact that the results are similarly strong across theboth political transitions — the second being one from a president froma less-advantaged group to a president from a more advantaged group —is inconsistent with the catch-up thesis. Finally, the broad process ofcatch-up story would imply that we would find a stronger effect underPresident Moi than under President Kenyatta — especially in the areaof primary education. While we do find that coethnics of PresidentMoi acquired more years of secondary schooling under his tenure, wefind the opposite with respect to primary schooling: where we finda difference in the degree of favoritism across political regimes (onlyin the area of primary school attendance), the advantage of having acoethnic president is less under Moi than under the other presidents (seeAppendix E). So we think it is not likely that our results are generatedby the peculiarities of the Kenyan case.
3.6 Beyond the President
The analyses discussed thus far focus on the role of the president infavoring his ethnic kin in the education sphere. In this respect, ourcontribution is similar to that of other studies that present findingsabout presidential ethnic favoritism in other sectors. Our analysesdraw on significantly more data and involve a much larger number ofspecifications, but the basic relationships being investigated are similar.

Ethnic Favoritism in Education in Kenya 27
However, a novel extension is to examine the usually overlooked, but inprinciple equally relevant, effect of a child’s ethnic connection with theperson who controls the ministry of education.18
The idea that ministers will favor their ethnic kin has broad currencyamong students of African affairs. Scholars such as Joseph (1987), vande Walle (2007), and Arriola (2009) emphasize the extent to whichpresidents keep themselves in power by co-opting other powerful elites —usually elites who control ethnic or regional support bases that aredistinct from their own — by granting them access to portions of thestate (what Joseph, following Weber, calls prebends) in exchange fortheir loyalty and that of their followers. In practice, this is done byallocating cabinet positions with the understanding that the holdersof those positions will use them to enrich themselves and shore uptheir own regional or ethnic support bases, and then deliver votes tothe president from those bases when called upon. To the extent thatsuch a system operates in Kenya, we would expect to see coethnicsnot just of the president but also of the minister of education receivedisproportionate benefits in the education sector — even when thepresident and minister are from different ethnic groups.
To test for evidence of such a prebendal strategy, we identify andcode the ethnicity of every minister who has served in the Kenyancabinet since independence and then test whether children who sharedan ethnic group membership with the minister of education duringtheir school years completed more years of schooling than other Kenyanchildren. As Table 7 makes clear, education ministers usually are fromdifferent ethnic groups than the president. They also tend to holdtheir posts for relatively short periods. We therefore estimate theimpact on educational attainment of the number of years during whicha coethnic served as the minister of education during a person’s primaryand secondary school-aged years, rather than whether a person had acoethnic as education minister during the majority of his or her primary
18Burgess et al. (2015) are an exception to the rule that analyses of favoritismfocus solely on the president. They explore the impact on road spending and pavedroad construction of having a coethnic minister of public works or controlling otherimportant cabinet portfolios, and find no effect. They do, however, find an effect ofhaving a coethnic vice president.

28 Kramon and Posner
Table 7: Ethnicity of the minister of education.
President’s Educationethnic minister’s
Year(s) President Regime group ethnic group1963 Kenyatta Multiparty Kikuyu Luo1964–65 Kenyatta Multiparty Kikuyu Kikuyu1966–68 Kenyatta Multiparty Kikuyu Mbeere1969 Kenyatta Single Party Kikuyu Kikuyu1970–73 Kenyatta Single Party Kikuyu Kalenjin1974–76 Kenyatta Single Party Kikuyu Kisii1977–79 Kenyatta Single Party Kikuyu/Kalenjin Kalenjin1980 Moi Single Party Kalenjin Luhya1981–85 Moi Single Party Kalenjin Kalenjin1986–91 Moi Single Party Kalenjin Luo1992–97 Moi Multiparty Kalenjin Kikuyu1998–2000 Moi Multiparty Kalenjin Kamba2001–02 Moi Multiparty Kalenjin Kalenjin2003–06 Kibaki Multiparty Kikuyu Masai/Kikuyu
or secondary schooling.19 Panel A of Table 8 presents the results ofour analysis. Controlling for our usual set of covariates as well as anindividual’s ethnic match with the president (which we continue to findto be associated with improvements in both primary and secondaryschooling outcomes), we find that having a minister of education fromone’s ethnic group in office is associated with 0.06 more years of primaryand 0.02 more years of secondary schooling for every year in whichthe coethnic holds that office (columns 1 and 4). This effect is slightlygreater than, though not statistically different from, that of having acoethnic as president, corresponding to a roughly 7 percent increasein a child’s primary school years and a 9 percent increase in a child’ssecondary school years if the minister of education is a coethnic duringthe whole of a child’s school-aged years.20 We also find evidence that the
19Note that this strategy biases against finding an effect of having a coethnicserving as the minister of education, as we are including cases where the impact oneducational attainment is likely to be quite small.
20We cannot entirely rule out the possibility that the appointment of a member ofa particular ethnic group as the minister of education is endogenous to that group’s

Ethnic Favoritism in Education in Kenya 29
Tab
le8:
Ministerial
ethn
icfavo
ritism
.
(1)
(2)
(3)
(4)
(5)
(6)
Primary
Primary
Primary
Second
ary
Second
ary
Second
ary
Pan
elA
years
attend
ance
completion
years
attend
ance
completion
Presidentiale
thnicmatch
0.36
0∗∗
∗0.056
∗∗∗
0.027∗∗
∗
(primaryyears)
(0.025
)(0.008
)(0.004)
Edu
cation
ministerethn
ic0.05
6∗∗
∗0.00
4∗
0.008∗∗
∗
match
years(primaryyears)
(0.017
)(0.002
)(0.002)
Presidentiale
thnic
0.122∗∗
∗0.034∗∗
∗0.012
match
(secon
dary
years)
(0.036)
(0.011)
(0.008
)Edu
cation
ministerethn
ic0.022∗
0.005∗
0.004
match
years(secon
dary
years)
(0.011)
(0.002)
(0.003
)Observation
s49
,171
49,171
49,171
46,042
47,275
47,275
R-squ
ared
0.29
70.249
0.129
0.093
0.085
0.072
(Con
tinu
ed)

30 Kramon and Posner
Tab
le8:
(Con
tinu
ed)
(1)
(2)
(3)
(4)
(5)
Primary
Primary
Primary
Primary
Primary
Pan
elB
years
years
years
years
years
Presidentiale
thnicmatch
0.335∗∗
∗0.411∗∗
∗0.341∗
∗∗0.358
∗∗∗
0.487∗∗
∗
(0.045)
(0.037)
(0.080
)(0.027
)(0.051)
Perman
entsecretaryethn
icmatch
0.001
(0.011)
Healthministerethn
icmatch
0.035∗∗
(0.015)
Agriculturalm
inisterethn
icmatch
0.063
(0.066
)Works
ministerethn
icmatch
0.015
(0.016
)Finan
ceministerethn
icmatch
−0.041∗∗
(0.017)
Observation
s47,696
46,467
42,959
42,852
43,405
R-squ
ared
0.300
0.303
0.323
0.303
0.305
Rob
uststan
dard
errors,clusteredat
ethn
icgrou
p-presidentlevel.
Allmod
elsinclud
eethn
icgrou
pfix
edeff
ects,agecoho
rt(year-of-birth)
fixed
effects,an
dcontrols
forchild
hood
inruralarea,gend
er,an
drelig
ion.
Allmod
elsareestimated
usingOLS.
∗∗∗ p
<0.01,∗∗
p<
0.05,
∗ p<
0.1.

Ethnic Favoritism in Education in Kenya 31
impact of having a coethnic minister of education extends to primaryschool attendance and completion (columns 2 and 3) and secondaryschool attendance (column 5), but not to secondary school completion.
Although ministers in Kenya have significant discretion over howtheir ministries’ resources are allocated, day-to-day administration is inthe hands of the permanent secretary, almost always a career civil servantappointed by the president. The salient ethnic match might thereforebe with the permanent secretary. To test this hypothesis, we collectedinformation on the ethnic backgrounds of all permanent secretariesin the ministry of education since independence and calculated, foreach respondent, the number of primary school-age years in which acoethnic occupied that position. Although we find no effect (see Table 8,panel B, column 1), we cannot rule out that this is because permanentsecretaries are operating as instruments of the president, keeping tabson ministers who are not wholly under their control (Leonard, 1991;Thies, 2001). Indeed, between 1963 and 2005, there is a nearly perfectcorrelation between the ethnic background of the president and thatof the permanent secretary of education.21 So once we control forcoethnicity with the president, we have no ability to detect an effect ofhaving a coethnic permanent secretary.
The impact of having a coethnic in the cabinet may also extendbeyond the minister of education. Educational attainment is a productnot just of books, desks, and teachers but also of a student’s healthand nutrition, her family’s income, and the community’s access tobasic infrastructure such as roads, electricity, and water. It followsthat communal ties to the ministers who control these other outputsmay also matter for educational attainment. Columns 2–5 of panel Bexamine this possibility by analyzing the impact on primary schooling ofcoethnicity with the ministers of health, agriculture, works, and finance
need to catch up educationally, and hence an indicator of the government’s decisionto try to improve educational outcomes among that group’s children rather thanthe cause of that improvement. However, given the way cabinet appointments aretypically made in Kenya (as political payoffs), the frequency of cabinet reshufflesrevealed in Table 7, and the fact that ministers often come from educationallyadvanced ethnic groups, we think this is unlikely.
21The only period in which a permanent secretary of education did not share theethnic background of the president was between 1979 and 1986, when, for all but oneyear, the minister of education himself was a coethnic of the president (and thereforepresumably did not need to be monitored).

32 Kramon and Posner
during a child’s primary school-age years. We find that only coethnicitywith the minister of health is significantly associated with improvementsin primary schooling outcomes. Sharing an ethnic link with the ministerof finance is actually negatively associated with primary schoolingoutcomes.
Taken together, these findings suggest that, while an individual’sethnic connection with the president matters, so too does his or herethnic connection with the minister in charge of allocating resourcesin the area in question (and sometimes in related areas as well). Inkeeping with the logic of prebendalism, ministers do, in fact, seem tohave significant discretion in affecting the welfare of their ethnic kin —even when those kin are of a different ethnic group than the president.
3.7 The Impact of Regime Type
Our estimation strategy takes advantage of the fact that the ethnicaffiliations of Kenya’s presidents have varied over time. Another salientfeature of Kenya’s political landscape that has varied over time is thenature of its political institutions. Kenya began its post-independencelife in 1963 as a multiparty regime but, by 1969, had become a de factoone party state. This single party era continued until the end of 1992,when popular pressure forced President Moi to reinstate multipartyelections. These shifts in formal political institutions, which occurredunder both President Kenyatta and President Moi, make it possibleto explore whether the patterns of ethnic favoritism identified thus farare affected by changes in regime type. We address this question byintroducing a variable (multiparty years) that captures the number of anindividual’s primary or secondary school years that took place under amultiparty political system (1964–1969 or 1993–2008), and then testingto see how the ethnic favoritism of the president and the educationminister is affected by this measure.
We interact the multiparty years variable with the presidential ethnicmatch and education minister ethnic match years variables. The resultsare presented in Table 9. In contrast to Burgess et al. (2015), whofind that presidential ethnic favoritism in the allocation of roads inKenya is strongly affected by regime type, but in keeping with thecross-national findings of Franck and Rainer (2012) and De Luca et al.(2015), we find no such evidence with respect to primary schooling and

Ethnic Favoritism in Education in Kenya 33
Table 9: The impact of regime type.
(1) (2) (3) (4)Primary Primary Secondary Secondaryyears years years years
Multiparty years 0.505∗∗∗ 0.509∗∗∗ −0.384∗∗∗ −0.387∗∗∗
(0.040) (0.037) (0.082) (0.090)Presidential ethnic match 0.319∗∗∗ 0.355∗∗∗ 0.137∗∗∗ 0.132∗∗∗
(0.061) (0.027) (0.033) (0.036)Presidential ethnic 0.028 −0.020∗
match∗multiparty years (0.029) (0.011)Education minister 0.067∗∗ 0.005ethnic match years (0.027) (0.010)
Ed minister ethnic match −0.006 0.010∗
years∗multiparty years (0.006) (0.005)Observations 47,275 46,419 46,042 46,042R-squared 0.270 0.273 0.093 0.093
Multiparty years are defined as years of schooling prior to 1969 or after 2002. Robuststandard errors clustered by ethnic group-president in parentheses. Each model includesethnic group fixed effects and controls for gender, religion, and childhood in a rural area.∗∗∗p < 0.01, ∗∗p < 0.05, ∗p < 0.1.
a weakly negative effect on secondary schooling — note the coefficientestimates on the interaction terms in columns 1 and 3. Where we dofind (somewhat weak) evidence for a regime effect is with respect to theimpact of having a coethnic minister of education, which is associatedwith a modest increase in the number of years of secondary schoolingin a democratic setting (see column 4). The divergence between ourfindings and those of Burgess et al. (2015) underscores that patternsof distributive politics may vary substantially across outcomes, evenwithin the same country (Kramon and Posner, 2013).22
22Note that what changed in 1992 was the formal ability of multiple parties to com-pete for political power, not the degree of de facto competition in the political sphere.Most accounts of Kenyan politics suggest that real change in the competitiveness ofthe political system (and the emergence of something closer to real “democracy”) didnot occur until 1997, when Moi ran for re-election in a more open multiparty contest.Hence, in Appendix F, we test the robustness of the results reported in Table 9 to apair of alternative measures of democracy: one using 1998 as the cut-off (the electionswere not held until the very end of 1997); the other using the average POLITY scoreduring a child’s primary school-age years. The null findings on primary school years

34 Kramon and Posner
In our earlier discussion of coalition politics, we speculated that theextension of primary schooling benefits to President Moi’s broader ethniccoalition but not to President Kenyatta or Kibaki’s stemmed from Moi’smembership in a smaller ethnic group, which created incentives for himto expand his support coalition beyond his more narrowly defined kincommunity. These incentives may be especially strong in the multipartyera, since the size of a leader’s coalition is more important when he needsit to win a competitive election. Figure 1, which plots the marginaleffects on primary schooling years, primary attendance, and primarycompletion of being a member of the president’s broad ethnic coalitionin the Kenyatta/Kibaki and Moi eras during both multiparty and single-party periods, provides evidence that this is indeed the case.23 Forchildren whose primary school-age years took place completely undersingle-party rule (for whom the number of multiparty years is zero) beinga member of the president’s broader ethnic coalition is not associatedwith any change these outcomes. However, for children whose primaryschool years took place completely under multiparty rule (for whomthe number of multiparty years is seven or eight), being a member ofthe president’s broader ethnic coalition matters considerably — anddifferently under Moi and Kenyatta/Kibaki. Under Moi, membership inthe broader ethnic coalition is associated with a significant increase inyears of primary schooling, primary attendance, and primary completion,whereas under Kenyatta/Kibaki it is associated with a decrease. Theseresults suggest that the findings reported earlier about the impact ofbeing a member of the president’s broader ethnic coalition were drivennot just by the president (and, plausibly, the size of his ethnic group)but also by the nature of the political institutions under which he wasoperating. The results underscore that regime type may affect notjust the degree of ethnic favoritism — a topic also explored by otherresearchers — but also the ways in which the groups to which thatfavoritism is targeted are defined by political actors. For leaders fromsmall ethnic communities, multiparty competition creates incentives toredefine the boundaries of the ethnic community so as to make it moreencompassing.
are unchanged in these two alternative specifications, and the weak secondary schoolfindings on favoritism by the education minister disappear.
23There was, of course, no single-party era under Kibaki.

Ethnic Favoritism in Education in Kenya 35
Figure 1: Marginal Effects of a Coalition Partner Match Under Kenyatta, Kibakiand Moi During Multiparty and Single-Party Rule.

36 Kramon and Posner
4 Why Does Having a Coethnic in a Position of Political PowerMatter for Educational Attainment?
What is the precise mechanism that links schooling outcomes withhaving a coethnic occupying the presidency or serving as the minister ofeducation? In the case of favoritism with respect to road building or theprovision of other infrastructure, the linkage is fairly straightforwardsince the outcome in question is largely a product of government allo-cation decisions. However in the realm of education, the link betweenpolitical actors’ decisions and observed outcomes is more complex andmultifaceted. In the discussion that follows, we distinguish betweenthree broad channels. The first emphasizes the greater supply of edu-cational inputs to the president’s or minister of education’s coethnics.The second emphasizes the indirect effect on educational outcomes offavoritism by the president or other ministers in other domains. Thethird emphasizes the ways in which having a coethnic president orminister of education may affect the demand for education from amongthe officeholder’s kin.
4.1 The Supply of Educational Inputs
With respect to the supply side, the most straightforward mechanismis preferential access to educational inputs such as schools, teachers,desks, books, or other materials. These inputs may be channeleddirectly to coethnics through the allocation of government funds or theymay come indirectly through the president’s or minister’s donations toHarambee (self-help) groups. Such groups have played a central role infundraising for educational infrastructure in Kenya and often receivesubstantial contributions from senior government officials (Hornsby,2012; Widner, 1993). To the extent that presidents and ministers areable (and expected) to make large donations to Harambee campaigns,their coethnics may benefit disproportionately.
Unfortunately, comprehensive data on budgetary allocations for ed-ucational inputs or records of Harambee contributions are not available.To examine the evidence in favor of this mechanism, we therefore relyon data gathered from District Development Reports on the numberof primary schools in each district at five-year intervals between 1974and 2001 — a reasonably proxy for more general patterns of education

Ethnic Favoritism in Education in Kenya 37
spending. We combine this information with population data fromthe most proximate Kenyan census to calculate the number of primaryschools in each district per 1,000 residents for each five-year period. Wethen create a district ethnic match variable that captures whether (basedon district-level ethnic demographic data from each Kenyan census heldsince 1969) the majority of the residents of the district were of the sameethnic group as the president at the time the schools were counted,and we regress the number of primary schools per 1,000 residents onthis indicator measure. We include year fixed effects to control foryear-specific shocks that might impact school construction, district fixedeffects to insure that our comparisons are picking up changes over timewithin districts, and we cluster standard errors at the district level. Ourtotal sample for the analysis is 232 district-years.
As we show in Table 10, districts in which the majority of residentsshare an ethnic connection with the president have about 0.17 moreschools per 1,000 residents. This effect corresponds to about 45 addi-tional primary schools in the median district — roughly a 20 percentincrease. These results suggest that the targeting of education inputsby presidents to their coethnics is certainly part of the story.
Further evidence in favor of the supply mechanism is providedin Figure 1, discussed earlier, where we showed that ethnic coalitionpartners were favored more heavily by Moi in the democratic era. This is
Table 10: Ethnic favoritism in primary school construction.
Primary schoolsper 1,000 residents
District ethnic match 0.172∗
(0.098)Constant 0.916∗∗∗
(0.116)Observations 232R-squared 0.458
Unit is the district-year. Dependent variable is the number of schools per 1,000 residents.District is coded as an ethnic match if the majority ethnic group shares an ethnicity withthe president. Model includes district and year fixed effects. Robust standard errors inparentheses, clustered at the district level. ∗∗∗p < 0.01, ∗∗p < 0.05, ∗p < 0.1.

38 Kramon and Posner
consistent with a supply mechanism for two reasons. First, we attributethe result to Moi’s need to build a larger coalition to contest multipartyelections, which suggests that favoritism is being driven by strategicallocations from the government. Second, it is highly unlikely thatmembers of Moi’s broader ethnic coalition would experience significantchanges in the demand for education following democratization. Demandmechanisms, which we discuss below, are therefore unlikely to explainwhy the beneficiaries of ethnic favoritism shift following the transitionto more democratic politics.
4.2 Indirect Effects on Non-Educational Inputs
Coethnic favoritism may also impact schooling outcomes indirectlythrough its effect on non-educational inputs that make it more likely thatchildren will stay in school. For example, having a coethnic presidentor cabinet minister may lead to improvements in health and nutrition(Franck and Rainer, 2012), which may improve pupil attendance andmake it more likely that children will progress up the educational ladder(Alderman et al., 2006; Martorell et al., 2010; Miguel and Kremer,2004). Or it may lead to increases in income among the president’s orminister’s coethnics, which may make it easier for parents to pay schoolfees, purchase school uniforms, or forego their children’s labor in thefamily’s farm or business.
We find mixed evidence for this indirect channel. On the one hand,we find in Table 8, panel B that having a coethnic minister of healthis associated with more an additional 0.04 years of primary schooling(or about an additional quarter of a year of primary schooling if thecoethnic occupies the health ministry during the whole of a child’sprimary school-age years). On the other hand, however, we find norelationship between primary schooling and having a coethnic controllingthe ministries of agriculture, works, or finance (the estimated impact ofhaving a coethnic minister of finance is, in fact, negative).
In addition, we find no evidence that having a coethnic presidentduring one’s childhood years is associated with better health or nutritionoutcomes. To test for this relationship, we employ information collectedin the DHS on female adult heights and infant survival rates, both ofwhich are highly correlated with health and nutrition during a child’s

Ethnic Favoritism in Education in Kenya 39
early years (Moradi, 2009; Silventoinen, 2003).24 Using a similar ethnicgroup fixed effect set-up to ours, Franck and Rainer (2012) find a strongrelationship between presidential coethnicity and infant survival in across-section of African countries. Our results, however, provide noevidence that Franck and Rainer’s general findings hold in Kenya.25
Nor do we find that the relationship holds when we examine femaleadult heights.26 As we show in Table 11, having a coethnic president
Table 11: General improvements in well-being?
(1) (2)Infant Female adultsurvival height (cms)
Presidential ethnic match at childbirth −0.090(0.066)
Number of ethnic match years age 0-4 0.025(0.072)
Observations 116,122 20,267
Models include ethnic group and year of birth fixed effects. All models include robuststandard errors, clustered at the ethnic group-president level. The infant survival modelincludes infant birth-year fixed effects, and controls for the gender of the infant, the birthorder and its square, whether the birth was a multiple birth (twin, triplet, and so on), andthe age of the mother and the age of the mother squared. Both ethnic match variablesare lagged two years. The results are the same without the lag. ∗∗∗p < 0.01, ∗∗p < 0.05,∗p < 0.1.
24To calculate group-specific infant mortality rates from the DHS data, we con-struct a dataset where the unit of observation is the live birth and where infantmortality is defined as death in the first twelve months of life. Using live births asthe unit of analysis takes advantage of the fact that DHS collects retrospective infor-mation about all live births to adult females in the household, as well as informationabout each child’s current mortality status (including the date of death, if applicable).Because each adult female household member reports multiple live childbirths, eachin different years, this strategy permits us to generate annual estimates of infantmortality with a sample size that greatly exceeds that of the DHS sample itself(hence the very high number of observations in our analysis).
25Neither, it happens, do Franck and Rainer (2012), who provide country-by-country breakdowns of their analysis and show that Kenya is one of several countriesthat do not exhibit this general trend.
26Our analysis includes ethnic group fixed effects to control for group-specificgenetic differences that might lead to cross-group variation in average heights.

40 Kramon and Posner
at the time of a child’s birth or during the child’s first four years oflife is not associated with either the likelihood that the child will diebefore reaching age one or, if she is a girl, her adult height.27 Theseresults cast doubt on the idea that presidents affect their coethnics’educational attainment indirectly via favoritism in other domains.
4.3 The Demand for Education
The president’s ethnicity might also matter because of its impact on thedemand for education. Education is a substantial, long-term investmentthat is made (or not) in view of its anticipated returns. A family’sethnic ties to the president or other high office holders may matter forthis calculation by affecting perceptions about future job opportunities(Barkan and Chege, 1989; Wrong, 2009) — especially in the publicsector, which, through the early 1990s, was the major source of formalemployment in Kenya. Indeed, survey evidence suggests that 80 percentof Kenyans perceive that a person’s ethnicity will affect his access topublic sector jobs (KIPPRA Research Team, 2012). Combined withresearch that shows that perceptions about future returns to schoolingare strongly associated with investments in schooling (Jensen, 2010), thispublic opinion data suggests the plausibility of the demand mechanism.
Since the public sector in Kenya has historically been dominated bymen (Suda, 2002), investments in education made in light of expectationsof benefitting from an ethnic tie should vary by gender. We can thereforeevaluate the demand mechanism by investigating whether the effect onschooling outcomes of having a coethnic president is stronger for boysthan for girls. We do this in the first six columns of Table 12, wherewe interact a dummy variable for whether the child was male withour dummy for presidential ethnic match. With the exception of oneoutcome, primary attendance (where we actually find modestly lowerlevels among boys), our results provide no support for this hypothesis.
27A potential weakness in this analysis is that if infant mortality coincides withmaternal mortality, we will not observe those cases of infant mortality in our data.Similarly, severe malnourishment in early childhood may lead not just to lower adultheight but also reduced life expectancy, in which case we will again not observesome cases in our sample. However, these missing observations would only inflateour estimates of ethnic favoritism if coethnics of the president are more likely toexperience maternal mortality or to have lower life expectancy, which we believe isunlikely.
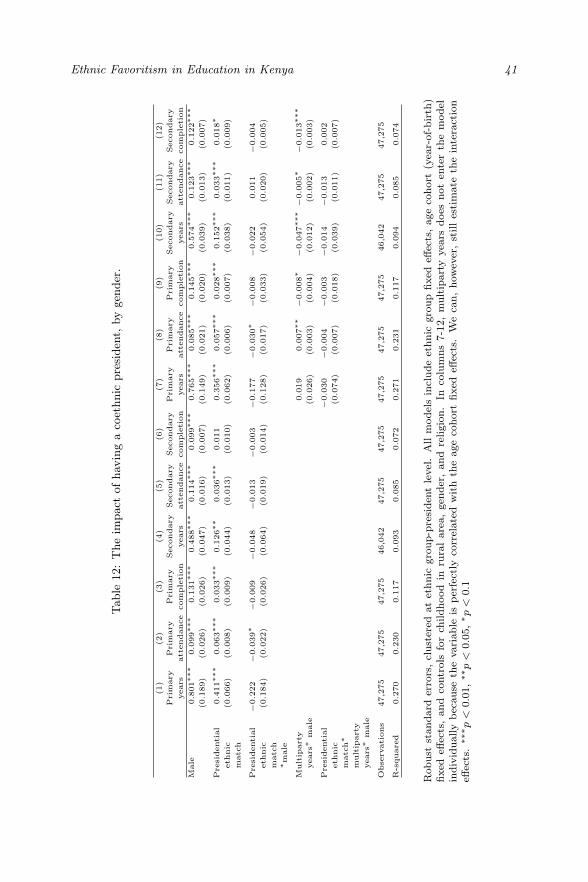
Ethnic Favoritism in Education in Kenya 41
Tab
le12:The
impa
ctof
having
acoethn
icpresident,
bygend
er.
(1)
(2)
(3)
(4)
(5)
(6)
(7)
(8)
(9)
(10)
(11)
(12)
Pri
mar
yPri
mar
yPri
mar
ySec
ondar
ySec
ondar
ySec
ondar
yPri
mar
yPri
mar
yPri
mar
ySec
ondar
ySec
ondar
ySec
ondar
yye
ars
atte
ndan
ceco
mple
tion
year
sat
tendan
ceco
mple
tion
year
sat
tendan
ceco
mple
tion
year
sat
tendan
ceco
mple
tion
Mal
e0.801∗∗
∗0.099∗∗
∗0.131∗∗
∗0.488∗∗
∗0.114∗∗
∗0.099∗∗
∗0.765∗∗
∗0.085∗∗
∗0.145∗∗
∗0.574∗∗
∗0.123∗∗
∗0.122∗∗
∗
(0.189)
(0.026)
(0.026)
(0.047)
(0.016)
(0.007)
(0.149)
(0.021)
(0.020)
(0.039)
(0.013)
(0.007)
Pre
siden
tial
ethnic
mat
ch
0.411∗∗
∗0.063∗∗
∗0.033∗∗
∗0.126∗∗
0.036∗∗
∗0.011
0.356∗∗
∗0.057∗∗
∗0.028∗∗
∗0.152∗∗
∗0.033∗∗
∗0.018∗
(0.066)
(0.008)
(0.009)
(0.044)
(0.013)
(0.010)
(0.062)
(0.006)
(0.007)
(0.038)
(0.011)
(0.009)
Pre
siden
tial
ethnic
mat
ch∗m
ale
−0.222
−0.039∗
−0.009
−0.048
−0.013
−0.003
−0.177
−0.030∗
−0.008
−0.022
0.011
−0.004
(0.184)
(0.022)
(0.026)
(0.064)
(0.019)
(0.014)
(0.128)
(0.017)
(0.033)
(0.054)
(0.020)
(0.005)
Mult
ipar
tyye
ars∗
mal
e0.019
0.007∗∗
−0.008∗
−0.047∗∗
∗−0.005∗
−0.013∗∗
∗
(0.026)
(0.003)
(0.004)
(0.012)
(0.002)
(0.003)
Pre
siden
tial
ethnic
mat
ch∗
mult
ipar
tyye
ars∗
mal
e
−0.030
−0.004
−0.003
−0.014
−0.013
0.002
(0.074)
(0.007)
(0.018)
(0.039)
(0.011)
(0.007)
Obse
rvat
ions
47,2
7547
,275
47,2
7546
,042
47,2
7547
,275
47,2
7547
,275
47,2
7546
,042
47,2
7547
,275
R-s
quar
ed0.270
0.230
0.117
0.093
0.085
0.072
0.271
0.231
0.117
0.094
0.085
0.074
Rob
uststan
dard
errors,clusteredat
ethn
icgrou
p-presidentlevel.
Allmod
elsinclud
eethn
icgrou
pfix
edeff
ects,agecoho
rt(year-of-birth)
fixed
effects,an
dcontrols
forchild
hood
inruralarea,gend
er,an
drelig
ion.
Incolumns
7-12,multipa
rtyyearsdo
esno
tenterthemod
elindividu
ally
becausethevariab
leis
perfectlycorrelated
withtheagecoho
rtfix
edeff
ects.Wecan,
however,still
estimatetheinteraction
effects.
∗∗∗ p
<0.01,∗∗
p<
0.05,∗ p
<0.1

42 Kramon and Posner
A second piece of evidence against the demand channel can befound in the results reported earlier in Table 3, which explored theimpact of a coethnic tie with the president on secondary schoolingoutcomes. Job opportunities are better for children who finish theirsecondary schooling than for those who do not. So if parents investin their children’s education so as to take advantage of a coethnic tiewith the person controlling the government, then we would expect tosee the strongest effects for secondary school completion. The fact thatwe find an effect of having a coethnic president on secondary schoolattendance but not on secondary school completion (see Table 3) is thusinconsistent with this story.
Our strong findings regarding the impact of having a coethnicminister of education can also not be explained by expectations aboutfuture job opportunities since it is unlikely that parents will think thatthe minister of education, whose predominant employees (teachers) arenot selected directly by the ministry, will have the significant discretionover hiring.28 The fact that we find no relationship between schoolingoutcomes and having a coethnic controlling the ministries of agricultureor works — two ministries that hire many workers without advanceddegrees — is also inconsistent with the demand thesis (see panel B ofTable 8).
Finally, if parents condition their investments in their children’sschooling on the likelihood that a coethnic leader will still be in powerwhen their children are ready to enter the job market, then it is reason-able to assume that they will be more likely to do this if they think theleader will remain in power for some time. Such a belief is plausibly morelikely in a non-democratic setting, since leaders in autocracies tend tostay in office longer than leaders in democracies (Chiozza and Goemans,2004; Kono and Montinola, 2009; Marinov, 2005). Since male childrenare more likely to be candidates for jobs than female children, we mighttherefore expect to see a negative sign on the triple-interaction amongpresidential ethnic match, male and multiparty years. The fact that wedo not see this in Table 12 (see columns 7–12) is therefore another pieceof evidence that is inconsistent with the demand mechanism logic.
28Teachers in Kenya are hired as civil servants through the Teacher’s ServiceCommission (Duflo et al., 2015).

Ethnic Favoritism in Education in Kenya 43
4.4 Other Channels
Although the evidence is somewhat mixed, our results provide somewhatmore support for supply- than demand-side mechanisms. There are,however, additional channels that our current data do not permit us toevaluate. For example, children may benefit from having coethnics inpower not because of the greater amount of funding they are allocatedbut due to the efficiency with which these funds are translated intoconcrete outputs. Leakage and inefficiency are major problems in theeducation sector in African countries (Das et al., 2003; Reinikka andSvensson, 2004). However, when presidents and ministers share anethnic connection with the agents who implement education policies atthe local level, they may be better able to monitor these agents’ activities,and this may lead to less wastage and better outcomes.29 Coethnicelites and agents may also be better able to cooperate (Habyarimanaet al., 2009) or may share similar preferences about education policyand its implementation (Lieberman and McClendon, 2013), which couldalso generate improved schooling outcomes.
Alternatively, having coethnics occupying senior government posi-tions — especially the presidency — may matter by inspiring childrenfrom that group to succeed. Research in the United States suggeststhat Barak Obama’s rise to national prominence, and eventually tothe White House, had a positive effect on the school performance oftraditionally underperforming African American children, who view himas a role model (Marx et al., 2009). It is possible that similar dynamicslie behind the association we find in Kenya between having a coethnicpresident and school attainment among Kenyan children.
5 Implications
How should we think about the substantive importance of our findings?Since education affects other critical life outcomes, one way of answeringthis question is to estimate the impact of ethnic favoritism on theseother outcomes through its effect on schooling. To do this, we draw on
29The logic here echoes Kasara’s (2007) argument about the greater efficiency ofinteractions between coethnic elites and agents in the area of tax collection. On theother hand, leaders may turn a blind eye to leakage in their home areas, knowingthat local coethnic elites are the ones who are benefiting.

44 Kramon and Posner
the results of a study that exploits the increase in the number of primaryschool years in Kenya from seven to eight in 1985 to estimate the causaleffect of an additional year of primary schooling (Kramon, 2012). Wecombine our estimate of the impact of having a coethnic president onyears of primary schooling (from column 1 of Table 2) with Kramon’sestimates of the impact of primary schooling on infant mortality, age atfirst childbirth, total fertility and formal employment. We estimate that,through its effect on schooling, having a coethnic president during one’sprimary school years increases a woman’s age at first childbirth by about0.37 years, raises the probability that her children will survive theirfirst year by 0.01 percentage points, and decreases her total fertility byabout 0.42 children. In addition, we estimate that having a coethnic aspresident during one’s primary school years increases the probability offormal employment later in life by about 10 percentage points (analysesavailable upon request). These are large effects, and they underscorethe substantive importance of ethnic favoritism in the education sector.
Another way of thinking about the import of our results is to considerthe share of an ethnic group’s overall gains in educational attainmentthat can be attributed to ethnic favoritism. For example, we estimatethat an ethnic match with the president increases the average numberof primary school years that a child receives by 0.36 years. Duringthe Kenyatta era, the average years of schooling among the Kikuyuincreased from 4.6 to 6.1 years. An ethnic match therefore accounts forabout 23 percent of this 1.5-year increase. During the Moi era, averageyears of schooling among the Kalenjin increased by 2.5 years (from 4.2to 6.7 years). The ethnic match accounts for about 14 percent of thisincrease.
A third way of thinking about the impact of our findings is in termsof the broader impact of ethnic favoritism on Kenyan politics and society.Survey data reveal strong expectations of ethnic bias by state actors,with perceptions of fair treatment by the government strongly associatedwith whether or not the respondent is a member of the president’sethnic group (Afrobarometer, 2008). Although these perceptions are nodoubt driven by factors that go beyond ethnic favoritism in educationalattainment, inequality in the education sphere does nothing to weakenthese perceptions, and quite likely reinforces them.
Perceptions of ethnic favoritism in the distribution of governmentresources have a number of important consequences. First, they

Ethnic Favoritism in Education in Kenya 45
undermine trust between ethnic groups, which may have implications formarket integration, collective action, and economic growth (Beugelsdijket al., 2004; Knack and Keefer, 1997; Robinson, 2013). Second, theysubstantially raise the stakes of presidential elections, as people fearexclusion from future benefits in the event that the candidate associ-ated with their group is defeated. This has led to the emergence of a“do or die” mentality surrounding elections in Kenya (Mueller, 2011),which, in turn, generates incentives for vote-buying, electoral fraud, andother forms of election- (and non-election-) related corruption (Kramon,forthcoming; Wrong, 2009). High stakes elections can also fuel electionviolence. Most recently, this was manifested in the conflict that killedover 1,000 people and displaced roughly 700,000 after the disputedelections of 2007. Though the proximate cause was a dispute overthe true winner of the election, the underlying grievances that facili-tated the violence were related to perceptions of biased and inequitabledistribution of resources across Kenya’s ethnic groups. Thus, to theextent that ethnic favoritism in the education sector contributes to theperception that power-holders will discriminate on behalf of their kin,it may undermine development by generating mistrust, corruption, andinstability.
6 Conclusion
Kenyan politics — like that of many developing countries — has longbeen characterized by favoritism of coethnics by political leaders. In thispaper we document this phenomenon in the education sector by takingadvantage of data on the primary and secondary school attainment ofmore than 50,000 Kenyans over five decades. Controlling for an array ofindividual- and group-specific determinants of educational attainment,and leveraging changes in the ethnic backgrounds of Kenyan presidentsover time, we find a strong and robust relationship between schoolingoutcomes and whether or not a coethnic occupied the presidency duringa person’s school-age years.
Our deep examination of the Kenyan case has allowed us to advancethe existing literature in a number of ways. First, we investigate theimpact of kinship ties with political actors other than the president.It is well established that African presidents often allocate cabinet

46 Kramon and Posner
positions to members of other ethnic groups in order to maintain theirpolitical coalition. Yet there is no empirical evidence on the distributiveconsequences of this strategy. This is an important omission becauseit could be that such appointments are mere window dressing withno real effect on the fortunes of the people who those ministers areostensibly representing in the government. We show that having aminister of education from one’s ethnic group is positively associatedwith both primary and secondary school attainment — evidence thatcabinet positions come with real power to impact distributive politics.
Second, we explore how democratization affects ethnic favoritism.A number of studies ask how overall levels of public goods provisionand wellbeing vary with regime type. Fewer ask how the transitionfrom single-party to multi-party rule affects the way those public goodsare distributed. We show, perhaps surprisingly (and in contrast toBurgess et al 2015), that ethnic favoritism by Kenyan presidents andministers of education has persisted, and been of roughly the samemagnitude, in the country’s single- and multi-party eras. We do find,however, that democratization impacts the composition of the groupthat the president favors. Specifically, we find that the president of asmall ethnic group expands favoritism to include members of closelyrelated ethnic groups in the multiparty era. We interpret this finding asresulting from the incentives of electoral competition: in the multipartyera, leaders of smaller ethnic groups have incentives to broaden thedefinition of the “group” in order to enhance their electoral prospects.This result underscores the extent to which political strategy, ratherthan ethnolinguistic affinity, drives patterns of ethnic favoritism.
Third, we examine the mechanisms that lie behind these patterns.Our analyses suggest that the relationship between schooling outcomesand coethnicity is driven by targeted spending toward the president andminister’s ethnic groups(s), not by the spillover of favoritism in otherdomains or by expectations of future job opportunities.
References
Afrobarometer (2008), Round 4 Survey Data. http://afrobarometer.org/surveys-and-methods/questionnaires.

Ethnic Favoritism in Education in Kenya 47
Ahlerup, P. and A.-S. Isaksson (2015), “Ethno-Regional Favouritism inSub-Saharan Africa”, Kyklos, 68(2), 143–52.
Alderman, H., J. Hoddinott, and B. Kinsey (2006), “Long Term Conse-quences of Early Child Malnutrition”, Oxford Economic Papers, 58,450–74.
Alwy, A. and S. Schech (2004), “Ethnic Inequalities in Education inKenya”, International Education Journal, 5(2), 266–74.
Angrist, J., E. Bettinger, E. Bloom, E. King, and M. Kremer (2002),“Vouchers for Private Schooling in Colombia: Evidence from a Ran-domized Natural Experiment”, American Economic Review, 92(5),1535–58.
Arriola, L. (2009), “Patronage and Political Stability in Africa”, Com-parative Political Studies, 42(10), 1339.
Arriola, L. (2012), Multiethnic Coalitions in Africa: Business Financingof Opposition Election Campaigns, New York: Cambridge UniversityPress.
Barkan, J. and M. Chege (1989), “Decentralizing the State: DistrictFocus and the Politics of Reallocation in Kenya”, Journal of ModernAfrican Studies, 27(3), 431–53.
Bates, R. (1983), “Modernization, Ethnic Competition, and the Ra-tionality of Politics in Contemporary Africa”, in State versus Eth-nic Claims: African Policy Dilemmas, ed. D. Rothchild and V. A.Olorunsola, Boulder, Colorado: Westview Press.
Bertrand, M., E. Duflo, and S. Mullainathan (2004), “How Much ShouldWe Trust Differences-In-Differences Estimates”, Quarterly Journalof Economics, 199(1), 249–75.
Beugelsdijk, S., H. De Groot, and A. Van Schaik (2004), “Trust andEconomic Growth: A Robustness Analysis”, Oxford Economic Papers,56(1), 118–34.
Branch, D. (2011), Kenya: Between Hope and Despair, 1963–2011, NewHaven: Yale University Press.
Burgess, R., R. Jedwab, E. Miguel, A. Morjaria, and G. P. i Miquel(2015), “The Value of Democracy: Evidence form Road Building inKenya”, American Economic Review, 105(6), 1817–51.
Carlson, E. (2015), “Ethnic Voting and Accountability in Africa: AChoice Experiment in Uganda”, World Politics, 67(2), 353–85.

48 Kramon and Posner
Chiozza, G. and H. E. Goemans (2004), “International Conflict andthe Tenure of Leaders: Is War Still Ex Post Inefficient?”, AmericanJournal of Political Science, 48(3), 604–19.
Das, J., S. Dercon, J. Habyarimana, and P. Krishnan (2003), “Rules vs.Discretion: Public and Private Funding in Zambian Basic Education”,Unpublished paper.
De Luca, G., R. Hodler, P. A. Raschky, and M. Valsecchi (2015), “EthnicFavoritism: An Axiom of Politics?”, CESifo Working Paper No. 5209.
Duflo, E. (2001), “Schooling and Labor Market Consequences of SchoolConstruction in Indonesia: Evidence from an Unusual Policy Exper-iment”, American Economic Review, 91, 795–813.
Duflo, E., P. Dupas, and M. Kremer (2015), “School Governance, TeacherIncentives, and Pupil-Teacher Ratios: Experimental Evidence fromKenyan Primary Schools”, Journal of Public Economics, 123, 92–110.
Easterly, W. and R. Levine (1997), “Africa’s Growth Tragedy: Policiesand Ethnic Divisions”, Quarterly Journal of Economics, 112(4),1203–50.
Evans, D., M. Kremer, and M. Ngatia (2009), “The Impact of Distribut-ing School Uniforms on Children’s Education in Kenya”, Unpublishedmanuscript.
Ferree, K. (2006), “Explaining South Africa’s Racial Census”, Journalof Politics, 68(4), 803–15.
Franck, R. and I. Rainer (2012), “Does the Leader’s Ethnicity Matter?Ethnic Favoritism, Education and Health in Sub-Saharan Africa”,American Political Science Review, 106(2), 294–325.
Francois, P., I. Rainer, and F. Trebbi (2015), “How is Power Shared inAfrica?”, Econometrica, 83(2), 465–503.
Gallego, F. and R. Woodberry (2010), “Christian Missionaries andEducation in Former African Colonies: How Competition Mattered”,Journal of African Economies, 19(3), 294–329.
Habyarimana, J., M. Humphreys, D. N. Posner, and J. Weinstein (2009),Coethnicity: Diversity and the Dilemmas of Collective Action, NewYork: Russell Sage Foundation Publications.
Hodler, R. and P. A. Raschky (2014), “Regional Favoritism”, QuarterlyJournal of Economics, 129(2), 995–1033.
Hornsby, C. (2012), Kenya: A History Since Independence, London: I.B.Tauris.

Ethnic Favoritism in Education in Kenya 49
Ichino, N. and N. Nathan (2013), “Local Ethnic Geography and In-strumental Ethnic Voting: Voter Behavior Across Rural Ghana”,American Political Science Review, 107(2), 344–61.
Jablonski, R. (2014), “How Aid Targets Votes: The Impact of ElectoralIncentives on Foreign Aid Distribution”, World Politics, 66(2), 293–330.
Jensen, R. (2010), “The (Perceived) Returns to Education and theDemand for Schooling”, Quarterly Journal of Economics, 125(2),515–48.
Joseph, R. (1987), Democracy and Prebendalism in Nigeria, Cambridge:Cambridge University Press.
Kasara, K. (2007), “Tax Me If You Can: Ethnic Geography, Democ-racy, and the Taxation of Agriculture in Africa”, American PoliticalScience Review, 101(1), 159–72.
KIPPRA Research Team (2012), “Inequalities and Social Cohesion inKenya: Evidence, Synthesis and Policy Proposals”, Paper preparedfor a conference on Growth and Equity: How Can Africa Flourishwith Ethnic Diversity? Tokyo, July 23–24.
Knack, S. and P. Keefer (1997), “Does Social Capital Have an EconomicPay-Off? A Cross-Country Investigation”, Quarterly Journal ofEconomics, 112, 1251–88.
Kono, D. Y. and G. R. Montinola (2009), “Does Foreign Aid SupportAutocrats, Democrats, or Both?”, Journal of Politics, 71(2), 704–18.
Kramon, E. (forthcoming), “Electoral Handouts as Information: Ex-plaining Unmonitored Vote Buying”, World Politics.
Kramon, E. (2012), “Maternal Education and Infant Mortality: EvidenceFrom a Kenyan Policy Change”, Unpublished manuscript.
Kramon, E. and D. N. Posner (2013), “Who Benefits from DistributivePolitics? How the Outcome One Studies Affects the Answer OneGets”, Perspectives on Politics, 11(2), 461–74.
Kramon, E. and D. N. Posner (2014), “Protecting Education fromEthnic Politics”, Unpublished manuscript.
Leonard, D. K. (1991), African Successes: Four Public Managers ofKenyan Rural Development, Berkeley: University of California Press.
Lieberman, E. and G. McClendon (2013), “The Ethnicity-Policy Prefer-ences Link in Sub-Saharan Africa”, Comparative Political Studies,46(5), 574–602.

50 Kramon and Posner
Lynch, G. (2011), I Say To You: Ethnic Politics and the Kalenjin inKenya, Chicago: University of Chicago Press.
Marinov, N. (2005), “Do Economic Sanctions Destabilize Country Lead-ers?”, American Journal of Political Science, 49(3), 564–76.
Martorell, R., B. L. Horta, L. S. Adair, A. D. Stein, L. Richter, C. H. D.Fall, S. K. Bhargava, S. K. D. Biswas, L. Perez, F. C. Barros, andC. G. Victora and Consortium on Health Oriented Research inTransitional Societies Group (2010), “Weight Gain in the First TwoYears of Life is an Important Predictor of Schooling Outcomes inPooled Analyses from Five Birth Cohorts from Low- and Middle-Income Countries”, Journal of Nutrition, 140, 348–54.
Marx, D. M., S. J. Ko, and R. Friedman (2009), “The ‘Obama Ef-fect’: How a Salient Role Model Reduces Race-Based PerformanceDifferences”, Journal of Experimental Social Psychology, 45 (July),953–6.
Miguel, E. and M. Kremer (2004), “Worms: Identifying Impacts onEducation and Health in the Presence of Treatment Externalities”,Econometrica, 72(1), 159–217.
Minnesota Population Center (2014), Integrated Public Use MicrodataSeries, International: Version 6.3. Minneapolis: University of Min-nesota.
Moradi, A. (2009), “Toward and Objective Account of Nutrition andHealth in Colonial Kenya: A Study of Stature in African ArmyRecruits and Civilians: 1880–1980”, Journal of Economic History,69 (September), 719–54.
Morjaria, A. (2011), “Electoral Politics and Deforestation”, Unpublishedmanuscript.
Mueller, S. (2011), “Dying to Win: Elections, Political Violence, andInstitutional Decay in Kenya”, Journal of Contemporary AfricanStudies, 29(1), 99–117.
Nellis, J. R. (1974), “The Ethnic Composition of Leading Kenyan Gov-ernment Positions”, Research Report No. 24. Uppsala: ScandinavianInstitute of African Studies.
Nunn, N. (2011), “Gender and Missionary Influence in Colonial Africa”,Unpublished paper.
Oyugi, E. (2000), The Legacy of Colonialism, Nairobi: Kenya Coalitionfor Social Watch.
Ethnic Favoritism in Education in Kenya 51
Posner, D. N. (2004), “The Political Salience of Cultural Difference:Why Chewas and Tumbukas are Allies in Zambia and Adversariesin Malawi”, American Political Science Review, 98(4), 529–45.
Posner, D. N. (2005), Institutions and Ethnic Politics in Africa, Cam-bridge: Cambridge University Press.
Reinikka, R. and J. Svensson (2004), “Local Capture: Evidence froma Central Government Transfer Program in Uganda”, QuarterlyJournal of Economics, 119(2), 679–705.
Robinson, A. (2013), “Internal Borders: Ethnic Diversity and MarketSegmentation in Malawi”, Unpublished paper.
Rothchild, D. (1969), “Ethnic Inequalities in Kenya”, Journal of ModernAfrican Studies, 7(4), 689–711.
Schultz, P. T. (2004), “School Subsidies for the Poor: Evaluating theMexican PROGRESA Poverty Program”, Journal of DevelopmentEconomics, 74(1), 199–250.
Silventoinen, K. (2003), “Determinants of Variation in Adult BodyHeight”, Journal of Biological Science, 35, 263–85.
Suda, C. (2002), “Gender Disparities in the Kenya Labour Market:Implications for Poverty Reduction”, Nordic Journal of AfricanStudies, 11(3), 301–21.
Thies, M. (2001), “Keeping Tabs on Partners: The Logic of Delegationin Coalition Governments”, American Journal of Political Science,45(3), 580–98.
Throup, D. and C. Hornsby (1998), Multi-Party Politics in Kenya: TheKenyatta and Moi States and the Triumph of the System in the 1992Election, Oxford: James Currey.
van de Walle, N. (2007), “Meet the New Boss, Same as the Old Boss?The Evolution of Political Clientelism in Africa”, in Patrons, Clients,and Policies: Patterns of Democratic Accountability and PoliticalCompetition, ed. H. Kitschelt and S. I. Wilkinson, New York: Cam-bridge University Press, 50–67.
Wantchekon, L. (2003), “Clientelism and Voting Behavior: Evidencefrom a Field Experiment in Benin”, World Politics, 55(3), 399–422.
Widner, J. (1993), The Rise of A Party-State in Kenya: From Harambee!to Nyayo!, Berkeley and Los Angeles: University of California Press.
Wrong, M. (2009), It’s Our Turn to Eat. The Story of a Kenyan Whistle-Blower, New York: Harper Collins.
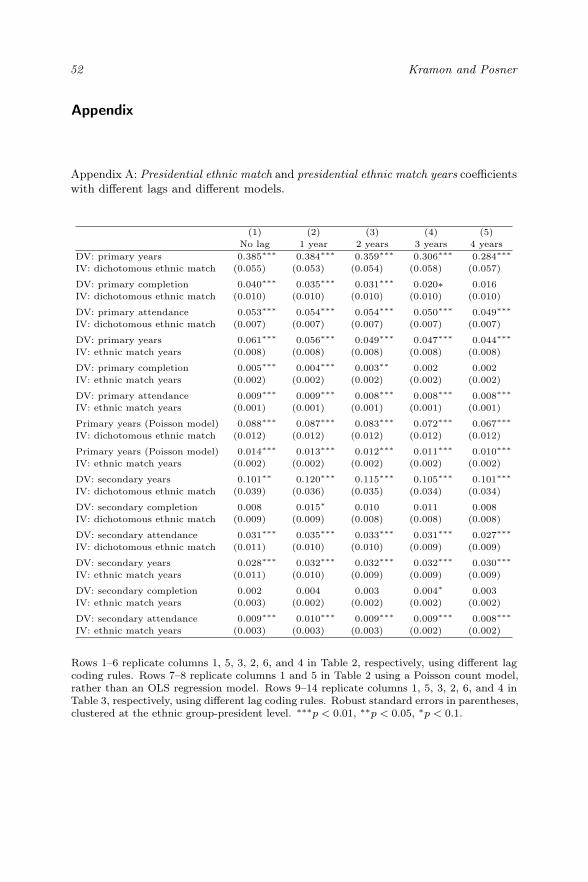
52 Kramon and Posner
Appendix
Appendix A: Presidential ethnic match and presidential ethnic match years coefficientswith different lags and different models.
(1) (2) (3) (4) (5)No lag 1 year 2 years 3 years 4 years
DV: primary years 0.385∗∗∗ 0.384∗∗∗ 0.359∗∗∗ 0.306∗∗∗ 0.284∗∗∗
IV: dichotomous ethnic match (0.055) (0.053) (0.054) (0.058) (0.057)
DV: primary completion 0.040∗∗∗ 0.035∗∗∗ 0.031∗∗∗ 0.020∗ 0.016
IV: dichotomous ethnic match (0.010) (0.010) (0.010) (0.010) (0.010)
DV: primary attendance 0.053∗∗∗ 0.054∗∗∗ 0.054∗∗∗ 0.050∗∗∗ 0.049∗∗∗
IV: dichotomous ethnic match (0.007) (0.007) (0.007) (0.007) (0.007)
DV: primary years 0.061∗∗∗ 0.056∗∗∗ 0.049∗∗∗ 0.047∗∗∗ 0.044∗∗∗
IV: ethnic match years (0.008) (0.008) (0.008) (0.008) (0.008)
DV: primary completion 0.005∗∗∗ 0.004∗∗∗ 0.003∗∗ 0.002 0.002
IV: ethnic match years (0.002) (0.002) (0.002) (0.002) (0.002)
DV: primary attendance 0.009∗∗∗ 0.009∗∗∗ 0.008∗∗∗ 0.008∗∗∗ 0.008∗∗∗
IV: ethnic match years (0.001) (0.001) (0.001) (0.001) (0.001)
Primary years (Poisson model) 0.088∗∗∗ 0.087∗∗∗ 0.083∗∗∗ 0.072∗∗∗ 0.067∗∗∗
IV: dichotomous ethnic match (0.012) (0.012) (0.012) (0.012) (0.012)
Primary years (Poisson model) 0.014∗∗∗ 0.013∗∗∗ 0.012∗∗∗ 0.011∗∗∗ 0.010∗∗∗
IV: ethnic match years (0.002) (0.002) (0.002) (0.002) (0.002)
DV: secondary years 0.101∗∗ 0.120∗∗∗ 0.115∗∗∗ 0.105∗∗∗ 0.101∗∗∗
IV: dichotomous ethnic match (0.039) (0.036) (0.035) (0.034) (0.034)
DV: secondary completion 0.008 0.015∗ 0.010 0.011 0.008
IV: dichotomous ethnic match (0.009) (0.009) (0.008) (0.008) (0.008)
DV: secondary attendance 0.031∗∗∗ 0.035∗∗∗ 0.033∗∗∗ 0.031∗∗∗ 0.027∗∗∗
IV: dichotomous ethnic match (0.011) (0.010) (0.010) (0.009) (0.009)
DV: secondary years 0.028∗∗∗ 0.032∗∗∗ 0.032∗∗∗ 0.032∗∗∗ 0.030∗∗∗
IV: ethnic match years (0.011) (0.010) (0.009) (0.009) (0.009)
DV: secondary completion 0.002 0.004 0.003 0.004∗ 0.003
IV: ethnic match years (0.003) (0.002) (0.002) (0.002) (0.002)
DV: secondary attendance 0.009∗∗∗ 0.010∗∗∗ 0.009∗∗∗ 0.009∗∗∗ 0.008∗∗∗
IV: ethnic match years (0.003) (0.003) (0.003) (0.002) (0.002)
Rows 1–6 replicate columns 1, 5, 3, 2, 6, and 4 in Table 2, respectively, using different lagcoding rules. Rows 7–8 replicate columns 1 and 5 in Table 2 using a Poisson count model,rather than an OLS regression model. Rows 9–14 replicate columns 1, 5, 3, 2, 6, and 4 inTable 3, respectively, using different lag coding rules. Robust standard errors in parentheses,clustered at the ethnic group-president level. ∗∗∗p < 0.01, ∗∗p < 0.05, ∗p < 0.1.

Ethnic Favoritism in Education in Kenya 53
Appendix B: Robustness to different group-specific time trends.
(1) (2)Linear Quadratic
group-specific group-specifictime trends time trends
DV: primary years 0.291∗∗ 0.121∗∗
IV: dichotomous ethnic match (0.126) (0.051)DV: primary completion 0.054∗∗∗ 0.039∗∗∗
IV: dichotomous ethnic match (0.016) (0.010)DV: primary attendance 0.030∗∗ 0.013∗
IV: dichotomous ethnic match (0.014) (0.006)DV: primary years 0.055∗∗∗ 0.055∗∗
IV: # of ed. minister match years (0.013) (0.021)DV: secondary years 0.086∗ 0.161∗∗∗
IV: dichotomous ethnic match (0.048) (0.040)DV: secondary completion 0.001 0.020∗∗
IV: dichotomous ethnic match (0.012) (0.009)DV: secondary attendance 0.034∗∗∗ 0.049∗∗∗
IV: dichotomous ethnic match (0.009) (0.011)
Robust standard errors in parentheses. ∗∗∗p < 0.01, ∗∗p < 0.05, ∗p < 0.1.

54 Kramon and Posner
Appendix C: Robustness to different ways of clustering the standard errors.
(1) (2)Ethnic group- Ethnic group-age cohort president
DV: primary years 0.359∗∗∗ 0.359∗∗∗
IV: dichotomous ethnic match (0.054) (0.032)DV: primary years 0.049∗∗∗ 0.049∗∗∗
IV: ethnic match years (0.008) (0.010)DV: primary completion 0.031∗∗∗ 0.031∗∗∗
IV: dichotomous ethnic match (0.010) (0.005)DV: primary completion 0.003∗∗ 0.003∗∗
IV: ethnic match years (0.002) (0.001)DV: primary attendance 0.054∗∗∗ 0.054∗∗∗
IV: dichotomous ethnic (0.007) (0.008)DV: primary attendance 0.008∗∗∗ 0.008∗∗∗
IV: ethnic match year (0.001) (0.001)DV: secondary years 0.115∗∗∗ 0.115∗∗∗
IV: dichotomous ethnic match (0.035) (0.036)DV: secondary years 0.032∗∗∗ 0.032∗∗∗
IV: ethnic match years (0.009) (0.010)DV: secondary completion 0.010 0.010IV: dichotomous ethnic match (0.008) (0.008)DV: secondary completion 0.003 0.003IV: ethnic match years (0.002) (0.002)DV: secondary attendance 0.033∗∗∗ 0.033∗∗∗
IV: dichotomous ethnic (0.010) (0.011)DV: secondary attendance 0.009∗∗∗ 0.009∗∗
IV: ethnic match year (0.003) (0.003)
Robust standard errors in parentheses. ∗∗∗p < 0.01, ∗∗p < 0.05, ∗p < 0.1. Note: Clusteringof standard errors does not impact coefficient estimate, just the standard errors.

Ethnic Favoritism in Education in Kenya 55
App
endixD:R
obustnessto
estimationusinglogistic
regression
.
(1)
(2)
(3)
(4)
(5)
(6)
(7)
(8)
(9)
(10)
(11)
(12)
(13)
Prim
ary
atte
ndan
cePr
imar
y at
tend
ance
Prim
ary
com
plet
ion
Prim
ary
com
plet
ion
Prim
ary
com
plet
ion
(cen
sus)
Seco
ndar
y at
tend
ance
Sec
onda
ry
atte
ndan
ceSe
cond
ary
com
plet
ion
Sec
onda
ry
com
plet
ion
Prim
ary
atte
ndan
cePr
imar
y co
mpl
etio
nSe
cond
ary
atte
ndan
ceS
econ
dary
co
mpl
etio
n
Pre
side
ntia
l eth
nic
0.11
70.
143*
**0.
106*
**0.
006
0.11
9***
mat
ch(0
.234
)(0
.020
)(0
.051
)(0
.268
)(0
.015
)#
pres
iden
tial m
atch
0.01
10.
016*
**ye
ars
(0.0
38)
(0.0
06)
Pre
side
ntia
l mat
chse
cond
ary
year
s0.
181*
**(0
.051
)0.
182*
**(0
.052
)0.
189*
**(0
.051
)0.
193*
**(0
.051
)#
of p
resi
dent
ial m
atch
ye
ars,
sec
onda
ry0.
050*
**(0
.015
)0.
049*
**(0
.016
)E
duca
tion
min
iste
rm
atch
yea
rs0.
071
(0.0
66)
0.02
8**
(0.0
13)
Edu
catio
n m
inis
ter
mat
ch y
rs, s
econ
dary
0.02
8**
(0.0
12)
0.03
1(0
.020
)
Obs
erva
tion
s47
275
4727
547
275
4727
53,
236,
101
4727
547
275
4727
547
275
4917
149
171
4727
547
275
Rob
uststan
dard
errors
inpa
rentheses.
∗∗∗ p
<0.01,∗∗
p<
0.05,∗ p
<0.1.

56 Kramon and Posner
App
endixE:P
residentiale
thnicfavoritism
underKenyattav.
Moi.
Primaryed
ucation.
(1)
(2)
(3)
(4)
(5)
(6)
Primary
Primary
Primary
Primary
Primary
Primary
years
years
attend
ance
attend
ance
completion
completion
Presidential
0.32
6∗∗
∗0.069∗∗
∗0.029
∗∗
ethn
icmatch
(0.062)
(0.006)
(0.011)
#of
presidential
0.049∗∗
∗0.011
∗∗∗
0.003
∗
ethn
icmatch
years
(0.011)
(0.001)
(0.002)
Presidentiale
thnic
0.08
9−0.038∗∗
∗0.003
match
∗Moi
era
(0.131)
(0.011)
(0.021)
Ethnicmatch
−0.000
−0.007
∗∗∗
0.000
years∗
Moi
era
(0.022)
(0.001)
(0.003)
Observation
s47,275
47,275
47,275
47,275
47,275
47,275
R-squ
ared
0.27
00.27
00.230
0.230
0.117
0.117
(Con
tinu
ed)
Rob
uststan
dard
errors,clusteredat
ethn
icgrou
p-presidentlevel.
Allmod
elsinclud
eethn
icgrou
pfix
edeff
ects,agecoho
rt(year-of-birth)
fixed
effects,an
dcontrols
forchild
hood
inruralarea,gend
er,an
drelig
ion.
Allmod
elsareestimated
usingOLS.
∗∗∗ p
<0.01,∗∗
p<
0.05,
∗p<
0.1.

Ethnic Favoritism in Education in Kenya 57
Second
aryed
ucation.
(1)
(2)
(3)
(4)
(5)
(6)
Second
ary
Second
ary
Second
ary
Second
ary
Second
ary
Second
ary
years
years
attend
ance
attend
ance
completion
completion
Presidential
0.050
0.021
−0.00
9ethn
icmatch
(0.042)
(0.015)
(0.008)
#of
presidential
0.017
0.006
−0.002
ethn
icmatch
years
(0.011
)(0.004)
(0.002)
Presidentiale
thnic
0.121∗∗
0.022∗
0.03
7∗∗
∗
match
∗Moi
era
(0.050)
(0.012)
(0.009)
Ethnicmatch
0.029
∗0.005
0.009∗
∗∗
years∗
Moi
era
(0.014
)(0.004)
(0.003)
Observation
s46,042
46,042
46,275
47,275
47,275
47,275
R-squ
ared
0.093
0.093
0.085
0.085
0.07
20.072

58 Kramon and Posner
App
endixF:D
emocracy
robu
stne
sstests.
(1)
(2)
(3)
(4)
(5)
(6)
(7)
(8)
Primaryyears
Second
aryyears
Primaryyears
Second
aryyears
(multipa
rtyyears,
(multipa
rtyyears,
(average
(average
1998
tran
sition
)1998
tran
sition
)POLIT
Yscore)
POLIT
Yscore)
Dem
ocracy
0.748∗∗
∗0.434∗∗
∗−0.079∗∗
0.067∗∗
∗0.488∗∗
∗0.586∗∗
∗−0.004
0.031
(0.049)
(0.027)
(0.029)
(0.014)
(0.040)
(0.039)
(0.010)
(0.022)
Preside
ntial
0.309∗∗
∗0.372∗∗
∗0.132∗∗
∗0.066
0.447∗∗
∗0.368∗∗
∗0.151∗∗
0.103∗∗
ethn
icmatch
(0.065)
(0.024)
(0.032)
(0.045)
(0.097)
(0.024)
(0.055)
(0.043)
Preside
ntial
0.055
−0.013
0.017
0.005
match
∗de
mocracy
(0.040)
(0.016)
(0.018)
(0.008)
Edu
cation
minister
0.061∗∗
∗0.020
0.031
0.036∗∗
ethn
icmatch
years
(0.021)
(0.015)
(0.021)
(0.015)
Edministerethn
ic−0.005
−0.001
−0.005
0.004
match
∗de
mocracy
(0.007)
(0.007)
(0.005)
(0.003)
Observation
s46,818
48,714
45,591
50,255
47,275
48,666
44,993
47,810
R-squ
ared
0.272
0.299
0.091
0.099
0.270
0.287
0.090
0.094
Multipa
rtyyearsaredefin
edin
columns
1-4as
yearsof
scho
olingpriorto
1969
orafter2008
andin
columns
5-8as
theaveragePOLIT
Yscorein
thecoun
trydu
ring
thechild
’sprim
aryor
second
aryscho
ol-age
years.
Rob
uststan
dard
errors
clusteredby
ethn
icgrou
p-president
inpa
rentheses.
Eachmod
elinclud
esethn
icgrou
pfix
edeff
ects
andcontrolsforgend
er,relig
ion,
andchild
hood
inaruralarea.
∗∗∗ p
<0.01,
∗∗p<
0.05,∗ p
<0.1.