ethnic forces in collective action: diversity, dominance, and
TRANSCRIPT

Copyright © 2011 by the author(s). Published here under license by the Resilience Alliance.Waring, T. M. 2011. Ethnic forces in collective action: diversity, dominance, and irrigation in Tamil Nadu.Ecology and Society 16(4): 1.http://dx.doi.org/10.5751/ES-04265-160401
Research
Ethnic Forces in Collective Action: Diversity, Dominance, and Irrigationin Tamil NaduTimothy M. Waring 1
ABSTRACT. Mounting evidence suggests that ethnic interactions damage cooperation in the provision of public goods, yetvery few studies of collective action in common pool resource management have found strong evidence for the effects of ethnicdiversity. Research on both public goods and common pool resource management that does find negative ethnic effects oncooperation tend to ignore the importance of interethnic relationships, particularly ethnic inequality, stratification, or dominance.This study presents data from agricultural villages in Tamil Nadu’s Palani Hills to test the importance of a range of ethnic effectsusing caste interactions in a traditional irrigation system. I provide corroborating evidence of a negative cooperative effect ofethnic diversity, but also demonstrate that factors of ethnic dominance such as hierarchical stratification and demographicdominance strongly determine outcomes in collective irrigation management. I argue that the most important measure of equity,irrigation access, is socially, technologically, and institutionally embedded, and demonstrate that the distribution of irrigationchannels is explained by measures of inequality, such as wealth inequality, Dalit status, and demographic dominance.
Key Words: cooperation; irrigation; ethnic diversity; ethnic dominance; India
INTRODUCTION One theme that emerges in reviewing the role ofinequality is that the problems of successfulcommons management are not necessarily based onthe characteristics of the natural resource itself – asthe earlier, tragedy-of-the-commons tradition wouldhave it – but rather the more prosaic problem ofgetting people to cooperate. Bardhan and Dayton-Johnson 2000:17.
Theory suggesting that human populations inevitably depletecommon resources (Olson 1965, Hardin 1968) has beeninvalidated with the repeated documentation of successfullymanaged common pool resources, and a voluminous literatureon collective action in community resource management(Ostrom 1990, 2007, Ostrom et al. 1992). Despite thenumerous factors that have been found to contribute tosuccessful collective action in common pool resourcemanagement (Feeny et al. 1990), no mature theory ofcommons management exists (Agrawal 2002). The heavyfocus on ecological and economic variables (e.g., seeVarughese and Ostrom 2001) leaves a theory-gap in thecommon pool resource literature on the influences of culturaland ethnic forces.
Evolutionary anthropology provides a clear and applicabletheory, which proposes that cultural or ethnic groups haveevolved in part as a means to solve collective action problems(Richerson and Boyd 2005). This premise is supported byevidence on cooperation in psychology (Fiedler 1966),anthropology (Henrich et al. 2004), and economics (Gintis etal. 2003). This theory posits ethnic groups evolve as naturalcontainers for human cooperation. Ethnic groups come intobeing via the coevolution of culturally transmitted ethnic
markers and payoff-relevant, often cooperative, behavior(Efferson et al. 2008). Within a cultural or ethnic group,cooperation and behavior are maintained by the strength ofreciprocity and punishment (Fehr et al. 1997, Gintis 2000, Fehrand Gachter 2002, Nowak and Sigmund 2005, Habyarimanaet al. 2007). Accounting for cooperation within cultural groupshelps to explain cooperative breakdown in multiethnicscenarios. Because cooperation is commonly highest withinbounded groups (Bernhard et al. 2006), adding more ethnicgroups decreases global cooperation, and gives rise to an‘ethnocentric equilibrium’ in which altruism within groupscoevolves with antagonism between groups (Choi and Bowles2007). This evolutionary theory of ethnic cooperation shouldapply well to cases of community-based natural resourcemanagement and small-scale common pool resource systemsso common in human evolution and so often studied in thecollective action tradition.
The negative cooperative effect of ethnic diversity has beenobserved on the large scale. Regional studies show ethnicdiversity damages the ability of societies to create and maintainpublic goods (Easterly et al. 1995, Alesina et al. 1999, Migueland Gugerty 2005, Ruttan 2006, Baland et al. 2007). Theseregional studies beg the questions of what cultural and ethnicmechanisms govern cooperative patterns observed at the largescale and whether increasing numbers of ethnic groupsdecreases environmentally relevant cooperation on theindividual level.
A second distinct ethnic force is that of ethnic dominance.Ethnic dominance occurs when ethnic groups differ not onlyby social identity, but also by a culturally reinforced socialranking in which one’s ethnicity determines one’s class(Horowitz 2000). Collier (2001) argues that much of the
1University of Maine, School of Economics

Ecology and Society 16(4): 1http://www.ecologyandsociety.org/vol16/iss4/art1/
observed effect of ethnic diversity is better explained by thestrength of dominance between ethnic groups. However,testing ethnic dominance has proven difficult. Becauseminimal ethnic diversity is a prerequisite for ethnicdominance, the cooperative effects of dominance and diversityoccur simultaneously. Mathematical theory also implies thatethnic diversity and dominance may be very tightly linked. Amodel of the coevolution of social stratification with ethnicdifferentiation suggests that the two factors are mutuallyreinforcing in many cases (Henrich and Boyd 2008). If theHenrich and Boyd model is representative, ethnic diversityand ethnic dominance should often co-occur in regions witheconomic surplus. Borgerhoff-Mulder et al. (2009) find thatthe ability of agricultural populations to amass material wealththrough economic surplus explains why economic inequalityis greater for agrarian societies than for horticultural, foraging,and industrial societies. India is a region where both significantethnic diversity and inequality are nearly ubiquitous under thesurplus conditions of agricultural production.
Village irrigation systems in India have been extremely wellstudied, and scholars have found that intercaste relationshipsmake a significant difference on outcomes. Wade’s (1987)study of village irrigation systems in Andhra Pradesh foundthat greater caste homogeneity was conducive to cooperationin irrigation systems. Bardhan (2000) also found that castehomogeneity increased the likelihood of cooperative behaviorin irrigation systems in Tamil Nadu. Both Bardhan and Wadeused caste homogeneity of villages as the main theoreticalvariable, which is a related but limited metric of true ethnicdiversity. Despite the overwhelming ethnographic andanecdotal evidence on the importance of caste-based hierarchyand dominance (e.g., Dumont 1970), published quantitativeevidence on the effects of ethnic dominance on the individuallevel is nonexistent.
Despite ample evidence and theory that both ethnic diversityand ethnic dominance may play critical roles in generalcooperation and collective action in natural resourcemanagement, one or both of these ethnic forces are oftenignored. The focus of this paper is to examine the effects ofethnic diversity, ethnic dominance, and their articulation oncooperation in and perceptions of a traditional irrigationsystem in South India. I will test the two main hypotheses: (1)increasing ethnic diversity reduces community cooperationand perceptions of collective action efforts (e.g., Easterly etal. 1995, Miguel and Gugerty 2005); (2) ethnic dominanceadditionally reduces cooperation and collective actionperceptions (Collier 2001).
BACKGROUNDThe upper Palani Hills are home to 20 agricultural villagesranging in size from ~500 to ~6000 people and varying from3 to 13 caste groups per village. Table 1 summarizes thetraditional village positions by caste membership across the
six study villages, and outlines the significance of caste-basedethnic social stratification in village life. The outrightoppression of ‘servant castes’ or Dalits, also called Harijans,untouchables, or Scheduled Castes/Tribes, is common inTamil Nadu (Mangubhai and Irudayam 2000) and India atlarge. However, the traditional village-level institutions thatstill use caste to determine social roles are increasingly rare.
The traditional village irrigation system is a highly cooperativeenterprise, and it bears significant resemblance to otherirrigation systems in the Ramnad and Sivaganga regions ofTamil Nadu (Mosse 2006). In the Palani Hills, this irrigationsystem is a formal part of the village council. Village leadersconvene village-wide meetings several times a year to conductvillage business. These meetings largely focus on festivalpreparation, and communal works projects including theorganization village workdays for maintaining the irrigationchannels and ponds.
Table 1. Caste-wise distribution of traditional villageleadership and servant positions in six study villages. TheSakkliyar are the predominant servant caste in the Palani hillsregion. See appendix for further detail on traditional villagestructure and ethnographic background. The term Dalit refersto the servant groups also termed Harijan, untouchable, orScheduled Caste/Tribe.
Castegroup
Leadershippositions (inherited)
Servant positions(appointed by
leaders)
RegionalStatus
Manadiyar 10 - VillageLeader
Asariyar 8 - VillageLeader
Mudaliyar 3 - MiddlePillaiyar 3 - MiddleChettiyar 2 - MiddleReddiyar 2 - MiddleThevar 1 - MiddleSakkliyar - 98 Dalit
Preliminary ethnographic research provides a sketch of theseirrigation systems. Village leaders appoint a number of officialirrigators, called “neer-nikam,” who oversee the distributionof irrigation water during the dry season from January to May.A neer-nikam is responsible for maintaining the irrigationchannels, overseeing water distribution, and quelling conflictbetween farmers. A neer-nikam distributes water when thevillage storage pond is full, and serves each farmer across thechannel network in turn. In some villages, farmers pay theneer-nikam a small per-acre price for water. The frequency ofirrigation for a farmer depends on the amount of wateravailable in the village pond. We are interested in the variationin actual irrigation behavior and perceptions of the successesand failures of the irrigation system.

Ecology and Society 16(4): 1http://www.ecologyandsociety.org/vol16/iss4/art1/
Fig. 1. Influences on volunteer irrigation labor (workdays). LEFT: Negative binomial model predictions of the effect ofCASTES show that increasing caste diversity decreases estimated cooperative labor dramatically, whether individuals haveCHANNEL access or are Dalit. RIGHT: Estimates of the effects of demographic dominance (FRAC) on workdays showsthat increasing ego-centric caste homogenetiy increases willingness to contribute to the upkeep of the irrigation system. Theterm Dalit refers to the servant groups also termed Harijan, untouchable, or Scheduled Caste/Tribe.
METHODSWe conducted a semistructured, caste-stratified survey offarming households from six villages in the Palani Hills regionof Tamil Nadu between April and June 2008. I selected sixvillages with functioning traditional communal irrigationsystems, which varied in size, number of castes, and distancefrom the local city, Kodaikanal (Appendix 1 Figure 1). In eachvillage all castes with 10 or more households weresubsampled, and a minimum of nine households weresurveyed for each caste group. Villages containedneighborhoods segregated by caste, affording efficientrandomized sampling. I calculated the sample size for eachcaste, and sampled at random within each ethnicneighborhood. The final sample included 258 householdsacross the six villages. Seven iterations of the survey werefield tested in part or in full. Every question was printed inEnglish and Tamil, and Tamil text was frequently backtranslated to ensure accuracy. Surveys were administeredverbally by six research assistants in Tamil and recorded inEnglish. Ambiguities in translation were addressed the sameday the survey was recorded before leaving the village.
Cooperation was measured as workdays, the sum of days ofparticipation in five specific types of irrigation work therespondent reportedly participated in during the last year.Attendance at these workdays is voluntary and enforcementis mostly verbal. Free riders still gain the benefits of afunctioning irrigation system. In a social setting with strongethnic dominance such as the master-servant relationships inthe study region, cooperation might be the result of coercion.It is therefore necessary to include other measures of thesuccess or failure of the cooperative system. Private individualperceptions provide a measure of the social interactionsunderlying choices to cooperate. I included two compositevariables measuring respondents’ perceptions of the adequacyand fairness of the irrigation system. Adequacy and fairnessare both aggregate measures from five individual surveyquestions and display high item reliability (Cronbach’s a >0.67). Response variables are detailed in Table 2.
Predictor variables detailed in Table 3 are broken intoindividual and village level variables. Individual variablesinclude standard demographic information, e.g., age, size of

Ecology and Society 16(4): 1http://www.ecologyandsociety.org/vol16/iss4/art1/
Table 2. Response variable descriptions. See appendix for response variable correlations calculated using restricted maximumlikelihood. Note: a NeerNikam is responsible for maintaining the irrigation channels, overseeing water distribution, and quellingconflict between farmers.
Variable Type Descriptionworkdays days / yr
poissonNumber of village-wide communal workdays attended in the last year for work on ponds, channels,paths, and emergency repairs. (Mean = 3.1). Only eight farmers reported above 10 workdays, andtwo outliers (reporting 49 and 64 days worked) were additionally given low overall reliabilityrankings by research assistants, and excluded from the analysis.
adequacy 0 - 5index
binomial
Sum of four binary response variables on the relative adequacy of the irrigation system. Questions36, 37, 38, 39, 43 from survey appendix, paraphrased:Is there enough water for all?Is there enough water for you?Same or better water availability than other villages?Same or better water availability than 10yr ago?Is water distribution reliable here?Questions 38 and 39 were recoded as binary variables.Item reliability: Cronbach’s a = 0.699
fairness 0 - 5index
binomial
Sum of five binary response variables about procedural fairness in the irrigation system. Questions56, 57, 58, 59, 60, paraphrased:Does NeerNikam distribute water fairly?Do village leaders keep NeerNikam honest?Are you satisfied with irrigation system fairness?How fair are irrigation rules?How fair are penalties for breaking irrigation rules?Questions 59 and 60 recoded such that completely = 1 and mostly = 1, not = 0, and no rules = NA.Item reliability: Cronbach’s a = 0.670
household, years of education, household wealth, irrigationchannel access, as well as caste-relevant information such asthe proportion of the village population represented by therespondents’ caste (FRAC) and Dalit status (DALIT). FRACis a homogeneity measure similar to the village-levelhomogeneity measures used by Wade (1987) and Bardhan(2000) except that FRAC is a respondent-centric measure ofvillage homogeneity, complementary to the number of castes.The DALIT variable is a binary individual measure of the Dalitstatus of the respondent and a concise measure of ethnicdominance. Village-level variables include a simple measureof caste diversity, i.e., the number of castes, and controls forvillage population, distance from the regional city, and theGini coefficient of village wealth inequality. Economicinequality has been well studied as a driver of cooperation.For instance, Bardhan and Dayton-Johnson (2007) found thatan increase in landholding inequality (measured by the GiniCoefficient) in irrigation systems of Tamil Nadu increasedwater-related conflict, and the same authors also discoveredthat economic inequality weakened social sanctioning and theenforcement of collective agreements (Bardhan and Dayton-Johnson 2002). I included the WEALTHGINI variable tocontrol for such wealth effects.
Population size and diversity are always correlated in anyhuman settlement because the number of individuals must
increase with the number of groups. This is also an inescapablefeature of population structure in the study region. Largervillages are not necessarily more diverse, but more diversevillages are always larger. Because I sampled villages acrossthe diversity gradient, I was forced to sample across thepopulation gradient as well. The study design attempted toaccount for this by using a quasi-factorial natural experimenton the three variables of population size, distance from city,and caste numbers. I intentionally added a larger, less diversevillage, Mannavanur, and a small, more diverse village,Vilpatti, to the sample to better distinguish the effects ofpopulation and caste diversity. These efforts improve theaccuracy and reliability of estimates.
Naturally, pairwise correlations showed a strong associationbetween population and numbers of castes (0.89). Suchcolinearity within the predictors would be a problem if bothpopulation and caste diversity were variables of theoreticalinterest. However, population is included only as a necessaryand important control variable. Nonetheless, I calculatedvariance inflation factors (VIFs) as a measure ofmulticolinearity for each regression, and report the maximumVIF for each regression in Table 4. Caste diversity was thevariable with the largest VIF in all regressions, yet it neverbroached the heuristic level of 10 suggested by Fox andMonette (1992) as a sign of significant colinearity. In addition,

Ecology and Society 16(4): 1http://www.ecologyandsociety.org/vol16/iss4/art1/
Table 3. Description of individual and village-level predictor and control variables. Variables of theoretical interest includeDALIT, FRAC, and CASTES. Other variables are included for statistical control.
Individual Level VariablesVariable Type / unit DescriptionAGE yrs Age of respondent in years.HHSIZE # Household size, in individuals.EDUC yrs Education level of respondent.LNWEALTH 1000 Rs. Log total value of owned items, in 1000 Rs. Increments. Wealth = 0.01 + livestock*10 +
pumps*5 + house*300 + two-wheeled-vehicle*50 + four-wheeled-vehicle*750 + acres-owned*7000.
FRAC 0 - 1 Proportion of village population represented by own caste.DALIT binary Dalit status (1), all others (0).CHANNEL binary Irrigation dependency. Question 33: Is the land you work on connected to the channel? 69%
responded ‘yes’.
Village Level VariablesVariable Type / unit DescriptionLNPOP # Log village population as reported by the 2001, Indian Census or estimated by the
Panchayat clerk for that village, 2008.DISTANCE km Distance from Kodiakanal. Kodaikanal (population 32,931) is the closest city and provides
influential social and economic opportunities and cultural contacts (Registrar General &Census Commissioner, India 2001).
CASTES # The number of Jathis in a village with a population of more than 10 households.WEALTHGINI 0 - 1 The Gini coefficient of estimated wealth, as estimated above, by village per Milanovic
(1997).
I computed population-adjusted caste diversity correlationsfor each response variable to test for residual predictive poweronce the effect of LNPOP had been removed from bothCASTES and response variables. The results are collected inTable 4. Because there is a natural colinearity between numberof individuals and the number of groups, I must model bothpopulation and numbers of castes to recover useful estimatesof the effects caste diversity.
I used hierarchical multiple regressions to incorporate bothindividual and village-level predictor variables, and a randomeffect for village to account for any unmeasured village-leveleffects. I fit binomial regressions for indices and poisson-family (negative binomial) regressions for count data(workdays). If village-level variance was close to zero (<0.005) in the full random-effects models, fixed effects modelswere reported. I discuss only correlations with at least 95%confidence. Analyses were computed in R 2.9.2.
RESULTSMultiple regressions revealed a negative cooperative effect ofethnic diversity (Hypothesis 1). Greater numbers of castes ina community were associated with less frequent contributionsof voluntary labor to the cooperative irrigation system. Thisevidence supports the hypothesis that ethnic diversity reducescooperation, and matches findings from the literature.Interestingly, I found no evidence that perceptions of the
irrigation system are themselves negatively influenced bycaste diversity; instead ratings of the adequacy of the irrigationsystem increased with caste diversity, taking all other variablesinto account.
Regression results also yielded evidence of a negativecooperative effect of ethnic dominance (Hypothesis 2).Individuals in larger caste groups were more likely tocooperate, to perceive the system as fair. Dalit individualswere less likely to rate the system as fair. Table 5 summarizesthe support for hypotheses 1 and 2, and Table 4 presents fittedmodel estimates.
Cooperation in the irrigation system, measured as workdayscontributed, was strongly influenced by caste diversity, villagepopulation, caste demographic asymmetries, and irrigationaccess. Workdays declined with increasing caste numbers,matching both predictions and prior findings. The modelestimates that the addition of a new caste with 10 householdsor greater would reduce the average workdays contributed by25%. Workdays also increased with growing castehomogeneity, FRAC, within a village, such that increasing thesize of one’s own caste from zero to 50% of the villagepopulation was linked with a 77% increase in the number ofdays worked. Holding other factors constant, increasing avillage population by 1000 households, a change equivalentto the difference between the smallest and largest villages in

Ecology and Society 16(4): 1http://www.ecologyandsociety.org/vol16/iss4/art1/
Table 4. Regression results and diagnostics. Coefficients with standard errors in parantheses. Bold estimates have 95% confidenceor greater. Max variance inflation factors (VIF) is the largest variance inflation factor for any predictor in the given model. AVIF of 10 or greater is considered an indication of multicolinearity (Fox and Monette 1992). †A random-effects poisson wasover-dispersed (dev/df = 2.17; Lindsey 1999), while a negative binomial model without village was not (dev/df = 1.29). Village-level variance were calculated with a mixed effects poisson. ‡The diversity predictor variable used for workdays was numberof castes with 10 or more households.
Workdays Adequacy FairnessFamily negative binomial† binomial binomialIntercept -1.58 (0.83) -3.43 (1.03) -2.45 (1.31)Village-levelLNPOP 0.77 (0.15) -0.25 (0.13) 0.57 (0.19)DISTANCE -0.01 (0.01) 0.00 (0.01) 0.02 (0.01)CASTES‡ -0.26 (0.08) 0.16 (0.06) -0.11 (0.09)WEALTHGINI -0.03 (0.01) 0.05 (0.02) -0.11 (0.02)Household-levelAGE 0.00 (0.00) 0.00 (0.00) 0.00 (0.01)EDUC -0.01 (0.02) -0.01 (0.02) -0.02 (0.02)HHSIZE 0.06 (0.04) 0.06 (0.05) 0.15 (0.06)LNWEALTH -0.01 (0.04) -0.01 (0.04) 0.22 (0.06)FRAC 1.14 (0.44) 0.27 (0.44) 2.56 (0.64)DALIT -0.03 (0.23) -0.15 (0.25) -1.24 (0.58)CHANNEL 0.38 (0.17) 0.96 (0.18) 3.36 (0.28)DALIT*CHANNEL 0.12 (0.31) 0.36 (0.33) 1.95 (0.67)Village varianceFull Model 0 0.001 0
Model Fit & DiagnosticsML pseudo-R² 0.22 0.28 0.94DF 241 243 243Deviance 310 143 473Max VIF 7.9 7.2 7.2
the sample, would increase the number of workdays anindividual attends by a factor of 1.7 (a 70% growth). A farmerwith a channel, all else being equal, would contribute 150%the number of workdays that a farmer without a channel wouldcontribute, on average. DISTANCE was negatively correlatedwith workdays in the model such that a 20 km additionaldistance to the regional population center also equated to a25% reduction in workdays contributed. Other effects wereeither not significant at the 95% level, or were of very smalleffect size. WEALTHGINI was negatively associated withworkdays, but the effect was exceedingly weak (a change of0.27 WEALTHGINI only equates to a 1% decrease inworkdays contributed). Figure 1 presents model estimates forthe influence of caste diversity (CASTES) and ethnocentrichomogeneity (FRAC) on volunteer workdays.
Perceptions of adequacy and fairnessPerceptions of adequacy and fairness showed very distinctpatterns of correlation. Adequacy perceptions responded withsignificant and large effects to CASTES and CHANNEL,whereas fairness perceptions were not correlated withCASTES, but with many other variables, including DALIT.
The irrigation adequacy index is the sum of five yes/noresponses, and ranges from zero to five (mean = 1.9, SD =1.5). Sixty-six percent of farmers scored two or less. CASTES,LNWEALTH, and CHANNEL were all positively associatedwith the adequacy. In the model, having a CHANNELconnection made farmers 2.6 times more likely to answer ‘yes’to an additional question in the adequacy battery than if theydid not. Adding additional caste equated to a 17% increase inthe odds of increasing a farmer’s rated adequacy score. Anincrease in wealth inequality equivalent to the largest changein the sample villages[1] increased the odds of another adequacymark by only 1%.
Fairness was the sum of five binary response variables on theinstitutional equity of the irrigation system. Responses werebimodal, with 34% producing a score of zero, and 51% ratingthe system with a score of four or five. Perceptions of fairnesswere inflated by having irrigation access, being a member ofa demographically dominant caste, but were damaged byDALIT status. The odds of farmers with a CHANNELresponding with an additional ‘yes’ to the questions onprocedural fairness was nearly 30 times the odds of those
Ecology and Society 16(4): 1http://www.ecologyandsociety.org/vol16/iss4/art1/
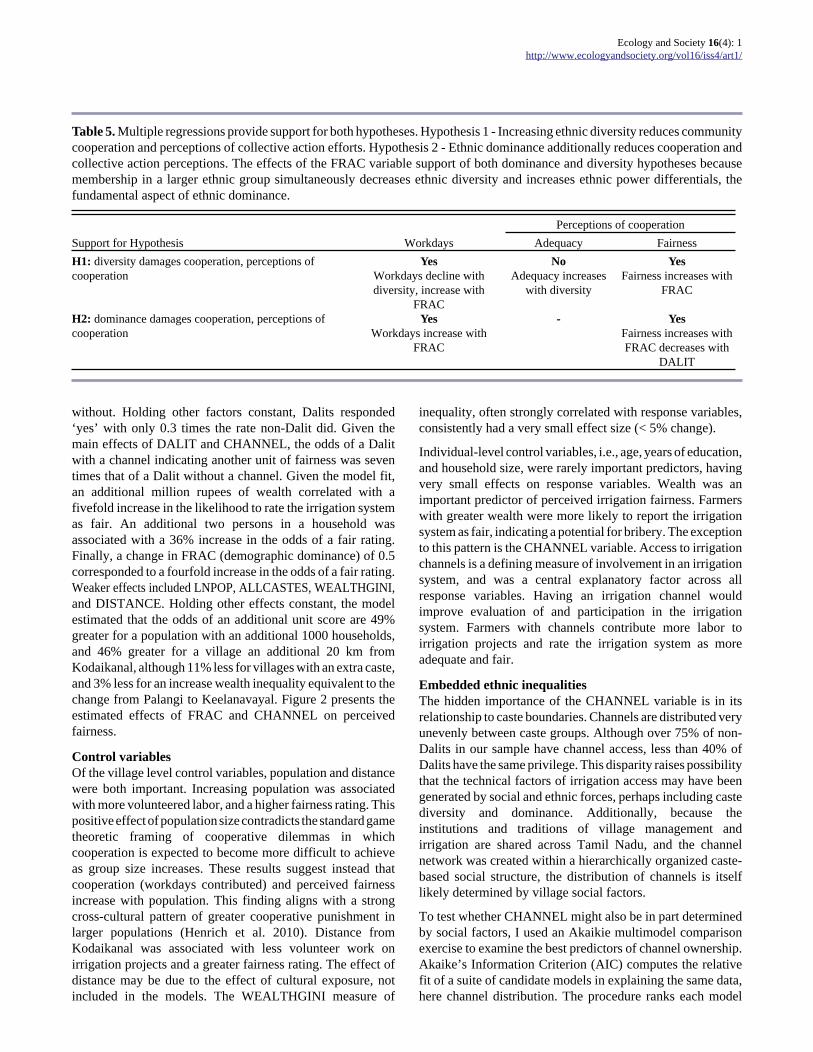
Table 5. Multiple regressions provide support for both hypotheses. Hypothesis 1 - Increasing ethnic diversity reduces communitycooperation and perceptions of collective action efforts. Hypothesis 2 - Ethnic dominance additionally reduces cooperation andcollective action perceptions. The effects of the FRAC variable support of both dominance and diversity hypotheses becausemembership in a larger ethnic group simultaneously decreases ethnic diversity and increases ethnic power differentials, thefundamental aspect of ethnic dominance.
Perceptions of cooperationSupport for Hypothesis Workdays Adequacy FairnessH1: diversity damages cooperation, perceptions ofcooperation
YesWorkdays decline withdiversity, increase with
FRAC
NoAdequacy increases
with diversity
YesFairness increases with
FRAC
H2: dominance damages cooperation, perceptions ofcooperation
YesWorkdays increase with
FRAC
- YesFairness increases withFRAC decreases with
DALIT
without. Holding other factors constant, Dalits responded‘yes’ with only 0.3 times the rate non-Dalit did. Given themain effects of DALIT and CHANNEL, the odds of a Dalitwith a channel indicating another unit of fairness was seventimes that of a Dalit without a channel. Given the model fit,an additional million rupees of wealth correlated with afivefold increase in the likelihood to rate the irrigation systemas fair. An additional two persons in a household wasassociated with a 36% increase in the odds of a fair rating.Finally, a change in FRAC (demographic dominance) of 0.5corresponded to a fourfold increase in the odds of a fair rating.Weaker effects included LNPOP, ALLCASTES, WEALTHGINI,and DISTANCE. Holding other effects constant, the modelestimated that the odds of an additional unit score are 49%greater for a population with an additional 1000 households,and 46% greater for a village an additional 20 km fromKodaikanal, although 11% less for villages with an extra caste,and 3% less for an increase wealth inequality equivalent to thechange from Palangi to Keelanavayal. Figure 2 presents theestimated effects of FRAC and CHANNEL on perceivedfairness.
Control variablesOf the village level control variables, population and distancewere both important. Increasing population was associatedwith more volunteered labor, and a higher fairness rating. Thispositive effect of population size contradicts the standard gametheoretic framing of cooperative dilemmas in whichcooperation is expected to become more difficult to achieveas group size increases. These results suggest instead thatcooperation (workdays contributed) and perceived fairnessincrease with population. This finding aligns with a strongcross-cultural pattern of greater cooperative punishment inlarger populations (Henrich et al. 2010). Distance fromKodaikanal was associated with less volunteer work onirrigation projects and a greater fairness rating. The effect ofdistance may be due to the effect of cultural exposure, notincluded in the models. The WEALTHGINI measure of
inequality, often strongly correlated with response variables,consistently had a very small effect size (< 5% change).
Individual-level control variables, i.e., age, years of education,and household size, were rarely important predictors, havingvery small effects on response variables. Wealth was animportant predictor of perceived irrigation fairness. Farmerswith greater wealth were more likely to report the irrigationsystem as fair, indicating a potential for bribery. The exceptionto this pattern is the CHANNEL variable. Access to irrigationchannels is a defining measure of involvement in an irrigationsystem, and was a central explanatory factor across allresponse variables. Having an irrigation channel wouldimprove evaluation of and participation in the irrigationsystem. Farmers with channels contribute more labor toirrigation projects and rate the irrigation system as moreadequate and fair.
Embedded ethnic inequalitiesThe hidden importance of the CHANNEL variable is in itsrelationship to caste boundaries. Channels are distributed veryunevenly between caste groups. Although over 75% of non-Dalits in our sample have channel access, less than 40% ofDalits have the same privilege. This disparity raises possibilitythat the technical factors of irrigation access may have beengenerated by social and ethnic forces, perhaps including castediversity and dominance. Additionally, because theinstitutions and traditions of village management andirrigation are shared across Tamil Nadu, and the channelnetwork was created within a hierarchically organized caste-based social structure, the distribution of channels is itselflikely determined by village social factors.
To test whether CHANNEL might also be in part determinedby social factors, I used an Akaikie multimodel comparisonexercise to examine the best predictors of channel ownership.Akaike’s Information Criterion (AIC) computes the relativefit of a suite of candidate models in explaining the same data,here channel distribution. The procedure ranks each model

Ecology and Society 16(4): 1http://www.ecologyandsociety.org/vol16/iss4/art1/
Fig. 2. Influences on perceived fairness. LEFT: the estimated probability of a fair rating given different relative sizes of therespondent’s caste within a village (FRAC). Probability estimates show that non-Dalit fairness perceptions climb faster thanDalit perceptions with increasing demographic strength. Estimates are for individuals with no channel access, because thosewith access reliably rated the irrigation system as very fair. RIGHT: the effects of Dalit status and channel access onperceptions of fairness in irrigation, 95% confidence intervals. The term Dalit refers to the servant groups also termedHarijan, untouchable, or Scheduled Caste/Tribe.
with an Akaike weight, the sum of which equals one. Themodel with the largest Akaike weight has the least meansquared error in the candidate set of models. The AICc variantadditionally penalizes models for additional parameters,which reduces overfitting (Burnham and Anderson 2002).Five candidate logistic regression models used differentvariable combinations. ‘Base’ included no predictors,‘village’ included only village level predictors, ‘individual,’only individual level variables, ‘all,’ all variables, and‘inequality,’ only included FRAC, DALIT, LNWEALTH, andWEALTHGINI. Models were ranked for predictive accuracyusing the df-penalized AICc (Table 6).
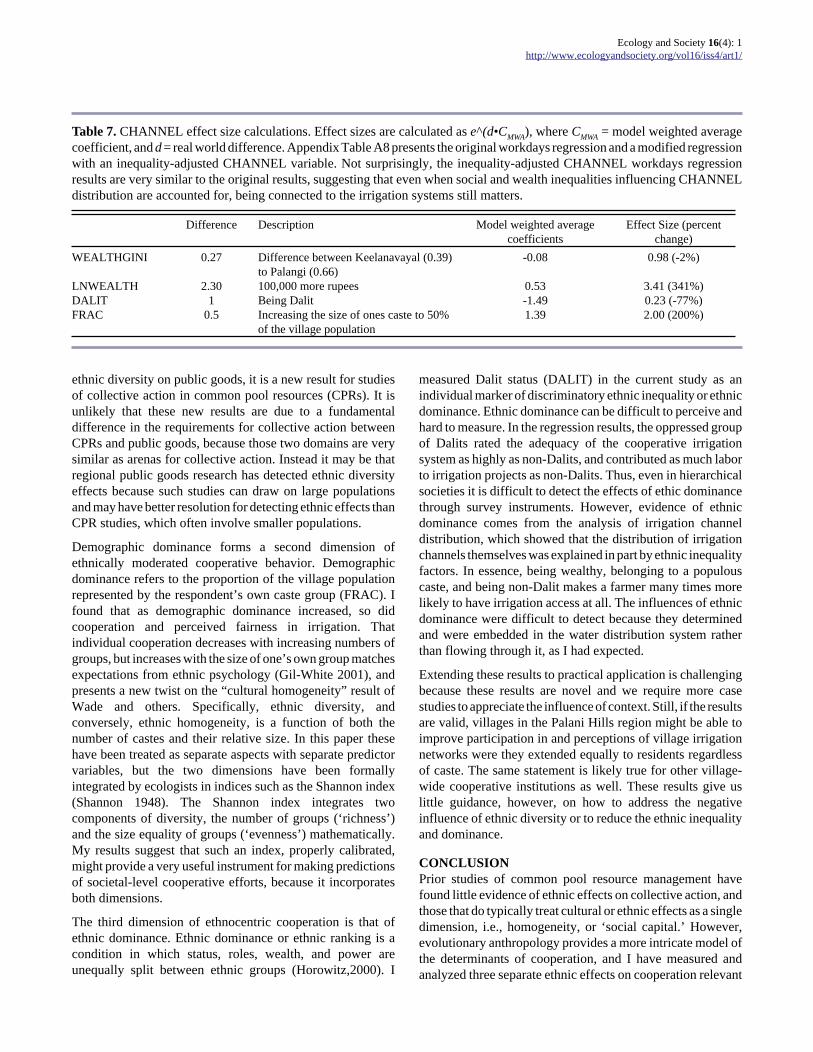
Inequality was best-fit model with an Akaike weight of 0.97.The second best-fit model was individual with an Akaikeweight of 0.01. This model comparison demonstrates thataccess to irrigation channels is uneven, and that wealth,demographic dominance, and Dalit status may drive channelaccess. Table 7 summarizes the effects of inequality variableson the chances of having channel access. The effect of wealthinequality is small, with a change in WEALTHGINIequivalent to moving from Keelanavayal to Palangicorresponding to a 2% reduction in chances of having achannel. Wealth has a large effect, having a 100,000 more
rupees makes a farmer 3.4 times more likely to have a channel.Increasing the demographic dominance of one’s caste to 50%of village population is associated with twice the odds ofhaving a channel. Finally, being a DALIT reduces one’schances of having a channel by 77%, all else being equal. Itis worth noting that the AIC procedure did not weight modelsincluding CASTES highly, suggesting that caste diversity doesnot play the decisive role that Dalit status, wealth, and ethnicdemographic inequalities do.
That factors of inequality best explain the distribution ofchannels among people in these six villages inflects theinterpretation of the CHANNEL effect in the original threemodels. Instead of a strong influence of a nonsocial economicforce, we must interpret the original CHANNEL effect aspartly a social effect itself, linked to wealth and caste-basedinequality. This interpretation is further supported byanecdotal evidence on the nature of Dalit livelihoods.
Responses to the survey question “How does your caste affectyou?” provide an incisive view of the lives and status of Dalitvillagers in the region. A Dalit man in Keelanavayalinterviewed in his house mentioned that the village justicesystem is very strict. If anyone makes a mistake, the villageheadmen will offer advice, and if that advice is not followed,

Ecology and Society 16(4): 1http://www.ecologyandsociety.org/vol16/iss4/art1/
Table 6. AICc multimodel selection results. Akaike weights and coefficients for five logistic regression models predictingCHANNEL distribution. The last two columns on the right provide model weighted average coefficients and relative variableimportance measures for each variable (Burnham and Anderson 2002). The inequality model captured the largest Aikaike weight,and best explains the distribution of irrigation channels.
Inequality Individual All Base Village Modelweightedaverage
Relative variableimportance
weight 0.97 0.01 0.01 0.00 0.00AICc 258.2 266.6 266.8 318.5 319.4df 6 8 12 2 6
LNPOP - - 0.13 - 0.01 0.00 0.01DISTANCE - - 0.02 - 0.01 0.00 0.01
CASTES - - 0.01 - 0.09 0.00 0.01WEALTHGINI -0.08 - -0.07 - -0.03 -0.08 0.99
AGE - 0.01 0.02 - - 0.00 0.03EDUC - 0.06 0.07 - - 0.00 0.03
HHSIZE - -0.07 -0.07 - - 0.00 0.03LNWEALTH 0.53 0.54 0.52 - - 0.53 1.00
DALIT -1.50 -1.28 -1.24 - - -1.49 1.00FRAC 1.39 0.73 1.65 - - 1.39 1.00
they will be beaten. This sort of response was not uncommon,but during the interview a neighbor kept urging the farmer notrelate these facts out of fear of being exposed and punished.Another Keelanavayal Dalit expressed the same dismay overoppression in his village.
We must go to Kukkal [a different village] to borrowor rent equipment, no one will share with us here.Only other SC [Dalits] will trade labor with us, noone else. We are treated very badly here. Anyproblem is cause for the high caste people to beatthe SC [Dalits].
A Dalit farmer in Kumbur related that he prefers not to havea channel connection and the associated contact with theirrigation system because he is afraid of beatings from highcaste people. These responses contrast markedly from thetypical non-Dalit response, recorded verbatim many times,“Caste causes no problems for us.” In many cases non-Dalitsactively noted their own caste rank, “We are high caste, so wehave no problems here.” A Dalit farmer from Poombarairelated that the high castes restrict the education of Dalits, anda Dalit man from Keelanavayal confirms the pattern.
Sometimes high caste people treat us very badly.That is, we depend financially on high castes, thegovernment does not give us proper support, and thehigh caste people restrict SC [Dalit] education.
A Dalit farmer from Pallangi describes some of the myriadtypes of restrictions on Dalit life.
We are not allowed to speak in Podhu Kootam[village council meetings]. The village people will
not solicit money from SC people for templeimprovement work. In this village SC people do nothave land for irrigation.
These excerpts contrast bitterly with the perspective ofindividuals who belong to powerful castes, such as a Manadiarman from Poombarai, “We share water, but the SC and ST[Dalits] are not allowed.”
Given these sorts of reports, and the rarity with which newchannels are created (no interviewee reported channels beingcreated more recently than 20 year ago), a likely interpretationis that caste-driven inequities are embedded in the channeldistribution itself, rather than in the water distribution thosechannels provide, a pattern which has been detected byqualitative ethnographic work on elite privilege and wateraccess (Mosse 2006). Model selection results and surveyevidence on Dalit discrimination support Hypothesis 2 – ethnicdominance damages collective action efforts.
DISCUSSIONThese results reveal a larger scope for interethnic relationshipsthan previous studies of collective action in common poolresources scenarios have observed. In particular, the threevariables of central concern, CASTES, DALIT, and FRACdescribe three dimensions of ethnocentric cooperation, andtell a clear story of how ethnic effects influence cooperationand collective action in real-world economic institutions.
First, in the regression analysis, increasing caste diversity(CASTES) decreases cooperation markedly, and is associatedwith a reduction in fairness. Although this finding parallelsthe literature in development economics on the influence of
Ecology and Society 16(4): 1http://www.ecologyandsociety.org/vol16/iss4/art1/
Table 7. CHANNEL effect size calculations. Effect sizes are calculated as e^(d•CMWA), where CMWA = model weighted averagecoefficient, and d = real world difference. Appendix Table A8 presents the original workdays regression and a modified regressionwith an inequality-adjusted CHANNEL variable. Not surprisingly, the inequality-adjusted CHANNEL workdays regressionresults are very similar to the original results, suggesting that even when social and wealth inequalities influencing CHANNELdistribution are accounted for, being connected to the irrigation systems still matters.
Difference Description Model weighted averagecoefficients
Effect Size (percentchange)
WEALTHGINI 0.27 Difference between Keelanavayal (0.39)to Palangi (0.66)
-0.08 0.98 (-2%)
LNWEALTH 2.30 100,000 more rupees 0.53 3.41 (341%)DALIT 1 Being Dalit -1.49 0.23 (-77%)FRAC 0.5 Increasing the size of ones caste to 50%
of the village population1.39 2.00 (200%)
ethnic diversity on public goods, it is a new result for studiesof collective action in common pool resources (CPRs). It isunlikely that these new results are due to a fundamentaldifference in the requirements for collective action betweenCPRs and public goods, because those two domains are verysimilar as arenas for collective action. Instead it may be thatregional public goods research has detected ethnic diversityeffects because such studies can draw on large populationsand may have better resolution for detecting ethnic effects thanCPR studies, which often involve smaller populations.
Demographic dominance forms a second dimension ofethnically moderated cooperative behavior. Demographicdominance refers to the proportion of the village populationrepresented by the respondent’s own caste group (FRAC). Ifound that as demographic dominance increased, so didcooperation and perceived fairness in irrigation. Thatindividual cooperation decreases with increasing numbers ofgroups, but increases with the size of one’s own group matchesexpectations from ethnic psychology (Gil-White 2001), andpresents a new twist on the “cultural homogeneity” result ofWade and others. Specifically, ethnic diversity, andconversely, ethnic homogeneity, is a function of both thenumber of castes and their relative size. In this paper thesehave been treated as separate aspects with separate predictorvariables, but the two dimensions have been formallyintegrated by ecologists in indices such as the Shannon index(Shannon 1948). The Shannon index integrates twocomponents of diversity, the number of groups (‘richness’)and the size equality of groups (‘evenness’) mathematically.My results suggest that such an index, properly calibrated,might provide a very useful instrument for making predictionsof societal-level cooperative efforts, because it incorporatesboth dimensions.
The third dimension of ethnocentric cooperation is that ofethnic dominance. Ethnic dominance or ethnic ranking is acondition in which status, roles, wealth, and power areunequally split between ethnic groups (Horowitz,2000). I
measured Dalit status (DALIT) in the current study as anindividual marker of discriminatory ethnic inequality or ethnicdominance. Ethnic dominance can be difficult to perceive andhard to measure. In the regression results, the oppressed groupof Dalits rated the adequacy of the cooperative irrigationsystem as highly as non-Dalits, and contributed as much laborto irrigation projects as non-Dalits. Thus, even in hierarchicalsocieties it is difficult to detect the effects of ethic dominancethrough survey instruments. However, evidence of ethnicdominance comes from the analysis of irrigation channeldistribution, which showed that the distribution of irrigationchannels themselves was explained in part by ethnic inequalityfactors. In essence, being wealthy, belonging to a populouscaste, and being non-Dalit makes a farmer many times morelikely to have irrigation access at all. The influences of ethnicdominance were difficult to detect because they determinedand were embedded in the water distribution system ratherthan flowing through it, as I had expected.
Extending these results to practical application is challengingbecause these results are novel and we require more casestudies to appreciate the influence of context. Still, if the resultsare valid, villages in the Palani Hills region might be able toimprove participation in and perceptions of village irrigationnetworks were they extended equally to residents regardlessof caste. The same statement is likely true for other village-wide cooperative institutions as well. These results give uslittle guidance, however, on how to address the negativeinfluence of ethnic diversity or to reduce the ethnic inequalityand dominance.
CONCLUSIONPrior studies of common pool resource management havefound little evidence of ethnic effects on collective action, andthose that do typically treat cultural or ethnic effects as a singledimension, i.e., homogeneity, or ‘social capital.’ However,evolutionary anthropology provides a more intricate model ofthe determinants of cooperation, and I have measured andanalyzed three separate ethnic effects on cooperation relevant

Ecology and Society 16(4): 1http://www.ecologyandsociety.org/vol16/iss4/art1/
to the anthropological theory here, namely ethnic dominance,and two dimensions of ethnic diversity, i.e., number of groupsand relative sizes of groups.
Because caste is uniquely differentiated and hierarchical, itmay be easier to detect ethnic effects in India than in othersocieties. Nonetheless, Indian caste is a special case of ethnicidentity, and the anthropological theories of cooperation arevery general, and suggest that such mechanisms operate in allpopulations. So, in any multiethnic region, two separate butrelated factors of cooperation need to be addressed beyond thestandard socioeconomic predictors; (1) the amount of sharedsocial identity, which declines with increasing group numbersand increases with population skew between groups, and (2)ethnic inequalities in power, status, roles, and wealth. Thesefactors can, at least in some cases, be distinguished from theecological and economic drivers, and may prove veryinfluential in determining social outcomes across societies andat multiple scales.
Many questions remain. Does ethnic diversity or ethnicdominance cause greater reductions in cooperation? A robustand general answer to this question would help in practicalapplications by clarifying the cooperative factor of primaryimportance. Can institutions be structured so that multiethnicsocieties do not pay a cooperative cost for being diverse? Caninstitutions be structured so that ethnic differences do notgenerate ethnic inequalities and lead to the injustice andinefficiencies of ethnic dominance? These questions can onlybe addressed through rigorous, quantitative, cross-culturalresearch.
Responses to this article can be read online at:http://www.ecologyandsociety.org/vol16/iss4/art1/responses/
Acknowledgments:
I thank the farmers in Vilpatti, Palangi, Poombarai,Manavanur, Kumbur, and Keelanavayal, as well as V.P.Vetrivel for assistance, Mark Lubell for guidance, and MarkGrote for statistical advice. I have no conflicts of interest. Thisresearch was supported by the National Science Foundation,Award # BCS0823416.
LITERATURE CITEDAgrawal, A. 2002. Common resources and institutionalsustainability. Pages 41-85 in E. Ostrom, T. Dietz, N. Dolsak,P. C. Stern, S. Stonich, and E. U. Weber, editors. The dramaof the commons. National Academies Press, Washington, D.C., USA
Alesina, A., R. Baqir, and W. Easterly. 1999. Public goodsand ethnic divisions. The Quarterly Journal of Economics 114(4):1243-1284. http://dx.doi.org/10.1162/003355399556269
Bahadur, R. D., and S. K. Aiyangar. 1942. Some contributionof South India to Indian culture. Calcutta UniversityReadership Lectures, University of Calcutta, Calcutta, India.
Baland, J., P. Bardhan, and S. Bowles, editors. 2007.Inequality, cooperation, and environmental sustainability. Princeton University Press, Princeton, New Jersey, USA.
Bardhan, P. 2000. Irrigation and cooperation: an empiricalanalysis of 48 irrigation communities in South India.Economic Development and Cultural Change 48(4):847-865.http://dx.doi.org/10.1086/452480
Bardhan, P., and J. Dayton-Johnson. 2000. Heterogeneity andcommons management. In Proceedings of the 8thInternational Conference on Common Property. InternationalAssociation for the Study of Common Property (IASCP),Bloomington, Indiana, USA.
Bardhan, P., and J. Dayton-Johnson. 2002. Unequal irrigators:heterogeneity and commons management in large-scalemultivariate research. Pages 87-112 in E. Ostrom, T. Dietz,N. Dolsak, P. C. Stern, S. Stonich, and E. U. Weber, editors.The drama of the commons. National Academies Press,Washington, D.C., USA.
Bardhan, P., and J. Dayton-Johnson. 2007. Inequality and thegovernance of water resources in Mexico and South India.Pages 97-130 in J.-M. Baland, P. Bardhan, and S. Bowles,editors. Inequality, cooperation, and environmentalsustainability. Oxford University Press, Oxford, UK.
Bernhard, H., U. Fischbacher, and E. Fehr. 2006. Parochialaltruism in humans. Nature 442(7105):912-915. http://dx.doi.org/10.1038/nature04981
Borgerhoff Mulder, M., S. Bowles, T. Hertz, A. Bell, J. Beise,G. Clark, I. Fazzio, I., M. Gurven, K. Hill, P. L. Hooper, W.Irons, H. Kaplan, D. Leonetti, B. Low, F. Marlowe, R.McElreath, S. Naidu, D. Nolin, P. Piraino, R. Quinlan, E.Schniter, R. Sear, M. Shenk, E. Alden Smith, C. von Rueden,and P. Wiessner. 2009. Intergenerational wealth transmissionand the dynamics of inequality in small-scale societies.Science 326(5953):682-688. http://dx.doi.org/10.1126/science.1178336
Burnham, K. P., and R. D. Anderson. 2002. Model selectionand multimodel inference: a practical information-theoreticapproach. Second Edition. Springer-Verlag, New York, NewYork, USA.
Choi, J., and S. Bowles. 2007. The coevolution of parochialaltruism and war. Science 318:636-640. http://dx.doi.org/10.1126/science.1144237
Collier, P. 2001. Implications of ethnic diversity. EconomicPolicy 16(32):127-166. http://dx.doi.org/10.1111/1468-0327.00072

Ecology and Society 16(4): 1http://www.ecologyandsociety.org/vol16/iss4/art1/
Dumont, L. 1970. Homo Hierarchicus: the caste system andits implications. University of Chicago Press, Chicago,Illinois, USA.
Easterly, W., R. Levine, and B. Mundial. 1995. Africa’s growthtragedy. World Bank, Washington, D.C., USA.
Efferson, C., R. Lalive, and E. Fehr. 2008. The coevolution ofcultural groups and ingroup favoritism. Science 321(5897):1844-1849. http://dx.doi.org/10.1126/science.1155805
Feeny, D., F. Berkes, B. J. McCay, and J. M. Acheson. 1990.The tragedy of the commons: twenty-two years later. HumanEcology 18(1):1-19. http://dx.doi.org/10.1007/BF00889070
Fehr, E., and S. Gächter. 2002. Altruistic punishment inhumans. Nature 415:137-140. http://dx.doi.org/10.1038/415137a
Fehr, E., S. Gächter, and G. Kirchsteiger. 1997. Reciprocityas a contract enforcement device: experimental evidence.Econometrica 65(4):833-860. http://dx.doi.org/10.2307/2171941
Fiedler, F. E. 1966. The effect of leadership and culturalheterogeneity on group performance: a test of the contingencymodel. Journal of Experimental Social Psychology 2(3):237-264. http://dx.doi.org/10.1016/0022-1031(66)90082-5
Fox, J., and G. Monette. 1992. Generalized collinearitydiagnostics. Journal of the American Statistical Association 87(417):178-183. http://dx.doi.org/10.2307/2290467
Francis, W. 1914. Gazetteer of the Madura District. MadrasDistrict Gazetteers (Vol. 1). Madras Government Press, TamilNadu, India.
Gil-White, F. J. 2001. Are ethnic groups biological “species”to the human brain? Essentialism in our cognition of somesocial categories. Current anthropology 42(4):515-553. http://dx.doi.org/10.1086/321802
Gintis, H. 2000. Strong reciprocity and human sociality.Journal of Theoretical Biology 206(2):169-179. http://dx.doi.org/10.1006/jtbi.2000.2111
Gintis, H., S. Bowles, R. Boyd, and E. Fehr. 2003. Explainingaltruistic behavior in humans. Evolution and Human Behavior 24(3):153-172. http://dx.doi.org/10.1016/S1090-5138(02)00157-5
Habyarimana, J., M. Humphreys, D. N. Ponser, and J. M.Weinstein. 2007. Why does ethnic diversity undermine publicgoods provision? American Political Science Review 101(4):709-725. http://dx.doi.org/10.1017/S0003055407070499
Hardin, G. 1968. The tragedy of the commons. Science 162(3859):1243-1248. http://dx.doi.org/10.1126/science.162.3859.1243
Henrich, J., and R. Boyd. 2008. Division of labor, economicspecialization, and the evolution of social stratification.Current Anthropology 49(4):715-724. http://dx.doi.org/10.1086/587889
Henrich, J., R. Boyd, S. Bowles, C. Camerer, E. Fehr, H.Gintis, and R. McElreath. 2004. Foundations of humansociality: economic experiments and ethnographic evidencefrom fifteen small-scale societies. Oxford University Press,Oxford, UK.
Henrich, J., J. Ensminger, R. McElreath, A. Barr, C. Barrett,A. Bolyanatz, J. C. Cardenas, M. Gurven, E. Gwako, N.Henrich, C. Lesorogol, F. Marlowe, D. Tracer, and J. Ziker.2010. Markets, religion, community size, and the evolution offairness and punishment. Science 327:1480-1484. http://dx.doi.org/10.1126/science.1182238
Horowitz, D. L. 2000. Ethnic groups in conflict. SecondEdition. University of California Press, Berkeley, California,USA.
Lindsey, J. K. 1999. On the use of corrections foroverdispersion. Applied Statistics 48(4):553–561. http://dx.doi.org/10.1111/1467-9876.00171
Mangubhai, J. P., and A. Irudayam. 2000. Dalit human rightsviolations: atrocities against Dalits in India, vol. 1. NationalCampaign on Dalit Human Rights, New Delhi, India. [online]URL: http://www.cscsarchive.org:8081/MediaArchive/Library.nsf/%28docid%29/A9C601373F9 2679F6525706700349DA7?OpenDocument&StartKey=Dalit&count=50
Miguel, E., and M. K. Gugerty. 2005. Ethnic diversity, socialsanctions, and public goods in Kenya. Journal of PublicEconomics 89(11-12):2325-2368. http://dx.doi.org/10.1016/j.jpubeco.2004.09.004
Milanovic, B. 1997. A simple way to calculate the Ginicoefficient, and some implications. Economics Letters 56(1):45-49. http://dx.doi.org/10.1016/S0165-1765(97)00101-8
Mosse, D. 2006. Collective action, common property, andsocial capital in South India: an anthropological commentary.Economic Development and Cultural Change 54(3):695-724.http://dx.doi.org/10.1086/500034
Nowak, M. A., and K. Sigmund. 2005. Evolution of indirectreciprocity. Nature 437:1291–1298. http://dx.doi.org/10.1038/nature04131
Olson, M. 1965. The logic of collective action: public goodsand the theory of groups. Harvard University Press,Cambridge, Massachusetts, USA.

Ecology and Society 16(4): 1http://www.ecologyandsociety.org/vol16/iss4/art1/
Ostrom, E. 1990. Governing the commons: the evolution ofinstitutions for collective action. Cambridge University Press,Cambridge, UK.
Ostrom, E. 2007. A diagnostic approach for going beyondpanaceas. Proceedings of the National Academy of Sciences 104 (39):15181-15187. http://dx.doi.org/10.1073/pnas.0702288104
Ostrom, E., J. Walker, and R. Gardner. 1992. Covenants withand without a sword: self-governance is possible. AmericanPolitical Science Review 86(2):404-417. http://dx.doi.org/10.2307/1964229
Registrar General & Census Commissioner, India. 2001.Census of India. New Delhi, India.
Richerson, P. J., and R. Boyd. 2005. Not by genes alone: howculture transformed human evolution. University of ChicagoPress, Chicago, Illinois, USA.
Ruttan, L. M. 2006. Sociocultural heterogeneity and thecommons. Current Anthropology 47(5):843-853. http://dx.doi.org/10.1086/507185
Shannon, C. E. 1948. A mathematical theory ofcommunication. Bell System Technical Journal 27(1):379-423, 623-656.
Varughese, G., and E. Ostrom. 2001. The contested role ofheterogeneity in collective action: some evidence fromcommunity forestry in Nepal. World Development 29(5):747-765. http://dx.doi.org/10.1016/S0305-750X(01)00012-2
Wade, R. 1988. Village republics. Cambridge UniversityPress, New York, New York, USA. [1] Keelanavayal (top 20% most wealthy own 60% of totalwealth) to Pallangi (top 20% most wealthy own 80% of totalwealth).

Ecology and Society 16(4): 1http://www.ecologyandsociety.org/vol16/iss4/art1/
APPENDIX This Appendix provides additional ethnographic information, population characteristics, sampling information, predictor and response variable details, and supplemental analyses.
Palani Hills Ethnography
These villages, originally settled by the Manadiar group, retain traditional governance institutions separate from the official government panchayat system. The similarity of these institutions to those on the Tamil plains (Mosse, 2006), oral tradition, and historical evidence (Francis, 1914, Bahadur and Aiyangar, 1942) all suggest that they are a cultural legacy of the Pandiya kingdom that the Manadiar brought with them when they migrated into the hills approximately six centuries ago (Francis, 1914).
Figure A 1. Study villages in the Palani Hills, Tamil Nadu, India.
Five months of ethnographic investigation on the social identity, oral history and village organization across the Upper Palani villages form the basis by which caste relationships were classified. Villages in the Palani hills region employ a traditional village organization system. Two central traditional institutions are the podhu kootam (village council), and neer nikam (village irrigators). In these villages most official roles are ascribed to by caste.
Caste structure in the Palani Hills region is centered on two focal caste groups at opposite ends of the power spectrum, which share a long history. The Manadiar caste are

Ecology and Society 16(4): 1http://www.ecologyandsociety.org/vol16/iss4/art1/ 1
in the center of village power; in most villages the Manadiar hold some or all of the hereditary leadership positions called thalaivarhal (literally, ‘headmen’), and their influence within the village justice system or Podhu Kootam (‘common crowd’). By contrast, the Sakkliyar, a Dalit group which shares a deep history with the Manadiar, having arrived around the same time as the Manadiar, have no formal power. For instance, women and Sakkliyar individuals are excluded from the semi-sacred village commons called the manthai where village meetings are held, and thereby physically blocking access to the space of village justice.
Leadership positions in the Palani Hills villages called thalaivar, or ‘headman’ are individually named, with multiple thalaivarhal per village. Common thalaivar titles include Manadiar (named for the founding caste), Manthiriar (sacred), and Periyathanam (‘large wealth’). For instance, in Poombari (one of the six study villages) the Manadiar position is occupied eponymously, while two further thalaivar positions are occupied by the Thevar (Periyathanam) and the Mudhaliar (Manthiriar ) elders. The Sakkliyar also bear traditional village servant positions, including the village crier (thandalkarar), the water controller (neer-nikam), and the festival celebrant (vettiyan). No middle castes hold any high-status or low-status traditional roles. These formal roles betray the historical caste-driven power asymmetry, and are summarized in Table 1.
In Palani Hills villages the traditional village leaders or thalaivar (literally, headmen) positions are occupied by the Manadiar, a historically dominant jathi, and secondary thalaivar positions (such as Periyathanam, Manthiriar, Maniyakarar, Kariyamanadi, and Pattakarar) are occupied by men from other powerful jathis.
Poombarai Mannavanur Kumbur Keelanavayal Vilpatti Pallangi
Thalaivarhal (leadership positions, inherited) Manadiar 1 Manadi 3 Manadi 5 Asari 3 Asari 4 Manadi 1 Manadi
Manthiriar 1 Mudali 1 Pillai 1 Chetti 1 Mudali 2 Pillai 1 Mudali Other* 1 Thevar 1 Manadi 1 Chetti 1 Reddi 1 Retti
Servant (servant positions, selected)
Thandalkarar 3 Dalit 1 Dalit 1 Dalit 1 Dalit 1 Dalit 1 Dalit Neer Nikam 4 Panchayat 5 Dalit 3 Dalit 2 any 3 any 0 Thandal
Vettiyan 20 Dalit 13 Dalit 15 Dalit 8 Dalit 16 Dalit 10 Dalit
Table A 1. Traditional village positions in the six study villages, by caste occupancy. Sakkliyar is the major Dalit caste in the Palani hills region. Servant positions are selected by the thalaivar ('headmen') for 1-3 yr terms *Other = Village specific thalaivar postions, including Periyathanam (wealthy leader), Maniyakarar, Kariyamanadi, Pattakarar, and Mem-, Chola-, Shantha-, Karu-manadi. Population characteristics
Of the surveyed heads of households, the average age was 46.7 with the youngest 19, and the oldest 87. The mean household size was 4.5 and the average years of education of the household head was 4.9, but over one quarter reported zero years of education, while one person reported 17 years. Of all household heads, four were women, and only 2% reported any additional occupation to farming.

Ecology and Society 16(4): 1http://www.ecologyandsociety.org/vol16/iss4/art1/ 2
The cost and availability of transport makes these villages very isolated. As a result many factors decline with the distance from Kodaikanal, including the mean years of household education. Mean household education starts from 6.7 yrs on average in Vilpatti, and declines by approximately one month per kilometer over the 44 miles to Keelanavayal, where the mean is 3 yrs lower on average (single correlation, R2 = 0.16). Similarly, yearly exposures to external culture (see Table 3 for variable description) shows a similar pattern starting from ~1500 yearly exposures in Vilpatti and Pallangi and effectively dropping nearly 16 exposures per mile to reach a yearly 803 exposures in Keelanavayal. Such a difference in exposure likely has a strong influence on the social norms of the people living in these villages. Agricultural income also declines with distance from Kodaikanal, dropping 66 Rs. from Vilpatti to Keelanavayal, a 30% reduction in daily pay.
In this region, aside from plowing with oxen, the agricultural enterprise is exclusively manual. Out of necessity, this splits individuals on any given day into the land owners and workers, or ‘coolies’. All individuals work on their own fields, if they own any, and 76% work on others fields as well. 94% of Dalits work as coolies, in comparison to 77% of Manadiar. On the hiring side, only 51% of Dalits hire others to work on their fields, while 92% of Manadair hire our their work. As a result, Dalits on average earn 7,660 Rs per year from coolie labor, while Manadiar average only 4,900 Rs. On average, dalits hire 194 worker-days of labor per year, while Manadiars hire 480 worker-days, well over double the Dalit figure. These caste-correlated inequalities are also born out in land ownership and wealth.
Villagers owned an average of 2.3 acres, with 1.31 acres of irrigated land. Mean Dalit land holding was 0.46 acres, while Manadiars owned 4.45 acres on average. Of the 45 households owning no land, 58% were Dalit. Of the 14 individuals owning five 5 or more acres all are middle and high castes. A comprehensive wealth estimation was calculated based upon items such as house, land, livestock and vehicle ownership (see table 3). Mean wealth was 398,790 Rs. for Dalits and 1,270,730 Rs. for Manadiar.
Each farmer was asked to rank the importance of six factors in determining their social identity. These factors were family, caste, religion, political parties, hometown, and occupation. There was a very clear trend in preferences within the entire sample. Out of a total of 6 points, family averaged 5.9, followed by occupation (5.0). The remaining categories had overlapping confidence regions but were as follows hometown (3.5), caste (2.6), religion (2.4), political (2.1). The clear, sample wide preference for family and occupation is relevant to the current study because caste was not even close to being a highly ranked component of reported social identity factors.

Ecology and Society 16(4): 1http://www.ecologyandsociety.org/vol16/iss4/art1/ 3
Village population households castes 10+ house hold castes n
average caste-wise household sample
Mannavanur 5029 762 8 4 43 33% Poombarai 4456 1262 11 8 69 14% Vilpatti 2032 508 10 6 58 13% Kumbur 1051 208 5 3 33 18% Keelanavayal 700 104 8 2 30 44% Pallangi 700 133 3 3 26 33%
Table A 2. Sampling strategy.
Keelanavayal Kumbur Mannavanur Pallangi Poombarai Vilpatti Sample
workdays 4.10 1.39 5.88 1.58 2.49 2.86 2.68 (11.66) (2.22) (8.33) (1.30) (1.59) (1.78) (2.86)
adequacy 2.23 1.06 2.16 1.92 2.11 2.00 1.97 (1.61) (1.03) (1.38) (1.72) (1.52) (1.51) (1.50)
fairness 3.40 2.35 3.60 0.65 2.56 2.69 2.64 (1.75) (2.22) (1.76) (1.50) (2.17) (1.98) (2.10)
Table A 3. Response variable summary statistics.
Workdays Adequacy
Workdays Adequacy 0.02
Fairness 0.17 0.25
Table A 4. Response variable correlations calculated using restricted maximum likelihood.
Population
(households) Distance
(km) Castes
(>10 hh) Wealth
Gini
Keelanavayal 104 44 2 0.39 Kumbur 208 39 3 0.46 Mannavanur 762 36 4 0.45 Pallangi 133 10 3 0.66 Poombarai 1262 18 8 0.49 Vilpatti 508 5 6 0.43
Table A 5. Village-level predictor and control variables.
Ecology and Society 16(4): 1http://www.ecologyandsociety.org/vol16/iss4/art1/ 4
Wealth Gini Distance Population
Castes >10 Castes All
Wealth Gini Distance -0.35
Population 0.01 -0.24 Castes >10 0.02 -0.60 0.89
Castes All -0.52 -0.30 0.75 0.81 Diversity H’ -0.49 -0.45 0.68 0.82 0.90
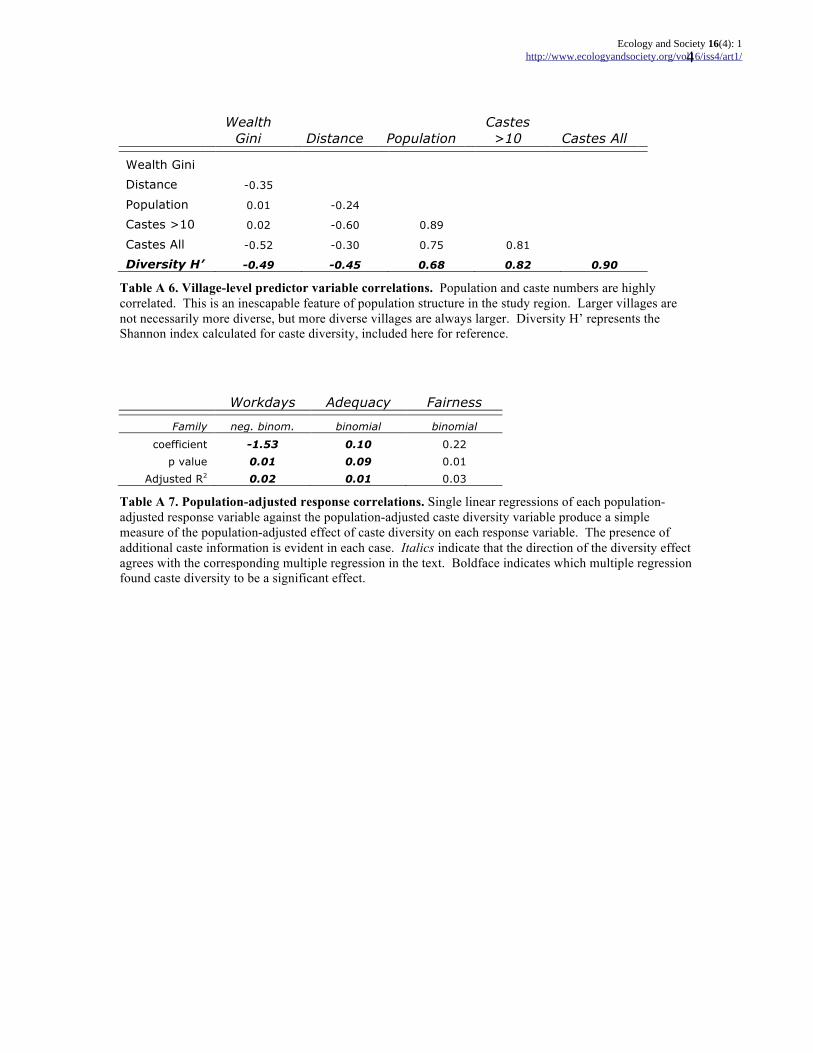
Table A 6. Village-level predictor variable correlations. Population and caste numbers are highly correlated. This is an inescapable feature of population structure in the study region. Larger villages are not necessarily more diverse, but more diverse villages are always larger. Diversity H’ represents the Shannon index calculated for caste diversity, included here for reference.
Workdays Adequacy Fairness
Family neg. binom. binomial binomial
coefficient -1.53 0.10 0.22 p value 0.01 0.09 0.01
Adjusted R2 0.02 0.01 0.03
Table A 7. Population-adjusted response correlations. Single linear regressions of each population-adjusted response variable against the population-adjusted caste diversity variable produce a simple measure of the population-adjusted effect of caste diversity on each response variable. The presence of additional caste information is evident in each case. Italics indicate that the direction of the diversity effect agrees with the corresponding multiple regression in the text. Boldface indicates which multiple regression found caste diversity to be a significant effect.

Ecology and Society 16(4): 1http://www.ecologyandsociety.org/vol16/iss4/art1/ 5
(a) Inequality-Adjusted
Workdays Model
(b) Non-adjusted
Workdays Model
Estimate SE z p Estimate SE z p (Intercept) -1.41 0.83 -1.70 0.088 . (Intercept) -1.58 0.83 -1.90 0.057 . LNPOP 0.80 0.15 5.22 0.000 *** LNPOP 0.77 0.15 5.03 0.000 *** DISTANCE -0.01 0.01 -2.19 0.028 * DISTANCE -0.01 0.01 -2.15 0.032 * CASTES10 -0.27 0.08 -3.59 0.000 *** CASTES10 -0.26 0.08 -3.44 0.001 *** WEALTHGINI -0.03 0.01 -2.89 0.004 ** WEALTHGINI -0.03 0.01 -2.38 0.017 * AGE 0.00 0.00 -0.29 0.776 AGE 0.00 0.00 -0.30 0.765 EDUYRS -0.01 0.02 -0.38 0.704 EDUYRS -0.01 0.02 -0.34 0.737 HHSIZE 0.06 0.04 1.28 0.201 HHSIZE 0.06 0.04 1.32 0.187 LNWEALTH 0.03 0.03 0.79 0.429 LNWEALTH -0.01 0.04 -0.38 0.705 FRAC 1.19 0.44 2.70 0.007 ** FRAC 1.14 0.44 2.58 0.010 ** DALIT -0.08 0.16 -0.51 0.609 DALIT -0.03 0.23 -0.15 0.885 CHANFIX 0.16 0.07 2.28 0.022 * CHANNEL 0.38 0.17 2.17 0.030 * DALIT:CHANFIX 0.01 0.14 0.06 0.953 DALIT:CHANNEL 0.12 0.31 0.38 0.703 Residual deviance: 310 on 241 degrees of freedom Residual deviance: 310 on 241 degrees of freedom AIC: 1060.4 AIC: 1060.0
Table A 8. CHANNEL-inequality-adjusted workdays regression comparison. Workdays negative binomial regression replicated with (a) and without (b) adjusted channel variable. CHANFIX is the inequality-adjusted version of the CHANNEL variable, ie the residuals of the AIC best fit model explaining CHANNEL distribution. Note that the changes in estimates and probabilities are small, and that CHANFIX remains and important explanatory factor, even when the embedded aspects of social inequality are removed. Other CHANNEL-inequality-adjusted regressions showed similar patterns.