ethnic minority graduates · graduates were consistently more likely to be employed and less likely...
TRANSCRIPT

ETHNIC MINORITY GRADUATES:DIFFERENCES BY DEGREES

2
Other titles from IES:
University Challenge: Student Choices in the 21st CenturyH Connor, R Pearson, G Court, N Jagger. Report 306, 1996ISBN 1-85184-232-2
What do Graduates Really do?H Connor, E Pollard. Report 308, 1996ISBN 1-85184-234-9
The Target for Higher Level Skills in an International ContextN Jagger, S Morris, R Pearson. Report 307, 1996ISBN 1-85184-233-0
The IES Annual Graduate Review 1995-96G Court, N Jagger, H Connor. Report 196, 1995ISBN 1-85184-218-7
The US Labour Market for New GraduatesG Court, H Connor. Report 267, 1994ISBN 1-85184-192-X
The Labour Market for PostgraduatesH Connor, N Jagger. Report 257, 1993ISBN 1-85184-180-6

ETHNIC MINORITYGRADUATES:
DIFFERENCES BY DEGREES
H Connor, I La Valle,N Tackey, S Perryman
THE INSTITUTE FOR EMPLOYMENT STUDIES Report 309

4
Published by:
THE INSTITUTE FOR EMPLOYMENT STUDIESMantell BuildingUniversity of SussexBrighton BN1 9RFUK
Tel. + 44 (0) 1273 686751Fax + 44 (0) 1273 690430
Crown Copyright © 1996
No part of this publication may be reproduced or used in any form by any means — graphic, electronicor mechanical including photocopying, recording, taping or information storage or retrieval systems —without prior permission in writing from the Institute for Employment Studies.
The views expressed in this report are those of the authors and not necessarily those of theDepartment for Education and Employment.
British Library Cataloguing-in-Publication Data
A catalogue record for this publication is available from the British Library
ISBN 1-85184-235-7

v
The Institute for Employment Studies
The Institute for Employment Studies is an independent,international centre of research and consultancy in humanresource issues. It has close working contacts with employers inthe manufacturing, service and public sectors, governmentdepartments, agencies, professional and employee bodies, andfoundations. Since it was established 25 years ago the Institutehas been a focus of knowledge and practical experience inemployment and training policy, the operation of labour marketsand human resource planning and development. IES is a not-for-profit organisation which has a multidisciplinary staff of over 60.IES expertise is available to all organisations through research,consultancy, training and publications.
IES aims to help bring about sustainable improvements inemployment policy and human resource management. IESachieves this by increasing the understanding and improving thepractice of key decision makers in policy bodies and employingorganisations.
Formerly titled the Institute of Manpower Studies (IMS), theInstitute changed its name to the Institute for Employment Studies(IES) in Autumn 1994, this name better reflecting the full range ofthe Institute’s activities and involvement.

vi
Contents
Executive Summary ix
1. Introduction 1
1.1 Background 11.2 Research aims and objectives 21.3 Methodology 21.4 Structure of the report 4
2. Ethnic Minorities and Higher Education 5
2.1 Population overview 52.2 Participation in higher education 62.3 Entry to the labour market 202.4 Summary 26
3. Graduates’ Progress in the Labour Market 28
3.1 Sample description 283.2 General overview 313.3 First job after graduation 333.4 Current employment 373.5 Unemployment 443.6 Further study 463.7 Career patterns 493.8 Conclusion 54
4. Invisible Barriers, Real Discrimination 57
4.1 Career profiles 574.2 Discrimination in employment 614.3 Organisational cultures and the acceptance of
diversity 624.4 Tokenism: ‘we’ve got two of those’ 644.5 Conclusion 65
5. Graduates and Higher Education 66
5.1 Educational background and work experiences 665.2 Entering higher education 675.3 The experience of higher education 715.4 Conclusion 75

vii
6. Graduate Recruitment: Employers’ Attitudes 78
6.1 Introduction 786.2 Representation of ethnic minorities 796.3 Recruitment and selection policies and practices 806.4 Training and career development 846.5 Equal opportunity policy and practice 876.6 Attitudes towards ethnic minority graduates 896.7 Summary 90
7. Summary and Conclusions 91
7.1 Ethnic minorities in higher education 917.2 Influences on participation in higher education 947.3 Experiences at university 957.4 Employment patterns 967.5 Employers’ views and practices 997.6 Conclusions 100
Bibliography 102
Appendix 1 Further Tables 107
Appendix 2 Survey Design and Response 108
Appendix 3 Questionnaire 115

viii

ix
Executive Summary
This research was a small-scale exploratory study, commissionedby the Department for Education and Employment (DfEE), whichinvestigated the employment outcomes and career progress ofethnic minority graduates from higher education. It drewcomparisons, where appropriate, between various ethnic minorityand white graduates in terms of their experiences in the labourmarket.
It comprised four main components: a review of available dataand research literature; a small survey of 1993 graduates (asample of 272 at four universities); follow-up interviews with asample of 25 ethnic minority survey respondents; and interviewswith ten major graduate recruiters. The research was undertakenbetween September 1995 and April 1996.
Ethnic minorities in higher education
Ethnic minorities are well represented overall in higher education,relative to their position in the UK population, but theirdistribution across the sector is uneven, especially betweeninstitutions.
Almost one in eight of all UK domiciled students at first degreelevel in 1994/95 were from ethnic minority groups (ie non-white),more than double their representation in the UK population (5.8per cent — but for 18 to 21 year olds slightly higher, at 8.0 percent). The largest ethnic minority group is Indian (27 per cent ofall UK domiciled ethnic minority students at first degree level),the smallest is Bangladeshi (just three per cent).
Ethnic minorities are better represented in the new (ie post-1992)universities, and particularly at a select few, where they accountfor over 30 per cent of UK domiciled undergraduates. Businessstudies and computer science are more popular degree subjectchoices for most ethnic minority groups than whites, whileeducation is generally less popular. There is also variation bygender and ethnic group, with women better represented amongAfrican-Caribbeans than Bangladeshis and Pakistanis. A higherproportion of mature students and students entering with non-traditional qualifications are found among some ethnic groups,

x
in particular black1 students where access and vocational entryqualifications are more common than among Asians.
Participation of ethnic minorities in higher education has beenincreasing over time. This trend needs to be seen in the context ofsome of the broader changes in higher education, in particular itsrecent rapid expansion, broadening range of provision anddelivery methods, and wider access.
Various factors have been identified in the research literature asexplaining the differential participation of ethnic groups, andtheir distribution patterns, in higher education. These include:differences by ethnic group in prior academic achievement andeducation routes; impact of early career guidance and subjectchoice; image and style of some universities; as well as personalfactors such as age, gender, home background, social class andfamily encouragement to progress to higher education.
The graduate interviews undertaken in this research confirmedthese factors as key influences on early career development. Inaddition, location was identified as a decisive factor in choosinga particular university, as was its attitude to ethnic minorities.
Employment patterns
From the limited existing research evidence on employmentoutcomes of ethnic minority first degree graduates (mainlyrelating to the 1980s), a number of areas of disadvantage couldbe identified. These included: greater difficulties for ethnicminority than white graduates in getting appropriate jobs; lesssatisfaction with career progress; and experiences of some directracial discrimination by employers. Other evidence, also mostlypre-1992, highlights higher unemployment levels among highlyqualified ethnic minority people compared to white people, anddifferences between individual ethnic minority groups.
The survey of 1993 graduates was designed to provide a moreup-to-date insight into employment outcomes and career progressof ethnic minority graduates, in particular to explore whether ornot significant differences existed between ethnic groups. Forvarious reasons the survey achieved a lower response rate (37per cent) and smaller sample size (272 graduates split equallybetween white and ethnic minorities, but matched by age,gender, new/old university and subject) than expected at theoutset, which limited the analysis possible. Also, the sample isbased on just four universities, and while illustrative of thedifferent kinds of ethnic minority graduates is not representativeof the population. The survey findings, therefore, need to be
1 Throughout the report the term ‘black’ will be used to indicatepeople in the combined African, African-Caribbean and black othergroups, and ‘Asian’ for the combined Indian, Pakistani, Chinese andother Asian groups.

xi
treated with caution. However, they do highlight some importantissues, in particular some marked differences between individualethnic minority groups, which warrant further investigationthrough larger scale survey work.
The main points arising from the survey are summarised below.
Degree outcomes. Similar proportions of ethnic minority andwhite graduates in the sample entered university with two‘A’ levels, and there was little difference in their average ‘A’level grades. However, black respondents had lower ‘A’ levelqualifications and more had entered via the vocational routethan other ethnic groups. Despite little difference in entryqualifications, ethnic minority graduates as a whole weremore likely to have obtained a lower class of degree thanwhites. However, this again varied between individual ethnicgroups, with black graduates in the sample doing less well atdegree level than Indians or Chinese graduates. Thesedifferences in degree outcomes, as well as in educationalroutes into higher education, are factors which affectemployment outcomes (see below) and would seem torequire further investigation.
Entry to the labour market. Ethnic minority graduates took longerto secure their first job after graduation. However, when classof degree was controlled for in the analysis, the differencereduced. Ethnic minority graduates also had to make morejob applications than whites.
First job. Ethnic minority graduates were more likely than whitesto be in a better paid job initially, but this may partly reflecttheir greater concentration in the London area (particularlyblack graduates). Small differences emerged between sectorof employment and occupational category of their first job.
Current job. By December 1995, some two and a half years aftergraduation, a higher proportion of ethnic minority than whitegraduates in the sample were in ‘professional’ jobs, but theinitial earnings differential had disappeared. Average salariesfor ethnic minorities were slightly lower than for whites, andparticularly low for black graduates. Even less difference wasseen in the employment sectors of current jobs than of initialjobs.
Career profiles. Over the two and a half year period, whitegraduates were consistently more likely to be employed andless likely to be unemployed, measured at six monthly pointsin time, than ethnic minority graduates, but the differenceswere small. Ethnic minority graduates also had more periodsof unemployment, and their longest period was of greateraverage duration. In addition, while the initial gap betweenthe two groups was small, it widened considerably in thesecond post-graduation year.
Job level and progress. More ethnic minorities than whitesreported that a degree was an entry requirement or was

xii
helpful in getting the job. On the other hand, there was littledifference in the extent to which the two groups felt their jobsrequired graduate level ability, and a higher proportion ofethnic minority graduates considered themselves to beslightly underemployed in their current job. Disappointmentwith the quality of jobs and employment opportunities waswidespread (for both groups). There were little significantdifferences between graduates’ experiences of applying andbeing considered for promotion, but whites were more likelyto have been promoted than ethnic minorities. With regard tofuture promotion prospects, variations emerged betweendifferent ethnic groups, with expectations being highestamong Indians and lowest among black respondents.
Unemployment. Ethnic minority graduates in the survey hadexperienced more periods of unemployment than whitegraduates in the period since graduation, and their longestperiod of unemployment was greater in duration on average.Graduates from ethnic minorities were considerably morelikely than white graduates to link employment difficulties tolack of suitable educational qualifications and skills, whilewhite graduates were more likely to blame labour marketfactors (eg competition, lack of vacancies).
Direct discrimination. Two out of five ethnic minority graduateshad experienced some racial discrimination in their presentjob, but generally not of a serious kind. Black graduates weretwice as likely than Asians to report having experienced someracial discrimination. Age discrimination was mentionedmore frequently by ethnic minority than white graduates inthe survey. Some of the interviewees also highlighted theexistence of some racial discrimination at university, albeit inmore subtle forms than earlier research had identified, whichwas felt to have had an influence on their degree performanceand post-graduation career. Some female ethnic minoritygraduates interviewed felt ‘doubly disadvantaged’, becauseof racial and sexual discrimination.
Career satisfaction. White graduates in the survey were moresatisfied with their careers to date than ethnic minoritygraduates. However, this varied between groups, with Indiansbeing the most satisfied, then whites, and blacks being leastsatisfied.
Employer perspective
There was no evidence found (nor expected) of directdiscrimination against ethnic minorities by companies in theirgraduate recruitment and development. However, a number ofareas in employment policies and practices were identified aslikely to put ethnic minority graduates at a disadvantage.Indications include:

xiii
the very low representation of ethnic minorities in somecompanies, especially in higher level jobs
the growth in graduates taking ‘non-graduate’ jobs, and theview that more ethnic minority graduates were likely to entercompanies this way. These jobs tend make less use ofgraduate level skills and abilities and are associated with lessstructured training and development than graduate trainee/entry programmes.
the trend towards graduate recruiters targeting a selectnumber of universities, often the more academic ones whichtraditionally have had low representation of ethnic minoritystudents
the use, in places, of pre-university education qualifications,type of university and class of degree in selection processes.This can disadvantage the ‘non-traditional’ graduate who ismore likely to be found in the ethnic minority graduatepopulation. The increasing use of competence-based criteria ingraduate selection may help to reduce such disadvantage.
the relatively unstructured nature of subsequent training anddevelopment in most companies, in comparison to morestructured initial training. This means that subjectiveassessments by managers play more of a role in selectingindividuals for continuing training and promotion, and canintroduce discrimination.
the varied support among senior managers of equalopportunities policies, and the differences in this respectbetween the public and the private sector
the general absence of any formal monitoring evidence and areliance on perceptions of managers in most companies, toassess the position of their ethnic minority graduates.
The interviews focused on large firms who were regularrecruiters of graduates but many of the points raised could beapplied generally to the range of large and small graduaterecruiters.
Conclusions
The research has shown that differences currently exist in thelabour market outcomes of graduates from different ethnicminority groups, though the evidence was not based on asufficiently large sample of graduates to draw firm conclusions.This, and the extent to which other related factors (eg degreeperformance, educational/social backgrounds, recruiters’selection methods) also play a role, need further investigationthrough larger scale survey work, covering both initialdestinations after graduation, and career progress. The researchalso highlighted other areas for further investigation, includingthe evaluation of specific initiatives to help ethnic minoritystudents and graduates in their career planning.


Ethnic Minority Graduates 1
1. Introduction
This is a report of research undertaken by the Institute forEmployment Studies (IES) on ethnic minority students in highereducation (HE) and their entry into and progress in the labourmarket. It was funded by the Department for Education andEmployment (DfEE) and carried out between September 1995and May 1996. Its main aim was to explore differences by ethnicorigin in graduate employment outcomes.
1.1 Background
Overall, Britain’s ethnic minorities accounted for an estimated11.5 per cent of all UK domiciled students at higher educationinstitutions (HEIs) in 1994/95, and 12.4 per cent of UK domiciledfirst year students on first degree study (HESA, 1995). Thiscompares with an ethnic minority representation of 5.6 per centin the total UK population. Admissions of ethnic minority (UKdomiciled) students to full-time first degree courses haveincreased from just over ten per cent in 1992 to an estimated 13per cent for 1995 entry (representing an intake in excess of 30,000students) (UCAS, 1994 and 1996). These aggregate figures,however, mask wide variations between individual ethnic groups,and by subject of study, and between individual institutions.
While participation of ethnic minorities in higher education hasbeen increasing overall, little is known about outcomes. Ethnicminorities generally continue to experience disadvantage in thelabour market compared to white people, though its extent isreducing over time (Jones, 1993). While it is apparent that peoplefrom particular ethnic groups are increasingly enteringmanagerial/professional occupations, the available evidence onthe employment of ethnic minority graduates, and the extent towhich they experience disadvantage on entry to the labourmarket, is sparse. Furthermore, higher education and thegraduate market have changed considerably over the last decade,both in terms of an increased supply of graduates and greaterdiversity within the student population, and a broadening ofdemand in terms of types of employers and jobs (Court, Jagger,Connor, 1995). These contextual changes are likely to haveaffected graduates from different ethnic groups in differentways.

The Institute for Employment Studies2
1.2 Research aims and objectives
The research study was undertaken to take stock of the availableevidence on ethnic minorities in higher education and theirlabour market outcomes, assess its relevance, and identify wheregaps lie. It was a small scale exploratory study which aimed toexplore differences by ethnic origin in:
trends in participation in higher education and factors ofinfluence
graduate employment patterns, in particular their entry to thelabour market and subsequent careers
attitudes and expectations of graduates about jobs andcareers, and issues relating to their career development
graduate recruitment policies and practices of employers andtheir attitudes to graduate recruits.
In addition, it assessed the feasibility of undertaking a largerscale study to measure the extent and nature of labour marketdisadvantage experienced by ethnic minority graduates.
1.3 Methodology
The research comprised four main elements:
1.3.1 Desk research
A review was carried out of previous research and analysis ofrelevant data on the participation of ethnic minorities in UKhigher education and their employment outcomes. This sought toanalyse the existing evidence and identify the key issues forinvestigation in the graduate survey and interviews.
1.3.2 Survey of graduates
A small follow-up survey of graduates was conducted in order toobtain more up-to-date information about employment outcomesand career progress of graduates from different ethnic groups.
The sample was based on the 1993 home first degree output fromfour universities, two established as universities pre-1992 andtwo post-1992 (ie former polytechnics). A large random sample of3,421 graduates from these four universities were sentquestionnaires in November/December 1995, some two and ahalf years after completing their first degree studies. A total of1,177 useable questionnaires were returned by the end of January1996, giving a response rate of 37 per cent. (A further 298questionnaires were received after the survey had been closed,giving a total response rate of 46 per cent).

Ethnic Minority Graduates 3
The achieved sample of 1,177 graduates contained 11 per centfrom ethnic minorities (136 respondents). These were matchedwith a sub-sample of white respondents by type of institution,degree subject, age and gender. Questionnaires from thismatched sample of 272 graduates were then analysed. (Fulldetails of the survey methodology and response rate are given inAppendix 2, and a copy of the questionnaire in Appendix 3.)
Both the overall response rate and the number of ethnic minoritygraduates in the achieved sample response were lower thanexpected at the outset, and they affect the usefulness of thesurvey findings. The low response rate was mainly due to theaddresses given by the universities being less accurate thanexpected. Other factors were the short timescale of the surveyand the need to enlist the assistance of the universities in mailingquestionnaires (for confidentiality reasons) which meant thatonly one reminder, rather than two as originally planned, couldbe sent.
The lower than anticipated proportion of ethnic minoritygraduates in the achieved sample arose mainly from thedifficulties in selecting a suitable sample of universities. Therewere conflicts in meeting the requirements that the sample shouldillustrate the institutional diversity within the HE sector andprovide high proportions of ethnic minority graduates. Therepresentation of ethnic minorities (UK domiciled studentpopulation only) varies markedly between institutions, from anestimated five per cent or less at some, to over 30 per cent atothers, and the pre-1992 universities tend to be at the lower endof the range. However, ethnic minority data on the studentpopulation have been collected nationally only since 1994/95,and are not published at an institutional level. Reliance, therefore,had to be put on estimates given by the universities rather thanactual data from student registrations. In the event, it seems thatan over-estimation was made by some of the universities of theproportion of ethnic minority graduates in 1993 (especiallyrelating to UK domiciled graduates). Bias in the response wasexplored but this does not seem to have been a significant factor.For further discussion about the survey response, see Appendix 2.
Because of the small sample size and the low response rate, theanalysis undertaken on the survey results has been more limitedthan initially planned. Although some of the findings need to betreated with caution, they do highlight interesting trends andidentify differences between ethnic groups which, taken withevidence from other parts of the research, provide insights intothe various labour market experiences of graduates from differentethnic backgrounds.
1.3.3 Interviews with graduates
Twenty five face-to-face interviews were undertaken withgraduates to explore attitudes and experiences, in particular, the

The Institute for Employment Studies4
influences on their career development, their career progress andsatisfaction. The graduates were selected from the surveyrespondents to cover a range of people from different ethnicminority groups and with different career profiles. The interviewswere useful in illustrating different experiences of ethnicminority graduates, and could explore some issues in greaterdepth than in the questionnaire survey.
1.3.4 Interviews with employers
Employers’ perspectives were sought via interviews with a smallsample of ten. They were mostly regular graduate recruiters andlarge organisations, drawn from a variety of sectors: manufac-turing, legal and business services, financial services, retail,transport, public services and the voluntary sector. Therespondent was, in the first instance, the graduate recruitmentmanager/officer, and subsequently, the equal opportunitymanager/officer.
In addition, views were obtained from university careersadvisers and members of the joint AGCAS/AGR group on equalopportunities (comprising employers and university careersadvisers) and from a number of professional bodies.
1.4 Structure of the report
The report is divided into six chapters:
Chapter 2 summarises the relevant earlier research and describesthe current pattern of participation of ethnic minorities in highereducation. It draws out the main issues from the existingresearch evidence and sets the scene for subsequent chapters.
Chapters 3, 4 and 5 present the findings from the graduatesurvey and interviews. Chapter 3 presents survey findings on thegraduates’ employment and careers to date, drawing out keydifferences between ethnic minority and white graduates, andbetween individual ethnic minority groups.
Chapters 4 and 5 cover in more detail the experiences ofgraduates from different ethnic groups and the influences ontheir progress into higher education and subsequent employment,drawing on both the survey and interview data.
Chapter 6 discusses the views from employers, and their recruit-ment practices and policies relating to ethnic minority graduates.
Chapter 7 summarises the main research findings and drawsconclusions.
Appendices include further details about the researchmethodology, including some supplementary data, surveyresponse and a copy of the survey questionnaire.

Ethnic Minority Graduates 5
2. Ethnic Minorities and Higher Education
This chapter summarises the existing evidence on theparticipation of ethnic minorities in higher education, their entryinto the labour market and their subsequent career progress. Theaim has not been to produce an exhaustive analysis, but to high-light the relevant literature and data and identify key issues forfurther investigation in the graduate survey and interviews, andemployer interviews. These findings are presented in subsequentchapters. This chapter is divided into four sections:
1. a brief overview of the distribution of ethnic minorities in theUK population, and general trends which have a bearing oneducation and employment patterns
2. a review of the evidence on participation of ethnic minoritiesin higher education, and the main factors influencing recentsupply trends
3. a review of the evidence on outcomes — graduation, thetransition into jobs and the position of ethnic minoritygraduates in the labour market
4. a summary of the key issues identified in the data andresearch literature.
2.1 Population overview
The total ethnic population in the UK is about 3.3 million,representing 5.8 per cent of the total population (LFS, Dec. 1995-Feb. 1996). It has been gradually increasing in size, from justunder five per cent of the population in 1988/90. Between 1981and 1990, ethnic minorities in the UK increased numerically by18 per cent (Jones, 1993).
The largest individual ethnic group are people of Indian ethnicorigin, making up 25 per cent of the total ethnic minoritypopulation; next largest are Pakistanis, 16 per cent, and theAfrican-Caribbean population, 15 per cent; while the smallestgroups are Bangladeshi, six per cent, and Chinese, four per cent.The balance between the individual ethnic groups is changingover time: African-Caribbeans are in decline, while theBangladeshi population is increasing (see Table A1.1, inAppendix 1 for trend data).
The age profile of the ethnic minority population is younger thanfor whites. In 1995, a higher proportion of the ethnic minority
The Institute for Employment Studies6
population was aged 16 to 24 years, 15 per cent, compared to 11per cent of the white population. Those aged under 16 yearsformed 31 per cent of all ethnic minorities, compared with 20 percent of all white people. The Pakistani and Bangladeshipopulations have the youngest age profiles of any ethnic group,while the African-Caribbean population’s age profile is similar tothat of the white population. These age differences are ofsignificance to the current and future participation of ethnicminorities in higher education, since the main entry cohort tofirst degree full-time study is 18 to 20 year olds (Connor et al.,1996).
The gender balance within the ethnic minority population as awhole is moving closer to that of the white population, butwithin Pakistani and Bangladeshi groups, males continueconsiderably to outnumber females.
An increasing number of people of ethnic minority origin havebeen born in the UK: in 1988/90, this applied to 87 per cent ofethnic minority children (under-16 year olds). This means that anincreasing number of ethnic minority university students willhave been educated and have made career decisions while atsecondary school in the UK.
Another feature of the ethnic minority population is that it isvery urban and regionally concentrated in the South East,particularly Greater London. Individual ethnic groups haveslightly different geographical distributions. For example, overhalf the African-Caribbean population is in London compared to37 per cent of Indians and 19 per cent of Pakistanis. Certaintowns have high concentrations of ethnic residents (eg Leicester,Birmingham), and particular London Boroughs (eg TowerHamlets). Some research has pointed to a link between highproportions of ethnic minorities and the presence of largeeducational establishments (EOC, 1994). It suggests that this isbecause some ethnic minorities, notably African, Chinese andother Asians, came to Britain to study.
The geographical distribution of ethnic minorities is likely to beof increasing significance in the pattern of participation of ethnicgroups at an institutional level. Local or regional areas are beingincreasingly targeted by universities as student catchment areasand employment markets for their graduates (Connor et al.,1996), and there is an increased propensity for students to studyin their home region (Court, Connor and Jagger, 1994).
2.2 Participation in higher education
2.2.1 Education routes
There is little very recent research evidence on educationalattainment of different ethnic groups, but research done in the
Ethnic Minority Graduates 7
1980s shows that a higher proportion of ethnic minority thanwhite people continue in education beyond 16 years, and more16 to 19 year olds are in full-time education (see for example theYouth Cohort Study and its analysis by Drew, Grey and Sime,1991, and the Jones 1993 analysis of the Labour Force Survey).Overall, African-Asians, Chinese and Africans were more likelyto be in full-time education at age 16 to 19, but there were alsoclear differences by gender between ethnic groups (see AppendixTable A.1.2). Interestingly, white 16 to 19 year old men were theleast likely to be in full-time education of all groups in 1988/90,while African-Asian men were the most likely. More African-Caribbean female than male teenagers were in full-timeeducation, while the reverse was true for Pakistanis.
There are also differential rates of participation in ‘A’ levelcourses by both ethnic group and gender. While 25 per cent ofmale Asian students in their first year of post-compulsoryeducation were taking two or more ‘A’ levels (the traditionalentry qualification for higher education), this contrasts with 17per cent of male white students but only eight per cent ofAfrican-Caribbean female students. The latter were more likelyto be taking ‘O’ levels than their male counterparts.
There is some evidence to suggest that young people from ethnicminorities, especially African-Caribbeans, are more likely to usethe further education sector for both academic and vocationalpurposes, while white young people use it mainly for vocationalqualifications (Eggleston et al., 1986). For the age group 16 to 19,ethnic minorities were less likely to be at school than whitestudents, but more likely to be at further education college: 88per cent of white ‘A’ level students (in 1985 to 1986) werestudying at school, compared to 73 per cent of African-Caribbeans and 80 per cent of Asians (Drew, Grey, Sime, 1991).
More recent evidence from the Labour Force Survey in 1995broadly confirms this pattern, with higher proportions of ethnicminority 16 to 19 year olds in full-time education than whiteyoung people, and in further education or other full-timeeducation rather than at school.
These differences are important for HE participation as well asfor gaining subsequent employment. As will be seen later in thischapter, while entry to university via further education isincreasing, it remains an insignificant route at many universities.Also, many graduate recruiters rely on traditional qualificationsand educational routes (ie emphasis on school and ‘A’ levelpoints) in their shortlisting criteria, which can disadvantagesome ethnic minority graduates (Strebler and Pike, 1993).
In the past, acceptance rates have been shown to be lower forstudents applying to a university or polytechnic via further andhigher education than while at school (UCCA, 1991 and Taylor,1992). However, in the last few years there has been aconsiderable expansion of the further education sector and

The Institute for Employment Studies8
changes in the scope of its provision. There has been more openaccess and more flexible admission policies in many universities,in particular among former polytechnics (post-1992 or ‘new’universities). These may have altered some of the historicalpatterns outlined above.
2.2.2 Educational experiences
A number of research studies have been undertaken which havesought to explain some of these differences in educational routesand attainment levels for different groups of students, includingdifferences between ethnic groups.
Career choice, at 13 to 14 for GCSEs and later for ‘A’ levels anduniversity, can present a series of hurdles for students en route tohigher education. Tomlinson (1987) in a study of 14 year olds atmulti-ethnic schools showed how teachers have a stronginfluence in channelling students into certain examinationcourses (and therefore career paths). While past attainment was amajor factor, she found that stereotypical views or lowexpectations of certain ethnic groups existed among teachers andcareers advisers. In other research (Hyder, 1993 and Troyna1991), the high incidence of Asians entering CSE rather than ‘O’level examinations was found to relate to early streaming at thepoint of transfer from primary to secondary schools, wheredecisions were based on teachers’ own perceptions of abilityrather than the primary school’s assessment of the individuals.
Other research on factors determining progress to highereducation (see for example Singh, 1991; Drew, Gray and Sime,1991) have highlighted:
‘internal’ factors, eg valuing education in communities/cultures, family influence, personal motivation, ability andperceived usefulness for economic success, and
‘external’ factors, eg availability of opportunities, ease of entry,and impediments (such as racial discrimination).
Some of these are likely to have more significance for particularethnic groups. Unemployment is also thought to be a significantfactor, but the evidence on the effect of high unemployment as apush or pull factor is inconclusive.
Type of school has been shown in several research studies to bean explanatory variable for differential entry rates to highereducation for ethnic groups, although it appears to be lessimportant than prior academic performance (see Modood’sanalysis below). Access to schools with an established academicreputation is generally considered helpful in obtaining auniversity education, as well as giving the encouragement totake higher qualifications and the confidence to apply for auniversity place. However, Blair (1994) in a general discussionabout some of the current changes affecting primary and

Ethnic Minority Graduates 9
secondary schools, in particular the outcomes of the new ‘marketsystem’ and devolvement of decision making to schools, raisesconcerns that they may introduce some indirect discriminatorypractices (eg getting places at schools where parents orgrandparents went) and limit access for some people from lowersocio-economic and ethnic groups.
Wrench (1991) studied the influence of the careers service onethnic minorities and found that while careers officers consideredthemselves to be ‘colour blind’, they often held popularstereotypes which were reflected in their assessment of abilitiesand personalities. For example, Wrench cites lower assessmentby careers advisers of numerical and verbal ability of Asian girlsand African-Caribbean boys, though actual attainment levelswere the same as for others; and higher perceived aspirations ofAsian boys and African-Caribbean girls. Research by Bird, Yeeand Mylerl (1992) also provides evidence of careers advisersholding stereotypical views of particular ethnic groups’ likeli-hood of success in higher education. This had the effect ofputting off students from applying to higher education, or notproviding them with sufficient information to make choices.Other research (eg Tanna, 1990) also discusses the role whichracial stereotypes can have on influencing educationalexperiences, as well as criticising the reliance in many studies ofmeasures of achievement. She argues that the latter is anoversimplification which ignores the process of attainment,especially length of time to gain qualifications.
Other influences on early career decisions are employers anduniversities themselves. Liaison between schools, employers anduniversities can help students make informed choices. Some ofthe schools liaison of the more traditional universities (establishedpre-1992) tends to avoid inner city schools with low/no sixthforms (Bird, Yee and Myler, 1992), though some new initiatives(eg compact schemes, or community partnerships whereuniversities make access agreements with individual schools orcolleges) have been specifically targeted on schools wheretraditionally few applications have been received. As yet, theirimpact has not been measured.
2.2.3 Applications to higher education
The main source of data on applications to higher education isthe University Central Admissions System (UCAS). Since 1993,this has processed applications to all UK universities andprovides information about the ethnic origin of applicants. Priorto 1993, the admissions system was run by two bodies, one forthe former polytechnics (PCAS) and one for the universities atthat time (UCCA). Ethnic origin was first asked by PCAS in 1989and UCCA in 1990. Several researchers have analysed theseearlier sets of data and have highlighted differences in entryrates between ethnic groups. These are discussed below, alongwith an analysis of the more recent UCAS data.

The Institute for Employment Studies10
Although the UCAS data (and the earlier PCAS and UCCA data)are considered to be comprehensive and reliable, they relate onlyto entry to full-time study and to those people who have formallyentered the applications process. The increasing amount of part-time provision at some universities in recent years is not coveredby the central admissions systems, and little is known abouttrends in application rates in this area (although recentlyavailable data on part-time students from the Higher EducationStatistics Agency (HESA) do show the current position of ethnicgroups, see section 2.2.5 below). Also, small, but increasing,numbers apply directly to universities near the start of theacademic year. As a consequence, the central admissions datatend to underestimate the total demand for higher educationstudy. Furthermore, people who are put off from applying forvarious reasons are not captured in the data. It is not possible,therefore, to explore if any ethnic group is disproportionatelydiscouraged from applying through the formal process. Theethnicity question on UCAS application forms is voluntary butthe rate of refusal is very small, at around three to four per cent.
Applications data
There are several points of note in the applications data:
Differences were apparent up to 1992 between the sectorscovered by PCAS and UCCA, with the former polytechnicsand colleges having a much higher proportion of theirapplicants coming from the ethnic minorities than theuniversities at that time. In 1990, PCAS received 13.0 per centof total applications from ethnic minority students comparedwith 8.7 per cent by UCCA.
Between 1990 and 1992 a shift in the balance of applicationscould be detected: UCCA applications from ethnic minoritiesincreased to 11.25 per cent of the total, while the correspondingPCAS figure stayed fairly static (13.4 per cent). This differencebetween the two sectors is likely to have diminished withinthe new unified system but may still exist. It is not possible toinvestigate trends at an institutional level in the data madeavailable by UCAS.
Application rates vary according to individual ethnic group(Table 2.1). In aggregate, ethnic minorities had high rates ofapplications in 1992 to universities and polytechnics, whencompared to their representation in the 15 to 24 age group inthe population, and appear to have been better representedcompared to whites. Chinese and African groups wereparticularly well represented in applications compared totheir position in the population, while Bangladeshis wereunder-represented. Sizeable differences can be seen betweenthe university and polytechnic sectors: in particular over twiceas many African-Caribbean students applied to polytechnicsand colleges as applied to universities.

Ethnic Minority Graduates 11
Since 1993 (in the new unified UCAS system) applicationsfrom ethnic minorities have continued to increase. In 1994,13.2 per cent of total applicants to university full-time degreecourses were from ethnic minorities, and the latest provisionalestimate for 1996 entry is 14.0 per cent.
Differences by subject, gender and ethnic group
There are interesting differences in applications by gender withinethnic group. While women now slightly outnumber men inUCAS applications overall (51 to 49 per cent in 1994), theyrepresent 62 per cent of all applicants from African-Caribbeanand black-other groups1, but only 40 per cent of Bangladeshi andPakistani applicants. Other groups fall in between these extremes.
There are concentrations of ethnic minorities among applicantsto courses in certain subjects, in particular to medicine anddentistry where a third of applicants for entry in 1994 wherefrom ethnic minorities. Business and administration and socialstudies also attracted higher than average proportions ofapplicants from ethnic minorities. By contrast, education attractedonly five per cent of its applicants from ethnic minorities.
According to the UCAS data, ethnic minorities are less likelythan white people to apply to university with two or more ‘A’
1 ‘Black-other’ are people classified as of black ethnic origin but notAfrican-Caribbean or African (see Table 2.2).
Table 2.1: Applications of home applicants to polytechnics/colleges and universities, byethnic origin, 1992
Polytechnics/Colleges Universities % of 15-24age group*
No. applicants % No. applicants %
White 226,037 86.6 205,403 85.0 92.8
Ethnic minority (total) 34,997 13.4 26,031 11.25 7.2
African-Caribbean 4,045 1.5 1,958 0.8 1.22
African 5,087 1.9 2,941 1.2 0.57
Black-other 1,514 0.6 922 0.4 0.56
Indian 9,508 3.6 7,244 3.0 2.13
Pakistani 4,996 1.9 3,922 1.6 1.35
Bangladeshi 1,031 0.4 813 0.3 0.49
Chinese 2,076 0.8 1,934 0.8 0.42
Other Asian 3,332 1.3 3,258 1.3 0.47
Other 3,408 1.3 3,059 1.3 —
* 1991 Census
Source: Modood and Shiner, 1994

The Institute for Employment Studies12
level passes, and more likely to have vocational qualifications orapply via access courses. African-Caribbeans, in particular, aremore likely to apply via access courses: in 1994 one in four ofAfrican-Caribbean applicants had access qualifications comparedwith only six per cent of white applicants.
These differences in choice of subject and entry qualifications arenot new. Several researchers in the past have highlighted the lownumber of applications from ethnic minorities for certaincourses, notably teaching, which requires one of the lowest entrypoints (as measured by ‘A’ level grades) and the high number ofapplicants from ethnic minorities to competitive courses such aslaw and medicine (Modood and Shiner, 1994; Taylor, 1992). InModood’s in-depth analysis of 1992 UCCA and PCAS applicationsand admissions data, he showed that all the ethnic groups had asmaller proportion of applicants with two or more ‘A’ levelpasses, and that the lowest was found among the black groups.This situation arose for both university and polytechnicapplications. He also showed that the mean ‘A’ level scores forwhite, Chinese, other Asian and Indian applicants to universitiesin 1992 were similar, but higher than for black applicants,especially African-Caribbeans. At polytechnics, mean ‘A’ levelscores were lower overall than at the universities (pre-1992 ones),but the situation regarding differences between ethnic groupswas similar to that for universities.
Taylor (1992) showed that a greater proportion of ethnic minorityapplicants are likely to have taken ‘A’ level re-sits in order togain minimum entry qualifications. In 1991, 15 per cent of black,Indian, Pakistani and Bangladeshi applicants took two or morere-sits compared with five per cent of white applicants. He alsoshowed that far fewer applications from ethnic minorities camefrom the state school sector, and more came from furthereducation colleges. This is in line with the research by Egglestonet al., (1986) and Drew, Gray and Sime (1991) (see section 2.2.1).
Institutional choice
As highlighted already, ethnic minority students are notrepresented evenly across institutions (though data at institutionallevel are not available to show the full extent of institutionalvariation, nor its trends). Students’ choice of university is likelyto be affected by a number of factors, eg knowledge of institution,location, reputation, image portrayed and personal recommend-ations of teachers, family and friends. An analysis of universityprospectuses by Jewson et al. (1991) found that the imageportrayed was mainly that universities were ‘white’ institutions.Equal opportunities policies in higher education were not welladvanced pre-1992 with the universities at that time laggingbehind the polytechnics (see for example Williams et al., 1989).This may explain why ethnic minorities tend to apply touniversities which they know have a relatively high proportionof ethnic minority students. Modood (1993) obtained data for

Ethnic Minority Graduates 13
individual universities and showed the extent to which ethnicminorities were concentrated in a few less prestigious institutions,mostly polytechnics in London and the Midlands. He suggestedthat this arose from students choosing to apply to institutionsclose to home or because of attributes of these institutions, ratherthan students anticipating rejection from universities with higherreputations. There has been a tendency for ethnic minoritystudents to apply to a limited number of universities close totheir home area (though the more recent trend is for all studentsto stay closer to home, mainly for financial reasons).
Research for the Higher Education Funding Council for England(HEFCE) on ethnic minorities in teacher training, raised anumber of factors discouraging successful applicants. Theseincluded the unwillingness to leave home areas, which meansthat universities with comparatively small local catchment areasmay have difficulties attracting more ethnic minority students.Factors also identified were perceptions of few black teachers inthe profession and few black students on teacher training.
2.2.4 Admissions
Many of the general patterns and differences between ethnicgroups in applications data can be seen in the admissions data,and so are not worth repeating (also, there are now morecomprehensive data available on first year students from HESA,as discussed later in section 2.2.5). As mentioned earlier, ethnicminorities are well represented in admissions to higher educationin comparison to their position in the population for the 15 to 24age group, but this varies considerably by ethnic group and bygender (see Table 2.2).
Africans, other Asians, Asian Chinese and Indians areparticularly well represented (nb these findings are almostidentical to Modood’s earlier findings).
Bangladeshis, especially Bangladeshi women, are clearlyunder-represented.
Women are better represented than men among African-Caribbean, other black, and Chinese groups.
Admissions to full-time degree courses from ethnic minoritygroups has grown at only a slightly faster rate than all admissionsin the last five years. Between 1990 and 1993, the ethnic minorityshare of admissions to degree courses remained relatively static,at around 14 per cent in the former polytechnics and colleges andeight to nine per cent in the universities. The combined figure for1994 for both groups (from UCAS) was 11.4 per cent, up from10.6 per cent in 1992. The provisional figure for 1995 is somewhathigher at 13.0 per cent. This growth reflects the shift inadmissions at many universities towards a broader based intakein terms of educational routes.

The Institute for Employment Studies14
Admission bias?
A key question worth asking, however, is: is there any evidenceof differential success rates according to ethnicity? And is thereevidence of selection bias in addition to the bias highlightedalready in applicants’ choice of subject and institution?
Evidence made public by UCCA in the early 1990s showed thatthere were different rates of admission to universities for differentethnic groups. This led to debate concerning its causes, inparticular possible discrimination in selection processes especiallyat ‘old’ universities. Taylor (1992) showed that whereas overall inthe polytechnic sector, 13 per cent of applications and 14.5 percent of acceptances in 1990 came from ethnic minority students,in the university sector the reverse was true, 8.7 per cent ofapplications came from ethnic minorities, but only 6.4 per cent ofadmissions. Differences between ethnic groups could also beclearly seen: 53.5 per cent of white applicants to universities atthat time were accepted, compared to 26.7 per cent of blackapplicants, with Asians and others coming in between these twofigures. At polytechnics, it was the reverse picture: whites hadthe lowest acceptance rates and there was less variation betweenethnic groups. Modood and Shiner (1994) show the picture to beimproving by 1992 but still half of all white applicants wereadmitted to universities, compared to an average of 38 per centfor ethnic minorities.The UCAS applications/admissions figures for 1994 show therestill is a disparity between ethnic groups, with 70 per cent ofwhite applicants admitted, compared to an average of 63 per centof ethnic minority applicants (nb admission figures are not
Table 2.2: Home admissions to degree courses by ethnic origin, 1994
UCAS 1994 Entry Effective Participation Rate
Total Male Female Total Male Female
White 88.6 88.0 89.1 5.9 5.7 6.2
African-Caribbean 1.0 0.7 1.2 7.0 5.3 8.7
African 1.4 1.5 1.2 20.9 23.6 18.3
Black other 0.4 0.3 0.5 4.6 3.4 5.7
Total black 2.7 2.6 2.9 9.5 8.9 10.0
Asian Indian 3.4 3.6 3.2 10.6 10.9 10.4
Asian Pakistani 1.6 2.0 1.3 7.5 8.4 6.5
Asian Bangladeshi 0.4 0.6 0.3 5.0 5.7 4.1
Asian Chinese 0.8 0.8 0.8 13.1 12.6 13.5
Asian Other 1.2 1.4 1.1 20.5 22.2 18.6
Total Asian 7.5 8.3 6.7 10.0 10.6 9.4
Total black & Asian 10.2 10.8 9.5 9.9 10.1 9.6
Other 1.3 1.2 1.3 11.8 10.9 12.6
Total 100.0 100.0 100.0 6.2 6.0 6.5
Source: IES, UCAS Annual Report 1993-1994 Entry, Table G2.1, and Census 1991, Ethnic Group and Country of OriginReport, Table 6

Ethnic Minority Graduates 15
directly comparable in new and old data systems). It is alsoworth noting that for most ethnic groups, women were less likelyto obtain places in higher education than men.
There are a number of reasons which explain these overalldifferences. Some have already been discussed above in relationto choice of institution, educational background, location andeducational attainment. A more detailed analysis is provided byModood and others. The main conclusions from his research arethat:
prior academic performance is an important part of theexplanation but does not explain all the inter-group differences
age, gender, social class, type of school attended and whetheror not the institution was in the home region are additionalexplanations, but
some differences remain partially unexplained, in particularthe differences for some ethnic groups between universitiesand polytechnics. This has led to the conclusion that somedirect discrimination in admission and selection processesmay be taking place, but in a complex way, affecting some, orparts of, ethnic groups.
It is expected that the new unified system of admissions willreduce the amount of variation in admission rates by ethnicgroup that existed previously between the former polytechnicand university sectors. Also, in 1992 the CVCP issued guidelinesto admissions staff on racial discrimination, and in the last fewyears many universities have developed further their equalopportunities policies. It is clear, though, from individualuniversities’ (unpublished) student data that there are widedisparities in ethnic minority profiles. Also, admissions policiesand practices vary considerably within, as well as between,universities. Further research would be useful at an institutionallevel to monitor admission rates, and uncover the causes of anyracial discrimination identified, direct or indirect.
We now turn to discuss the current profile of ethnic minorities inhigher education, and then turn to future trends and factors likelyto influence the future supply of graduates from ethnic groups.
2.2.5 Current students in higher education
Since 1994, the Higher Education Statistics Agency (HESA) havehad responsibility for collecting, analysing and publishing dataon students at all publicly funded HEIs. The HESA data is morecomprehensive than previous HE student data and covers boththe university and former polytechnic/college sector, which werecovered by separate data sources in the past. It includes all
The Institute for Employment Studies16
students with known ethnicity1, not just those entering viaUCAS, and gives a slightly different figure than UCAS for ethnicminority representation in 1994/95 admissions, 12.4 per cent ofUK domiciled first year students (HESA, 1995).
According to HESA there were one and a half million studentsenrolled in publicly funded higher education institutions in theUK in 1994/95, two thirds of whom were studying on firstdegrees, the vast majority (800,000) in full-time study. Overall,11.5 per cent of the total UK domiciled student population isestimated to be from ethnic minority groups (HESA, 1995).
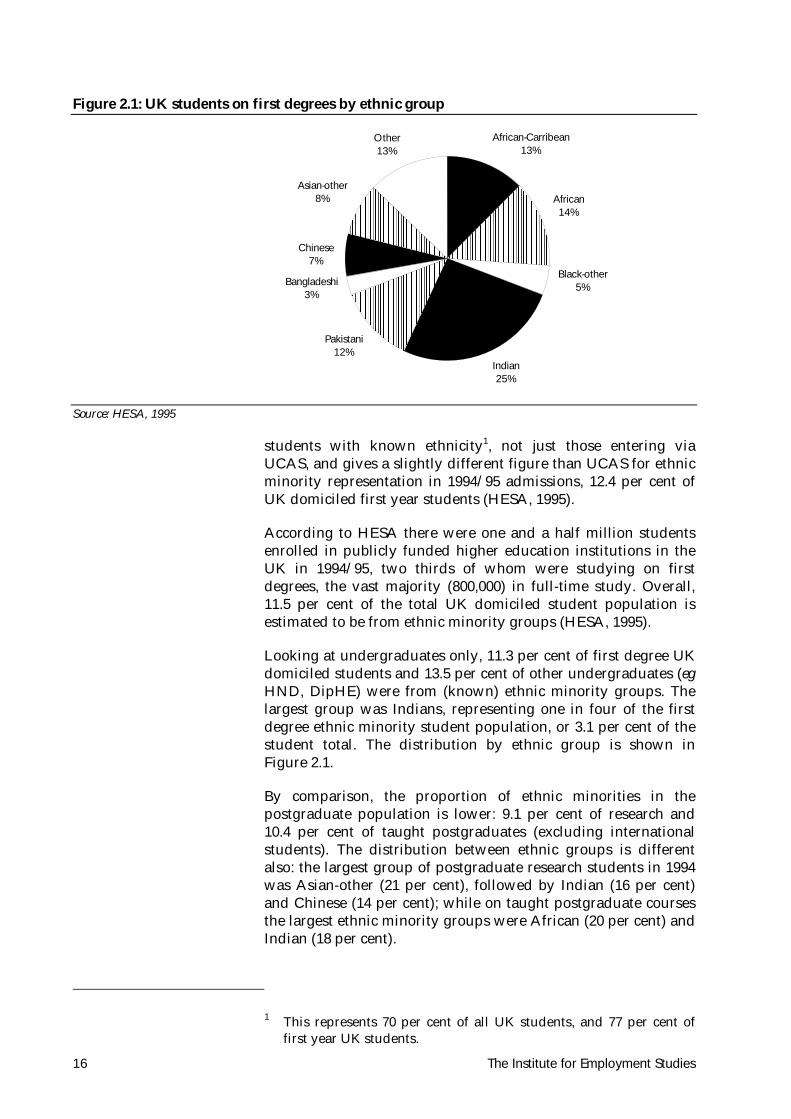
Looking at undergraduates only, 11.3 per cent of first degree UKdomiciled students and 13.5 per cent of other undergraduates (egHND, DipHE) were from (known) ethnic minority groups. Thelargest group was Indians, representing one in four of the firstdegree ethnic minority student population, or 3.1 per cent of thestudent total. The distribution by ethnic group is shown inFigure 2.1.
By comparison, the proportion of ethnic minorities in thepostgraduate population is lower: 9.1 per cent of research and10.4 per cent of taught postgraduates (excluding internationalstudents). The distribution between ethnic groups is differentalso: the largest group of postgraduate research students in 1994was Asian-other (21 per cent), followed by Indian (16 per cent)and Chinese (14 per cent); while on taught postgraduate coursesthe largest ethnic minority groups were African (20 per cent) andIndian (18 per cent).
1 This represents 70 per cent of all UK students, and 77 per cent offirst year UK students.
Figure 2.1: UK students on first degrees by ethnic group
������������������������������������������������������������������������������������������������������������������������������������������������������������������������������������������������������������������������������������������������������
���������������������������������������������������������������������������������������������������������������������������������������������������������������������������������������������������������������������������������������������������������������������������������
��������������������������������������������������������������������������������������������������������������������������������������������������������������������������������������������������������
African-Carribean13%
African14%
Black-other5%
Indian25%
Pakistani12%
Bangladeshi3%
Chinese7%
Asian-other8%
Other13%
Source: HESA, 1995

Ethnic Minority Graduates 17
Other patterns in the HESA data for 1994/95 show:
Women are unevenly represented among ethnic groups atundergraduate level (nb data disaggregated by level ofqualification are not made available). It varies from 63.4 percent of African-Caribbean undergraduates to 40.1 per cent ofBangladeshis and 38.1 per cent of Pakistanis. Indians andChinese have a similar representation to whites (Table 2.3).
Part-time study accounts for 18 per cent of first degree andalmost half of other undergraduates. However, among firstdegree students, part-time study is more prevalent amongblack groups on the whole than Asians, and the percentage ofIndians and Pakistanis studying part-time is only half that forWhites (Table 2.3).
Most part-time study is taken by people aged 21 and over, andthis holds true for all ethnic groups. The older age profile ofblack students is the main explanation for the high incidenceof black students in part-time study highlighted above: lessthan 30 per cent of black first year degree students were agedunder 21 years, compared to over 60 per cent for most othergroups (Table 2.3). Furthermore, half of first year blackstudents in degree courses were very mature, aged over 25years on entry, compared to around a quarter for whites andless than 20 per cent of Indians, Pakistanis and Bangladeshis.It is worth noting that this older age profile for black studentsmeans that some of the comparisons with the 15 to 24 year oldpopulation are not valid.
There is also a link between mode of study and subject choice:subjects such as medicine which have high proportions ofsome ethnic groups have a low incidence of part-time study.Almost five per cent of Indian first year undergraduate
Table 2.3: Characteristics of students: gender, age, part-time study, by ethnic group (UKdomiciles)
% female students(undergraduates)
% of part-timestudents
(first degree)
% of first year studentsaged under 21(first degree)
White 51.5 18.0 61.8
African-Caribbean 63.4 27.3 27.0
African 44.6 16.9 22.8
Black-other 57.7 33.1 30.6
Indian 47.3 10.1 74.1
Pakistani 38.1 8.1 64.5
Bangladeshi 40.1 14.4 68.2
Chinese 52.0 14.4 68.5
Other Asian 45.4 14.3 50.8
Other 50.4 47.4 54.0
Source: HESA, 1995

The Institute for Employment Studies18
students and three per cent of Pakistanis are studying medicineand dentistry compared to one per cent of whites.
Gender differences are also apparent: African-Caribbeans aremore likely than other groups to be studying subjects allied tomedicine (mainly nursing) which relates to the higherproportion of female than male African-Caribbeans in thehigher education student population.
Popular subjects among specific ethnic groups are:
• business and administrative studies: more popular choicefor most ethnic minority groups than whites, butespecially Africans, Indians, Pakistanis and Chinese
• engineering and technology: a much more popular choicefor African and most Asian groups than for whites
• computer science and law: more popular choices for allethnic minority groups than for whites (except the Chinesefor law).
By contrast, education is much less popular across the ethnicminorities.
Qualifications on entry are also seen to vary by ethnic group(as indicated earlier in the applications data). While just overhalf of white and Asian first year students entered with ‘A’levels or Highers, this applied to only a third of black studentswhere other qualifications (eg access, vocationalqualifications) were more common. There was much lessdisparity between the ethnic groups for part-time degreestudy, where only around a fifth to a quarter of first yearstudents had ‘A’ level or Highers qualifications.
Again, age is an important variable: among under-21 yearolds, there was only a small difference in the proportionsentering higher education with ‘A’ level qualifications (71 percent of black students, 77 per cent of Asians, and 82 per cent ofwhites). This suggests that the reason that there are moreblack students with non-‘A’ level qualifications is mainly dueto the older age profile for this group.
Lastly, there are some HESA data on student mobility, butonly by country rather than at a regional level (mainly becauseof the 30 per cent non-response for the ethnic minority questionwhich was not spread evenly across the UK). As might beexpected, 98 per cent of black and 95 per cent of Asian studentswere studying in English HEIs, compared with 84 per cent forall UK students (at all levels of study). There was much lessmovement, in relation to home location and location ofuniversity, of ethnic minority students between England andScotland, and between England and Wales than occurs amongWhite students. The dominant ethnic group in Scotland isAsian, and there are very few black students, while Wales hassmall numbers of both Asian and black students.

Ethnic Minority Graduates 19
2.2.6 Student trends in higher education
There are a number of general trends which have changed theshape and size of higher education in the last decade and set thecontext for the growth in participation of people from ethnicminority groups. The main contextual points of note are:
a rapid expansion in size of most universities, particularly inrecent years, resulting in an overall growth in the number ofstudents in higher education of 54 per cent between 1988/89and 1993/94, followed by a period of consolidation in studentnumbers (especially of full-time first year degree students)
more marked growth in full-time students and, in particular,in post-1992 universities (former polytechnics and colleges)between 1988/89 and 1993/94
a rapidly rising young age participation index (18 to 19 yearolds) which has risen to 30 per cent in the period 1988 to 1993,as well as an increasing index for younger mature people (21to 24 years), from six to ten per cent
changes to admissions policies and a broadening of subject/course provision to give a more vocational emphasis. This hascontributed to the opening up of higher education to a widerrange of people, including new types of students (eg without‘A’ levels, mature entrants, part-time/distance learners).
more marked growth in mature undergraduate students (25years and over) since 1989, both male and female, comparedto other age groups
expansion in postgraduate study, especially part-time whichhas almost doubled in the last five years
more rapid increases in some subjects than others atundergraduate level, in particular business and financialstudies, multi-disciplinary studies, subjects allied to medicine(including nursing), information science, but more limitedgrowth in engineering and technology.
While research has been undertaken on factors influencingstudent demand and reasons for the recent expansion andchanges in HE provision (see for example: Connor et al., 1996;Williams and Fry, 1994), there is no recent research specificallyfocusing on the effects of these wider changes on the pattern ofparticipation by ethnic minority students.
Looking to the future, the graduate output of ethnic minorities,at least in the short term, is going to be determined by currenttrends in participation and the changes taking place in the highereducation system. The future size, shape and funding of highereducation is currently subject to review (the recently announcedDearing Inquiry) and therefore there is some uncertainty aboutoverall future trends. The current policy of consolidation ofundergraduate intake numbers and limited growth overall, islikely to continue over the next few years at least. Within that,
The Institute for Employment Studies20
the current trends towards greater diversification within studentintakes and between institutions are likely to continue. This islikely to produce an increasing ethnic minority graduate outputin the short term, although it is unlikely that their presentconcentration at a relatively small number of universities (mainlythe post-1992 ones) and in certain subjects, is likely to changesignificantly. In addition, there is likely to be increasing diversitybetween ethnic groups, especially in their age profile, entryqualifications, gender balance and subject choice. However, it isimpossible to make longer-term forecasts, and there are nosupply projections or indicators in the research literature.
Some, but not all, ethnic groups, are more likely to be part of thegrowing number of ‘non-traditional’ students entering highereducation — older, with GNVQ/NVQ or access qualifications,applying from a further education college, studying part-time orat a distance. On present trends, their numbers are expected togrow faster than more traditional entrants: ie young schoolleavers with ‘A’ levels. This may also have the effect of alteringthe ethnic pattern of participation in higher education.
2.3 Entry to the labour market
Compared to the evidence available about participation androutes into higher education, there is much less on outcomes andsubsequent employment experiences. No data disaggregated byethnic group are available on completion or drop-out rates, noron qualifications obtained by higher education students (as yet).This is not surprising, as 1994 was the first year that data werecollected on the ethnicity of students across the whole sector, andmost universities (especially the pre-1992 ones) have onlyrecently begun to practice ethnic monitoring. Information systemsneed to be more fully developed before useful monitoring ofthroughput can be done.
2.3.1 Graduation rates
There is evidence to suggest that some ethnic minority studentsdo experience difficulties while at university, academically andsocially (eg Walsh, Hampton and Bain, 1995 (Glasgow); Bird,1992 (West of England); Williams, 1989 (Wolverhampton)). Thismay lead to greater numbers dropping out or stopping outtemporarily, but there is insufficient research on attrition rates inUK higher education to draw conclusions about factors ofrelevance, which may or may not include ethnicity. Untilrecently, non-completion on UK degree courses was low, muchlower than in other European countries or the USA, and therewas little interest in measuring it. Recent evidence shows it to beincreasing, and there are different patterns from university touniversity. This is currently being investigated more fully byindividual institutions and the HEFCE.

Ethnic Minority Graduates 21
2.3.2 Graduate labour market contextual changes
Before discussing the available evidence relating specifically tothe employment of ethnic minority graduates, it is worth notingsome general contextual changes over the last five years or sowhich have affected the experiences of graduates in general asthey seek their first job. Some of these changes were highlighted inthe interviews with employers, which are reported in Chapter 6.The main points to note are:
Fluctuations in demand: the severe recession of the early 1990sproduced cutbacks among the major recruiters of graduates,and although there has been some recovery, the overall levelof vacancies specifically for graduates has still not returnedto that of the late 1980s (AGR, 1995a).
Competition: graduates in the 1990s face a more competitive anduncertain labour market did than even their predecessors of adecade ago. This is the consequence of a faster growth insupply than demand and the increased diversification of thegraduate labour market.
Changes in ‘graduate jobs’: as the supply of graduates hasexpanded, the UK economy has had to absorb an increasingnumber of graduates. This happened at a time not only ofeconomic recession, but also of business restructuring, inparticular among large blue chip companies which hadtraditionally recruited large numbers of graduates. As aresult, the number of vacancies in formal graduate traineeschemes leading to fast track advancement (traditionallythought of as ‘graduate jobs’) has been declining (AGR, 1993).As the CBI recently put it: ‘Few graduates can expect auto-matically to enter a specific career and reach a predictable level ofemployment and salary. A degree makes a graduate more likely toget a highly skilled job sooner, but it no longer guarantees aprestigious job.’ (CBI, 1994). Many employers are takingadvantage of the current slack in the graduate market toemploy graduates in jobs which previously they would nothave done, especially if the graduate is likely to be morecompetent than a non-graduate (eg in sales, or publishing).Not all of the graduates in employment feel they are usingtheir skills and potential to the full (Mason, 1995; Connor andPollard, 1996).
New types of recruiters: small firms are becoming more importantas recruiters of graduates. They have varying needs, and tendto use different recruitment methods than the largerrecruiters, relying more on contacts within individualuniversities and local advertising, and less on the traditional‘milkround’ of university visits. Small firms are still oftenviewed by graduates as offering more limited careeropportunities and training/development. There is a lack ofknowledge, however, about their requirements and demandtrends.

The Institute for Employment Studies22
Targeting: there is a trend among the established graduaterecruiters to target a smaller number of universities in theirrecruitment strategy. They tend to be the more academicallyprestigious ones, or those offering particularly relevantcourses. Some employers target the pre-1992 universitiesexclusively (where ethnic minority representation is compara-tively low).
Changes in selection methods: competence-based criteria forselection of graduates is increasingly popular and there isless reliance on graduates’ curricula vitae. This is consideredto be a more objective selection method and of morerelevance to the jobs graduates will be expected to do.
Quality issues: employers are increasingly looking for graduateswith good personal skills as well as intellectual and, in somecases, technical skills. They are increasingly concerned aboutthe quality of graduate applicants (AGR, 1995b), in particularpoor presentation skills.
2.3.3 Employment of ethnic minority graduates
There have been only two significant research studies undertakenspecifically on the employment of recent graduates from ethnicminorities in the UK. The first was in 1987 by Brennan andMcGeevor (sponsored by the CRE) based on a follow-up surveyof a sample of polytechnic and college graduates in 1982, mostlyAsians, and mostly with conventional qualifications (two ormore ‘A’ levels). The ethnic minorities in the sample of 2,540graduates comprised six per cent of the total. They covered arange of subjects and were drawn from 19 institutions. This wastoo small scale a study to justify firm conclusions, but theauthors felt that there were sufficiently strong patterns andconsistencies in the data to suggest the following:
Ethnic minority graduates at that time experienced greaterdifficulties than other graduates in obtaining employment:greater proportions were unemployed 12 months aftergraduation and the ethnic minority graduates themselvesperceived greater difficulties than their white counterparts.
Jobs actually gained were inferior on several measures to thoseof other graduates (eg salary levels and qualifications needed).
In 1990 the CRE published a further study by Brennan andMcGeevor, which followed up some of the graduates in theearlier survey. It also included new research on universitygraduates, and interviews with graduates, university careersadvisers and academic staff. This study provided more detailedinformation about the labour market experiences of ethnicminority graduates and gave a more comprehensive coverage ofthe higher education population. It found that:
Subject courses were a strong determinant of futureemployment. As some ethnic groups were concentrated in

Ethnic Minority Graduates 23
certain courses (see section 2.2.5 above) it followed that therewere concentrations of ethnic minority graduates in certaintypes of job and employment sectors.
Subject studied did not explain all the differences inemployment profiles. There was a greater tendency forAfrican-Caribbeans to go into the public sector and Asians tobe self-employed.
Although graduates from all ethnic minority groups weremore likely to be unemployed initially they, like all graduates,did not experience long-term unemployment.
Ethnic minority graduates were less likely to be satisfied withtheir job. There was some evidence to suggest, though notconclusively, that it was at a lower level than among whitegraduates, and that promotion for ethnic minority graduateswas harder to obtain.
Ethnic origin was the main difficulty mentioned by ethnicminority graduates in securing employment, and they attendedmore interviews before obtaining a job offer before.
The perception and anticipation of possible difficulties insecuring jobs had the effect of focusing job search on employersknown to be more sympathetic to ethnic minorities.
Ethnic minority graduates tended to place considerable valueon education as an avenue towards employment opportunity.On the whole, they were satisfied with their experiences inhigher education, but were much less satisfied with theresulting rewards in the labour market.
While no substantial evidence of discrimination by employerswas actually obtained, the researchers concluded that therewas no other possible way to explain the problems manygraduates in the survey encountered in their careers.
Following that report, many recommendations were made touniversities and employers about ways in which some of theseissues could be addressed. Several initiatives have been taken,notably the production of a guide by AGCAS on equalopportunities in selection and recruitment, the development of aMentoring Scheme to help ethnic minority students into work(see Chapter 6), individual company initiatives to improveselection practices and to provide more work experience, and ofcourse the start of regular monitoring of ethnic minorityparticipation in universities through HESA.
The existing research therefore provides some evidence of racialdisadvantage among graduates, but is less conclusive aboutexperiences of different ethnic groups. It also relates to a periodin the mid-1980s when the graduate labour market looked ratherdifferent from today in terms of its scope and breadth, the natureof graduate jobs, and the vastly expanded numbers and diversityof graduates being produced each year.

The Institute for Employment Studies24
2.3.4 Ethnic minorities and the labour market
We can turn to the general employment literature to obtain somefurther insight into the position of ethnic minority graduates inthe labour market.
Firstly, education to degree level in the working populationvaries considerably by ethnic group (Jones, 1993). While eightper cent of whites are educated to this level against nine per centfor ethnic minorities as a whole, the latter masks huge differencesbetween groups — ranging from three per cent for African-Caribbeans to 13 per cent for African-Asians. Among the youngerage group (16 to 24 years), four per cent of whites held degreescompared to five per cent of people from ethnic minorities, butthis included 13 per cent of African-Asian and Chinese, and oneper cent of African-Caribbean.
Secondly, while most analyses show that younger people in allethnic groups are more likely to have degree qualifications thanolder people, there is also evidence to show that some ethnicminority students are more persistent with their educationambitions than others. Thus, we saw above, section 2.2.5, thatconsiderably more black students entered higher education aged25 years and over, and so it is not surprising to find that theproportion of black degree holders aged 25 to 29 (five per cent) isconsiderably higher than those aged 16 to 24 years. This couldhave implications for their success in the labour market, however,if they were competing directly against much younger graduates.
Ethnic minority men and women are strongly over-representedamong the unemployed. The rate for ethnic minority women is16 per cent, far higher than the six per cent for whites, and thecorresponding figures for ethnic minority men are 20 per centcompared with 11 per cent for white men (EOC, 1994). Unemploy-ment rates remain far higher for ethnic minorities even whenthey have high level qualifications (above ‘A’ level or equivalent).In 1993, 14 per cent of highly qualified ethnic minority men, andnine per cent of women, were unemployed, compared to five andfour per cent respectively of white men and women. The highestunemployment levels for women were found amongPakistani/Bangladeshis, and for men among both black peopleand Pakistani/Bangladeshis.
As mentioned above, the available research on ethnic minoritygraduates suggests that they are likely to have less challengingand rewarding jobs than whites, despite the introduction byemployers of equal opportunities policies and equal opportunitieslegislation in recent years. Jones (1993) analysed the LFS to see ifthis could be confirmed and found considerable diversitybetween ethnic groups and gender. Without taking qualificationinto consideration, he concluded that there was strong evidencethat, for men, certain minority groups had achieved parity withwhite men in terms of the proportion in top level jobs, but that

Ethnic Minority Graduates 25
other minority groups were at substantially lower levels thanwhites. Once level of qualification was controlled for, a moreuneven pattern of disadvantage could be observed. With theexception of African-Caribbeans, ethnic minority men withhigher level qualifications were more likely than white men tohold professional level jobs. Chinese, African-Asian and Indianwere more likely than other ethnic minority groups, and aroundtwice as likely as whites, to hold this level of job.
For women the pattern was less clear because of their greaterconcentration, compared to men, in lower level jobs. More whitewomen with higher level qualifications were in managerial orprofessional jobs than ethnic minority women as a whole withthese qualifications, but Indian and Chinese women were betterqualified than other groups in this job category. In particular, theproportion of female Indians and Chinese with ‘A’ levels orabove who hold professional jobs was twice to three times thatfor whites.
2.3.5 Specific occupations
There are some examples of particular professions restricting theopportunities of ethnic minorities. Accountancy was an exampleof this when it was investigated by the CRE in 1987. It was foundto have a disparity between black and white selection rates at allstages of recruitment into chartered accountancy trainingcontracts, suggesting the existence of some discrimination, albeitindirect. Some of the sources of disadvantage highlighted werefirms’ use of ‘A’ level point scores, positions of responsibility inschools and choice of work experience as measures of academicattainment, social skills, leadership, etc. These generally favouredwhite candidates. There were also influences on candidates ofstereotyping and assumptions about ethnic minorities whichshaped their behaviour and expectations, and some evidence thatinterviewers were recruiting in their own image, which led tohigher white success rates.
The law profession has also been subject to scrutiny about itsrecruitment and career development practices. Traditionalpractices, administrative convenience and a lack of socialresponsibility of some legal firms, have been highlighted fromwithin the profession as barriers to wider access to ethnicminorities (see for example King and Israel, 1989).
Difficulties in attracting ethnic minorities into teaching hasalready been mentioned above. The HEFCE provided pump-priming support to projects which would encourage more ethnicminority students into teacher training. Several barriers torecruitment were identified, including low status of teaching andpoor image as a profession, lack of careers information, and fewrole models. The need for alternative routes into teacher trainingand improved admissions processes were also identified. TheHEFCE-funded projects also explored a number of issues within

The Institute for Employment Studies26
the training process, including problems of isolation and racism,and the appropriateness of the curriculum, as well as a review ofadmissions policies.
2.4 Summary
This chapter has highlighted the main points in the existingliterature and data on the participation of ethnic minorities inhigher education and their employment outcomes. The mainissues it highlights are as follows.
There is growing participation of ethnic minorities as a wholein higher education. However, there are disparities betweenindividual ethnic groups, with uneven distribution betweenlevels, modes of study, subjects and institutions, as well asage, gender, entry qualifications and educational routes.
Growth in ethnic minority student numbers partly reflects thewider changes taking place in higher education relating towidening access and broadening provision, as well as toimprovements in the educational attainment of young people,including ethnic minorities.
A combination of factors of influence explain the differentialparticipation rates by individual ethnic group. These include:education routes followed, academic achievement, early careerguidance and subject choice, the attitude, culture andproximity to home of individual universities, and thecomposition of the various ethnic groups in terms of age,gender balance, geographical distribution, socio-economicstatus, and attitude towards the value of education.
There is evidence that some ethnic minority studentsexperience more difficulties while at university, but theevidence is inconclusive on its affect on non-completion andsubsequent experiences in the labour market.
Evidence from previous follow-up studies of graduates showthat ethnic minority graduates experience greater difficultiesin securing employment initially, as well as discriminationfrom employers or in access to further professional training.
Other evidence from the labour market shows that the extentof racial disadvantage is more complex, affecting particularethnic groups or parts of them. Although unemploymentlevels among ethnic minorities remains higher than amongwhites, regardless of qualification level, some ethnic groupshave achieved parity with whites in some professional/managerial occupations.
Much of the existing research on higher educationparticipation and entry to the labour market was undertakenin a different context from today, when higher education andthe graduate labour market were smaller in size and lessdiverse. There is a need to undertake new research whichtakes into consideration the current environment and

Ethnic Minority Graduates 27
challenges faced by recruiters and graduates. This is thesubject of the next chapter which presents the findings of thefollow-up survey of 1993 graduates. It presents new evidenceof recent labour market experiences of ethnic minoritygraduates, and picks up on some of the issues identified inthis review of previous research relating to differencesbetween individual ethnic groups.

The Institute for Employment Studies28
3. Graduates’ Progress in the Labour Market
This chapter, and the two which follow, present findings fromthe survey and interviews with graduates. These were under-taken in order to provide more up-to-date insights into thelabour market experiences of ethnic minority graduates and thusfill some of the gaps identified in the research review.
This chapter focuses on the progress of graduates in the labourmarket over the two and a half year period since graduation. Itdraws mainly from the survey data. In view of the variations ineducation and employment experiences of different ethnic groups,as discussed in the previous chapter, the aim has been, wheneverpossible, to highlight any significant differences between ethnicgroups. However, given the small size of the sample, some of theresults must be considered with a certain degree of caution. Insome cases these are better interpreted as useful directions forfurther inquiry, rather than conclusive findings.
It should also be noted that this was a retrospective survey, andtherefore subject to the usual sources of ‘memory’ errors. Whilethe survey covered a relatively recent period of time, with thistype of study there is always the danger that respondents willomit or provide inadequate information, particularly on short-term activities (eg short periods of unemployment, temporarywork) or when required to provide numerical information (egsalary level).
3.1 Survey sample
As outlined in Chapter 1, the survey was conducted in two stages.First, a postal survey of a random sample of 1993 graduates fromfour universities was undertaken. Then, survey respondents fromethnic minorities were matched with a sub-sample of whiteparticipants by gender, age, type of university and degree subject.Previous research (eg Brennan and McGeevor, 1993) has shownthat these variables have a significant influence on graduates’early careers, and it was therefore necessary to control for theireffect. In addition, when appropriate, the impact of the otherextraneous variables (eg class of degree) was controlled for in theanalysis. The matched sample, on which this chapter is based,comprised 272 graduates — 136 white and 136 from ethnicminority graduates (distributed between individual ethnicgroups as shown in Table 3.1).

Ethnic Minority Graduates 29
3.1.1 Overall survey response
The survey covered four universities, two of the ‘old’ type (pre-1992) and two ‘new’ (post-1992). They were selected as contrastinguniversities, taking into consideration a number of variables: eggeographical location, ethnic minority composition, type ofintake and subject mix. A brief description of each university isgiven in Appendix 2.
Questionnaires were sent to a random sample of 3,421 1993graduates from these four universities, which represented justover half of the total graduate output from the four in that year.Completed questionnaires were received from 1,177 graduates, asurvey response rate of 37 per cent. As discussed earlier inChapter 1, this was lower than expected and was due mainly totwo main factors: the quality of addresses held by universitiesand the short timescale of the survey which allowed only onereminder to be sent (nb a further 298 questionnaires have beenreceived since closing the survey; if time had allowed these to beincluded, the response rate would have been 46 per cent).
The overall survey response was slightly biased towards maturegraduates and women, when compared to nationally availabledata (see Appendix 2). However, this is likely to be explained bythe university sample selection: the two post-1992 universitieshad a considerable bias towards subjects where women andmature students are better represented (eg arts/humanities,subjects allied to medicine) than nationally, and one of them hada reputation for attracting high proportions of mature graduates.
Table 3.1: Respondents by ethnic origin
Ethnic origin N %
Black African 4 1.5
Black Caribbean 14 5.1
Black other 7 2.6
Indian 39 14.3
Pakistani 23 8.5
Chinese 11 4.0
Other Asian 10 3.7
Mixed ethnic origin 16 5.9
Other* 12 4.4
Whites 136 50.0
Total 272
*This category includes Turkish, Turkish Cypriot, Persian and Romany respondents
Source: IES Survey

The Institute for Employment Studies30
3.1.2 Matched sample
As mentioned above, the survey analysis was based on amatched working sample of 272 graduates. Sixty-one per centwere from the two post-1992 universities (ie former polytechnics)and 39 per cent from pre-1992 universities. National data for thesame cohort (see Appendix 2) show that, in 1993, one third ofstudents graduated from post-1992 universities, compared with65 per cent from pre-1992 universities (CSU, 1994; USR, 1994),which shows the extent to which the sample was biased towardspost-1992 universities.
Compared with national data on ethnic minority distribution(see Chapter 2), Asians were considerably better representedthan Black graduates. Unfortunately, no Bangladeshi graduatesresponded to the survey, and so this group was not representedat all in the sample. However, as indicated in the previouschapter, Bangladeshis represent less than one per cent of the totalintake to full-time first degrees.
In terms of entry qualifications, respondents were similar to thepopulation as a whole (ie all first degree students who completedtheir course in 1993). Seventy-two per cent of respondents hadtraditional entry qualifications (ie two or more ‘A’ levels).
Mature graduates (ie 21 and over at the time of entry) were over-represented in the sample: 40 per cent of respondents wereincluded in this category, while the corresponding national figuresfor 1993 were 13 per cent for pre-1992 universities, and 20 percent for post-1992 ones (UCCA, 1991; PCAS, 1991). However, asshown earlier in Chapter 2, some ethnic groups (in particularblack students) have an older age profile than white students andso this bias in the sample was to be expected. It was also due tothe initial university sample selection (see above).
With regard to degree subject, the distribution of the matchedsample was broadly in line with national figures (see Appendix 2),particularly in relation to the most popular subjects (eg socialsciences, business studies, arts and humanities).
3.1.3 Survey coverage
The areas covered by the survey included:
education and work experience before entering higher education
influences on choice of university
post-graduation employment status at six monthly intervals
first post-graduation and current jobs
unemployment
further study.

Ethnic Minority Graduates 31
3.2 General overview
One of the main aims of the study was to investigate graduates’early employment histories, in order to establish if any variationsemerged in the career patterns of respondents from differentethnic groups. In the questionnaire, respondents providedinformation about their experiences after graduation at sixmonthly intervals. They were asked to categorise their labourmarket status at each point in time under five broad headings:
permanent employment: a full- or part-time job intended tolast for more than three months, including voluntary work,internship and training placements
short-term employment: a temporary post intended to last lessthan three months
further study: full-or part-time study or continuing educationleading to a qualification
unemployed: not in work but seeking employment
not available for employment: neither in employment nor infurther study, and not looking for either.
This information allowed a sequential picture of career stagesand movements to be built. In particular we were able to testprevious research findings, which have shown that variations inthe employment experiences of graduates from different ethnicgroups tend to diminish or even disappear over time. Table 3.2shows the employment status of ethnic minority and whitegraduates at six monthly intervals after graduation.
Overall, the results in Table 3.2 show some predictable patterns,with the proportion of graduates in permanent employmentincreasing over time, while the number of respondents in shortterm employment, further study, and unemployed decreasedsteadily. With regard to variations between different ethnicgroups, the data show some small, but consistent differences. Atevery stage, white respondents were slightly more likely to be inpermanent employment than ethnic minority graduates.However, the differences are small and not statistically significant.Our data on permanent employment seems insufficient to confirmor refute previous research findings (see for example Brennanand McGeevor, 1990), which have shown that the gap betweenethnic minority and white graduates tends to narrow over time.
Similarly, at every point in time, ethnic minorities were morelikely to be unemployed, even though for two of these periods (ieJune and December 1994) there was only one percentage pointdifference. With regard to short-term employment, the pattern isless clear. Initially ethnic minorities seemed less likely thanwhites to be in short-term employment. However, after the firstsix months the situation was reversed, again with no evidencethat the gap between the two groups narrowed over time.

The Institute for Employment Studies32
Similarly, the results on further study do not show a very clearpattern. Ethnic minority graduates were more likely to be foundin this category in the first 18 months, no difference emergedafter two years, while slightly fewer ethnic minority graduateswere in further study at the time of the survey (ie December1995).
Our survey findings on respondents’ status at six monthlyintervals partly confirm some of the differences in post-
Table 3.2: Ethnicity by respondents’ employment status at six monthly intervals
Employment status Ethnic minorities%
Whites%
6 months after graduation — Dec. 1993
Permanent Employment 47 53
Short-term employment 12 15
Further study 18 14
Unemployed 18 15
Not available for employment 4 3
12 months after graduation — June 1994
Permanent Employment 57 64
Short-term employment 12 9
Further study 18 13
Unemployed 12 8
Not available for employment 2 6
18 months after graduation — Dec. 1994
Permanent Employment 63 70
Short-term employment 10 7
Further study 16 13
Unemployed 8 7
Not available for employment 3 2
2 years after graduation — June 1995
Permanent Employment 68 77
Short-term employment 8 4
Further study 13 13
Unemployed 7 4
Not available for employment 4 2
Employment status at the time of the survey — Dec. 1995
Permanent Employment 72 77
Short-term employment 7 3
Further study 10 12
Unemployed 10 7
Not available for employment 0.7 0.7
NB: The analysis included 272 cases, 136 from each group.
Source: IES Survey
Ethnic Minority Graduates 33
graduation employment between ethnic minorities and whiteshighlighted by previous studies (eg Brennan and McGeevor, 1987and 1990). However, the empirical data are insufficient toestablish any conclusive patterns. On the one hand, differencesbetween the employment status of ethnic minorities and whiteswere small, and on the whole not statistically significant. On theother hand, their consistency (particularly in relation topermanent employment and unemployment) suggests that thesewould need to be explored further by a larger scale investigation.
Respondents’ career patterns are explored in greater depth insection 3.7 below, where work history data are analysed indifferent ways to establish if and to what extent differencesbetween ethnic minority and white graduates persist. First, welook at respondents’ first jobs after graduation, their current jobs,experiences of unemployment, and taking further studies.
3.3 First job after graduation
3.3.1 Time taken to secure first job
On the whole, ethnic minority graduates took longer to securetheir first job than white graduates, the mean number of monthsfor ethnic minorities being 4.6 compared with 3.9 for whitegraduates. This difference was mainly due to the longer time ittook black and Indian respondents to find their first job(respective mean number of months was 5.0 and 4.9), while theaverage for the other ethnic minority groups was similar to thatof white graduates.
When controlling for class of degree, however, this differencereduces considerably. Ethnic minority and white graduates witha first or upper second class degree took 3.3 and 3.5 months onaverage respectively to secure their first job.
3.3.2 Number of applications made
Respondents were asked about the number of jobs they hadapplied for before securing their first post. The number ofapplications have been grouped into three categories as indicatedin Table 3.3. The survey findings confirm previous research(Brennan and McGeevor, 1990) that ethnic minority graduatesneeded to apply for more jobs than white graduates in order tosecure employment. No significant variations emerged betweendifferent ethnic minority groups.
3.3.3 Type of first job
The proportion of ethnic minorities whose first job was full time(75 per cent) was lower than for whites (83 per cent). However,this difference was not statistically significant. Blacks and Indianswere almost as likely as whites to have secured a full-time job

The Institute for Employment Studies34
after graduation, while below 70 per cent of graduates fromother ethnic minority groups had done so.
Gender differences emerged in relation to employment status:white women were more likely to work full time (88 per cent)than women from ethnic minorities (74 per cent). The associationwas rather weak but statistically significant. Virtually nodifference emerged between the employment status of ethnicminority and white men, 77 per cent and 78 per cent respectivelyhad a full-time job.
Ethnic minority and white respondents were equally likely to beon a short-term contract, the respective figures were 29 per cent,and 28 per cent.
The number of cases was insufficient to explore differences interms of self-employment (only eight graduates had been self-employed in their first job), voluntary work (only nine graduates)and training placement/internship (12 graduates). However, byaggregating these four categories, a ‘non-standard employment’variable was created which showed a small difference by ethnicgroup: 49 per cent of ethnic minorities and 52 per cent of whiteswere found in ‘non-standard’ employment.
3.3.4 Occupation
Respondents’ job titles were coded against Standard OccupationalClassification (SOC) categories, with those in SOC categories 10to 30 (which include managers and administrators, professionals,associate professionals and technical staff) classified as having a‘professional job’. Forty-four per cent of ethnic minority graduateshad a ‘professional’ job compared with 41 per cent of whitegraduates.
3.3.5 Salary
The median salary of respondents in full-time, permanentemployment was lower for whites than for ethnic minorities; therespective medians were £10,000 and £11,500. This differencecannot be accounted for by high salaries in one particular ethnicminority group, because the median for all groups was higherthan for whites. The findings on job level and salary seem tosuggest that initially, ethnic minorities who found employment
Table 3.3: Respondents’ first job by ethnicity and number of applications
Ethnic minorities Whites
N % N %
1-2 applications 32 28 52 42
3-15 applications 37 32 38 31
More than 15 applications 46 40 33 27
Total 115 123
Source: IES Survey

Ethnic Minority Graduates 35
were in a more favourable labour market position. However, thedifference between the proportion of ethnic minority and whitegraduates in a professional job was very small, and notstatistically significant. In addition, higher salaries might partlyreflect the fact that ethnic minorities were more likely to havebeen working in London (see below).
3.3.6 Type of employer
The Brennan and McGeevor (1990) follow-up study of graduatesduring the 1980s found that ethnic minorities (and African-Caribbean in particular) were more likely than white graduatesto be employed by a public sector organisation. As shown inTable 3.4, the survey of 1993 graduates indicates that ethnicminorities were slightly more likely than whites to be employedin the public sector. They were also more likely to be found in theservices sector (see Table 3.5). However, these differences werenot very large, and neither association was statistically significant.
Table 3.6: Respondents’ first job by ethnicity and employer’s size
No. ofemployees
Ethnic minorities Whites
N % N %
Under 100 29 40 26 35
100 to 499 11 15 18 24
Over 500 32 44 31 41
Total 72 75
Source: IES Survey
Table 3.5: Respondents’ first job by ethnicity and employment sector
Ethnic minorities Whites
Sector N % N %
Services 108 86 100 79
Industrial 18 14 27 21
Total 126 127
Source: IES Survey
Table 3.4: Respondents’ first job by ethnicity and private/public sector
Ethnic minorities Whites
Sector N % N %
Private 68 54 75 59
Public 58 46 52 41
Total 126 127
Source: IES Survey

The Institute for Employment Studies36
Similarly, no significant differences emerged in relation to size ofemployer. As indicated in Table 3.6, ethnic minority graduateswere slightly more likely than white graduates to be employedby large (ie over 500 employees) or small (ie under 100 employees)organisations. On the other hand, white graduates were morelikely to be employed by medium sized employers (ie between100 and 499 employees).
3.3.7 Geographical location
Figure 3.1 shows the geographical location of respondents’ firstjob. Ethnic minorities were more likely than whites to beworking in London and the South East, black graduates inparticular were heavily concentrated in the London area.
3.3.8 Summary
The survey findings in relation to respondents’ initialemployment have shown that, compared with their white peers,ethnic minority graduates were more likely to be in aprofessional job and have a higher starting salary. However, thedifference in job level was small, and higher salaries could reflectethnic minorities’ concentration in the London area. Whenlooking at other measures of ‘employment success’, ethnicminorities seemed to be in a less favourable position. Forexample, it took them longer to secure employment, they had toapply for more jobs, and ethnic minority women were less likelythan the rest of the sample to be in a full-time post. Differences interms of employment sector and size of firm were small and notstatistically significant. Finally, there was an indication that classof degree could account for some variations between differentethnic groups. For example, by controlling for this variable,ethnic differences in relation to the number of months it took tosecure employment virtually disappeared.
Figure 3.1: Location of first post-graduation job
Ethnic minorities Whites
��������������������������������������������������������������������������������������������������������������������������������������������������������������������������������������������������������������������������������������������������������������������������������������������������������
�������������������������������������������������������������������������������������������������������������������������������������������������������������������������������������������������������������������������������������������������������������������
Midlands21%
N. England22%
Rest of the UK2%
London/South East
55%
���������������������������������������������������������������������������������������������������������������������������������������������������������������������������������������������������������������������������������������������������������������������������������
������������������������������������������������������������������������������������������������������������������������������������������������������������������������������������������������������������������������������������������������������������������������������������������������������������������������������������
N. England24%
Rest of the UK9%
Midlands20%
London/ South East
47%
Source: IES Survey

Ethnic Minority Graduates 37
3.4 Current employment
The respondents’ current employment situation was explored inmore detail. As well as gathering information on their currentjob’s characteristics (eg status, job title, salary, etc.), issues aroundperceptions of job ‘quality’, promotion opportunities and workvalues were also explored.
Thirty-five per cent of ethnic minorities and 44 per cent of whiteswere still in their first job at the time of the survey, that is, twoand a half years after graduation.
3.4.1 Job characteristics
Two and a half years after graduation, ethnic minorities were stillless likely than whites to be working full time, the respectivefigures were 89 and 97 per cent. However, this was not true forIndians who were almost as likely as white graduates to have afull-time job (ie 96 per cent). While gender differences emergedagain, these were much smaller than the differences found withthe first job, and were not statistically significant.
We did not have enough cases to permit analysis of the data ofrespondents in self-employment (eight in total), in voluntary work(one), and on a short-term term contract (13). We therefore cannotestablish if, at this stage, any difference existed in terms of‘standard’ employment, as was the case with first jobs.
Using the SOC classification for jobs, the findings again showthat ethnic minority graduates were more likely than their whitecounterparts to have a ‘professional job’; the respective figureswere 37 and 26 per cent. However, the initial advantage ethnicminorities had in their first job in terms of salary, seemed todisappear in the current post. The current median starting salaryfor ethnic minorities was £13,500 compared with £14,000 forwhites. The number of cases in some of the sub-groups wasrather small, but current median salary seemed to be particularlylow for black graduates (£12,750). If one considers that blackrespondents were heavily concentrated in London, the extent ofdisadvantage in terms of earnings appears even greater.
The differences in employment sector, highlighted earlier in thesection on first job, almost disappear when looking at currentjob. Forty-three per cent of ethnic minorities and 41 per cent ofwhites were working in the public sector; 81 per cent of ethnicminorities and 83 per cent of whites were working in the servicesector (Tables 3.7, 3.8).
Differences in terms of size of firm emerged again in relation torespondents’ current job. However, compared with whites,ethnic minorities were now less likely to be working in a largeorganisation, and more likely to be found in medium and smallsized companies (Table 3.9).

The Institute for Employment Studies38
The geographical location of respondents’ current job (Figure 3.2)shows similar patterns to those which emerged in relation toinitial employment. Blacks were again found to be heavilyconcentrated in London, while the other ethnic minority groupsmore evenly distributed in three geographical areas, ie London/South East, Midlands and North England.
These findings on respondents’ current employment situationadd to the complexity of the picture which emerged from theanalysis of their first job. Some of differences between ethnicminority and white graduates persisted — for example, the formerwere still more likely to be found in a professional job. Otherearly variations disappeared, for instance, ethnic minorities werealmost as likely as whites to be employed currently in the privatesector. Finally, the initial advantage ethnic minorities had inrelation to salary levels disappeared in their current post; theywere now earning less than their white peers, while being moreconcentrated in the London area.
Table 3.8: Respondents’ current job by ethnicity and employment sector
Sector Ethnic minorities Whites
N % N %
Services 59 81 57 83
Industrial 14 19 11 16
Total 73 68
Source: IES Survey
Table 3.9: Respondents’ current job by ethnicity and employer’s size
No. ofemployees
Ethnic minorities Whites
N % N %
Under 100 23 34 19 28
100 to 499 18 29 13 19
Over 500 26 39 35 52
Total 67 67
Source: IES Survey
Table 3.7: Respondents’ current job by ethnicity and private/public sector
Sector Ethnic minorities Whites
N % N %
Private 42 58 39 59
Public 31 43 27 41
Total 73 66
Source: IES Survey

Ethnic Minority Graduates 39
3.4.2 Perception of job quality and work values
A number of questions were included to gain a better under-standing of respondents’ perception of their current job,promotion opportunities, work values and any difficulties theymight have faced in their current post.
Information was gathered to establish whether respondents feltthey were in a graduate level job. In recent years, there has beena considerable reduction in the number of ‘traditional’ graduateposts (eg a graduate training programme in a large company),and wide variations have emerged in graduates’ career paths.These changes have led to a debate about what constitutes agraduate level job, and how graduate under-employment can bemeasured. Using the findings from other studies (eg Connor andPollard, 1996), we devised a classification to establish the extentto which respondents regarded themselves as being in agraduate level job. Figure 3.3 shows the proportion of ethnicminority and white respondents who believed their current jobconstituted graduate level employment according to a number ofdifferent measures. The findings present a rather mixed picture.Ethnic minorities were more likely than whites to report that adegree was a formal entry requirement or helpful in securing thejob, and were also more likely to have entered via a graduatetraining programme. No difference between the two groupsemerged in relation to work which required graduate ability,while whites were more likely than ethnic minorities to say thatthe previous job holder was a graduate.
Replies to the question on perception of one’s job were alsoscored on a five point scale, with a higher score indicating thatthis was more likely to be regarded as a graduate job. Theanalysis shows virtually no difference between ethnic minoritiesas a whole and whites, their respective mean scores being 6.9 and
Figure 3.2: Location of current job
Ethnic minorities Whites
�������������������������������������������������������������������������������������������������������������������������������������������������������������������������������������������������������������������������������������������������������������������
�������������������������������������������������������������������������������������������������������������������������������������������������������������������������������������������������������������������������������������������������������������������
Midlands23%
N. England23%
Rest of the UK2% London/
South East 52%
��������������������������������������������������������������������������������������������������������������������������������������������������������������������������������������������������������������������������������
������������������������������������������������������������������������������������������������������������������������������������������������������������������������������������������������������������������������������������������������������������������������������������������������������������������������������������������������������������������������
N. England26%
Rest of the UK9%
Midlands16%
London/South East
49%
Source: IES Survey

The Institute for Employment Studies40
6.7. However, as indicated in Figure 3.4, variations emergedbetween the mean scores of particular ethnic minority groups. Atthe two extremes, there were black graduates with a low score of4.2, and Indians and Chinese with a high score of 8.0, while theother groups were clustered around the average for the sampleas a whole.
A question was also included to establish if and to what extentrespondents believed they were under-employed in their currentjob. Table 3.10 shows that 58 per cent of whites did not feelunder-employed, the equivalent figure for ethnic minorities was41 per cent. A considerably higher proportion of ethnic minoritiesthan whites felt they were slightly under-employed. However,only a small difference emerged between the two groups inrelation to those who believed they were ‘very under-employed’in their current job.
Figure 3.4: Mean scores of the extent current job was perceived as graduate level employment����������������������������������������������������������������������������������������������������������������������������������������������������������������������������������������������������������������������������������������������������������������������������������������������������������������������������������������������������������������������������������������������������������������������������������������������������������������������������������������������������������������������������������������������������������������������������������������������������������������������������������������������������������������������������������������������������������������������������������������������������������������������������������������������������������������������������������������������������������������������������������������������������������������������������������������������������������������������������������������������������������������������������������������������������������������������������������������������������������������������������������������������������������������������������������������������������������������������������������������������������������������������������������������������������������������������������������������������������������������������������������������������������������������������������������������������������������������������������������������������������������������������������������������������������������������������������������������������������������������������������������������������������������������������������������������������������������������������������������������������������������������������������������������������������������������������������������������������������������������������������������������������������������������������������������������������������������������������������������������������������������������������������������������������������������������������������������������������������������������������������������������������������������������������������������������������������������������������������
0 1 2 3 4 5 6 7 8
Indians/Chinese
Whites
Other Asians
Blacks
Others
Score 1-10
Source: IES Survey
Figure 3.3: Measures of graduate level employment reported by ethnic minorities and whites
��������������������������������������������������������������������������������������������������������������������������������������������������������������������������������������������������������������������������������������������������������������������������������������������������������������������������������������������������������������������������������������������������������������������������������������������������������������������������������������������������������������������������������������������������������������������������������������������������������������������������������������
������������������������������������������������������������������������������������������������������������������������������������������������������������������������������������������������������������������������������������������������������������������������������������������������������������������������������������������������������������������������������������
��������������������������������������������������������������������������������������
0% 10% 20% 30% 40% 50% 60% 70%
Degree helpful in getting thejob
Work requires graduate ability
Degree was a formal entryrequirement
Previous job holder was agraduate
Entry was via graduate traineeprogramme
Ethnic Minorities���
Whites
Source: IES Survey

Ethnic Minority Graduates 41
In an open ended question, respondents were asked to explain inwhat ways they felt they were under-employed. The responseswere grouped into four broad categories. As shown in Figure 3.5,equal proportions of ethnic minorities and whites believed theywere not using their degree knowledge and skills to the full. Ahigher proportion of ethnic minorities reported a lack of challeng-ing work, while a slightly higher proportion of white respondentsfelt their ability and intelligence were underestimated in theircurrent job.
Disappointment with the ‘quality’ of one’s job and withemployment opportunities was widespread, and was reportedby both ethnic minorities and whites. This seemed mainly to berelated to the graduate job market situation, rather thanperceived discrimination or disadvantage. The comments belowillustrate the ‘state’ of the graduate labour market as perceivedby survey respondents from different groups.
‘There are no opportunities at all for Law graduates and the situationdoes not seem to be getting better. Having made over 500 applicationsfor Articles I had to look for an alternative career ie teaching. I feelextremely disheartened.’ (Indian graduate)
I have been depressed about my experience of looking for a job.Although my current job is mundane and routine clerical work I hadto take it because I had no other offers . . . I am amazed at the lack ofgraduate trainee positions available. At times I felt that my degree
Figure 3.5: Reasons for feeling underemployed using ethnic minority and white respondents
��������������������������������������������������������������������������������������������������������������������������������������������������������������������������������������������������������������������������������������������������������������������������������������������������������������������������������������������
����������������������������������������������������������������������������������������������������������������������������������������������������������������������������������������������������������������������������������������������������������������������
������������������������������������������������������������������������������������������������������������������������
��������������������������������������������������������
0% 5% 10% 15% 20% 25% 30% 35% 40% 45%
Not using degree/other skillsto the full
Lack of challenging work
Own ability/intelligenceunderestimated
Other reasons
Ethnic Minorities
������ Whites
Source: IES Survey
Table 3.10: Respondents’ current job by ethnicity and under-employment
Feel under-employed? Ethnic minorities Whites
N % N %
Not at all 46 41 65 58
Slightly 35 31 20 18
Very 31 28 28 25
Total 112 113
Source: IES Survey

The Institute for Employment Studies42
was a waste of time and that education is not valued.’ (Whitegraduate)
I was very dissatisfied in my first job, I felt I was held back by myimmediate manager and I wasn’t given the opportunity to develop.’(Black graduate)
The survey included a number of questions on promotionopportunities. As indicated in Table 3.11, similar proportions ofethnic minority and white respondents had applied for, and beenconsidered for, promotion. However, whites seemed more likelyto have been promoted than ethnic minorities, but the numbersin these categories were rather small and the association was notstatistically significant. Finally, self-rated promotion prospectsmeasured on a one to five scale show that expectations werelowest among black respondents (median 2) and highest amongAsians, particularly Indians (median 4), while the median forother groups, including whites, was 3.
Questions on work values related to the importance of financialrewards, a company’s reputation and equal opportunities policy,training and career opportunities, employer’s geographicallocation, and the extent to which the current job suited one’sskills and interests. As shown in Figure 3.6, small differencesemerged between ethnic minorities and whites in relation to thesignificance of different work values, with the exception of theimportance of an organisation’s equal opportunities policy.Sixty-one per cent of ethnic minorities, but only 40 per cent ofwhites, said this was an important consideration in choosingtheir current job. We explored the importance of an employer’sequal opportunities policy separately for women and men fromthe two groups. The findings show that while very similarproportions of ethnic minority women (26 per cent) and men (29per cent) mentioned this as a significant factor, considerabledifference emerged between white women and men. Only tenper cent of white men mentioned a company’s equal opportunitiespolicy, compared with 30 per cent of white women. Later, inChapter 4, ethnic minority graduates’ perceptions of employers’equal opportunities policies and practices are discussed further,including how these might affect their choice of job.
Table 3.11: Respondents’ current job by ethnicity and promotion opportunities
Promotion opportunities Ethnic minorities Whites
N % N %
Applied for promotion 16 17 14 15
Considered for promotion 26 28 28 30
Been promoted 18 20 25 27
* Percentages were calculated out of the respective total number of respondents from ethnic minority and white groups whoanswered ‘yes’ to these questions.
Source: IES Survey

Ethnic Minority Graduates 43
Finally, respondents were asked if, and to what extent, they hadexperienced difficulties in their current job, in relation todifferent forms of discrimination and lack of job autonomy, poorcareer and development opportunities. Table 3.12, shows theproportion of respondents who reported having experiencedthese difficulties to a considerable extent (ie ‘a great deal’ and ‘afair amount’). Ethnic minorities were considerably more likelythan whites to report lack of challenging work and propertraining, while they were only slightly more likely to report lackof autonomy in their current job.
The number of respondents who reported various forms ofdiscrimination was small, and our conclusions are thereforerather tentative. Sixteen per cent of ethnic minorities hadexperienced race discrimination to a significant extent. However,
Figure 3.6: Important factors influencing choice of current job among ethnic minorities andwhite respondents
��������������������������������������������������������������������������������������������������������������������������������������������������������������������������������������������������������������������������������������������������������������������������������������������������������������������������������������������������������������������������������������������������������������������������������������������������������������������������������������������������������������������������������������������������������������������������������������������������������������������������������������������������������������������������������������������������������������������������������������������������������������������������������������������������������������������������������������������������������������������������������������������������������������������������������������������������������������������������������������������������
�������������������������������������������������������������������������������������������������������������������������������������������
����������������������������������������������������������������������������������������������������������������������������������������������������������������������������������������������������������������������������������������������������������������������������������������������������������������������������������������������������������������������������������������������������������������������������������������������������������������������������������������������������������������������������������������������������������������������������������������������������������������������������������������������������������������������������������������������
0% 10% 20% 30% 40% 50% 60% 70% 80% 90%
Suited own skills andinterests
Career and developmentopportunities
Training opportunities
Salary level
Geographical location
Company's reputation
Company's equalopportunities policy
Ethnic Minorities
��������Whites
Source: IES Survey
Table 3.12: Ethnicity by difficulties experienced in current employment
Type of difficulty Ethnic minorities Whites
N % N %
Lack of challenging work 35 32 26 23
Lack of proper training 29 27 22 19
Lack of autonomy 28 26 26 23
Race discrimination 18 16 3 3
Age discrimination 14 13 6 5
Sex discrimination 10 9 8 7
All the associations were not statistically significant with the exception of race discrimination.
* Percentages were calculated out of the respective total number of respondents from ethnic minority and white groups whoanswered ‘a great deal’ or ‘a fair amount’ to these questions.
Source: IES Survey

The Institute for Employment Studies44
a further 28 per cent had experienced race discrimination, but toa smaller extent (ie ‘a little’ or ‘not very much’). In total, 42 percent of ethnic minorities had experienced race discrimination intheir current job, albeit at different levels of intensity.
Some interesting variations emerged between different ethnicminority groups, the proportion of black respondents reportingracial discrimination being double that of Asians (66 comparedwith 33 per cent).
Although age was controlled for in the sample matching process, aconsiderably higher proportion of ethnic minorities than whitesmentioned age discrimination, though actual numbers were verysmall. Finally, there was little difference in the proportion ofethnic minority and white graduates reporting sex discrimination.
The issue of discrimination in employment is rather complex andcannot be fully explored in a structured questionnaire. Later on,in Chapter 4, we present some of the interview findings whichhighlight the different forms of discrimination experienced byethnic minorities, and how these affected their careers.
To summarise, some of the findings on job quality and workvalues seem to indicate that ethnic minority graduates facedgreater difficulties in employment and had less rewardingexperiences than their white counterparts. They were more likelyto feel under-employed, and less likely to have been promoted.They were also more likely to report lack of challenging workand autonomy, and limited training opportunities. Nearly half ofethnic minorities had experienced racial discrimination in theircurrent job, though mostly to a limited extent, and more ethnicminorities had experienced age discrimination than whites.However, other findings were less conclusive. On the whole, fewdifferences emerged in relation to graduate level employmentand most work values. Finally, some of the results also highlightvariations between different ethnic minority groups, with blackrespondents feeling more negative about their promotionprospects, being less likely to report they were in a graduate leveljob, and more likely to have experienced racial discrimination intheir current post than other ethnic minority graduates.
3.5 Unemployment
As shown earlier (Table 3.2), at every career stage included in thequestionnaire, ethnic minority graduates were more likely tohave been unemployed than their white peers, although thesedifferences were rather small. For example, six months aftergraduation, 18 per cent of ethnic minority and 15 per cent ofwhite graduates were unemployed. At the time of the survey, thegap between the proportions of unemployed respondents fromthe two groups was identical, the respective figures were ten andseven per cent.

Ethnic Minority Graduates 45
Ethnic minorities were more likely to have been unemployed forthree times or more since graduation (Table 3.13). In addition,the findings on the length of the longest period of unemployment(Figure 3.7) show that for ethnic minorities this was longer thanfor whites; the respective mean number of months are 8.4 and 7.4.
In an open ended question, respondents were asked about thefactors which had hindered them in their search for a suitablejob; their responses were classified as indicated in Table 3.14.Ethnic minorities were considerably more likely to mention lackof suitable educational qualifications and skills (eg non-vocationaldegree, lack of relevant experience), while white graduates were
Table 3.13: Ethnicity by number of times respondents had been unemployed
Number of timesin unemployment
Ethnic minorities Whites
N % N %
Once 25 52 33 69
Twice 12 25 12 25
Three times or more 11 23 3 6
Total 48 48
Source: IES Survey
Table 3.14: Ethnicity by type of factors inhibiting the search for a job
Ethnic minorities Whites
Type of factor* N % N %
Labour market 31 34 28 41
Education/skills 37 40 20 30
Non-work factors 7 8 10 15
Discrimination 9 10 1 2
Other 8 9 9 13
Total 92 68
*These factors were not listed in the questionnaire; they were included by respondents in an open ended question andsubsequently coded. Respondents could mention more than one factor.
Source: IES Survey
Figure 3.7: Mean number of months of the longest unemployment period among ethnicminority and white groups
�������������������������������������������������������������������������������������������������������������������������������������������������������������������������������������������������������������������������������������������������������������������������������������������������������������������������������������������������������������������������������������������������������������������������������������������������������������������������������������������������������������������������������������������������������������������������������������������������������������������������������������������������������������������������������������������
6.8 7 7.2 7.4 7.6 7.8 8 8.2 8.4
Ethnic minorities
Whites
Mean number of months
Source: IES Survey

The Institute for Employment Studies46
more likely to link their difficulties to labour market factors (eglack of suitable vacancies, very competitive job market). Thefindings seem to indicate that ethnic minorities were more likelyto ‘blame themselves’ for the failure to secure employment whilewhite graduates were more likely to attribute unemployment to‘external’ factors, outside their control. Only nine ethnic minorityrespondents mentioned racial discrimination as one of the factorsimpinging on their search for employment. However, thesereplies were given to an open ended question.
Finally, respondents who were still unemployed at the time ofthe survey were asked how many jobs they had applied for in theprevious six months. The findings show that ethnic minoritieshad a slightly higher level of job search activity than whites: themode average number of jobs they had applied for was 4.5 and 4respectively.1
As the quote below from an Indian respondent illustrates,unemployment had a considerable negative influence onrespondents’ attitudes and expectations.
‘Being unemployed after graduation was extremely uncomfortable. Attimes I applied for very basic jobs because queuing on the employmentexchange for a giro was a very demoralising experience. I’ve lost agreat deal of confidence and self-esteem.’
In summary, the findings show that ethnic minorities were onlyslightly more likely than whites to be unemployed. However,their longer period of unemployment, the greater occurrence ofthis experience and the tendency to ‘blame themselves’ could allcontribute to make this a much more damaging experience forunemployed ethnic minority graduates, compared with theirwhite peers.
3.6 Further study
In an increasingly competitive graduate labour market where afirst degree has become a common currency, a growing numberof graduates are looking for ways to enhance their employmentopportunities by taking a postgraduate qualification. There is noevidence, in general, that employer demand for post-graduatequalifications is increasing, nevertheless many graduates nowbelieve they need to acquire additional skills and knowledge inorder to ‘stand out’ and thus increase their chances in the labourmarket. One would expect graduates who have experienced oranticipate experiencing discrimination in employment, to beeven more likely to undertake further studies. Additionalqualifications could be seen as a way of partly overcoming the
1 The mode rather than the mean was calculated because thecategories included some extreme values.
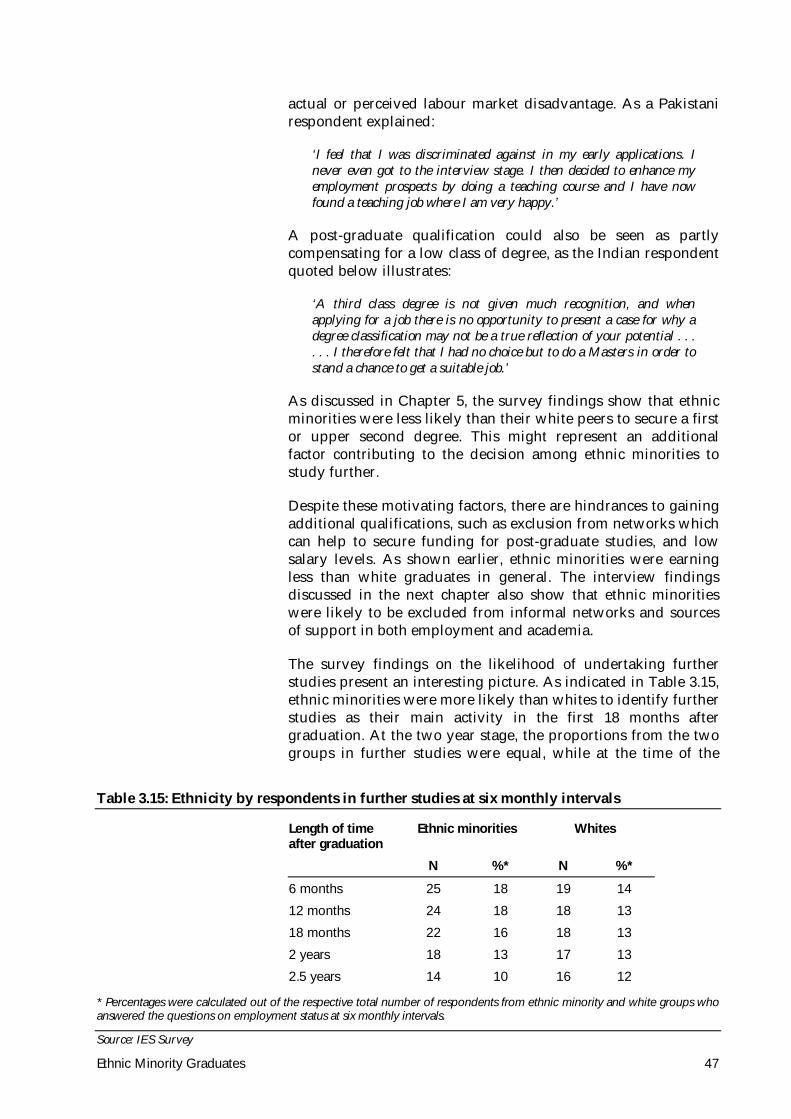
Ethnic Minority Graduates 47
actual or perceived labour market disadvantage. As a Pakistanirespondent explained:
‘I feel that I was discriminated against in my early applications. Inever even got to the interview stage. I then decided to enhance myemployment prospects by doing a teaching course and I have nowfound a teaching job where I am very happy.’
A post-graduate qualification could also be seen as partlycompensating for a low class of degree, as the Indian respondentquoted below illustrates:
‘A third class degree is not given much recognition, and whenapplying for a job there is no opportunity to present a case for why adegree classification may not be a true reflection of your potential . . .. . . I therefore felt that I had no choice but to do a Masters in order tostand a chance to get a suitable job.’
As discussed in Chapter 5, the survey findings show that ethnicminorities were less likely than their white peers to secure a firstor upper second degree. This might represent an additionalfactor contributing to the decision among ethnic minorities tostudy further.
Despite these motivating factors, there are hindrances to gainingadditional qualifications, such as exclusion from networks whichcan help to secure funding for post-graduate studies, and lowsalary levels. As shown earlier, ethnic minorities were earningless than white graduates in general. The interview findingsdiscussed in the next chapter also show that ethnic minoritieswere likely to be excluded from informal networks and sourcesof support in both employment and academia.
The survey findings on the likelihood of undertaking furtherstudies present an interesting picture. As indicated in Table 3.15,ethnic minorities were more likely than whites to identify furtherstudies as their main activity in the first 18 months aftergraduation. At the two year stage, the proportions from the twogroups in further studies were equal, while at the time of the
Table 3.15: Ethnicity by respondents in further studies at six monthly intervals
Length of timeafter graduation
Ethnic minorities Whites
N %* N %*
6 months 25 18 19 14
12 months 24 18 18 13
18 months 22 16 18 13
2 years 18 13 17 13
2.5 years 14 10 16 12
* Percentages were calculated out of the respective total number of respondents from ethnic minority and white groups whoanswered the questions on employment status at six monthly intervals.
Source: IES Survey

The Institute for Employment Studies48
survey a slightly higher proportion of whites than ethnicminorities were found in this category.
The different post-graduation courses mentioned by respondentswere grouped into three broad categories, as indicated in Table3.16. Ethnic minorities were less likely than whites to haveundertaken a professional course, but they were more likely tobe studying or to have studied for a Master, PhD/MPhil or post-graduate diploma.
There was virtually no difference in terms of mode of study, with60 per cent of ethnic minorities and 59 per cent of whites havingstudied on a full-time basis.
Respondents were asked about the importance of different factorsin deciding to undertake further studies. The findings presentedin Figure 3.8 seem to validate the hypothesis that additionalqualifications are seen by ethnic minorities as a way ofovercoming labour market disadvantage. A considerably higherproportion of ethnic minority respondents than whites mentionedthe need to enhance their career prospects as important ininfluencing their decision to study further. The percentage
Table 3.16: Ethnicity by type of further studies
Type of course Ethnic minorities Whites
N % N %
PhD/MPhil, Master, post-grad.diploma
37 63 30 50
Professional qualification 15 25 19 32
Other 7 12 11 18
Total* 59 60
*Respondents could mention more than one course
Source: IES Survey
Figure 3.8: Important factors in deciding to undertake further studies among ethnicminorities and white groups
��������������������������������������������������������������������������������������������������������������������������������������������
������������������������������������������������������������������������������������������������������������������������������������������������������������������������������������������������������������������������������������������������������������������������������������������������������������������������������������������������������������������������������������������������������������������������������������������������������������������������������������������������������������������������������������������������������������������������������������������������������
���������������������������������������������������������������������������������������������
����������������������������������������������������������������������������������������������������������������������������������������������������������������������������������������������������������������������������������������������
0% 10% 20% 30% 40% 50% 60% 70% 80% 90% 100%
To enhance career prospectsin general
To enhance career prospectsin particular field/job
To follow a personal interest
Lack of employmentopportunities after graduation
To gain formal entryrequirement to a profession
Ethnic Minorities
��������Whites
Source: IES Survey

Ethnic Minority Graduates 49
difference was statistically significant. Similarly, a higherproportion of ethnic minorities saw an additional qualification asan important way to improve their career prospects in a specificjob or field of employment. More than three-quarters of ethnicminorities also mentioned the lack of employment opportunitiesafter graduation as an important reason for studying, while justover half of whites saw this as important. Again this associationwas statistically significant.
Ethnic minorities were also more likely than whites to mention theneed to gain formal entry to a profession as a reason for studyingfurther, but the difference was not very large. Almost equalproportions of respondents from the two groups mentioned thedesire to follow a personal interest as a significant factor.
3.7 Career patterns
We now turn to analysing respondents’ career paths in moredetail to establish if, and to what extent, variations between ethnicminorities and whites persist in career progress. Wheneverpossible, variations between different ethnic minority groups arealso explored.
3.7.1 Career profiles
One way of exploring career histories is to identify the mostcommon patterns of different labour market states, and restrictthe analysis to the most common profiles (see for exampleConnor and Pollard, 1996). We identified 92 different careerprofiles, each pattern comprising different combinations of thefive possible labour market states at the five points in time (seeTable 3.2). The four most common career profiles were:
permanent employment at each stage since graduation, whichaccounted for 38 per cent of the sample (ie 104 cases)
short-term employment at the six month stage, then inpermanent employment at all the other stages, whichaccounted for six per cent (ie 16 cases)
unemployed at the six month stage, and then in permanentemployment at each subsequent stage, which accounted forfive per cent of the sample (ie 13 cases)
in further study at all stages, four per cent of the sample (ie 11cases)
All other combinations included less than ten cases.
Only the first career path mentioned above (ie in permanentemployment at all stages) had a sufficient number of cases tocarry out any meaningful analysis. Thirty-three per cent of ethnicminority graduates had been in permanent employment sincegraduation, compared with 42 per cent of their white peers.

The Institute for Employment Studies50
However, probably due to the small size of the sub-sample, thisassociation was not statistically significant.
As mentioned earlier, the effect of potential confoundingvariables (ie gender, type of university, degree subject and age)had been controlled for at the sampling stage. However, class ofdegree is becoming increasingly important in a very competitivegraduate labour market. As the employers’ interviews in Chapter6 show, a low class of degree (ie lower second and below) canhave a considerable negative effect on one’s career prospects, as a‘good’ degree has become an important shortlisting criterionused by employers.
We found that when controlling for class of degree, differencesbetween the two groups virtually disappeared: 47 per cent ofethnic minority graduates with a first or an upper second degreehad been in permanent employment since graduation, thecorresponding figure for whites was 45 per cent. Again, it shouldbe noted that sample numbers were small and these findingsmust be interpreted with a certain degree of caution. However,given the potential effect that class of degree can have onemployment opportunities, it seems even more important toexplore further the association we have identified betweendegree class, ethnicity, and employment outcomes.
We also looked at different sub-groups of respondents to establishwhether differences relating to age and gender persisted withindifferent ethnic groups. We explored the association betweenpermanent employment since graduation and ethnicity separatelyfor women and men. As indicated in Table 3.17, the differencebetween ethnic minority and white women was larger than thatbetween men from the two groups. While, again, we are dealingwith rather small numbers (but the association was statisticallysignificant), this result could support the ‘double disadvantage’theory, whereby ethnic minority women face disadvantage inemployment on the basis of both gender and race.
We also explored any variations for respondents in different agegroups: ie 26 and under, versus over 26. Older respondents weremore likely to have been in permanent employment all the time.However, within both the younger and older age groups, whiteswere more likely to have been in permanent employment since
Table 3.17: Ethnicity and gender of respondents who had been in paid employment at allcareer stages
Women Men
N % N %
Ethnic minorities 19 42 30 48
Whites 26 58 32 52
Total 45 62
Source: IES Survey

Ethnic Minority Graduates 51
graduation. This difference was particularly marked in the olderage group, where 40 per cent of ethnic minorities had been inpermanent employment all the time; the corresponding figure forwhites was 52 per cent. However, because of the small samplesize, the association was not statistically significant.
3.7.2 ‘Successful’ graduates
We also explored differences in the employment status of ethnicminority and white respondents by using the Gregson andTaylor (1987) definition of graduates’ ‘success’ in the labourmarket. This is defined in terms of permanent employment orfurther study. This is obviously a rather crude measure of‘success’, as it does not take into account factors such job‘quality’, level, suitability and salary. However, the analysis ofthe data using this indicator of labour market success showssome interesting and relatively consistent patterns. As indicatedin Figure 3.9, the gap between ‘successful’ and ‘unsuccessful’ethnic minority and white respondents was very small in the first12 months after graduation (ie two per cent at six months, andthree per cent a year after graduation). However, this increasedconsiderably over the following year; by June 1995 it went up tonine per cent, and while it narrowed over the next six months,there was still a seven per cent gap at the time of the survey.
Given the small sample size, it was not possible to conduct adetailed analysis of the career patterns of all the different ethnicgroups. However, we explored differences between black andAsian respondents, using the measure of ‘success’ describedabove.
As shown in Table 3.18, when looking at ‘success’ for blackgraduates and Asians separately, no clear pattern emerges.
Figure 3.9: ‘Successful’ graduates from ethnic minorities and white groups
50%
60%
70%
80%
90%
100%
6 months 12 months 18 months 2 years 2.5 years
Period since graduation
Ethnic Minorities Whites
Source: IES Survey

The Institute for Employment Studies52
Initially, Asians were more likely than black respondents to havesecured permanent employment or to be in further study.However, the situation is reversed a year after graduation. Sixmonths later no difference at all emerged between the twogroups. After two years, Asians were more likely to be found inthe ‘successful’ category. But at the time of the survey, a slightlyhigher proportion of black respondents were in permanentemployment or further study.
The analysis presented earlier on respondents’ status at sixmonthly intervals showed some small differences between ethnicminorities and whites, but provided no evidence that the gapbetween the two groups might widen or narrow over time. Theanalysis of the employment status data using the Gregson andTaylor (1987) definition of ‘successful’ graduates, shows moreclear and consistent differences between ethnic minorities andwhites, particularly two years after graduation. However, asmentioned earlier, this is a rather crude measure of success, andfindings on other ‘success’ measures discussed below show someless clear patterns.
3.7.3 The impact of a ‘good start’ and further studies
Respondents’ career success could also be defined in terms ofcurrent permanent employment. Again we realise that this is arather crude measure of success, nevertheless, it helps to testfurther some of the findings on variations between ethnicminorities and whites. One might expect the ability to secure apermanent post within six months of graduation to have apositive influence on current employment status. Indeed wefound that 75 per cent of respondents who had found apermanent job within six months of graduation, were also in thesame employment position at the time of the survey. Thecorresponding figure for the rest of the sample was 64 per cent.However, our findings show that while initial permanentemployment is an advantage for both ethnic minorities andwhites, the gap between the two groups identified earlier
Table 3.18: Black and Asian respondents by ‘success’ in the labour market at six monthlyintervals
Length of timeafter graduation
Blacks Asians
N %* N %*
6 months 15 60 55 66
12 months 19 76 60 73
18 months 20 80 66 80
2 years 20 80 70 84
2.5 years 22 88 71 86
* Percentages were calculated out of the total number of black and Asian respondents who answered this question.
Source: IES Survey

Ethnic Minority Graduates 53
remained. Seventy-two per cent of ethnic minorities, but 77 percent of whites, who had secured a permanent job six monthsafter graduation, were still in the same employment position atthe time of the survey.
Similarly, one would expect further studies to constitute anadvantage in terms of current employment status. Our findingsshow that 84 per cent of the respondents who had undertaken acourse leading to a qualification, were now in permanentemployment. However, again, while this was an advantage forboth ethnic minority and white groups, the latter seemed tobenefit more. Eighty-two per cent of ethnic minorities and 86 percent of whites who had undertaken further studies, were inpermanent employment at the time of the survey.
3.7.4 Career ‘turbulence’
We also explored respondents’ career paths by analysing thenumber of changes in employment status for each respondent.This analysis provided a measure of career changeability orcareer ‘turbulence’. The number of career states were groupedinto three categories which included: employment, furtherstudies and not in employment (ie unemployed or not availablefor employment). The findings in Table 3.19 show that ethnicminorities experienced a higher level of career turbulence thanwhites. The former were more likely than the latter to havechanged employment status in the two and a half years sincegraduation. However, it must be emphasised that some of thedifferences were very small, and the association was notstatistically significant.
The experience of the black respondent reported below gives anidea of the instability faced by graduates who entered the labourmarket.
I believe many graduates have similar experiences to my own: I firstgot a temporary job, this was a good way to gain work experience, butit made me feel very financially insecure. I also had to do somevoluntary work in order to get some additional experience, but againmoney was a problem. I then grabbed the first permanent job thatcame along because I needed the money, and then discovered it was wellbelow my abilities and potential. I am now looking for another job.’
Table 3.19: Respondents’ number of career status changes, by ethnicity
Career status changes Ethnic minorities Whites
N % N %
No changes 74 54 79 58
One change 36 27 37 27
Two or more changes 26 19 20 15
Total 136 136
Source: IES Survey

The Institute for Employment Studies54
3.7.5 Career satisfaction
Finally, respondents were asked to what extent they weresatisfied with their post-graduation career so far. As shown inTable 3.20, white respondents reported a higher level of careersatisfaction than ethnic minorities.
The level of career satisfaction varied considerably betweendifferent ethnic groups. At one extreme we find Indians, whoselevel of career satisfaction was higher than for whites: 74 per centsaid they were satisfied with their career to date. At the otherextreme, there were black respondents: only 36 per cent reportedsatisfaction with their post-graduation career. The higher level ofsatisfaction among Indians and whites could partly be related toearlier findings on graduate level employment and promotionprospects. White and Indian respondents were more likely toregard their current job as graduate level employment, they hadhigher current salaries, and had higher expectations about theirpromotion prospects. On the other hand, the findings on under-employment and the experience of race discrimination in theworkplace, could explain the low level of satisfaction amongblack graduates. These results seem to support some of thefindings from other studies (eg Jones, 1993) which have shownthat this group is likely to face greater disadvantage in the labourmarket.
3.8 Conclusion
The survey findings on respondents’ career patterns seem toconfirm some of the earlier research about the disadvantagefaced by ethnic minorities in the labour market, including thosewith a degree. At every post-graduation career stage, ethnicminority graduates were less likely to be in permanent employ-ment and slightly more likely to be unemployed than their whitepeers. In addition, the longest period of unemployment waslonger for ethnic minorities than whites, and they were alsolikely to have been unemployed for a greater number of times.
Ethnic minorities were less likely than white graduates to havebeen in permanent employment since graduation. Using the
Table 3.20: Respondents’ career satisfaction, by ethnicity
Career satisfaction Ethnic minorities Whites
N % N %
Satisfied 64 57 75 65
Neither satisfied nordissatisfied
20 18 18 16
Dissatisfied 29 26 22 19
Total 113 115
Source: IES Survey
Ethnic Minority Graduates 55
Gregson and Taylor (1987) measure of graduate ‘success’, wefound not only that ethnic minorities were less likely than whitesto be ‘successful’, but also that the gap between the two groupswidened in the first two years. While this narrowed over thefollowing six months, it was still seven per cent at the time of thesurvey. Looking at factors which might have a positive influenceon the likelihood of being in permanent employment (ie initialpermanent employment and further study), we found that whilethese seemed to have positive influence on both ethnic minorityand white graduates, the latter seemed to benefit more fromthese additional advantages.
The findings on first job after graduation, and permanentemployment, present a more mixed picture. Some of the findingsseem to confirm the results on career patterns, which indicatethat ethnic minorities faced greater difficulties in the labourmarket. For example, compared with their white peers, they hadto apply for a greater number of jobs, and it took them longer tosecure their first post. In their current job they were earning less,they were more likely to feel under-employed, and experiencedgreater difficulties. They were also less likely to have beenpromoted and to be satisfied with their career so far. However,some of the findings also show little or no differences betweenethnic minority and white graduates. For example, there were novariations in relation to the likelihood of being in ‘non-standardemployment’. No significant differences emerged in relation toemployer’s size and sector. Similarly, the findings on the extentto which respondents regarded their job as graduate levelemployment are not conclusive, with a very small differencebetween the mean scores measuring the level of one’s job. It isinteresting to note that ethnic minorities were more likely to holda professional job, and this was the case for both their first post,as well as their current one. Initial salaries of ethnic minoritieswere also higher than those of whites, however, the situation wasreversed by the time of the survey.
Variations between different ethnic groups could be exploredonly to a limited extent, because of the small number of cases insome of the sub-groups. Some of the findings seem to confirmprevious research (eg Jones, 1993) which has shown that someethnic minority groups face greater disadvantage, while thesituation for other highly qualified ethnic minority graduates isvery similar to that of whites. For example, we found evidence tosuggest that black graduates experienced greater disadvantage inthe labour market compared with other ethnic minorities, asshown by the findings on salary level, career satisfaction, racialdiscrimination, promotion prospects and under-employment. Wealso found that the employment situation of Indians was in manyways similar to that of whites, as indicated by the findings ongraduate level job and promotion prospects. However, not all theresults highlight these differences. While these variations meritbeing explored further, we do not have conclusive evidence tosuggest that any clear patterns are emerging.

The Institute for Employment Studies56
The impact of class of degree has emerged as an important issue,as it seemed to have a considerable influence on respondents’careers. This was shown by the findings relating to respondentswho had been in permanent employment since graduation, andby the length of time it took them to secure the first job. Whenwe controlled for class of degree, in the first case, the differencebetween ethnic minorities and whites virtually disappeared,while in the second case, it was considerably reduced. Given thatour survey results, presented in Chapter 5, show that ethnicminorities were more likely to get a lower class of degree thantheir white peers, the question of why ethnic minorities seem tobe achieving lower academic results is an issue worthy of furtherinvestigation.

Ethnic Minority Graduates 57
4. Invisible Barriers, Real Discrimination
This chapter follows on from the previous one to give greaterinsight into ethnic minority graduates’ experiences in the labourmarket. It draws mainly from the in depth-interviews conductedwith a sub-sample of 25 survey respondents from different ethnicminority groups. These follow-up interviews explored in greaterdepth their education and employment histories, and the maininfluences on their career development.
The main themes which guided this qualitative stage of the studyincluded:
the extent to which the main influences on respondents’ careerdevelopment differ from the ‘traditional’ factors impinging ongraduates’ early careers, eg socio-economic background, typeof school/university attended
respondents’ perceptions of the main structural constraints andthe extent to which these are specifically linked to ethnicity orto other variables, eg gender, age, family circumstances
the extent to which discrimination and the anticipation ofdiscrimination might have influenced their career choices andmoves
the role of career guidance and the main sources of encourage-ment and support, and in particular what coping strategiesand sources of external support can lead to positive outcomes.
Some of these themes had emerged in the research literaturereview (see Chapter 2).
First, some examples of career profiles of interviewees arepresented in order to illustrate the variety of careers andexperiences of individuals.
4.1 Career profiles
4.1.1 Adenike
Adenike, 28, African, BA in Psychology, IIii.
Adenike went to a comprehensive school where she and hersister were the only black children. This was a very negative

The Institute for Employment Studies58
experience, which considerably impinged on her academicperformance. As she explained:
‘We were the only black children in the school and we stood out, it felthorrible, we wanted to blend in but we couldn’t. The other childrenused racist language and the teachers wouldn’t challenge it, they’dsay it was just a joke.’
Adenike felt that career teachers never really listened to what shewanted to do, and their advice was based mainly on theirstereotypical views of black people. This meant that the careeroptions offered to her were very narrow (eg nursing, work withthe elderly) and she was never encouraged to carry on studying.She was advised to do a BTEC rather than ‘A’ levels. Adenikethen worked for a few years in clerical and secretarial jobs, butshe found these boring and unchallenging, and decided to goback to full-time education. She went to do a psychology degreeat a former polytechnic in London. At university, Adenike feltunsupported and had a very difficult time. As a mature studentshe was initially told that she would receive additional help andsupport, but these never materialised. In addition, there were afew lecturers who were well known for their racist attitudes, buttheir behaviour was never challenged, and it was just somethingblack students had to put up with. While at university, Adeniketook part in the mentoring scheme and she felt this had a verypositive influence on her subsequent career. Her mentor helpedher to explore different career options, gave her invaluable careeradvice and guidance, and put her in touch with other blackprofessionals.
By the time of graduation Adenike had decided to pursue acareer in forensic psychology. She was aware that this was a verycompetitive field, and that she would have to work hard tosucceed. She took a temporary job soon after completing hercourse. She then got her current post as care worker in a hostelfor people with mental health problems. She has applied for afew jobs in her chosen field, but without success so far. Currentlyshe is taking a diploma in criminal psychology and also teachingpart-time in a prison. She hoped that the additional qualificationand the prison work experience would enhance her prospects ofsecuring a forensic psychology post.
4.1.2 Roy
Roy, 25, African-Caribbean, BSc in Business and Management, IIi.
Roy went to a comprehensive school which was very mixed interms of ethnic composition. He was very ambitious and hadalways wanted to go to university. By the time he did his ‘A’levels he had already decided he wanted a business career. Hisparents always encouraged him to study, valuing education andseeing it as a way of avoiding some of the job disadvantages theyhad suffered. Some of his teachers were also very supportive, asRoy explained:

Ethnic Minority Graduates 59
‘Three of my teachers gave me inspiration and encouragement . . . . Iknew what I wanted to do in life and they gave me options about whatto do next and how to achieve it.’
Roy went to an ‘old’ university in the North of England. Overallhis experience of higher education was positive, and thedifficulties he faced were not related to racial discrimination, ashe put it:
‘Lecturers were helpful if you could find them! There were lots ofdoctors at home writing papers but you could book appointments,they had time for us, for all students . . . . The Careers Officeprovided all you could possibly need.’
After completing his degree, Roy travelled around Europe for afew months, had two temporary jobs, and was now working asan accountant trainee in London. Roy was not very satisfied withhis career progress so far. It took him longer than he hadanticipated to secure a permanent post. But more importantly, hefelt that his current job did not provide enough developmentopportunities:
‘I’m not getting the experience I need so I’m looking for a new job. Ineed a proper graduate scheme to get the necessary experience to passmy exams. There are no development opportunities. They just tooktwelve graduates for accounting roles, but they weren’t originallygraduate jobs . . . . I graduated in 1993 and by now I should havemade more progress. Most other people on my course have beenpromoted and are in good jobs, I don’t know why not me.’
4.1.3 Nilesh
Nilesh, 23, Indian, BSc in Chemistry and Chemical Technology, III.
Nilesh went to a white dominated school where initially he wasthe only ethnic minority pupil. The school was very academicallyoriented and, he felt, provided a ‘good start’. He always sawhigher education as a ‘natural progression’. The school’sencouragement was reinforced by the family who expected himto do well at school and go to university. For his parents, thiswas seen as a way to give him a better future than they hadenjoyed.
Nilesh went to an established university in the North of England.He did not suffer any direct discrimination while at university,however, during this time he became acutely aware of racialdiscrimination in employment, as he explained:
‘I realised that a black person has to work twice as hard to achieve thesame goals as a white person.’
However, he found that lecturers and career advisers wereunwilling to talk about racial discrimination, they even found itdifficult to recognise that such fears were real for ethnic minoritystudents.

The Institute for Employment Studies60
A low class of degree and the lack of employment opportunitiesin his field (ie chemistry) strongly influenced Nilesh’s earlycareer decisions. Soon after graduation his main preoccupationwas to find a job and avoid unemployment, rather than pursue aspecific career. He had two temporary clerical posts, beforesecuring his current job with a financial company. Initially, thejob was offered to him on a temporary basis, and involvedmainly clerical work. However, he had the opportunity to workat the ‘front desk’ dealing with clients’ queries, and was thenoffered a permanent position as Customer Services Executive. Healso had the opportunity to get involved in analysing financialinformation and writing a computer program for the analysis.Because of this experience, he decided to pursue a career infinance as an investment analyst. He had already obtained aFinancial Planning Certificate and was currently studying for theInvestment Management Certificate.
Despite the difficult start, Nilesh was positive about his futurecareer prospects. He saw himself in a Trading Fund Managerposition in five years time, and in an Investment Manager post inthe longer term. He thought that he would fulfil his ambitions ifhe continued to work hard. On the whole he did not feel thatracial discrimination had had a significant influence on his careerso far, and did not think this was likely to be a problem in thefuture. Notwithstanding this optimism, he did anticipate somebarriers, as he put it:
‘The City is about who you know, and not what you know. This is thereal barrier in the future.’
4.1.4 Rakhi
Rakhi, 25, Pakistani, BA in Social Sciences, IIii.
Rakhi went to a comprehensive school. While she always wantedto go to university, she was not sure whether her family wouldallow her to do so. She went to a ‘new’ university in theMidlands. Her choice of institution was largely determined bygeographical location. While her family had reluctantly agreed toallow her to go to university, they would have never allowed herto study away from home. At university, Rakhi found it difficultto settle, particularly in her first year. She was the only Asianstudent on the course, and her lifestyle was considerablydifferent from that of her (white) peers. For example, as aMuslim she was not allowed to drink alcohol, and as a Pakistaniwoman the amount of time she could spend outside the homewas limited. In addition, she felt that (white) lecturers andcounsellors did not understand nor acknowledge cultural andethnic diversity. Because of this, she was very reluctant to talkabout any family problems with university staff, even whenthese were affecting her academic performance. All these factorscontributed to the sense of isolation and marginalisation sheexperienced during this period.

Ethnic Minority Graduates 61
After completing her degree, she felt that the constraints on hergeographical mobility considerably limited her career options.She wanted to work in the financial sector, but most of the jobs inthis field required people to be geographically mobile, at leastinitially. She applied for several jobs in finance in the local area,but without any success. She then worked on a voluntary basis asa youth worker in a community centre for Asian women for afew months. Because of this experience she was able to secureher current job as Asian worker with the Citizens AdvisoryBureau. Rakhi was very happy in her current job, and wasconsidering the possibility of qualifying as a civil rights lawyer.Her workplace was very mixed in terms of ethnicity, but she feltthat in many other places diversity was not recognised andvalued, and black people ‘didn’t fit in.’
4.2 Discrimination in employment
The findings from the survey and follow-up interviews showedclearly that discrimination in employment was still perceived asa problem by some ethnic minority graduates. While blatantforms of discrimination were rare, more subtle forms of discrimin-ation and exclusion still persisted, and could limit ethnic minoritygraduates’ career opportunities. As one respondent who workedfor the ethnic minority mentoring unit of a university explained:
‘Ethnic minority graduates face a brick wall when they enter thelabour market. Racial discrimination has become very subtle but it’sstill pervasive. Discrimination has gone underground and because ofthat it’s difficult to identify and challenge it.’
In the interviews, many examples were reported by ethnicminority graduates of difficulties in obtaining practiceplacements, of white job applicants with lower qualifications (eg‘A’ levels) obtaining jobs for which they had not even beenshortlisted, and feelings of being denied developmentopportunities available to other white colleagues.
The anticipation of discrimination could also limit ethnicminority graduates’ perceptions of ‘feasible’ career options. Asdiscussed in the next chapter, some of the ethnic minoritygraduates interviewed were rather reluctant to enter professionswhere black people and Asians are ‘invisible’, partly because ofthe perceived difficulties of having to operate in predominantlywhite professions.
The extent to which the anticipation of discrimination affectedrespondents’ career choices and moves after graduation variedconsiderably. Some respondents believed public sector employersto be generally ‘more advanced’ in terms of equal opportunitiespolicies and practices. In particular, respondents thought that inthe public sector, equal opportunities initiatives had been more‘visible’ and had sent some clear messages. In addition, moreefforts had been made to change organisational cultures, and to

The Institute for Employment Studies62
ensure that the values of employees from different groups(including ethnic minorities) were recognised and accepted.Probably because of these efforts, ethnic minorities were believedto be better represented in the public sector. Similarly, some ofthe larger and more prestigious private sector employers werealso perceived as being more aware of the need to deal withdiscrimination at work. However, in the current economicclimate, respondents felt they could not exclude potentialemployers on the basis of their equal opportunities record. Whilerespondents had some clear views and preferences in relation tothe type of employer they would prefer to work for, economiccircumstances seriously limited their choice.
Another important issue emerging from the interviews was theextent to which a number of inter-related factors, such as comingfrom a former polytechnic, having a low class of degree, being amature student, and the perceived lack of suitable employmentopportunities, had a significant impact on long-term careeraspirations and expectations. However, perceptions of racialdiscrimination also contributed to undermining graduates’confidence and career aspirations. There were examples ofrespondents who at the beginning of their graduate career wereconfident, enthusiastic and very career orientated. However,they became very demoralised and disillusioned after strugglingfor two and a half years in a very competitive graduate labourmarket, where many felt they faced racial discrimination, inaddition to other forms of disadvantage. Their confidence hadbeen seriously undermined and their main priority was to findjust ‘any job’, partly in order to repay their student loan. Theviews expressed by the Asian graduate quoted below reflectedthe feelings of a number of respondents:
‘It will be a miracle if I achieve my ambition [ie to become a lawyer]and the main barrier is discrimination. If someone had told me thissix years ago I wouldn’t have believed them, but now I haveexperienced discrimination directly and I know what the real worldout there is like.’
As mentioned earlier, blatant forms of discrimination inemployment are now rare. However, in recent years numerousstudies on different aspects of discrimination have highlightedmore subtle forms of exclusion and disadvantage. Some of thesealso emerged from our research and are discussed further below.
4.3 Organisational cultures and the acceptance of diversity
In recent years, there has been a growing understanding andrecognition of the extent to which organisational cultures cancontribute to exclusion and discrimination, despite the existenceof equal opportunities policies and procedures. Organisationalculture is usually defined in terms of shared symbols, language,practices (‘how we do things around here’), and deeplyembedded beliefs and values. Organisational culture has become

Ethnic Minority Graduates 63
a salient issue in the study of discrimination, not only because itcan represent a serious barrier to change, but because such abarrier is ‘slippery’ and elusive. It is part of the taken-for- granted,everyday reality and it is therefore hard to see and challenge.
This ‘invisible’ barrier was clearly perceived by a number ofrespondents who had often felt that they ‘didn’t fit in’ in someworkplaces. However, the mechanisms which led to this exclusionand marginalisation were not immediately obvious, and thereforemore difficult to deal with. As with their experiences atuniversities discussed in the next chapter, the absence of signsand images reflecting the acceptance of cultural and ethnicdiversity could make respondents feel very uncomfortable oreven marginalised. This was particularly problematic forgraduates who wanted to maintain their cultural identity. Forexample, some respondents felt that in order to ‘fit in’ theywould have to wear ‘western clothes’, speak with an Englishaccent and more generally ‘act English’. There were also examplesof graduates who either changed their name into an English onein job application forms, or considered doing so, as they believedthat an Asian or African name could constitute a disadvantage.In one of the Careers Services we visited, staff advised Asianstudents not to print their name in bold at the top of their CV!
There were numerous other examples which illustrate the extentto which respondents felt their cultural and ethnic backgroundcould constitute a barrier in some workplaces. ‘Fear of diversity’was mentioned by a number of people, as the respondent quotedbelow explained:
‘. . . it takes a lot for firms to consider employing people from ethnicminorities. If you are good enough, you might get a job, but it’s noteasy. Personality is so important and whether the personinterviewing you is comfortable with black people, some aren’t.’
The lack of shared values and experiences, and the refusal torecognise and deal with these differences in constructive ways,were also important issues which emerged from the interviews.The graduate quoted below talks about her contrastingexperiences of working in two very different schools:
‘I taught in a grammar school for a few months, I felt veryuncomfortable because I wasn’t able to be myself. It was a very whitedominated culture, and there were many signs that told me that Ididn’t really belong there, the dress code, the topics of conversation.They had very rigid attitudes and they were not prepared to acceptanything new . . . . At the beginning I used to sit in the middle of thestaff room and tried to talk to everybody, but I slowly moved to acorner and just minded my own business . . . . In another school Iworked, the culture was very open, there was an emphasis on multi-culturalism, new ideas were encouraged, there was great variety interms of the children’s ethnic background . . . at first I didn’t evennotice that I was the only Asian teacher.’
The Institute for Employment Studies64
Some respondents also felt that employers’ expectations thatgraduates should have been involved with extra-curricularactivities related exclusively to participation in typically ‘white’activities, eg a cricket or rugby club. Neither employers norcareer advisers had ever given them any indication that religiousand other activities within their own community would beconsidered valuable and relevant. Indeed, a piece of advice thatgraduate careers adviser gave to ethnic minority students wasnot to mention in their job applications any involvement theymight have had with the University’s Islamic Society.
Finally, exclusion from informal networks was perceived asanother form of disadvantage. Success and progress withinorganisations was sometimes felt to depend on access to informalclubs and networks where ‘the ‘real’ business goes on’. They couldalso provide access to information, advice, support and mentorsto help improve career opportunities and success within anorganisation. Some respondents had had access to thesenetworks, by being ‘in the right place at the right time’. Othershad benefited from more formalised sources of support outsideas well as inside organisations (eg British Caribbean Chamber ofCommerce, or a mentoring scheme within an organisation).However, in many cases respondents felt excluded from thesenetworks and clubs. They tended to be seen as inaccessible, oraccessible only to those sharing narrowly defined cultural valuesand beliefs — eg ‘white boys’ networks’.
4.4 Tokenism: ‘we’ve got two of those’
In recent years a combination of economic and social changeshave pushed discrimination and equal opportunities high up thepolitical agenda. However, despite some improvements in theemployment situation of traditionally disadvantaged groups(including ethnic minorities), some people would argue that ‘realequality’ is still a distant prospect. This feeling was shared bymany of the graduates who took part in the interviews, some ofwhom were very frustrated at employers’ unwillingness to gobeyond ‘token gestures’. Some believed that despite the rhetoric,many employers are not genuinely committed to equalopportunities, and that tokenism could be used to deny, onceagain, the existence and reality of racial discrimination inemployment. Some felt that now that ethnic minorities are nottotally absent from some sectors of the economy and from moreprestigious occupations, and are no longer overwhelminglydisadvantaged, the ‘scandal effect’ has disappeared, and theissue of racial discrimination can be more easily avoided. As onerespondent explained:
‘They [employers] give different reasons for having a question onethnic origin, but sometimes I wonder whether they say: “Right, howmany blacks do we need? Let’s say two: one porter and let’s put oneat the reception so people who walk in see their faces first and thinkwe are an equal opportunity employer” . . . . I don't know, maybe it’s

Ethnic Minority Graduates 65
a blessing in disguise, but it seems to me that employers might takeon a few black people because nowadays they have to do so, but theyare put in lower positions, they are not given the training, theopportunity to develop.’
Another respondent talked about the humiliating experience ofhaving to go through what he thought were ‘token jobinterviews’. He believed that some employers shortlisted someethnic minority graduates to ‘fill their quotas’, but did not seemto be prepared to give them a fair chance, as he explained:
‘I’ve had a few of these token interviews during the milkround, it wasquite obvious that they were not interested in what I had to say, theywouldn’t even look at me and did not give any signs that they wereprepared to listen to what I had to say. They were very painful andhumiliating experiences.’
4.5 Conclusion
The follow-up interviews provided greater insight into the rangeof employment experiences of ethnic minority graduates and thetype of difficulties some of them faced in the labour market. Boththe survey and interview findings show that discrimination inemployment was perceived as a problem by some ethnicminority graduates. However, the exploration of these difficulties,and the more positive experiences some of the respondents had,indicated where employers could make improvements to ensureworkplaces are accessible and open to all graduates, regardlessof their ethnic origin. The main messages for employers whichemerged from the interviews were:
An equal opportunities policy is essential but should only beseen as a starting point, a means to an end, not an end in itself.
The equal opportunities debate up to now has been rathernegative (ie what ethnic minorities cannot do). The discussionshould now focus on what ethnic minorities can achieve.
Selection and recruitment methods should be reviewed toavoid the type of indirect discrimination highlighted earlier on.
Employers should learn to accept and value cultural andethnic diversity.
There is a need to look seriously at how organisationalcultures might contribute to the persistence of discrimination.As one respondent put it:
‘Changes in procedures and practices are important but ultimatelychanging the heart is what matters most.’
Before moving on to the employer perspective (Chapter 6), webriefly focus in the next chapter on some issues related toexperiences at and before coming to university which also mayhave impinged on their early post-graduation career.

The Institute for Employment Studies66
5. Graduates and Higher Education
In this chapter we present research findings on respondents’experiences before they entered university, and their entryroutes. These are based on the survey of graduates (matchedsample of 272 graduates, see section 3.1) and the 25 follow-upinterviews (see introduction to Chapter 4).
It explores the main factors which influenced their progress intohigher education, their experiences while at university, and howthese might have impinged on their early post-graduation career.
5.1 Educational background and work experiences
In both the survey and the follow-up interviews, we askedrespondents for details of their experiences prior to enteringhigher education. It was felt important to understand whatfactors impinged on the decision by respondents to enter highereducation, on their choice of degree and university, and establishhow their previous experiences might have influenced theirfuture, post-graduation career.
5.1.1 Entry qualifications
As discussed in Chapter 2, previous studies have highlightedsome consistent differences between ethnic groups in terms ofentry qualifications (eg Modood, 1992; Taylor, 1992). While somedifferences emerged from the survey, these were not assignificant and conclusive as the findings from previous research.However, the low variability in terms of entry qualifications wasprobably largely due to the fact that, in selecting the sample, wecontrolled for type of institution (‘old and ‘new’ universities)which some of the previous research has not done.
Very similar proportions of ethnic minority and whiterespondents had standard entry qualifications (ie two or more ‘A’levels): the respective figures were 70 and 73 per cent. Similarly,there was very little difference in the ‘A’ level mean scores forthe two groups: this was 17.4 for ethnic minorities and 17.5 forwhites.
However, as indicated in Table 5.1, these similarities seem tomask variations between different ethnic minority groups. Blackgraduates had lower entry qualifications than all the otherrespondents. Despite the small number of cases in the ‘black’

Ethnic Minority Graduates 67
category the difference was statistically significant. Similarly, themean ‘A’ level score was considerably lower for blackrespondents (9.3) compared with the rest of the sample.
5.1.2 Work experience
Work experience before entering higher education was anotherissue explored by the survey. This is becoming an importantinfluence on graduates’ careers, as many employers now expectnew recruits to have had some work experience. The analysisshows no difference between ethnic minority and whitegraduates, with 85 per cent of both groups reporting some pre-degree work experience. However, again variations betweendifferent groups emerged: while the proportion of respondents ofmixed ethnic origin, Indian and Chinese was just below theaverage for the sample as a whole, 94 per cent of ‘other Asians’had had some work experience.
Differences also emerged in terms of length of work experience,black graduates being more likely to have had more than oneyear of work experience. Seventy-six per cent of black respondentshad worked for more than a year, compared with 44 per cent ofwhites, and about a third of respondents from the other groups.(Nb, these differences were statistically significant.)
5.2 Entering higher education
In this section we explore the influences on the decision bygraduates to enter higher education, their choice of degree anduniversity. First, we present the findings from the interviews,and then we report some of the survey results.
5.2.1 Main influences on decision to enter higher education
From the interviews it emerged quite clearly that the ‘traditional’factors, mentioned in Chapter 2, impinged on the decision byethnic minorities to enter higher education. Family expectationsand values, traditional patterns of aspirations within one’s socialclass or community, role models within one’s family andcommunity, were all very important influences. These seemed tolead to a strong career orientation and career focus at an earlystage, as the quotes below illustrate:
Table 5.1: Respondents’ entry qualifications
Standard entrant Blacks Asians Mixed/others Whites
N % N % N % N %
Yes 9 36 62 76 23 82 97 73
No 16 64 20 24 5 18 36 27
Total 25 82 28 133
Source: IES Survey

The Institute for Employment Studies68
‘He [father] helped a lot by instilling drive and ambition; my parentspushed me more than my friends’ parents.’
‘You were expected to go to university, there was no excuse not to gointo Higher Education; everybody [within own community] strugglesto make their children highly educated.’
‘I come from a family of seven, my five sisters have all trained tobecome accountants, and my brother is a doctor, so I had no choice, Ihad to do something.’
‘Right from a very early age I’ve always been a talker, I love talkingand I decided that I wanted to be a lawyer.’
As would be expected, family expectations and support exerted astronger positive influence on ethnic minority students from amiddle or upper class background. However, there wasconsiderable evidence to suggest that education is becomingincreasingly important among black and Asian working classfamilies. A ‘good education’ was seen as necessary to overcomethe labour market disadvantage experienced by the parents. Asthe respondents quoted below explained:
‘He [father] wanted me to avoid what he went through andappreciated the value of education.’
‘The Asian community is now exerting more pressure on theirchildren to get a better education . . . . Education is now considered anecessity for second generation Asian children.’
There were examples of families who were not very supportive,but this seemed largely related to expectations about the role ofwomen in some communities. However, as the respondentsquoted below illustrate, this tended to lead to ‘confusion’ incommunities where values were rapidly changing, rather thanhostility and obstruction:
‘I was very confused because I wanted to study. My family did notstop me, but they were not encouraging me either, and my aspirationsdidn’t fit in with my own community’s expectations of what a girlshould do.’
‘My family was not very supportive, mainly because of traditionalcultural values; a Pakistani woman is not expected to have a career.However, they did not prevent me from going to university.’
The evidence from the interviews with ethnic minority graduatessuggests that ‘traditional’ views about the role of education, andgender roles, are changing rapidly, and that higher education isincreasingly likely to be seen as an ‘acceptable’ option for youngwomen. As a Pakistani woman talking about her early careerambitions explained:
‘I wasn’t sure what I wanted to do, I knew I wanted to have a career,be “someone”. I didn’t want to be just someone’s daughter or wife forthe rest of my life.’

Ethnic Minority Graduates 69
School and career advice also played a significant role ininfluencing the decision by respondents to enter higher education.Respondents who had attended academically oriented schoolswere expected to go to university. The school’s ethos, peerpressure and teachers’ expectations provided strong push factorsand ‘a good start’. However, the research also confirms otherstudies discussed earlier (eg Bird et al., 1992; Tomlinson, 1987;Wrench, 1993), that teachers’ and career advisers’ prejudices andstereotypical views can contribute to limiting ethnic minorities’perception of ‘feasible’ career options. As some respondentsexplained:
‘My teachers’ expectations of black students were very stereotypical. Iwas never encouraged to consider a range of options; teachers onlyencouraged “certain types of people”. I was only presented with twopossibilities: work with the elderly and nursing.’
‘At the time [15 years ago] I was one of the few Asian girls in theschool and the teachers didn’t know what to do with me. Theyexpected me to leave school early to get married and have children. . . . They just didn’t know what to do with an Asian girl whowanted to carry on studying, because I didn’t fit their stereotypes.’
Respondents’ experiences at school, and the extent to whichthese influenced their decision to carry on studying, variedconsiderably and depended on a variety of factors. For example,it was noticeable that the younger interviewees were more likelyto have attended more ‘mixed’ schools in terms of ethniccomposition, and where teachers were viewed as more likely tohave a better understanding of different cultural and ethnicbackgrounds. Geographical location could also be important;respondents in predominantly white areas were more likely tohave felt isolated and marginalised at school. How well‘integrated’ a respondent was perceived to be, was also anotherimportant influence impinging on teachers’ expectations.
Finally, the visibility of ethnic minorities in some professions,and the presence of role models, emerged as another importantinfluence, not so much on the decision to go to university, but onthe choice of degree. Respondents seemed very reluctant to enterprofessions such as architecture and surveying, where there werevery few ethnic minorities. This was partly because in theseprofessions, qualification depends largely on practical training,and there was a belief that ethnic minorities find it more difficultto secure placements, as these are obtained mainly throughnetworks from which ethnic minorities are, by and large,excluded.
5.2.2 Choosing a university
In the survey we asked respondents how important differentfactors had been on their choice of university. As might beexpected, a majority of ethnic minority respondents considered auniversity’s attitude towards students from ethnic groups an

The Institute for Employment Studies70
important factor in choosing where to do their degree (see Figure5.1). This was not an important consideration for most whitegraduates, and only a minority mentioned it.
There were no significant differences between ethnic minoritiesand whites in relation to the importance of a university’s attitudetowards mature students. However, this was regarded asimportant by a greater proportion of black respondents, nearlyhalf mentioning it, compared with under a third of the sample asa whole.
A slightly higher proportion of ethnic minority than whitegraduates said that a university’s geographical location wasimportant. This factor seemed to be particularly significant forblack graduates, as 72 per cent mentioned it.
There were also differences in terms of the importance thefacilities offered by the university were for different groups: 73per cent of ethnic minority respondents regarded these asimportant when choosing a university, compared with 63 percent of whites. Asians seemed to regard facilities as particularlyimportant, as 78 per cent were found in this category. Theassociation was rather weak, but statistically significant.
A university which offered the right combination of subjectsseemed more important for white students: 94 per centmentioned it, compared with 83 per cent of ethnic minorities. Onthe other hand, an institution’s reputation was more likely to bementioned as significant by ethnic minority students. Asians inparticular seemed to regard this as important, with 75 per cent ofthem mentioning it.
Figure 5.1: Factors influencing choice of university
���������������������������������������
��������������������������������������������������������������������������������������������������������������������������������������������������������������������������������������������������������������������������������������������������������������������������������������������������������������������������������������������������������������������������������������������������������������������������������������������������������������������������������������������������������������������������������������������������������������������������������������������������������������������������������������������������������������������������������������������������������������������������������������������������������������������������������������������������������������������������������������������������������������������������������������������������������������������������������������������������������������������������������������������������������������������������������������������������������
����������������������������������������������������������������������
0% 10% 20% 30% 40% 50% 60% 70% 80% 90% 100%
Attitude towards ethnicminorities
Attitude towards mature students
University's geographical location
Facilities
Right combination of subjects
University's reputation
Cost of living in the area
Recommendations of others
Ethnic minorities
������ Whites
Note: Percentages were calculated out of total number of respondents from the ethnic minority and white groups whoanswered this question.
Source: IES Survey
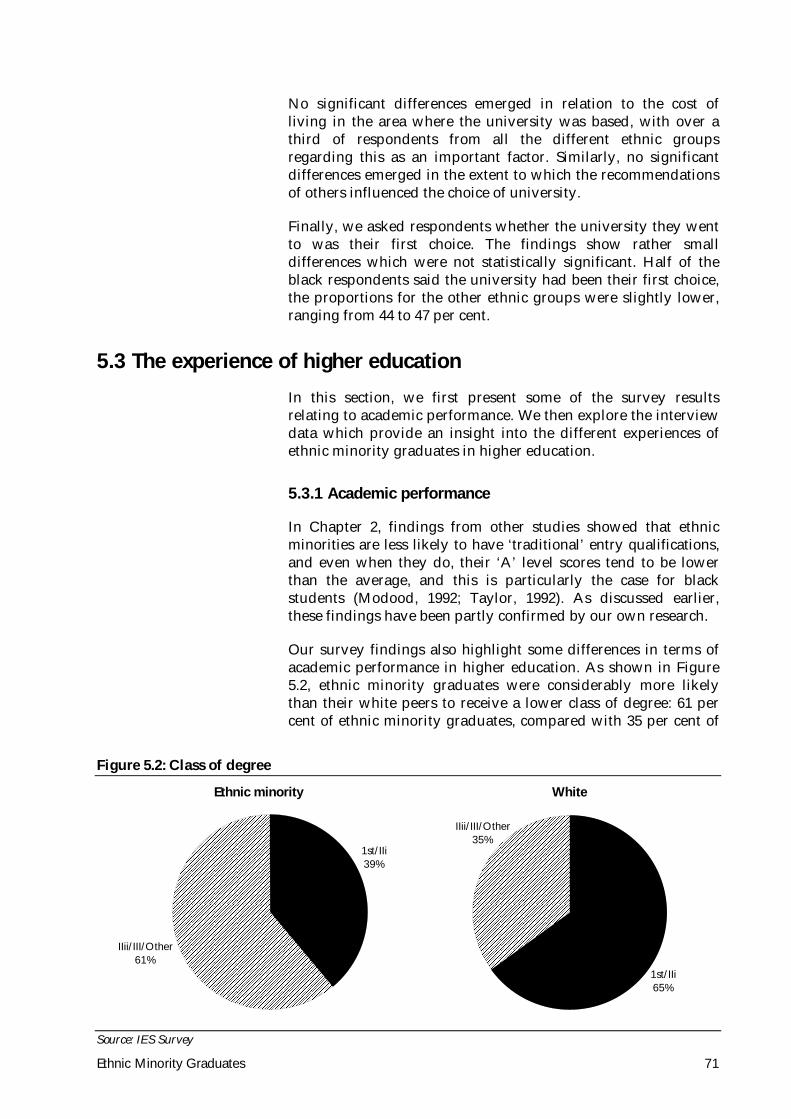
Ethnic Minority Graduates 71
No significant differences emerged in relation to the cost ofliving in the area where the university was based, with over athird of respondents from all the different ethnic groupsregarding this as an important factor. Similarly, no significantdifferences emerged in the extent to which the recommendationsof others influenced the choice of university.
Finally, we asked respondents whether the university they wentto was their first choice. The findings show rather smalldifferences which were not statistically significant. Half of theblack respondents said the university had been their first choice,the proportions for the other ethnic groups were slightly lower,ranging from 44 to 47 per cent.
5.3 The experience of higher education
In this section, we first present some of the survey resultsrelating to academic performance. We then explore the interviewdata which provide an insight into the different experiences ofethnic minority graduates in higher education.
5.3.1 Academic performance
In Chapter 2, findings from other studies showed that ethnicminorities are less likely to have ‘traditional’ entry qualifications,and even when they do, their ‘A’ level scores tend to be lowerthan the average, and this is particularly the case for blackstudents (Modood, 1992; Taylor, 1992). As discussed earlier,these findings have been partly confirmed by our own research.
Our survey findings also highlight some differences in terms ofacademic performance in higher education. As shown in Figure5.2, ethnic minority graduates were considerably more likelythan their white peers to receive a lower class of degree: 61 percent of ethnic minority graduates, compared with 35 per cent of
Figure 5.2: Class of degree
Ethnic minority White����������������������������������������������������������������������������������������������������������������������������������������������������������������������������������������������������������������������������������������������������������������������������������������������������������������������������������������������������������������������������������������������������������������������������������������������������������������������������������������������������������������������������������������������������������������������������������������������������������������������������������������������������������������������������������������������������������������������������������������������������������������������������������������������������������������������������������������������������������������
1st/IIi39%
IIii/III/Other61%
���������������������������������������������������������������������������������������������������������������������������������������������������������������������������������������������������������������������������������������������������������������������������������������������������������������������������������������������������������������������������������������������������������������������������������������������
1st/IIi65%
IIii/III/Other35%
Source: IES Survey

The Institute for Employment Studies72
white graduates, obtained a lower second or lower class ofdegree (nb, this difference is statistically significant).
Only six of the 25 black respondents included in the sample hadobtained a first or upper second degree. The proportion ofAsians with a first/upper second degree was 23 per cent, butwithin the Asian ethnic group, the figures were higher amongIndians and Chinese (ie both 42 per cent).
These results on degree achievement are important because itwas shown earlier in section 5.1.1 that very similar proportionsof ethnic minority and white graduates had two or more ‘A’ levelqualifications on entry (70 and 73 per cent), and similar average‘A’ level scores (17.4 and 17.5 ‘points’), but black graduates hadgenerally lower entry qualifications than other respondents.
There are a number of possible reasons behind variations in theacademic performance of graduates from different ethnic groups,the exploration of which was beyond the scope of this study. Onereason is likely to be racial discrimination, which is discussedfurther in the next section.
5.3.2 Discrimination in higher education
All four universities included in the study had an equalopportunities policy (as do most, if not all, higher educationinstitutions in the UK). However, we found considerablevariations in the extent to which policies were implemented andmonitored, not only between the four universities included in thestudy, but also within the same institutions. This was partly dueto the fact that equal opportunities policies were largelyimplemented and monitored at the departmental or faculty level.However, the existence of powerful organisational sub-culturesalso exerted a considerable influence on equal opportunitiespractices.
While there were examples of survey respondents who had hadvery positive experiences, the silence or ‘lack of noise’ aboutracial discrimination in universities and/or some departmentsemerged as a key issue in the follow-up interviews. Silence on anissue which profoundly affected some of the respondents’experiences in higher education was seen as a way of avoiding oreven denying the existence of the problem. As one respondentexplained:
‘While at university I became acutely aware that as a black person Ihad to work twice as hard to achieve the same goals as a white person.But this was an issue that neither lecturers nor careers advisorswanted to talk about; they even found it difficult to admit that suchfears were real for black students.’
The denial of discrimination could lead to a sense ofpowerlessness. On the one hand, respondents’ experiences wereconsiderably affected by discrimination; on the other, the

Ethnic Minority Graduates 73
problem ‘did not exist’, and was not considered legitimate by thedominant white culture. The experiences of the respondentsquoted below give an illustration of the extent to which ‘silence’could disempower and alienate students affected by racialdiscrimination:
‘It’s real and it’s there, but it’s only when you are at the receiving endthat you will know. It’s there and it’s real and no matter how muchyou try to shy away from it, or you don’t want to talk about it, it’snot going away.’
‘Some lecturers were not approachable, they had their “favourites”who they were more willing to help, but there were others theyrefused to offer any assistance whatsoever, and ethnic minorities wereparticularly vulnerable to such behaviour . . . . The majority of ethnicminority students just accepted this and got on with their lives. Therewas no encouragement to talk about these problems, and you felt thatif you raised these issues you were going to be singled out for makinga fuss.’
However, the recognition and willingness to deal with theproblem of racial discrimination had a considerable positiveinfluence on some graduates. As one respondent explained:
‘I suffered direct racism and I took it up with my tutor, and it wasdealt with, it was not left hanging around.’
The ‘colour blind’ approach of Careers Services could also have anegative influence, as respondents had not been ‘prepared’ todeal with the potential problems they might have to confront inthe labour market. Conversely, the experiences of respondentswho were offered support and advice on this issue show howimportant these could be. These helped graduates to come toterms with discrimination in employment, and gave them theconfidence to deal with it. The respondent quoted below tookpart in the university’s mentoring scheme to help ethnic minoritygraduates, and explained how this helped him:
‘The most important thing [about the mentoring scheme] was thatsomeone was listening to you, someone who thought that what youwere saying made sense, someone who understood what you weregoing through because he is a black person so you can relate to him.You could talk to him, and say: “This is what I think, tell me if I’mbeing paranoid, if I’m imagining the problems”, and he wouldconfirm that my experience reflected that of many other blackstudents. But more importantly he would give me informed advice.’
The mentoring scheme played a crucial role in this respect andwas described by the two respondents who had taken part in theinitiative as ‘a turning point’, and the ‘best thing’ that happened tothem while at university. However, even less ‘ambitious’initiatives such as career seminars for ethnic minorities, or simplybeing encouraged by careers advisers to express their fears aboutpotential discrimination in employment, helped ethnic minoritystudents to deal with the problem in positive ways. Yet, by andlarge, these ‘small gestures’ were conspicuous by their absence.

The Institute for Employment Studies74
Finally, complaints about ethnic minority students being markeddown also emerged as another issue. This problem was notreported by all research participants. However, some of therespondents’ accounts suggest that there was a widespread beliefthat ethnic minority students were likely to get lower gradesthan their white counterparts. As one respondent put it:
‘In our course it was always said that an Asian student would neverget a first class degree, no matter how good they were.’
5.3.3 Support and guidance
Our research findings show that while blatant discrimination inhigher education was rare, more subtle forms of exclusion andlack of access to informal sources of support were still common.Lack of support from lecturers emerged as an important issueamong most interviewees. This could have negative effects onstudents’ performance and undermine their confidence. Therespondents quoted below illustrate the different forms ofexclusion which emerged from the interviews:
‘Most of my white friends had the telephone numbers of mostlecturers and sometimes when I wanted to contact a tutor I had tospeak to some of these white students and ask them to find out whenthe lecturers will be in college . . . . Lecturers had decided whom togive their numbers so they could call for special assistance, but not tome or those like me.’
‘On my course it was well known that lecturers were more helpful towhite students, and when we needed information we’d send whitestudents to ask the lecturer, because we knew they would get betterinformation.’
‘I never received any support, lecturers never gave feedback, theywere very biased, and stereotyped black people, and because of that Ioften felt that no matter how hard I worked I couldn’t succeed.’
The experiences mentioned above while common, were notuniversal, and examples of very supportive lectures ‘whose doorwas always open’ were also mentioned.
The research findings also show the range of coping strategiesethnic minority students developed to deal with this lack ofsupport. A common reaction was to ‘stick together’, providemutual support and ‘sort out problems amongst themselves’.Ethnic minority students also took part in their own more formalsupport structures (eg Asian or black student societies) to meettheir needs and make their voices heard.
However, as already mentioned earlier, more formalised sourcesof support, such as the ethnic minority mentoring scheme, wereviewed by graduates as probably the most effective ones. Thementoring scheme helps ethnic minority students by providingrole models, access to professional networks, and advice andcareer guidance from someone who might have experienced

Ethnic Minority Graduates 75
similar problems. It seemed to help them grow a ‘thick skin’, tosurvive and strive in the labour market. The message the schemewanted to convey to ethnic minority students whose confidencemight have been undermined by experiences of discriminationwas that:
‘The door is not completely shut, it is ajar and the role of thementoring unit is to open it as widely as possible.’
5.3.4 Accepting diversity
Finally, another interesting point which emerged from theinterview data was the extent to which cultural and ethnicdiversity was recognised, accepted and valued in highereducation. Again, respondents’ experiences varied considerably,at one extreme some graduates felt they were well integrated,had a good social life, and felt just like ‘any other student’. Atother end of the spectrum, there were examples of graduateswho felt very isolated, marginalised and alienated from ‘whiteinstitutions’, where dominant values and norms did not reflecttheir background and experiences.
Respondents’ experiences depended partly on the extent towhich they were ‘integrated’ and prepared to ‘sacrifice’ theirethnic and cultural identity. For example, the respondent quotedbelow had a very positive experience at university:
‘I had a very good time, I didn’t feel I was ever treated differentlybecause of my ethnicity. I am very outgoing and friendly and I mixwell with all sorts of people . . . . Also I went to a very white school, Ilived in a white area and most of my friends were white, I have anEnglish accent and I don’t act Indian.’
Students with a stronger attachment to their community, astronger sense of cultural identity, and whose lifestyles werevery different from those of most students, were more likely toexperience isolation and marginalisation. These students sawthemselves as being ‘caught between two cultures’, sometimeswith conflicting demands and expectations coming from thesedifferent realities.
As mentioned earlier in Chapter 3, the ‘colour blind’ approach ofmany lecturers and counsellors made it very difficult for somestudents to express this sense of alienation and even to raise anypersonal and family problems, even when these were felt to benegatively impinging on academic performance. The assumptionwas that white lecturers and counsellors would not understandthe need to balance two different cultures.
5.4 Conclusions
The interviews with the sample of graduates, albeit small in size(25) and not necessarily representative of the ethnic minority
The Institute for Employment Studies76
graduate population, have highlighted some interesting pointsabout factors of influence on ethnic minority students inprogressing to higher education and their experiences of it. Thesesupport much of the existing research evidence from otherstudies.
In particular, they showed that ‘traditional’ factors (eg family,school) exerted a considerable influence on ethnic minoritygraduates’ progress into higher education. Family influenceseems increasingly significant for ethnic minority children fromlower social classes, and there was evidence that traditionalattitudes towards roles of women were changing. However,many of these positive influences could be mediated byexperiences of racial discrimination and lack of support byteachers and careers advisers.
The survey data also confirmed patterns which had emergedfrom previous studies. While little differences were foundbetween Asians’ and whites’ entry routes, black graduates wereless likely to have the traditional two ‘A’ level entryqualifications, and had lower ‘A’ level scores than otherrespondents. The persistence of low entry qualifications amongblack graduates could partly explain some of the difficulties theyfaced subsequently in the labour market (see Chapter 3) causedby employers’ use of ‘A’ level results in the initial graduateselection process (see Strebler and Pike, 1993) and the increasingpractice of graduate recruiters targeting the more prestigiousuniversities and departments where entry qualifications aregenerally higher.
The survey has also shown that ethnic minority graduates (andblack graduates in particular) were less likely than whites toobtain a high class of degree, even though ethnic minority (as agroup) and white graduates entered with similar entryqualifications (ie two ‘A’ levels, of similar grades). Thecombination of low pre-degree qualifications and low degreeclass among black graduates could be key factors underlying thegreater labour market disadvantage experienced by some ofthem (see Chapter 3).
Although these findings on degree class are based on a relativelysmall sample survey (272 matched ethnic minority and whitegraduates from four universities), and therefore need to betreated with caution, the differences found between ethnicminority and white graduates in degree class were statisticallysignificant. Taken together with the finding in Chapter 3 thatwhen degree class was controlled for in the analysis much of thedifference relating to employment outcomes disappeared, therewould seem to be a case for investigating this issue further.
An institution’s attitude towards ethnic minorities was animportant factor for ethnic minority graduates in their choice ofuniversity. Geographical location, facilities, and an institution’sreputation were also regarded as more important by ethnic

Ethnic Minority Graduates 77
minority students compared with their white peers. Althoughthis sample is based on just four universities, of different types,there may be messages here for universities with policies aimedat increasing ethnic representation.
Finally, the interview findings on ethnic minorities’ experiencesin higher education show a mixed picture. For some this was apositive experience. However, subtle forms of exclusion andmarginalisation, the ‘lack of noise’ about discrimination, and the‘colour blind’ approach of many lecturers, had a considerablenegative impact on some interviewees. The experiences of somerespondents (eg those who took part in a specific mentoringscheme for ethnic minority students) gave an indication of howthese difficulties can be overcome.

The Institute for Employment Studies78
6. Graduate Recruitment: Employers’ Attitudes
6.1 Introduction
We now turn from the graduate to the employer perspective todiscuss the views of a sample of employers, and theirrecruitment policies and practices in relation to ethnic minoritygraduates. It is not intended to be an exhaustive assessment ofpolicies towards ethnic minority graduates, but rather how thosepolicies affect different groups of graduates. We soughtemployers’ perspectives via interviews with a small sample often employers who regularly recruit new graduates. They weremainly large organisations, and were drawn from themanufacturing, legal and business, retail, financial services,transport, public and voluntary sectors. The respondent was, inthe first instance, the graduate recruitment manager/officer, andsubsequently the equal opportunity manager/officer.
The limitations of the timescale and budget for the study did notallow exploration of differences in recruitment practices betweenthe more established graduate recruiters and the new entrants tograduate recruitment, nor cover the full range of jobs graduatesenter. Nevertheless, it was possible to examine differences ingraduate recruitment and career development between employersfrom different sectors, including those with established graduaterecruitment and training programmes and those without suchprogrammes. The discussion in this chapter must also be viewedagainst a background of rapid changes in the organisationalstructures of companies, and its consequent effects on graduatedemand, graduate skill requirements, organisational cultures,devolvement of responsibilities for graduate recruitment fromthe centre, development of specific company-wide courses ofaction for particular groups of staff, and so on (see for exampleKettley, 1995 on flatter structures).
The chapter has four principal aims:
To assess the level of ethnic minority representation or under-representation in organisations, in particular, ethnic minoritygraduate representation.
To explore the recruitment and selection policies and processesin organisations, with particular respect to recruitment ofgraduates, and ethnic minority graduates in particular.

Ethnic Minority Graduates 79
To explore employers’ attitudes to recruiting ethnic minoritygraduates, and to chart the progress graduates make, on thewhole, in the organisations; in particular their progressthrough training and career development.
To explore employers’ commitment to equal opportunities forethnic minority graduates.
6.2 Representation of ethnic minorities
The drive for efficiency within organisations has led to changesin their structures. In some cases this has led to the erosion oflayers of management functions, as responsibility is devolvedfrom the centre to local areas (in the case of retail organisations,for example) or departments (in the case of local authorities). Atthe same time, the introduction of new technology has alsoresulted in changes in administrative functions, most of whichare now computerised. Indeed not only do the new technologiesrequire new skills, but they also dispense with much of theexisting or old skills. Another important development is the out-sourcing of services, such as IT functions, to outsideorganisations. The overall effect on employment is thatrestructuring has combined with cost considerations to forcereductions in the workforce of many organisations. With thepossible exception of the food retail sector, which has continuedto expand as a result of new store developments, most employershave cut their workforces through programmes of re-deployment, early retirements and voluntary redundancies.
The evidence from our interviews with employers suggests thatethnic minority employees are likely to be affected dispropor-tionately by changes in the structure of organisations, given thatthe majority of them are found in the lower occupational groupswhich have borne the brunt of cuts in the workforce.
Among the organisations interviewed for this study, ethnicminority employees represented between three per cent (in thecase of a large building society) and 15 per cent (in the case of alocal authority) of the workforce. Without exception, the majorityof ethnic minority employees in these organisations were to befound in lower grade occupations: in administrative, clerical andother lower grade white collar jobs. They were less representedin the higher structures of management, accounting for less thanone per cent of senior managers among the companies surveyed.There was little or no accurate information on ethnic minoritygraduate representation, or even reliable estimates, in theorganisations interviewed for this study. However, to the extentthat such senior positions are occupied by graduates, ethnicminority graduates can be said to be under-represented in seniorpositions. In this respect, there was no difference between publicand private sector organisations, in terms of ethnic minorityrepresentation at the top.

The Institute for Employment Studies80
The under-representation of ethnic minorities at senior manageriallevel can be attributed, to some extent, to the fact that peopletend to work their way up within organisations. It is reasonable,therefore, to assume that as their careers develop, they are likelyto advance to senior positions and compose a morerepresentative proportion of senior management posts. But, as arecent study by the Local Government Management Board(LGMB, 1992) has pointed out, there are equally powerfulorganisational barriers which can prevent the advance of ethnicminorities. Thus, the major blocks to their progress into seniorpositions may lie less with ethnic minority employeesthemselves, but in the organisations they work for. For example,it was suggested to us (by a voluntary sector organisation) that:
‘the people who show skill, energy and expertise happen to be largelywhite. They happen to do what the organisation wants quicker.’
For this establishment, the barriers are rooted not in the practicesof the whole organisation, but with particular individuals orgroups to whom much responsibility has been devolved.Paradoxically, devolved responsibility also provides theopportunity for individuals or departments within organisationsto target ethnic minority groups if they so wish, although onlyone of the employers interviewed has introduced such a policy oftargeting ethnic minorities.
6.3 Recruitment and selection policies and practices
Almost all the employers interviewed have what can bedescribed as ‘graduate level employment’. These are jobs whichrequire a graduate qualification, particularly if the post-holdersare required subsequently to study for professional qualifications.Increasingly though, as outlined in Chapter 2, many graduatesare taking jobs for which employers do not necessarily seek agraduate qualification, and fewer are entering via formalgraduate recruitment (or trainee) programmes.
While most organisations have no accurate information on thetrue number of graduates recruited in a year, the impressiongained from the interviews with employers is that more ethnicminority graduates than whites are prepared to take ‘non-graduate jobs’. This lends some support to our findings reportedearlier (in Chapter 3) that ethnic minority graduates are morelikely than their white peers to feel under-employed.
6.3.1 Recruitment methods
The interviews confirmed the longer term changes in graduaterecruitment and selection, discussed earlier (see section 2.3.1).Fewer now advertise graduate posts in the national or localpress, and usually only for specialist functions or high gradeposts. As part of their policy to appeal to a wider audience, anumber of them advertise in publications targeted at ethnic

Ethnic Minority Graduates 81
minority graduates, such as Kaleidoscope, as well as the ethnicpress (eg, The Voice) newspaper. This is in addition to theestablished graduate publications and recruitment directories.Graduate fairs and ‘milkrounds’, are becoming less popular, andemployers are increasingly focusing on targeting specificuniversities or holding open days at their own premises, towhich potential recruits are invited. Although it is not awidespread practice, there is considerable internal recruitment,especially of graduates doing non-graduate jobs. It is seen as partof the ethos of organisations which use this method, to encourageself-development amongst their employees. In one large foodretailer, internal recruitment accounted for about 20 per cent ofthe retail management trainee intake. Employers also recruitthrough work experience schemes such as student placements,and vacation jobs. There is no widespread use of informal (wordof mouth) recruitment, although this method is used mainly by avoluntary sector organisation we interviewed.
Except for the less frequent use of ‘milkrounds’ and moretargeting of universities, these main methods of recruitment havebeen in place over the last few years or so.
6.3.2 Shortlisting and selection
Whilst the recruitment methods of most organisations are notchanging significantly, there is more noticeable change in thecriteria they use when shortlisting and selecting candidates.Perhaps the most significant of the criteria, in terms of its likelyimpact on the recruitment of ethnic minorities, is employers’preference for graduates from the pre-1992 universities. Bluechip companies we interviewed, in particular, have a clearpreference for graduates from pre-1992 universities, and havelittle or no contact with most post-1992 universities (formerpolytechnics, where ethnic minority students are concentrated,see Chapter 2), especially those which do not run graduate fairs.In some cases, this is the result of long-established relationshipswith particular departments, in others, it is because they are seenas more likely to supply a continuous flow of graduates withhigh academic ability and achievement.
On the other hand, a number of organisations we interviewedattempted to recruit from a mix of pre- and post-1992universities. Among the factors likely to favour the newer (post-1992) universities in certain instances is their location. The newuniversities located in London, for example, are likely to betargeted, whilst in the regions, locations in or near toManchester, Leeds, Birmingham and Bristol were seen to beadvantageous. A few new universities were also beingspecifically targeted by companies because they had developedwith them specific courses, such as retail management, which arenot offered by the older universities. It appeared paradoxical thata large legal firm which recruits its graduates almost exclusivelyfrom pre-1992 universities, nevertheless sends its recruits to

The Institute for Employment Studies82
study for the Legal Practice Course (LPC) at a number of HEIs,including two new universities. Only one of the employers weinterviewed had a policy to increase recruitment of ethnicminority graduates to better reflect the rest of its workforce, andwas targeting specific (invariably new) universities with a highproportion of ethnic minority students.
Almost as important as the type of university, is the use ofacademic qualification as a criterion for shortlisting candidates.This is not new and was identified in the early 1990s by Streblerand Pike in their research on shortlisting of graduates. Thatresearch specifically highlighted the weaknesses of relying on ‘A’levels as indicators of degree performance, apart from those withvery high grades. It also showed the extent to which the pool ofpotential applicants could be widened to include more oldergraduates with non-traditional qualifications (including ethnicminority graduates) by relying less on traditional academicqualifications in shortlisting practices. As found in that study,degree class and the type of qualification had an importantbearing on the recruitment process in the sample of companieshere. Those organisations which recruit mainly from the pre-1992universities were found also to be more likely to use degree classas a criterion for shortlisting. For one recently privatisedcompany, for example, the minimum requirement for selection isa upper second degree. Where organisations also look forconsistently strong academic records, it is not unusual for themto attach some importance to the number and grades of ‘A’ levelresults of applicants, in addition to the degree class they obtainon graduation. Not surprisingly, these organisations do notaccept applications from graduates with non-traditionalqualifications, such as HNC/ONC, HND and BTEC. On the faceof it, this would seem to be unfair to certain groups, such assome ethnic minority graduates, who are more likely to haveentered HE via the vocational route.
An important development which emerged from the interviewsis the use of standard application forms for graduates, linked toanother emerging trend — competence-based criteria forshortlisting and selection. Increasingly, application forms arestructured around competencies which candidates are expectedto demonstrate. The competence framework is likely to cover,among other aspects, candidates’ work-related experience, inter-personal skills, leadership and performance management, teammembership skills, power of analysis and problem solving,communication skills, flexibility and adaptability, drive andmotivation. The use of competencies is intended to make pre-selection ‘colour blind’, but more relevant to the jobs they will beexpected to do. Thus, candidates’ bio-data and demonstrablecompetencies have become the main criteria for the initialscreening of potential graduate recruits. In this respect, some ofthe organisations we interviewed place considerable importanceon careful completion of application forms, and reject most

Ethnic Minority Graduates 83
candidates at this stage of the recruitment process for poorpresentation, as will be seen later.
6.3.3 Recruitment difficulties
The relatively small numbers of graduates within largeorganisations means that very few of those we interviewed hadattempted to establish if there are any differences or trends inperformance between white and ethnic minority candidatesduring the selection process. The evidence which emerged fromour discussions with employers suggests that organisations havenot been short of ethnic minority applicants. However, theapplications are not usually converted to job offers because manyethnic minority applicants do not possess, or fail to demonstrate,the competencies which organisations look for in potentialrecruits. On the whole, more ethnic minority applicants,compared with whites, fail to get through each successive phaseof the recruitment process. Employers gave specific reasons whyethnic minority applicants are not as successful in the selectionprocess (in proportion to the numbers who apply) as their whitepeers. Among the comments made by employers are thefollowing:
‘One of the main reasons for the rejection of ethnic minoritycandidates was because their degree was 3rd Class (44 per cent).These students still applied even though our published minimum is a‘good second class honours degree’, as compared with 14 per cent ofwhite students who were rejected for the same reason.’
‘Poor presentation was never the only reason for rejection . . . , butfor 19% of ethnic minority applicants, it was an additional factor intheir rejection. This compares with only two per cent of whiteapplicants rejected . . . whose applications were considered poor. Poorpresentation includes applications which were partially completed,obvious corrections where words or lines have been scored out orblatantly tippexed . . . . Barely legible handwriting . . . . Typewrittensections pasted into the application form . . . poor English andgrammar.’
‘There is a perception that ethnic minority applicants place differentinterpretations on some of the competencies that they are required todemonstrate. For example, Asians would not cite their workexperience in helping with family businesses as part of a challengefaced, nor overcoming problems encountered in the process as anachievement.’
These comments go some way to support the findings we havereported in earlier chapters about the disadvantages whichethnic minority graduates face in the labour market. Becausethey have either lower entry or non-traditional entryqualifications, they are affected more when pre-universityacademic qualifications are used as a criterion for selection.Preference for graduates from pre-1992 universities is anothersource of disadvantage, as is a lower degree class.

The Institute for Employment Studies84
While these are comments on the mainly objective criteria forselection, others are on rather subjective criteria, and raise aserious issue of bias in recruitment practices. Thus, one employeropined:
‘the difficulty is that they do not happen to be good. The impression isthat white people are more articulate in English, and are moreorganised than ethnic minorities.’
Several organisations expressed concern about the deficiencieswhich hinder the successful recruitment of ethnic minoritygraduates. Some of these have embarked on initiatives to tacklesome of the more obvious problems. These include plans to runworkshops for prospective ethnic minority graduate applicantson how to complete application forms, and how to prepare forinterviews. There is a perception that a significant number ofethnic minority applicants are disadvantaged at this importantstage of the recruitment process not only because they lack suchskills, but also because they have inadequate information orsupport on how to develop and improve upon such skills. Someof the initiatives are undertaken either by individual organisationsthemselves, or in collaboration with organisations such as theWindsor Fellowship.
It is also true to say that, in some cases, the difficulty inrecruiting ethnic minority graduates can be linked directly totheir under-representation in the universities from whichcompanies prefer to recruit, and in certain degree subjects. But itis equally true to say that many ethnic minority graduatesperceive some establishments (City institutions and firms, forexample) to be virtual ‘no go areas’ or ‘Anglo-Saxon fortresses’.They are put off from applying for jobs in these companies,firstly because they think they do not stand a chance and,secondly because even if they obtained a job, they would face ahostile environment. There is no doubt that some firms are awareof this ‘stigma’, and are joining in initiatives aimed at attractingmore ethnic minority applicants. They are encouraged, forexample, to attend open days to see how such firms operate,thereby raising their awareness of such firms. Companies withsignificant international operations, particularly in the newlyindustrialised countries, are seeking to ensure their recruitsreflect that fact, and are at the forefront of such initiatives.
6.4 Training and career development
Established graduate recruiters are more likely to have a formaltraining and development programme for their graduaterecruits. Graduates follow a structured training programmewhich lasts for between one and four years. With few exceptions,trainees are recruited to specialist areas, or are expected tospecialise in particular areas of the organisations’ operations.Even where organisations do not have a formal graduate trainingprogramme (in local authorities, for example), there are jobs
Ethnic Minority Graduates 85
which are considered to be, or described as, ‘career grade’ jobs,and which require specific skills for which a programme offormal training may be set. Differences exist, though, betweengraduates recruited through a graduate recruitment programme(GRP) and other non-GRP graduates.
6.4.1 Graduate training programmes
The graduate training programmes in the employers we visitedcombine a mix of hands-on and theoretical training in differentareas or departments within the organisation. For the most part,they are likely to include: assignment-based learning, acombination of professional and personal training, targetedprofessional qualifications, and self-development. They are fairlytypical of company graduate entry and training programmes.
In general, graduate training is monitored closely underprogrammes designed specifically for the purpose. Monitoringis, in the first instance, assessment by departmental managers atthe end of each ‘placement’. There is, invariably, a formalappraisal or assessment, which may include tests at regularperiods during the training. Formal monitoring is usually theresponsibility of specialists in personnel departments.
6.4.2 Training of non-GRP graduates
Many organisations make training available to non-GRPgraduates, usually through development funds for which mostother employees are eligible to apply. For the most part though,the provision of training and development for non-GRP graduatesdepends on matching the needs of individuals and those of theorganisation. Selection for training, in such cases, is greatlyinfluenced by line managers, whose judgement of the potential ofprospective candidates is critical. Indeed, in some cases non-GRPgraduates must be recommended or ‘sponsored’ by their linemanagers. Where such support is unnecessarily withheld,graduates can seek redress through grievance procedures. Wherethey exist, the training available to non-GRP graduates is likelytypically to mirror that offered to GRP graduates. But it is rarefor such graduates to be asked to specialise in particular areaswithin organisations, if only because they have not beenidentified as a pool to develop for future management orspecialists jobs. There is no evidence to suggest there is under-selection of non-GRP ethnic minority graduates, if only becauseorganisations do not collect such information.
Despite the formal structures of their graduate recruitmentprogrammes, the organisations interviewed for this study do notcarry out research or collect information which is likely to showif there are differences in performance between white and ethnicminority graduates during their training. It is assumed by them

The Institute for Employment Studies86
that there are no differences, since all trainees are selected on thesame criteria, and follow the same course or programme.
6.4.3 Post-training development
Whilst graduate training is highly structured, there areconsiderable differences amongst organisations in post-trainingdevelopment. For a greater number, no formal structures exist forthe career development of individuals. After initial training anddevelopment, such graduates take on increasing responsibilities.But how far and how fast they progress depends entirely on theirability and their performance in their jobs. There is, on thewhole, no formal monitoring or evaluation of subsequenttraining and development, except by crude self-assessment.
For a few of the organisations we visited, though, post-trainingcareer development is very well structured. Initially, this is likelyto be part of personnel department functions. But as graduatesprogress to more senior levels, responsibility for their careerdevelopment is likely to be undertaken more at the corporatelevel. Some organisations have designed specific developmentprogrammes to train graduates for middle and seniormanagement positions. In some instances this may includegraduates being sponsored on MBA courses. However, even inorganisations with more developed structures, much of post-training development is still determined by the qualitiesindividuals display. Such individuals as are selected for furthercareer development programmes must have the potential to bepromoted beyond their current positions. Such qualities areexpected to be picked up or exposed through formal appraisalsystems; needless to say that the views of line managers inparticular, are critical in the selection process. But even here too,there is no extensive monitoring of post-training development.
In the absence of formal monitoring, it is difficult to determine ifthere is under-representation of ethnic minority graduates forpost-training development. Moreover, line managers exert adisproportionate influence on who receives training, and therebyaccentuate the risk of bias, if any, in the selection of individuals.
6.4.4 Promotion
Promotion also appears to be less structured in manyorganisations, and depends essentially on individual ability andwillingness to apply for higher posts when they come up, albeitwith the support or recommendation of line managers. Aninformal ‘go for it’ system of promotion appears to be the norm.It must be stressed, however, that graduates are made aware ofthe channels of promotion at their recruitment interviews andduring their training. They know they would be expected toachieve a certain level of expertise while on a graduate trainingprogramme, and that the programme is unlikely to take thembeyond that level. Progression beyond that level therefore

Ethnic Minority Graduates 87
depends, typically, on individual performance and achievement.Indeed, some organisations encourage their graduate trainees toseek promotion towards the end of their initial training, and giveguidance about which areas of the organisation where their skillscan best be deployed or utilised.
There is evidence to suggest that employers and graduates alikeare beginning to express dissatisfaction with the ‘informalsystem’ of career development and promotion (see for exampleJackson et al., 1995, Managing Careers in 2000 and Beyond). Some ofthe employers interviewed indicated they are not satisfied withthe fact that ‘the right people are not being promoted at the right time’.Indeed, there is a suspicion that ‘too much (of promotion) happensby chance, and not through ability or training’. They intend todevelop new structures to determine, for example, ‘selection ofwho might best benefit from what type of development programme’. Fortheir part, graduates have questioned the commitment ofemployers to meet their career development needs. An internalattitude survey recently carried out by a large financial sectororganisation, highlighted some of the concerns, with graduatescommenting that ‘at the end of two years (of training), I am expectedto make my way in the world’. Such dissatisfaction has promptedsome organisations to reassess their career development andpromotion procedures for graduates. It was also highlighted asfar back as 1990 in research by Connor, Strebler and Hirsh aboutproblems in the early careers of graduates.
Among the companies interviewed, it is generally believed thereis equality of opportunity, as far as selection for promotion isconcerned, irrespective of by which route graduates enter theorganisations. This was based on opinion only and not on anyconcrete monitoring information.
6.5 Equal opportunity policy and practice
Almost all the organisations interviewed for this study have awritten equal opportunities policy, and are committed toproviding equality of opportunity in employment. Withoutexception, their equal opportunities policies include ethnicity,gender and disability, and are applied during graduaterecruitment (eg in their recruitment literature, statements inadvertising, interviewing techniques, etc.). However, equalopportunities practices vary considerably amongst theorganisations, with significant differences in commitmentbetween public or quasi-public, and private sector organisations.The motivation for private sector organisations is that an equalopportunities policy will enable them recruit bright individualswith a wide range of skills, regardless of any other factors. Butequality of opportunity is also seen to be increasingly importantfor those private sector companies which have significantinternational or global operations. For public and quasi-publicsector organisations, on the other hand, the policy seeks toensure there is fair representation and equality of opportunity at

The Institute for Employment Studies88
all levels. Consequently, by providing them with a writtenpolicy, these organisations aim to ensure that their employees areaware of its aims and objectives, and their role in itsimplementation. There is anecdotal evidence to suggest thatethnic minority graduates are particularly attracted to publicsector employers because of their stance on equal opportunities,and this was partly confirmed by our own findings from theinterviews with graduates (see Chapter 4).
The level of commitment of the organisations interviewed toequality of opportunity appeared to determine the structureswhich support the policy. Organisations with a strong commit-ment were more likely to have elaborate structures, includingcommittees with responsibility for monitoring and reviewing thepolicy when necessary. Similarly, there was considerably moresupport for equal opportunities policies amongst seniormanagers and directors within such organisations. However,there were other organisations where equal opportunitiespolicies do not enjoy the wholehearted support in the upperechelons of management. As one of the respondents in ourinterviews commented, equality of opportunity is primarily seenas ‘something that is nice to do’.
In theory, equal opportunities policies are seen as effective toolsfor organisations seeking information on recruitment andselection monitoring, the composition of the existing workforce,measures to redress under-representation, and positive action. Inpractice, though, few of the organisations we interviewed usetheir equal opportunities monitoring procedures to institutechanges in their employment practices. Only one of theorganisations we interviewed had sought to address the issue ofethnic minority under-representation among its workforce as awhole, but more specifically in the more senior positions. In 1987that public sector organisation set an overall target of 20 per centethnic minority representation. Subsequent evidence showedthat although this target was achieved within the workforce as awhole, it was not reflected at the different levels or grades ofoccupation. A new policy has recently been introduced for the 20per cent target to be achieved at each level.
One of the dilemmas which organisations face in putting policyinto practice, is finding an acceptable definition of whatconstitutes under-representation. As we mentioned earlier in thischapter, ethnic minority representation varies enormouslyamong firms. But there is a perception that organisations rely onsuch uncertainty as a reason for inaction. This is demonstratedby the fact that when they need to, organisations have takensteps to avoid the potential cost implications of actions whichmay be brought against them at industrial tribunals for unfairpractices, including under-representation of particular groups.Indeed, one of the companies we interviewed was recentlychallenged by the Equal Opportunity Commission in NorthernIreland for not having a fair representation of the two

Ethnic Minority Graduates 89
communities of the province among its workforce. As a result,the company has made monitoring an essential part of itsrecruitment practice throughout the UK. Employees are nowmonitored at each stage of the recruitment process (application,shortlisting, interview and final selection) by a recruitmentofficer, to observe the progress of different groups. What is lesscertain, in this and other examples of the initiatives of otherorganisations we interviewed, is subsequent action emanatingfrom the monitoring process.
6.6 Attitudes towards ethnic minority graduates
None of the companies we interviewed perceived there to be anydifference between ethnic minority and white graduates, interms of preferential treatment by management, or insupervision in training and career development. Neither did theybelieve there to be preference in selection for training andpromotion. It must be emphasised, though, that these are purelysubjective assessments by them, which are not backed up bystudy or research, either on the specific issues of training andpromotion, or on differences in performance between white andethnic minority graduates. While there may not be noticeabledifferences in the early years of graduates’ careers, it is quitepossible that differences emerge later. Indeed, this may partlyexplain the fact that there are fewer graduates of ethnic minorityorigin in senior positions within the organisations. A number offactors could be at work, among which is not only their smallnumbers overall, but also how well ethnic minority graduatesfeel integrated into the structures of organisations. What emergesclearly from our study of the attitudes of employers is thatbecause there are no obvious or perceived differences inperformance, the majority do not, consequently, perceive there tobe specific advantages or disadvantages in employing ethnicminority graduates. We found only one example of anorganisation which believes employing ethnic minority graduatesis good for its business, in publicity terms and improving sales,since a significantly important proportion of its customers isdrawn from ethnic minority groups. Their comment on thespecific benefit is quoted here to emphasise some of the otheradvantages:
‘The business can also benefit from having a diverse range of peopleworking for it. It is known, for example, that in some local stores,managers of Caribbean origin have introduced and sourced a range ofnon-traditional vegetables, and significantly increased turnover as aresult.’
Such examples, though, are few indeed. Overall, the companieswe interviewed perceive that their attitude, together with that ofthe rest of their workforce, towards people of ethnic minorityorigin is ‘fine‘. But this may be mainly one of complacency.
The Institute for Employment Studies90
6.7 Summary
The main points emerging from the interviews with the sampleof graduate recruiters were:
Ethnic minorities represented between three and 15 per centof employment in the organisations interviewed for the study.The majority of these were in the lower grade occupations.Very few occupied senior management positions.
Although employers have ‘graduate level employment’, anumber of graduates are also taking ‘non-graduate’ jobs.Ethnic minority graduates are more likely than their whitepeers to take such jobs. It is a contributory factor to the feelingof under-employment experienced by ethnic minoritygraduates (reported in the survey).
The main change in recruitment methods is less emphasisbeing given to the graduate ‘milkround’ and more targeting ofspecific universities and courses. The latter tends to befocused on older (pre-1992) universities with low proportionsof ethnic minority students.
Ethnic minority graduates are more likely to be disadvantagedin the selection process because they fail to meet the criteriaby which employers shortlist and select their recruits. Pre-university entry qualifications, the type of higher educationinstitution, and degree class, are the main sources ofdisadvantage. There is increasing use of competence-basedcriteria, which can help to eliminate disadvantage, although itis unclear as yet if that aim is being achieved.
The early career development of graduate recruits is generallystructured and, therefore, less likely to show any significantdifferences in performance between ethnic minority and whitegraduates. Post-training development and promotion, on theother hand, are less structured. Subjective rather thanobjective factors, such as the influence of line managers, havea considerable bearing on the progress which individuals orgroups subsequently make.
Equal opportunities policies are applied extensively duringthe recruitment process. However, the support which suchpolicies enjoy among senior managers varied, particularlybetween public and private sector organisations in the study.
None of the employers interviewed perceived there to be anydifference between their white and ethnic minority graduatesin terms of preferential treatment by managers, or in theirsupervision or performance. However, the absence of formalmonitoring of graduates in selection, but particularly duringsubsequent training and development in most organisations,makes it difficult to assess the true extent of disadvantage forethnic minorities. This is not a high priority for most organisa-tions and would appear to be one factor behind the generalinaction in taking steps to remedy any under-representation.

Ethnic Minority Graduates 91
7. Summary and Conclusions
The overall aim of the research was to investigate theemployment outcomes and career progress of ethnic minoritygraduates, and make comparisons with white graduates. It metthis aim via reviews of the available data and research literature,a follow-up survey of a small sample of 1993 graduates (272),and interviews with ethnic minority graduates (25), careersadvisers at four universities, and employers (10). In this finalchapter, we draw together the main findings of the differentcomponents of the research by focusing on:
trends in participation of ethnic minorities in higher education,and factors of influence in choice of study
graduate employment patterns, in particular, differencesbetween ethnic groups in their first and current jobs and earlycareer histories
attitudes of graduates from ethnic minorities towards theiremployment experiences and career progress to date
attitudes of employers to ethnic minority graduates, theirrecruitment and career development practices and policies.
The survey was based on a sample of 1993 graduates from fouruniversities, two new (post-1992) and two established (pre-1992)institutions. The survey response was lower than expected, at 39per cent, and the number of ethnic graduates it produced waslower, too. This limited the analysis possible and also meant thatsome of the survey conclusions are less robust. The surveyanalysis was based on a matched sample of the ethnic minoritygraduates with a sub-sample of white respondents (272 in total).Matching was done by type of university, subject, age and gender.
An employer perspective was obtained from interviews in asmall sample of companies, ten in all, mainly establishedgraduate recruiters from a range of employment sectors.
7.1 Ethnic minorities in higher education
7.1.1 Distribution in the student population
Recently available data, covering all UK publicly funded highereducation institutions, provide for the first time a comprehensive

The Institute for Employment Studies92
analysis of the ethnic characteristics of the student population(HESA, 1995). This shows that in December 1994:
Almost one in eight, 11.5 per cent, of all UK domiciled highereducation students (of known ethnicity, covering 70 per centof the total student population), were from ethnic minoritygroups.
Representation of ethnic minorities at first degree level was11.3 per cent, and at other undergraduate level (eg HND,DipHE) 13.5 per cent; it was slightly lower at postgraduatelevel (10.4 per cent of taught and 9.1 per cent of research post-graduate UK domiciled students were from ethnic minorities).
The distribution of ethnic minority groups is very uneven interms of level, mode and subject of study:
• The largest ethnic minority group represented at firstdegree level is Indian (27 per cent of all non-whites); andthe smallest is Bangladeshi (three per cent).
• Chinese and ‘other-Asians’ are better represented atpostgraduate research level than on first degrees, andAfricans are better represented on postgraduate taughtcourses than at other levels.
• Part-time first degree study is more prevalent amongAfrican-Caribbeans and ‘black-other’ groups than Asiansor Whites.
• Asians, in particular Indians and Pakistanis, are morelikely to be studying medicine and dentistry atundergraduate level than whites or any other ethnicgroups; business and administrative studies andcomputer science are more popular choices for mostethnic minority groups than for whites, while educationis generally less popular among ethnic minorities.
Women are unevenly represented among ethnic minoritystudents, ranging from over 60 per cent of African-Caribbeansto around 50 per cent of whites, Chinese and Indians, and toaround 40 per cent of Bangladeshis and Pakistanis.
Mature students on first degrees are disproportionatelyrepresented among some ethnic minority groups, in particularblack groups where over 70 per cent are aged 21 years or over,and half are 25 years or older. By contrast, Indian first degreestudents tend to be younger on average than whites.
Entry qualifications vary by ethnic group: over half of whiteand Asian students entered with the traditional qualificationsof ‘A’ levels or Highers in 1994, compared with around a thirdof black students where access and vocational qualificationswere more common. This is undoubtedly linked to the olderage profiles of black entrants.
There is a strong link between mode of study, gender andsubject choice of ethnic minorities, which explains some of thedifferences between ethnic groups.

Ethnic Minority Graduates 93
7.1.2 Application trends
Both applications from ethnic minorities and their rate ofadmission to universities have been increasing over time. In1994, 13.2 per cent of total applications to first degree full-timestudy through the UCAS admissions system were from ethnicminorities. The latest figure for 1996 entry is 14.0 per cent.
As might be expected, application rates differ by ethnic groupand gender, and there are concentrations of ethnic groups incertain subjects, as highlighted above in the student data. Thesedifferences are not new and were shown to exist in the early1990s by various researchers.
In the past, ethnic minorities were more likely to apply topolytechnics than universities (and more likely to be admittedalso) and, while the gap between the new (ie post-1992, mainlyformer polytechnics and colleges) and older universities (pre-1992) has narrowed, there remain big differences in theproportion of ethnic minorities among applicants to differentuniversities.
Previous research has also shown that ethnic minorityapplicants, in particular black applicants, were less likely to havetwo or more ‘A’ levels, and that while the mean ‘A’ level scoresfor whites, Chinese, Indians and Asian-other applicants weresimilar, they were higher than for black applicants, especiallyAfrican-Caribbeans. Mean ‘A’ level scores were lower inapplications from ethnic minorities compared to whites, and inapplications to polytechnics compared to universities (pre-1992),but the pattern between ethnic groups was similar in both sub-sectors at that time. There are no currently available data analysedseparately on applications to the pre- and post-1992 universities.
7.1.3 Admissions trends
The growth in admissions of ethnic minorities to full-time degreecourses reflects some of the wider changes that have taken placerecently in higher education. These include its broader range ofprovision, widening access policies, and greater diversity in thestudent population. These changes have not taken place evenlyacross the higher education sector, and individual universitieshave widely differing student profiles, including different ethnicprofiles. The representation of ethnic minorities on first degreecourses ranges from over 30 per cent at a few of the new (post-1992) universities which were formerly polytechnics or collegesof higher education, to under ten per cent at many of theuniversities established pre-1992.
7.1.4 Effective participation
In respect to their position in the UK population, where only 5.8per cent of the population are from ethnic minorities (but slightly

The Institute for Employment Studies94
more in the younger age groups), the effective participation rateof ethnic minorities in higher education is similar to whitesoverall. However, there is still considerable variation by genderand ethnic group: in particular, male Africans, Indians, Chineseand Asian-others are better represented than male whites, andfemale Bangladeshis are less represented than any other femaleethnic groups.
7.2 Influences on participation in higher education
Various factors of influence have been identified in previousresearch as being of importance in explaining the differences inparticipation rates in higher education of different ethnic groupsand on their distribution across different parts of the sector.These include:
Prior academic achievement and education routes — staying-on rates in education beyond 16 are greater among ethnicminorities as a whole than whites, and highest amongAfrican-Asians, Chinese and Africans. Ethnic minorities arealso more likely than whites to be doing so in furthereducation than at school; and they are more likely to takevocational or access qualifications and take ‘A’ level re-sits.
Early career guidance and subject choice — evidence exists ofracial stereotyping and ‘channelling’ of ethnic minorities intocertain courses or occupations.
The image, culture and style of certain universities — ethnicminority students are more likely to apply to universitieswhich have more of an ethnic profile. Attitudes of staff toethnic minorities, projection of a multi-cultural image inprospectuses, provision of particular courses and accesspolicies are all important factors in choice of university byethnic minorities, as is geographical location. There is more ofa tendency for ethnic minority than white students to apply toa limited number of universities close to home.
Personal characteristics such as age, gender, social class, homebackground and parental influence are also important factorsexplaining some of the differences between some, or parts of,ethnic groups.
There was also some evidence of direct discrimination inadmissions and selection practices of universities in the early1990s. The new admissions process and the development ofequal opportunities policies in institutions, however, areexpected to have led to a diminution of this, though there is nomore up-to-date evidence to support this view.
The findings of the graduate survey and interviews undertakenas part of this study confirm some of these influences on earlycareer development, though it needs to be noted that they wereboth based on relatively small samples (see above). In particular,

Ethnic Minority Graduates 95
the survey showed consistent differences between ethnic groupsin entry qualifications, though very little difference between allethnic minority and white graduates. In particular, blackrespondents had lower entry qualifications. Our study wasgenerally less conclusive than previous research in identifyingethnic differences because we controlled for type of institution.There are considerable differences between institutions in theiraverage entry qualifications and in access policies, especiallyattitudes to non-traditional applicants.
Ethnic minority graduates’ decision to enter higher educationwas influenced mainly by ‘traditional’ factors. Positiveinfluences, such as family and school encouragement, weremoderated by the experiences of discrimination or anticipation ofdiscrimination, in particular the perception of feasible careeroptions by themselves, as well as by teachers and careersadvisers. The interviews also showed how higher education isseen as increasingly important among working class Asian andblack families as a way of overcoming labour marketdisadvantage. Similarly, there was an indication among Asiangroups that higher education is increasingly being seen as anacceptable option for young women.
In the survey, over twice as many ethnic minority than whitegraduates considered their university’s attitude to ethnicminority students as an important factor in choosing it. Blackgraduates appeared to be influenced more by this than others.They were also more influenced by the university’s attitude toolder students. Geographical location was a decisive factor forslightly more ethnic minority graduates than white ones, and itwas also particularly important for black graduates. So, too, wasits reputation, especially for Asian students. By contrast, whitegraduates were more likely to be influenced by the choice ofsubjects available.
7.3 Experiences at university
The graduate interview data provided some insights into ethnicminority graduates’ experiences at universities. These present amixed picture. For some it was a positive experience, but forothers, subtle forms of exclusion and marginalisation, the lack ofreaction from other students and staff about discrimination, andthe ‘colour blind’ approach of many lecturers had a negativeimpact. The experiences of some graduates who had taken partin particular initiatives aimed at helping ethnic minoritystudents, such as the Mentoring Scheme, gave an indication ofhow these difficulties could be overcome.
The research adds to the limited evidence from the literature thatsome ethnic minority students face difficulties at someuniversities, both academically and socially, which may lead todropping out, or poor performance at graduation. While we didnot gather any evidence from universities relating to differential
The Institute for Employment Studies96
completion rates by ethnic group, the survey showed that theethnic minority graduates were more likely than white graduatesto obtain a lower class of degree. Even taking into considerationentry qualifications, the levels of academic performance betweenethnic groups were different.
7.4 Employment patterns
7.4.1 Previous research evidence
A small amount of evidence exists in the research literature onemployment outcomes and subsequent career progress ofgraduates. Most refers to a period in the 1980s when thegraduate market was different from today (eg smaller in size, lessbroad based, more focused on large employers). It suggests thatethnic minority graduates, on the whole:
experience greater difficulties in the labour market than whitegraduates
do less well in securing good jobs
are less satisfied with their career progress and resultingrewards in the labour market
experience some discrimination by employers.
Degree subject is a factor highlighted in previous studies asaffecting employment outcomes. As ethnic minority graduatesare concentrated in particular subjects (eg business studies,computer science) and not in others (eg education), this isthought to explain much of the difference between ethnic groupsin their sectoral and occupational distributions.
Other evidence from labour market research, principally analysisof the Labour Force survey and 1991 Census of Population,shows that although a higher proportion of the ethnic minorityworkforce are highly qualified (to above ‘A’ levels) comparedwith whites, their unemployment levels are higher also. It alsohighlights a more uneven pattern of disadvantage betweenethnic minority groups than suggested by the earlier graduatestudies. With the exception of African-Caribbeans, highlyqualified men from ethnic minorities are more likely to be inprofessional jobs than similarly qualified white men. For women,the pattern was less clear, but there were some ethnic groupswhere the position of highly qualified women in professional ormanagerial occupations was more favourable than that of whitewomen.
There is also a range of evidence on disadvantage of ethnicminorities in specific occupations and professions, egaccountancy, law and teaching, some of which have been subjectto investigation and action taken.

Ethnic Minority Graduates 97
7.4.2 Graduate survey findings
The main purpose of the graduate survey was to investigategraduates’ early career progress and explore some of the issuesidentified in the earlier research relating to labour marketdisadvantage. In particular, it aimed to provide more up-to-dateevidence about the recent experiences of ethnic minoritygraduates in today’s rather different graduate labour market.
As mentioned at the beginning of this chapter, because of a lowsurvey response rate and a small sample size, some of the surveyconclusions need to be treated with caution. Nevertheless, theydo point to useful directions for further inquiry.
The survey provides evidence that some disadvantage continuesto exist for graduates from ethnic minorities, but thesedifferences are not always consistent and some may relate moreto their educational background (eg routes taken into university,degree class and type of institution) than specifically to theirethnicity. Differences between ethnic groups were clearlyidentifiable: in particular, black graduates were identified ashaving most problems in relation to level of employment (iemore felt under-employed, fewer were in professional level jobs),while in some respects the employment situation of Indians wassimilar to that of whites.
Other points of interest were:
Slight differences were evident in the career histories of whiteand ethnic minority graduates, with the former consistentlymore likely to be employed and less likely to be unemployedin the two and a half years after graduation. There wasinsufficient evidence to confirm that the gap between ethnicminorities and white graduates narrowed over time (asprevious research has suggested).
Ethnic minority graduates had experienced more periods ofunemployment than white graduates, and their longestunemployed period was greater in duration on average. Ethnicminorities were considerably more likely than whites to linktheir employment difficulties to lack of suitable educationalqualifications and skills, while whites were more likely toblame labour market factors (eg competition, lack of vacancies).
Ethnic minority graduates were slightly more likely to havetaken further study within the first 18 months after theirdegree. They were less likely than whites to have taken aprofessional course and more likely to have studied for amasters, PhD or postgraduate diploma in higher education.
It took ethnic minority graduates longer to secure their firstjob after graduation, the main variation being between blackand Indian respondents who took longer on average than theother ethnic groups. However, when class of degree was

The Institute for Employment Studies98
controlled for, this difference reduced. Ethnic minorities alsoneeded to apply for more jobs before being successful.
The first job of white female graduates was more likely to befull-time than for women from ethnic minorities. There weresimilar proportions of ethnic minority and white respondentsworking in temporary jobs or on short-term contracts.
Ethnic minority graduates were slightly more likely to be in abetter paid job initially, but this is likely to partly reflect theirgreater concentration in the London area (particularly blackgraduates). No significant differences emerged between sectorof employment or occupational category of their first job(contrary to earlier research findings).
Some two and a half years later, rather more ethnic minoritygraduates than whites were in a ‘professional’ job, but theinitial earnings differential had disappeared. Average salariesfor ethnic minorities was slightly lower than for whites, andparticularly low for black graduates. There was even lessdifference between ethnic minorities and whites inemployment sectors of current jobs than in initial jobs.
More ethnic minorities than whites had entered their currentjob via a graduate entry programme and more said that adegree was an entry requirement or was helpful in getting thejob. On the other hand, there was little difference in the extentto which the two groups felt their jobs required graduate levelability and a lower proportion of white graduates consideredthemselves to be slightly underemployed in their current job.Disappointment with the quality of jobs and employmentopportunities was widespread (for both groups), which is inline with other recent research showing dissatisfaction ofgraduates on entering the labour market.
There were little significant differences between graduates’experiences of being considered and applying for promotion,but ethnic minorities were less likely to have been promoted.Considerable variation emerged between ethnic groupsrelating to their prospects for promotion, being highest amongIndians and lowest among black respondents.
The number of ethnic minorities reporting serious racialdiscrimination in employment was small, but 42 per cent ofethnic minorities had experienced some in their present job.Black graduates were twice as likely than Asians to reportracial discrimination. Interestingly, age discrimination was alsomentioned more frequently by ethnic minorities than whites.
The most common career profile was to be in permanentemployment continuously since December 1993 (accountingfor 33 and 42 per cent of ethnic minority and white graduatesrespectively). However, when class of degree was controlledfor this difference virtually disappeared.
Women ethnic minority graduates were less likely to havebeen in continuos employment over the period compared to

Ethnic Minority Graduates 99
all men and white women. This lends support to the view thatsome ethnic minority women may be experiencing a ‘doubledisadvantage’, because of their gender and ethnicity.
Overall, white graduates in the survey reported a generallyhigher level of satisfaction with their careers to date thanethnic minority graduates. However, this varied betweengroups, with Indians being the most satisfied, then whites,and black respondents being least satisfied.
7.4.3 Attitudes of graduates to their career development
The interview data provided more insights into the range ofexperiences of ethnic minorities after graduation. They confirmedthe previous research that discrimination in employment is aproblem that some experience. While blatant forms ofdiscrimination are now relatively rare, more subtle forms ofexclusion and indirect discrimination remain, and are felt bygraduates to limit their employment opportunities.
The exploration of these difficulties, and also the more positiveexperiences highlighted by some respondents, gave an indicationof the kinds of actions employers could take to reducedisadvantage. These included:
using equal opportunities policies better, as a means to an end,not the end in itself
looking more positively on the attributes of ethnic minoritiesrather than putting emphasis on the more negative views ofemployment or skill deficiencies
reviewing selection and recruitment methods to avoid variouskinds of indirect discrimination
reviewing organisational cultures to see how they may becontributing to the persistence of racial discrimination, and
accepting and valuing more the increasing cultural and ethnicdiversity in the student population and the workplace.
7.5 Employers’ views and practices
The employer interviews examined graduate recruitment anddevelopment in a sample of ten graduate recruiters, as well astheir equal opportunity practices and policies. All theinterviewees did not perceive any differences between theirwhite and ethnic minority graduates in their selection,performance and progression, but these were based on subjectiveassessments and not backed by any research. There was littleformal monitoring and an absence of any evidence ofdisadvantage for ethnic minority graduates.
However, various areas were highlighted which are likely toplace ethnic minority graduates at a disadvantage:

The Institute for Employment Studies100
Ethnic minority representation in the organisations rangedbetween three and 15 per cent. The majority were in low gradeoccupations, and few occupied senior management positions.
Ethnic minority graduates are more likely than whites to takeup jobs seen as ‘non-graduate’ jobs. By doing so, they are lesslikely to receive structured training and development. Thismay also be a contributory factor to them feeling under-employed, as highlighted in the survey.
Graduate recruitment methods of these large recruiters havenot changed much recently, although there is now less ‘milk-round’ activity and more targeting of selected universities.The latter tend to be pre-1992 universities where the proportionof ethnic minority graduates is smaller on average.
Disadvantage in the selection process can arise from theemphasis put on pre-university qualifications, their type ofuniversity and degree class. There is increasing use ofcompetence-based selection criteria, but no evidence as yet asto its effect on reducing discrimination.
Early career development (for those joining graduate entryprogrammes) is more structured than subsequently, andtherefore less likely to show any significant differencesbetween ethnic minority graduates and whites. Subjective (egselection for training at management discretion), rather thanobjective factors, have a considerable bearing on the progresswhich individuals or groups make subsequently withinorganisations.
Equal opportunities policies are applied extensively duringthe recruitment process, but support for such policies amongsenior managers varies considerably, particularly between thepublic and private sectors.
7.6 Conclusions
The research has shown that ethnic minority graduates aremaking up an increasing proportion of the graduate output, butthere are uncertainties about future growth patterns. If the studentpopulation continues to grow, albeit at more modest levels thanin the recent past, and diversify further, their numbers are likelyto expand also. The representation of ethnic minorities, and inparticular different ethnic groups, varies considerably betweeninstitutions and subjects. The future rates of growth of differentethnic groups in higher education are also likely vary as they areinfluenced to a different extent by a range of factors.
One of the more conclusive findings of the survey has been thedifferences between ethnic groups that have been highlighted,both in participation levels and in their experiences in highereducation, and subsequently in the labour market. The extent towhich other factors (eg educational background, or type ofinstitution), rather than ethnicity alone, can explain some of these

Ethnic Minority Graduates 101
differences needs to be investigated further. In particular, loweracademic performance in degree study of some ethnic minoritygroups may be having a considerable influence on initialemployment prospects, and this needs to be explored further.
The 1995 First Destinations Return (FDR) will, for the first time,provide a breakdown on the initial destinations of graduatesfrom different ethnic groups. This data set is expected to bereleased by HESA in August 1996. Because of its large scale (it isvirtually a census), it will enable a more detailed investigation ofinitial employment outcomes to be made and some of thefindings highlighted here to be tested. However, the FDR is a‘snapshot’ of employment positions just six months after mostgraduates have completed degrees. More investigation isrequired over a longer time period. Also, evaluations of specificschemes to help ethnic minority students and graduates, such asthe Mentoring initiative at some universities, here and in othercountries, could help in understanding their benefits andsuggesting ways in which graduates’ career planning could beimproved. There also is a need for employers to be more awareof the weaknesses of shortlisting practices which focus ontraditional academic achievement and can lead to indirect formsof racial discrimination, as well more internal monitoring of theirgraduate selection practices, and subsequent training anddevelopment programmes.

The Institute for Employment Studies102
Bibliography
AGR (1993), Roles for Graduates in the 21st Century: Getting theBalance Right, Goodman C, Cambridge
Bird J, Sheibani A, Francombe D (1992), Ethnic Monitoring andAdmissions to Higher Education, University of the West ofEngland/Department of Employment
Bird J, Yee W C, Myler A (1992), Widening Access to HigherEducation for Black People, Employment Department
Blair M (1994), ‘Black Teachers, Black Students and EducationMarkets’ Cambridge Journal of Education, Vol. 24, No. 2
Brennan J L, McGeevor P A (1987), Employment of Graduates fromEthnic Minorities, CRE
Brennan J L, McGeevor P A (1990), Ethnic Minorities and theGraduate Labour Market, CRE
Brennan J L, Lon E S, McGeevor P A, Murray K (1993), Students,Careers and Jobs: The Relationship between HE and the LabourMarket, Jessica Kingby, London
Brown C (1984), Black and White Britain, Heinemann
CBI (1994), Thinking Ahead: Ensuring the Expansion of HigherEducation into the 21st Century, London
Commission for Racial Equality (1987), Chartered AccountancyTraining Contracts, CRE
Council for National Academic Awards (1992), Progress andPerformance in Higher Education, CNAA
Court G, Jagger N, Connor H (1995), IES Annual Graduate Review1995/96, IES Report 296
Connor H, Pearson R, Court G (1996), University Challenge: StudentChoices in the 21st Century, a report to the CVCP, IESReport 306
Connor H, Pollard E (1996), What Do Graduates Really Do?, IESReport 308

Ethnic Minority Graduates 103
CSU (1994), First Destinations of Students from the New UniversitiesQualifying in 1993, AGCAS
Drew D, Gray J (1991), ‘The Black White Gap in ExaminationResults: A Statistical Critique of a Decade’s Research’,New Community, Vol. 17, No. 2 pp. 159-172, January
Drew D, Gray J, Sime N (1991), Youth Cohort Study: England andWales — Against the Odds: The Education and LabourMarket Experiences of Black Young People, The EmploymentDepartment
Eggleston S J, Dunn D K, Anjali M, Wright C (1986), Education forSome, Trentham Books, Stoke on Trent
Employment Institute (1990), ‘Racial Inequality in the BritishLabour Market’, Economic Report, Vol. 5, No 4.
Equal Opportunities Commission (1994), Black and Ethnic MinorityWomen and Men in Britain 1994, EOC
Goulbourne H, Lewis-Meeks P (1993), Access of Ethnic Minoritiesto Higher Education in Britain: Report of a Seminar at King’sCollege, Cambridge, Occasional Papers in Ethnic Relations No.10, Centre for Research in Ethnic Relations
Gregson J, Taylor J (1987), ‘The first destinations of newgraduates: comparisons between universities’, AppliedEconomics, 21
Higher Education Funding Council for England (1994), Profile ofHEIs, HEFCE
Higher Education Funding Council for England (1995), SpecialInitiative to Encourage Widening Participation of Students forEthnic Minorities in Teacher Training, HEFCE
Higher Education Statistics Agency (1995a), Higher EducationStatistics for the United Kingdom, 1993/94, HESA
Higher Education Statistics Agency (1995b), Research Datapack 1:Ethnicity in Higher Education, HESA
Hyder K (1993), ‘The role of schools in increasing access tohigher education’, Access of Ethnic Minorities to highereducation in Britain: report of a seminar at Kings CollegeCambridge, (eds) Goulbourne H, Lewis Meeks P,(Occasional Papers in Ethnic Relations No. 10, Centre forResearch into Ethnic Relations)
Jackson C, Arnold J, Nicholson N, Watts A G (1996), ManagingCareers in 2000 and Beyond, IES Report 304
The Institute for Employment Studies104
Jewson N, Mason D, Bowen R, Mulvaney K, Parmar S (1991),‘Universities and Ethnic Minorities, the Public Face’, NewCommunity, Vol. 17, No. 2
Jones T (1993), Britain’s Ethnic Minorities, PSI
Kettley P (1995), Is Flatter Better? IES Report 290
King M and Israel M (1989), ‘The Pursuit of Excellence, or howSolicitors Maintain Racial Inequality’ New Community, 16(1), pp. 107-120
Local Government Management Board (1992), ‘ManagementDevelopment and Black Managers’, LGMB
Mason G (1994), The New Graduate Supply Shock: Recruitment andUtilisation of Graduates in British Industry, NationalInstitute of Economic and Social Research, Report Series,No. 9
Modood T (1993), ‘The Number of Ethnic Minority Students inBritish Higher Education: Some Grounds for Optimism’,Oxford Review of Education, Vol. 19, No. 2 pp. 167-182
Modood T, Shiner M (1994), Ethnic Minorities and Higher Education:Why are there Differential Rates of Entry?, PSI
Malik R (1995), ‘Punting for Cambridge’, Times Higher EducationSupplement, 1 September
National Opinion Polls (1990), A survey of Members of EthnicMinorities with Business Qualifications, NOP/ Departmentof Education
Noon M (1993), ‘Racial Discrimination in Speculative Application:Evidence from the UK’s Top 100 Firms’, Human ResourceManagement Journal, Summer, Vol. 3, No. 4
Owen D (1994), Ethnic Minority Women and the Labour Market:Analysis of the 1991 Census, EOC
Owen D, Green A (1992), ‘Labour Market Experience andOccupational Change amongst Ethnic Groups in GreatBritain’, New Community, Vol. 19, No. 1
PCAS (1991), Statistical Supplement 1989-90
Quiney M/GMB (1995), Divided by Degrees — The 1991 Census,’GMB
Skills and Enterprise Network (1995), Labour Market and SkillTrends 1995/96, Department of Employment
Singh R (1990), ‘Ethnic Minority Experience in Higher Education’,Higher Education Quarterly, Vol. 44, No. 4, Autumn

Ethnic Minority Graduates 105
Sly F (1995), ‘Ethnic Groups and the Labour Market: Analysesfrom the Spring 1994 Labour Force Survey’ EmploymentGazette, June
Sly F (1994), ‘Ethnic Groups and the Labour Market’, EmploymentGazette, May
Strebler M, Pike G (1993), Shortlisting the Best Graduates, IESReport 253
Tanna K (1990), ‘Excellence, Equality and Educational Reform:the Myth of South Asian Achievement Levels’, NewCommunity, 16 (3), pp. 349-368
Taylor P (1992), ‘Ethnic Group Data and Applications to HigherEducation’, Higher Education Quarterly, Vol. 46, No. 4,Autumn
Tomlinson S (1987), ‘Curriculum Option Choices in Multi-EthnicSchools’ in Racial Inequality in Education, Troyna B (ed.),Tavistock Publications
Troyna B (1991), ‘Underachievement or underrated? theexperience of pupils of South Asian origin in a secondaryschool’, British Educational Research Journal, Vol. 17, No. 4
TUC Economic and Social Affairs Dept (1995), Black Workers andthe Labour Market, TUC Black Workers’ Conference Report,May
Universities and Colleges Admissions Service (1994), StatisticalSupplement to the PCAS Annual Report 1992 to 1993, UCAS
Universities and Colleges Admissions Service (1995), AnnualReport 1993-94 Entry, UCAS
Universities and Colleges Admissions Service (1996),unpublished statistics on 1995 entry, UCAS, January
UCCA (1991), Twenty-eighth Report 1989-90
UCCA (1992), Statistical Supplement to the 29th Report, 1990-91
Universities’ Statistical Record (1994) ‘First Destinations ofUniversity Graduates’, Vol. 2, USR
Walsh D, Hampton K, Bain J (1995), Increasing Access to HigherEducation in Glasgow for Ethnic Minority Students throughthe Development of Appropriate Recruitment and SupportMechanisms, Report 1: Review of Literature and Statistics,SEMRU
Williams G, Fry H (1994), Longer term prospects for highereducation, a report to the CVCP, Centre for HE studies,University of London

The Institute for Employment Studies106
Williams J M (1989), The access effect: an evaluation of the relativesuccess of access and traditional courses in facilitating ethnicminority preparation for and entry to degree level courses,CNAA
Wrench J (1991), ‘Gatekeepers in the Urban Labour Market’, inWork and the Enterprise Culture, Cross M, Payne G (eds),The Falmer Press
Wrench J (1993), ‘The careers service and stereotyping of ethnicminority school leavers’ in Access of Ethnic Minorities tohigher education in Britain: report of a seminar at KingsCollege Cambridge’, Goulbourne H, Lewis-Meeks P (eds),(Occasional Papers in Ethnic Relations No. 10, Centre forResearch into Ethnic Relations)

Ethnic Minority Graduates 107
Appendix 1: Further Tables
Table A.1.1: Population by ethnic group, 1981-90
1988-90 Average(000s)
% % change1981-88%
White 51,847 — +1
Ethnic Minority Total 2,577 100 +23
African-Caribbean 504 20 –5
African Asian 268 10 +40*
Indian 563 22 +5*
Pakistani 450 17 +58
Bangladeshi 10 4 +110
Chinese 135 5 +447
African 158 6 +98
Other/Mixed 388 15 +18
Not Stated 509 — —
* derived from OPCS 1981 estimate
Source: Jones, 1993
Table A.1.2: Percentage of 16-19 year olds in full-time education by ethnic group, 1988-90
All Male Female
White 37 36 38
Ethnic Minority Total 56 56 56
African-Caribbean 43 39 48
African Asian 66 75 56
Indian 58 55 61
Pakistani 55 64 45
Bangladeshi 46 41 *
Chinese 77 * *
African 71 * *
Other/Mixed 58 55 62
Source: Jones, 1993

The Institute for Employment Studies108
Appendix 2: Survey Design and Response
A small follow-up survey of graduates was conducted in order toobtain up-to-date information about employment outcomes andcareer progress of graduates from different ethnic minoritygroups.
The survey approach was to select a sample of 1993 graduates atfour universities, contact them by postal questionnaire, identifythe ethnic minority students in the response, and then matchthem with a sub-sample of white respondents by gender, age,type of university and degree subject. This matched sample wasthen analysed.
This approach was chosen for two main reasons:
1. The survey was to be explorative and based on a small sampleof graduates. The size of the sample and the number ofuniversities which could be covered was limited mainly bythe size of the budget and the short timescale of the project.
2. It would have been impossible to generate an ‘ethnicallytagged’ sample of graduates. Thus a two-stage approach hadto be taken, first selecting a much larger random sample ofgraduates and then focusing on the ethnic minorityrespondents.
University selection
The four institutions were selected to illustrate the range ofuniversities that make up the higher education sector, taking intoconsideration a number of variables. We used the followingselection criteria:
type of university: two ‘old’ (ie established before 1992) andtwo ‘new’ (ie established since 1992) institutions were to beincluded in the sample
geographical location: including at least one university inLondon and at least one in the provinces
size of ethnic minority population: in order to maximise thenumber of ethnic minority graduates in the sample, the focusshould be on universities with high proportions of ethnicminorities
Ethnic Minority Graduates 109
ethnic minority composition: the achieved sample was toinclude a good representation of the main ethnic groups ieboth Asian and black graduates
quality: we aimed to select at least one institution from themore prestigious universities (as perceived by employers),with higher than average ‘A’ level entry requirements, and atleast one from those with less traditional types of studententry in terms of educational background
subject mix: we were aiming to obtain a good representationof different subject areas in the achieved sample.
Some of these criteria were closely related, some were not. In theevent, it proved impossible to meet all of them, so a compromisehad to be reached. After discussions with the research sponsorsat the DfEE, the following four were contacted and agreed toparticipate.
University A
This is a large, traditional university established in the 19thcentury, which is among the top ten UK universities. It has acompetitive entry, a national catchment area, a high academicteaching and research reputation, covering a broad range ofdisciplines, including a medical school. The university is basedin an urban area with an established black ethnic minoritypopulation.
According to the information provided by the university, in 1993they had an output of 8,000 first degree students. The estimatedethnic graduate population at the time was ten per cent, includingsix per cent Asian, three per cent black and one per cent mixed/other students.
University B
A university established in the 1960s with a focus on science andengineering. It draws students nationwide, but the focus is onstudents from within their region. The university is based in ageographical area with a large Asian community.
Information provided by the university shows that their firstdegree output in 1993 was 5,000, while the proportion of ethnicminority students was estimated to be 12 per cent, including tenper cent Asians, one per cent Africans and Caribbeans, and oneper cent mixed/other.
University C
A former polytechnic based in London, established as auniversity in 1992. This is a vocationally oriented and fastgrowing institution, with a strong access and community needs

The Institute for Employment Studies110
mission, which has been active in attracting ethnic minority andmature students.
The information provided by the university shows that in 19936,000 first degree students completed their course, and theestimated proportion of ethnic minorities was 40 per cent,including six per cent Asian, 23 per cent black and one per centmixed/other students.
University D
A former polytechnic established as a university in 1992 with avocational emphasis to its provision. The local catchment area isvery important, and has been active in targeting local schools andethnic minority students in the locality. It is based in an area witha relatively high ethnic minority population, particularly with alarge Asian community.
The information provided by the university shows that in 1993the first degree output was 6,000, with an estimated ethnicminority student population of 20 per cent, including 15 per centAsians, five per cent Africans and Caribbeans, and 0.4 per centmixed/other.
Graduate sample selection
At each university, discussions were held with staff in theregistry office, the alumni records office and careers unit.Agreement was reached with the universities that each wouldselect the sample from their records of first degree full-time UKdomiciled students who completed their course in 1993. Thesenames were then matched to address files, using alumni records.Some universities found this process easier to do than others,and there were also differences between universities in thequality of addresses held on students. This caused some delay.Timing was another factor, as the sample selection coincidedwith the start of the academic year and most staff were very busyand had other priorities.
In order to generate sufficient numbers of ethnic minoritygraduates in the response, each university was asked to providea large sample of graduates (see Table A.2.1 for details) and atotal of 3,421 graduates were included in the initial sample. Theresponse rate for each institution is also shown in Table A.2.1.
Response rate
The universities sent out the questionnaires on our behalf forreasons of confidentiality relating to students’ addresses.
After one reminder (also sent by the universities), a total of 1,177questionnaires had been received by the end of January 1996,

Ethnic Minority Graduates 111
including 224 questionnaires returned by the Post Office. Wetherefore achieved a response rate of 37 per cent. As mentionedin Chapter 1, this was disappointing and below the response wehad hoped to achieve. Previous similar follow-up studies at IEShave achieved a minimum of 50 per cent response.
The response rate has been negatively affected by a combinationof factors. First, the variable quality of addresses held at thedifferent institutions, as shown by the differences in the responsefrom different universities (see Table A.2.1). Second, because oftime constraints we were unable to send a second reminder asplanned. Third, the survey remained in the field for a relativelyshort period of time, a few weeks more would have considerablyincreased the response rate, (298 additional questionnaires werereturned after the survey was closed).
Representativeness
In the following tables, we present the whole samplecomposition for each university in terms of age, gender andsubject as well as 1990 entry data from all UK universities andformer polytechnics. Unfortunately, the universities were unableto supply this information on an individual basis.
As shown in Tables A.2.2 and A.2.3, compared with national dataour sample included a higher proportion of mature students.
Table A.2.1: Initial and achieved samples, total response and ethnic minority response ineach sample university
Institution Initialsample
N
PO returnsand
unusable Qs
N
Totalachievedsample
N
Totalresponse
%
Total ethnicminorities
N
Ethnicminorityresponse
%
Totalrespondentsin matched
sampleN
Univ. A 1,000 42 301 31 8 3 16
Univ. B 1,021 50 470 48 45 10 90
Univ. C 700 52 170 26 53 31 106
Univ. D 700 80 236 38 30 13 60
Total 3,421 224 1,177 37 136 12 272
Source: IES Survey
Table A.2.2: Age composition of respondents from the different institutions
Age appliedat university
University A University B University C University D
N % N % N % N %
Under 21 255 88 380 81 72 42 164 69
21 and over 34 12 88 19 98 58 72 30
Total 289 468 170 236
Missing cases: 14
Source: IES Survey

The Institute for Employment Studies112
However, entry data from former polytechnics excludesinformation on direct entrants, many of whom are likely to bemature students.
Women also seemed to be over-represented in our sample,compared with national data (Tables A.2.4 and A.2.5). This couldbe partly explained by the inclusion in the sample of institutionswith a higher proportion of students from subjects were womentend to be better represented (eg subjects allied to medicine, andarts/humanities).
As can be seen from Table A.2.6, business/finance/administrationgraduates were better represented in the two former polytechnics.This is line with national data. The proportion of social sciencesgraduates varied considerably between different institutions, butthe overall proportion was similar to the 1993 national graduateoutput. Compared with national data, students from arts/humanities, subjects allied to medicine, engineering/technologywere over-represented, while graduates from maths/computing,multi-disciplinary courses, and natural/physical sciences wereunder-represented.
Table A.2.4: Gender composition of respondents from the different institutions
Gender University A University B University C University D
N % N % N % N %
Female 127 44 236 51 113 67 128 55
Male 162 56 228 49 55 33 106 45
Total 289 464 168 243
Missing cases: 22
Source: IES Survey
Table A.2.5: Gender composition, UCCA and PCAS 1990 entry data
Gender Universities Former polytechnics
Female 48% 44%
Male 53% 56%
Total n. of homeaccepted applicants
99,377 64,482
Source: UCCA, 1991; PCAS 1991
Table A.2.3: Age composition, UCCA and PCAS 1990 entry data
Age applied atuniversity
Universities Former polytechnics
Under 21 87% 80%
21 and over 13% 20%
Total n. of homeaccepted applicants
99,377 64,482
Source: UCCA, 1991; PCAS 1991

Ethnic Minority Graduates 113
Table A.2.6: Degree subject by proportion of respondents from different institutions and forthe whole sample
Degree subject University A
%
University B
%
University C
%
University D
%
Proportion of thetotal sample
%
Business/finance/admin.
0.3 13 12 18 10
Social sciences 15 14 24 7 14
Arts and humanities 7 10 24 16 12
Engineering andtechnology
14 19 10 10 15
Maths and computing 7 6 — 0.4 4
Subjects allied tomedicine
4 13 2 7 8
Professional courses 5 — 8 20 7
Multi-disciplinary 9 8 16 2 8
Natural/physicalsciences
22 6 4 4 9
Others* 17 13 — 17 13
Total number 301 457 161 234
Missing cases: 24
* These include: medicine, dentistry, veterinary science, agriculture and languages.
Source: IES Survey
TableA.2.7: Degree subject, UCCA and PCAS 1990 entry data
Degree subject Universities%
Former polytechnics%
Business/finance/admin. 5 18
Social sciences 15 15
Arts and humanities 9 10
Engineering and technology 12 10
Maths and computing 7 6
Subjects allied to medicine 3 3
Professional courses 4 6
Multi-disciplinary 11 14
Natural/physical sciences 16 10
Others* 27 7
Total of acceptedhome applicants
99,377 64,482
* These include: medicine, dentistry, veterinary science, agriculture and languages.
Source: UCCA, 1991; PCAS 1991

The Institute for Employment Studies114
Matched sample
The achieved sample comprised 11 per cent from ethnicminorities (136 respondents). These were matched with a sub-sample of white respondents by type of institution, degreesubject, age and gender. A fifth variable, class of degree, is alsoimportant in explaining differences in employment outcomes.However, the sample was not sufficiently large to enable a fifthvariable to be controlled for at the sample selection stage, anddegree class was subsequently controlled for in the analysis.
The proportion of ethnic minorities in the sample was lower thanexpected, based on the initial sample design estimates previouslygiven by the selected universities, which ranged from ten to 40per cent. It was particularly low at University A. This was due tothe difficulty we encountered in selecting a sample ofuniversities which would adequately meet all the criteria, listedabove, and our initial over-estimation of the likely ethnicrepresentation at most pre-1992 universities. It proved difficult tofind many pre-1992 universities with a representation of ethnicminorities in the undergraduate population in excess of ten percent, many had considerably fewer (especially if overseas studentsare excluded). Also, the proportion of ethnic minorities has beenrising and, so while some may have current ethnic minoritypopulations at ten per cent or more, the average entry figure inthe late 1980s (when the 1993 graduates were admitted) wasunder eight per cent (see UCCA statistics in Chapter 2) and formany individual universities it was below five per cent at thattime. The problem of estimating levels of representation wascomplicated by the absence of data on ethnicity of students atmost universities prior to 1994, and so reliance had to be put onestimates, which proved very inaccurate in places. The mainsource of inaccuracy is thought to lie in the inclusion byuniversities of international students in their estimates, especiallyof postgraduates.
Table A.2.8: Respondents from the matched sample by degree subject
Degree subject N %
Business/finance 51 19
Social sciences 45 17
Arts and humanities 39 14
Engineering and technology 33 12
Maths and computing 24 9
Subjects allied to medicine 23 9
Professional courses 23 9
Multi-disciplinary 20 8
Natural/physical sciences 14 5
Total 272
Source: IES Survey

Ethnic Minority Graduates 115
Appendix 3: The Questionnaire

The Institute for Employment Studies116

Ethnic Minority Graduates 117
GRADUATES AND THE LABOUR MARKETConfidential to the Institute for Employment Studies
Please answer the following questions as fully as you are able by ticking the boxes or writing inthe spaces provided. Please return the completed questionnaire to IES in the reply-paid envelopeprovided. If you have any queries, please contact Ivana La Valle or Nii Djan Tackey at IES:telephone 01273 686751. Thank you for your co-operation.
1. Your Degree Course
1. What was the full name of the degree from which you graduated (eg BA (Hons) Sociology)? (Pleasewrite in)..........................................................................................................................
2. What was the class of your degree? (Please tick one box only)
First Upper Second Lower Second Third Other
(Please specify) ............................
3. How important were the factors below in determining your choice of university/polytechnic? (Pleasecircle number as appropriate)
Very Important Not very Not important Don’t know/important important at all not applicable
Cost of living in the area 1 2 3 4 5
Geographical location 1 2 3 4 5
Facilities 1 2 3 4 5
Positive attitudes towardsmature students 1 2 3 4 5
Positive attitudes towardsstudents from ethnicminorities 1 2 3 4 5
Recommendations ofothers 1 2 3 4 5
Offered subject orcombination of subjectsI wanted to study 1 2 3 4 5
Reputation 1 2 3 4 5
Other (Please specify) 1 2 3 4 5
......................................................................................................................................................................................
4. Was the university/polytechnic where you did your degree your first choice? (Please tick one box)
1 2 It was the only one I applied to 3
2. Your Education and Work Experience Before Your Degree Course
5. What was the highest level of qualification you gained before entering university/polytechnic? (Please tick one box)
‘A’ level
Scottish Highers Go to Q7
BTEC, HNC, OND Go to Q7
Other (Please specify Go to Q7
eg Professional qualification, Access course) .......................................................................................................
6. What ‘A’ level grades did you obtain?
1 2 3 4
Yes No
2
1
3
4
(38-39) (40-41) (42-43) (44-45)
5
(36-37)

The Institute for Employment Studies118
7. Did you have any of the following periods of work experience before doing your degree? (Please tickas appropriate)
Yes No
Voluntary unpaid work
Paid work for less than a year in total
Paid work for more than a year in total
Other type of work experience (Please specify) .................................................................................................
3. Experiences Since Graduation
In this section we are interested in what has happened to you since you graduated.
To answer the questions below you will need the following definitions:
8. For each specified month please circle your main status for that month only ie the category that bestdescribes your activities for the greatest period of that month (Please circle one number only for eachperiod of time)
Permanent Short-term Further Not available Unemployedemployment employment study for employment
What were you doing in:
December 1993(6 months after graduation) 1 2 3 4 5
June 1994(12 months after graduation) 1 2 3 4 5
December 1994(1½ years after graduation) 1 2 3 4 5
June 1995(2 years after graduation) 1 2 3 4 5
Now 1 2 3 4 5
3a. Further Study
If you have undertaken any further study (see definition above) since completing your degree course or youare currently studying, please answer questions 9 and 10, but if you have not undertaken any further study godirectly to section 3b.
9. Can you please indicate in the boxes/spaces below the type of course(s) you have undertaken,whether it was/they were full or part-time and when you started and finished (or are planning tofinish) it/them. Can you please start with the first course you did after graduating.
Qualification title and subject Mode of attendance Course durationFull-time = FT Part-time = PT from - to
(month and year)
................................................................. From ....................To ...............
................................................................. From ....................To ...............
................................................................. From ....................To ...............
Permanent employment: a job (full or part-time) that both you and your employer intend to last more than 3months, including voluntary work and internships.
Short-term employment: a job that lasts less than 3 months (both full and part-time).
Further study: full or part-time further study or continuing education leading to a qualification (eg MA, PhD,Professional Qualification).
Not available for employment: neither in employment nor further study and not looking for either.
Unemployed: not in work but seeking employment.
FT PT
FT
FT PT
PT

Ethnic Minority Graduates 119
10. How important were the following considerations in deciding to undertake further study? (Pleasecircle number as appropriate) If you have undertaken more than one course, please answer with
reference to the first course you did after graduating.
Very Important Not very Not important Don’t know/important important at all not applicable
To gain formal entryrequirement for a specificcareer/profession 1 2 3 4 5
To enhance my careerprospects in a particularfield or job 1 2 3 4 5
To enhance my careerprospects in general 1 2 3 4 5
To follow a personalinterest 1 2 3 4 5
Lack of employmentopportunities after graduating 1 2 3 4 5
Other (Please specify) 1 2 3 4 5
......................................................................................................................................................................................
3b. Unemployment
If there have been times (including now) since you graduated when you were unemployed (see definition onprevious page), please answer questions in this section, but if you have never been unemployed sincegraduating go directly to section 3c.
11. Since graduation how many times, in total, have you been unemployed? (Please write in)
12. Could you indicate below when was your longest period of unemployment ie when it started andwhen it finished. (Please write in)
From (month) ............................ 19...... (year) to (month) ............................. 19...... (year)
13. What factors do you feel have hindered you in your search for a suitable job? (Please write in)
......................................................................................................................................................................................
......................................................................................................................................................................................
......................................................................................................................................................................................
......................................................................................................................................................................................
If you are currently unemployed please answer Q14, if you are not unemployed at the moment go directly tosection 3c.
14. How many jobs have you applied for in the last six months? (Please write in 0 if you have not madeany job applications)
3c. Employment Experiences
Please answer questions in sections 3c and 4 with reference to any type of job you have had since graduatingie voluntary or paid, permanent or short-term, part or full-time. If you have never been in employment sincegraduating go directly to Q41 in section 6.
15. How many jobs have you had since graduation? (Please write in)
16. How many employers have you worked for since graduation? (Please write in)

The Institute for Employment Studies120
4. Your First Job
17. How many months after graduation did you obtain your first job? (Please write in)
18. How many jobs did you apply for before securing your first job? (Please write in)
19. How many job offers did you get before you obtained your first job — including the offer of your firstjob? (Please write in)
20. Is this your current job? (Please tick one box)
1 2 Not currently in employment 3
21. For how many months were you (or have you been) in your first job? (Please write in)
22. Below are some questions about your first job (Please tick as appropriate)
Were (are) you:
Yes No
full-time (ie 16 hours or more a week)?
part-time (ie less than 16 hours a week)?
on a contract for a fixed period?
self-employed?
on an internship, work or training placement?
working on a voluntary basis (ie unpaid)?
23. What was (is) your full job title? (Please write in) ................................................................................................
Approximately what was your starting annual salary, before tax? (Please write in, if unpaid please stateso)
£ ........................................................... per year
24. In which county/city (or country if not in the UK) was your job based? (Please write in)
.........................................................................................
25. Did (do) you work in: (Please tick one box)
A private sector company in:
manufacturing/engineering central government
construction local government
retailing the national health service
finance a school
legal services a university or college
media/publishing a voluntary organisation
other (Please specify) other (Please specify)
............................................................ ..........................................................
Yes No
01 08
09
10
11
12
13
14
02
03
04
05
06
07

Ethnic Minority Graduates 121
26. If you were (are) employed by a private sector company or a voluntary organisation, approximatelyhow many people were (are) employed in your company as a whole in the UK? (Please tick one box)
Under 100 employees 100-499 employees
500-1999 employees 2000 or more employees
5. Your Current Job
27. Below are some questions about your current employment status. If you are still in your first job godirectly to Q32. If you are not in employment at the moment go directly to Q41 in section 6.
Are you: (Please tick as appropriate)Yes No
full-time (ie 16 hours or more a week)?
part-time (ie less than 16 hours a week)?
on a contract for a fixed period?
self-employed?
working on a voluntary basis (ie unpaid)?
28. What is your full job title? (Please write in)
.......................................................................................................................................................................................
29. Do you work in: (Please tick one box)
A private sector company in:
manufacturing/engineering central government
construction local government
retailing the national health service
finance a school
legal services a university or college
media/publishing a voluntary organisation
other (Please specify) other (Please specify)
............................................................. ..........................................................
30. If you are employed by a private sector company or a voluntary organisation, approximately howmany people were (are) employed in your company as a whole in the UK? (Please tick one box)
Under 100 employees 100-499 employees
500-1999 employees 2000 or more employees
31. In which county/city (or country if not in the UK) is your job based? (Please write in)
..........................................................................................
32. Approximately what is your current annual salary before tax? (Please write in, if unpaid please state so)
£ ..................................... per year
3
3
01 08
09
10
11
12
13
14
02
03
04
05
06
07
1
1
4
4
2
2

The Institute for Employment Studies122
33. Would you describe your job as ‘graduate level employment’ in the sense that: (Please tickas appropriate)
Yes No Don’t know/not applicable
A degree was a formal entry requirement
A degree was helpful in getting the job
The work requires graduate ability
The previous holder was a graduate
Entry was via a graduate trainee programme
34. Do you consider yourself underemployed (not being used to your full capacity and potential) in yourjob? (Please tick one box)
Very Slightly Not at allGo to Q36
35. In what ways do you feel underemployed?
.......................................................................................................................................................................................
.......................................................................................................................................................................................
.......................................................................................................................................................................................
.......................................................................................................................................................................................
36. How important were the factors below in deciding to apply and then accepting your current job?(Please circle number as appropriate)
Very Important Not very Not important Don’t know/important important at all not applicable
It suited my skillsand interests 1 2 3 4 5
Salary level 1 2 3 4 5
Company’s reputation 1 2 3 4 5
Company’s equal opportunitypolicy and practice 1 2 3 4 5
Training opportunities 1 2 3 4 5
Opportunities forcareer development 1 2 3 4 5
Geographical location 1 2 3 4 5
Other (Please specify) 1 2 3 4 5
.......................................................................................................................................................................................
.......................................................................................................................................................................................
2 3
2 3
2
2
2
3
3
3
1
1
1
1
1
1 2 3

Ethnic Minority Graduates 123
37. To what extent, if any, have you encountered the following difficulties in your current job? (Pleasecircle number as appropriate)
Not at all Not very A little A fair amount A great dealmuch
Tight control(lack of autonomy) 1 2 3 4 5
Lack of challenging work 1 2 3 4 5
Lack of proper orunsatisfactory training 1 2 3 4 5
Age discrimination 1 2 3 4 5
Racial discrimination 1 2 3 4 5
Sex discrimination 1 2 3 4 5
Other (Please specify) 1 2 3 4 5
......................................................................................................................................................................................
38. How would you rate your promotion prospects in the next two years on a five point scale going from0 for ‘very poor’ to 5 for ‘very good’? (Please circle one number only)
Very poor Very good0 1 2 3 4 5
39. Since being in your current job have you: (Please tick as appropriate)Yes No
applied for promotion
been considered for promotion
been promoted
40. Overall how satisfied are you with your career to date? (Please tick one box)
Very satisfied Satisfied Neither satisfiednor dissatisfied
Dissatisfied Very dissatisfied
6. Personal Details
41. Are you: (Please tick one box) Female Male
42. What was your age on your last birthday? (Please write in) ....................... (years)
43. Do you have any dependent children living with you? (Please tick one box)
44. Which of the categories below best describes your ethnic origin? (Please tick one box)
Black African Black Caribbean Black Other
Indian Pakistani Bangladeshi
Chinese Other Asian Mixed ethnicorigin
White Other(Please specify) ..................................................................................
No
01 02 03
1
04
2
05
3
06
4
07
5
08 09
10
Yes
11

The Institute for Employment Studies124
45. Can you please indicate below where was your place of residence i) before going to university/polytechnic and ii) where is your current residence? (Please tick as appropriate)
Your residence i) Before university/polytechnic ii) Currently
Greater London
South East England (including East Anglia)
South West England
Midlands
North England
Wales
Scotland
N. Ireland
No main residence
Other (Please specify) ....................................... .......................................
Thank you for completing the questionnaire. We would like to interview a small sample of graduates whohave taken part in this survey, to explore in more depth the main influences on their career so far. If youwould like to take part in the follow-up interview, could you please write your name, address and telephonenumber(s) in the space below.
Name: ........................................................................................................................................................................
Address: .....................................................................................................................................................................
Telephone number: ........................................ (home) .................................. (work)
Thank you for spending time and effort to complete the questionnaire. If you wish please add any commentsin the space below .
Thank you for your assistance. Please return the questionnaire in the reply paid envelope direct to:Institute for Employment Studies, Mantell Building, University of Sussex, Falmer, Brighton, BN1 9RFFax: 01273 690 430 Tel: 01273 686 751
07
01
03
04
05
06
08
01
04
05
06
07
08
09 09
03
02 02
10 10