ethnic minority women’s poverty and economic well being · ethnic minority women’s poverty and...
TRANSCRIPT
Ethnic minority women’s poverty and
economic well being
Report for the Government Equalities Office
Alita Nandi Lucinda PlattISER, University of Essex IOE
10th June 2011

Objectives:
� Describe economic well-being of women across
different ethnic groups
� Discuss the link between women’s and children’s
economic well-beingeconomic well-being
� Compare poverty rates

Data
� Family Resources Survey (FRS)– Continuous household survey
– Repeated cross-sectional survey with the financial year as reference period
– UK population living in private households
– Target annual sample size of 29,000 households– Target annual sample size of 29,000 households
� Households Below Average Income (dataset containing variables derived from the FRS)
� This sample:– Pooled, 2003/04 to 2007/08
– without Northern Ireland

Sample
All Adults
(% of total)
Female/
Male ratio
Children
(% of adults)
White British 196542 89.06% 1.12 58550 30%
Indian 3767 1.71% 1.05 1470 39%Indian 3767 1.71% 1.05 1470 39%
Pakistani 2260 1.02% 1.05 1640 73%
Bangladeshi 706 0.32% 1.11 605 86%
Chinese 732 0.33% 1.33 207 28%
Black Caribbean 2009 0.91% 1.32 938 47%
Black African 1836 0.83% 1.28 1353 74%
Total 220679 100.00% 1.13 69142 31%

Sample
All Adults
(% of total)Sex ratio
Children
(% of adults)
White British 196542 89.06% 1.12 58550 30%
Indian 3767 1.71% 1.05 1470 39%Indian 3767 1.71% 1.05 1470 39%
Pakistani 2260 1.02% 1.05 1640 73%
Bangladeshi 706 0.32% 1.11 605 86%
Chinese 732 0.33% 1.33 207 28%
Black Caribbean 2009 0.91% 1.32 938 47%
Black African 1836 0.83% 1.28 1353 74%
Total 220679 100.00% 1.13 69142 31%

Children live primarily with their
mothers/women60
8010
00
2040
All White British Indian Pakistani Bangladeshi Chinese Black-Caribbean Black-African
only men in HH only women in HHboth men and women in HH

Number of children per household1.
52
2.5
0.5
11.
5
White British Indian Pakistani Bangladeshi Chinese Black-Caribbean Black-African

� Individual income: Net (of taxes) individual income that includes tax credits received as benefits
� Household income: Net (of taxes) total
Different income measures
� Household income: Net (of taxes) total household income equivalised by the OECD equivalence scale, before housing costs� Income pooling & Income sharing
� Material deprivation (only for families with children): prevalence weighted deprivation scores

� Mean income: Average income
� Median income: Income below which 50% of the sample’s income lies
Different methods of summarising
� Poverty threshold (yearly): 60% of the median of equivalised household incomes of the population for that year

Average individual and household incomes
CN
High
mean
individual
incomes
Gain from Bangladeshi
Pakistani
Black-Caribbean
Black-African
Indian
Chinese
White British
Men
Bangladeshi
Pakistani
Black-Caribbean
Black-African
White British
Indian
Chinese
Men
Gain from
income
pooling
0 100 200 300 400
Bangladeshi
Pakistani
Bangladeshi
Indian
White British
Black-African
Black-Caribbean
Chinese
Women
Individual income (£)
0 100 200 300 400
Bangladeshi
Bangladeshi
Pakistani
Black-Caribbean
Black-African
White British
Indian
Chinese
Women
Household equivalent income (£)
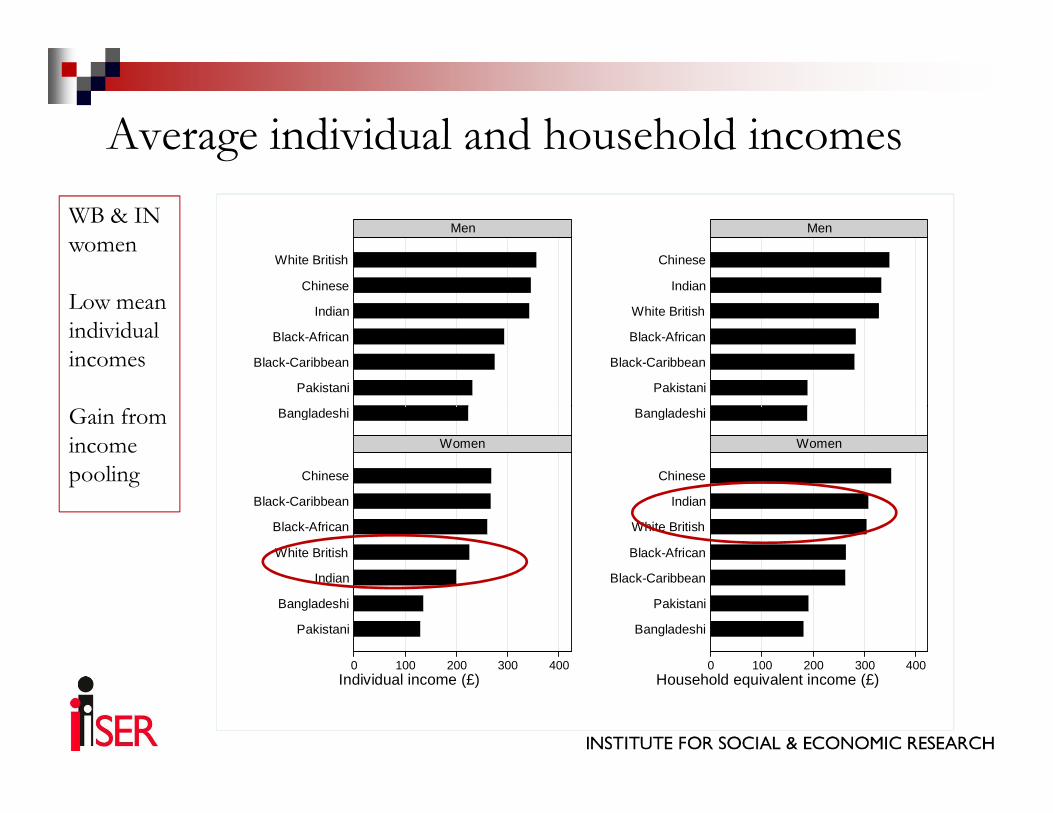
Average individual and household incomes
WB & IN
women
Low mean
individual
incomes
Gain from Bangladeshi
Pakistani
Black-Caribbean
Black-African
Indian
Chinese
White British
Men
Bangladeshi
Pakistani
Black-Caribbean
Black-African
White British
Indian
Chinese
Men
Gain from
income
pooling
0 100 200 300 400
Bangladeshi
Pakistani
Bangladeshi
Indian
White British
Black-African
Black-Caribbean
Chinese
Women
Individual income (£)
0 100 200 300 400
Bangladeshi
Bangladeshi
Pakistani
Black-Caribbean
Black-African
White British
Indian
Chinese
Women
Household equivalent income (£)

Average individual and household incomes
BA & PK
Low mean
individual
incomes
Gain from
income Bangladeshi
Pakistani
Black-Caribbean
Black-African
Indian
Chinese
White British
Men
Bangladeshi
Pakistani
Black-Caribbean
Black-African
White British
Indian
Chinese
Men
income
pooling
BUT…
0 100 200 300 400
Bangladeshi
Pakistani
Bangladeshi
Indian
White British
Black-African
Black-Caribbean
Chinese
Women
Individual income (£)
0 100 200 300 400
Bangladeshi
Bangladeshi
Pakistani
Black-Caribbean
Black-African
White British
Indian
Chinese
Women
Household equivalent income (£)

Average individual and household incomes
BC & BA
High
mean
individual
incomes
Hardly Bangladeshi
Pakistani
Black-Caribbean
Black-African
Indian
Chinese
White British
Men
Bangladeshi
Pakistani
Black-Caribbean
Black-African
White British
Indian
Chinese
Men
Hardly
gain from
income
pooling
0 100 200 300 400
Bangladeshi
Pakistani
Bangladeshi
Indian
White British
Black-African
Black-Caribbean
Chinese
Women
Individual income (£)
0 100 200 300 400
Bangladeshi
Bangladeshi
Pakistani
Black-Caribbean
Black-African
White British
Indian
Chinese
Women
Household equivalent income (£)

Average individual and household incomes:
for men & women with dependant children
Pakistani
Black-African
Black-Caribbean
Indian
White British
Chinese
Men
Pakistani
Black-African
Black-Caribbean
Indian
White British
Chinese
MenBC & BA
High
mean
individual
incomes
0 100 200 300 400
Bangladeshi
Pakistani
Pakistani
Bangladeshi
Indian
White British
Black-African
Chinese
Black-Caribbean
Women
Individual income (£)
0 100 200 300 400
Bangladeshi
Pakistani
Bangladeshi
Pakistani
Black-African
Black-Caribbean
Indian
White British
Chinese
Women
Household equivalent income (£)
Lose from
income
pooling
Gains from income pooling and income sharing
Comparing women’s individual and household incomes:� Black Caribbean and Black African women
– high mean individual incomes
– hardly gain from income pooling
– Women with dependent children LOSE from pooling
� Chinese women:� Chinese women:– high average individual incomes
– gain from income pooling
� White British and Indian women: – low average individual incomes
– gain from income pooling
� Bangladeshi & Pakistani women:– low average individual incomes
– gain from income pooling BUT…
Men on an average have higher individual incomes than women in the same ethnic groups

Women with dependent children
� Men and women with children have higher individual incomes
(except Bangladeshi and Pakistani women)
� But lower household incomes on average than those without
(except Chinese women). (except Chinese women).
� Women with children are more likely to be poor than women
without children.
� They are more likely to be younger

Family composition of women by ethnic groups
Chinese
Bangladeshi
Pakistani
Indian
White British
0 20 40 60 80 100
Percent (%)
Black-African
Black-Caribbean
Chinese
single, no children single, with childrenone or more adults, no children one or more adults, and children

Family composition of women with dependent children by ethnic groups
Bangladeshi
Pakistani
Indian
White British
0 20 40 60 80 100
Percent (%)
Black-African
Black-Caribbean
Chinese
Bangladeshi
single, with childrenone or more adults, and children

Ethnic composition of spouse/partners
Pakistani
Indian
White British
All
0 .2 .4 .6 .8 1
Proportion of women in couples
Black-African
Black-Caribbean
Chinese
Bangladeshi
Partner of same ethnic group White British partner

Median individual and household incomes
Pakistani
Bangladeshi
Black-Caribbean
Black-African
Chinese
Indian
White British
Men
Bangladeshi
Pakistani
Black-African
Black-Caribbean
Indian
White British
Chinese
MenRank of
Chinese
women w.r.t.
median
individual
income
is lower
0 100 200 300
Pakistani
Pakistani
Bangladeshi
Indian
White British
Chinese
Black-African
Black-Caribbean
Women
Individual income (£)
0 100 200 300
Bangladeshi
Bangladeshi
Pakistani
Black-African
Black-Caribbean
Indian
White British
Chinese
Women
Household equivalent income (£)
Rank of Indian
and Black
African women
w.r.t. median
HH equiv
income is lower

Women’s individual income by ethnic groups0
.00
1.0
02.0
03.0
04
0 400 800 1200
White British
Indian
0.0
01
.002
.003
.004
0 400 800 1200
White British
Pakistani
0.0
01.0
02
.003
.00
4
0 400 800 1200
White British
Bangladeshi
0 400 800 1200
£ per week
0 400 800 1200
£ per week
0 400 800 1200
£ per week
0.0
01
.00
2.0
03
.00
4
0 400 800 1200
£ per week
White British
Chinese
0.0
01
.00
2.0
03
.00
4
0 400 800 1200
£ per week
White British
Black Caribbean
0.0
01
.00
2.0
03
.00
4
0 400 800 1200
£ per week
White British
Black African
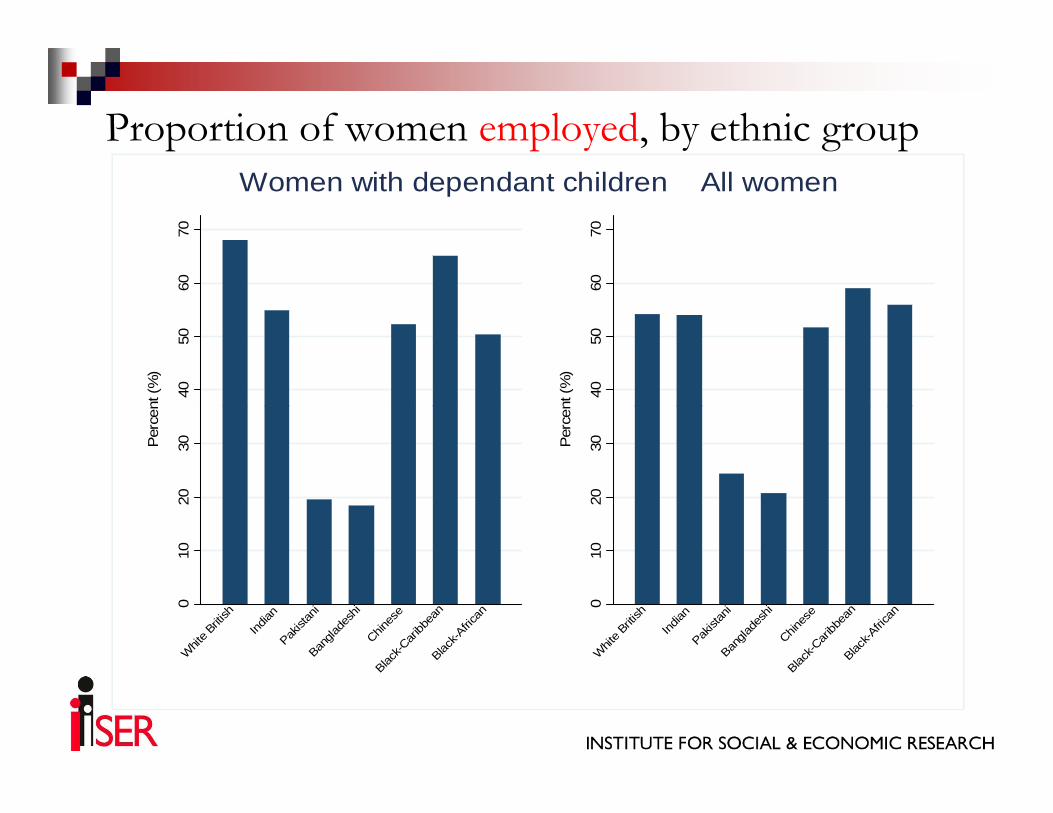
Proportion of women employed, by ethnic group40
5060
70
Per
cent
(%
)
4050
6070
Per
cent
(%
)
Women with dependant children All women0
1020
30Per
cent
(%
)
Whit
e Brit
ish
India
nPak
istan
iBan
glad
eshi
Chines
e
Black-
Caribb
ean
Black-
Africa
n
010
2030P
erce
nt (%
)
Whit
e Brit
ish
India
nPak
istan
iBan
glad
eshi
Chines
e
Black-
Caribb
ean
Black-
Africa
n

Proportion of women employed, by ethnic group40
5060
70
Per
cent
(%
)
4050
6070
Per
cent
(%
)
Women with dependant children All women
White British Men: 66.6%
White British Men: 87.2%
010
2030P
erce
nt (%
)
Whit
e Brit
ish
India
nPak
istan
iBan
glad
eshi
Chines
e
Black-
Caribb
ean
Black-
Africa
n
010
2030P
erce
nt (%
)
Whit
e Brit
ish
India
nPak
istan
iBan
glad
eshi
Chines
e
Black-
Caribb
ean
Black-
Africa
n

Women’s household income by ethnic groups.0
01
.00
2.0
03
.00
4
White British
Indian
.00
1.0
02.0
03.0
04
White British
Pakistani
.001
.002
.003
.00
4
White British
Bangladeshi
0
0 400 800 1200
£ per week
0
0 400 800 1200
£ per week
0
0 400 800 1200
£ per week
0.0
01.0
02.0
03.0
04
0 400 800 1200
£ per week
White British
Chinese
0.0
01.0
02.0
03.0
04
0 400 800 1200
£ per week
White British
Black Caribbean
0.0
01
.002
.003
.00
4
0 400 800 1200
£ per week
White British
Black African

Individual Income gaps for women of different ethnic groups vis-à-vis White British Men
White British women
Indian women
Pakistani women
Bangladeshi women
All income
gaps are
negative and
significantly Chinese women
Black Caribbean women
Black African women
0 10 20 30 40 50 60 70
Individual Income Gap (%)Women
vis-a-vis all White British Men
95% confidence interval Mean gap
significantly
different
from zero

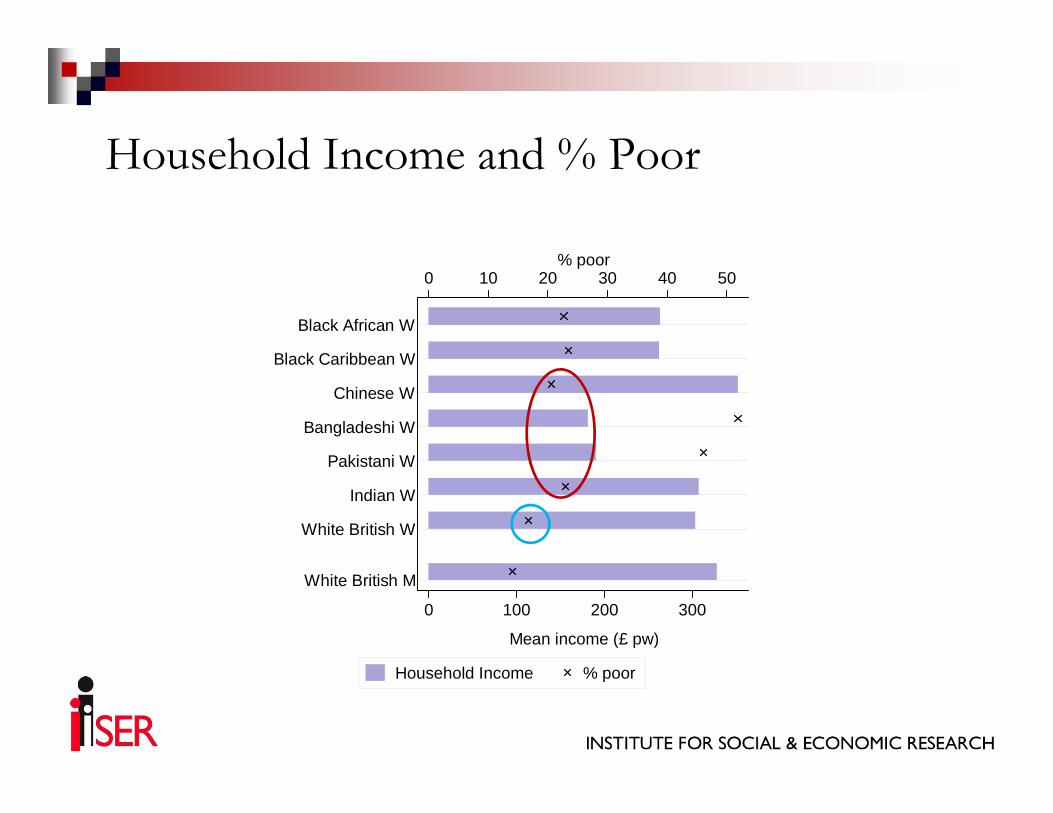
Household Income and % Poor
Chinese W
Black Caribbean W
Black African W
0 10 20 30 40 50% poor
White British M
White British W
Indian W
Pakistani W
Bangladeshi W
0 100 200 300
Mean income (£ pw)
Household Income % poor

Household Income and % Poor
Chinese W
Black Caribbean W
Black African W
0 10 20 30 40 50% poor
White British M
White British W
Indian W
Pakistani W
Bangladeshi W
0 100 200 300
Mean income (£ pw)
Household Income % poor
Household Income and % Poor
Chinese W
Black Caribbean W
Black African W
0 10 20 30 40 50% poor
White British M
White British W
Indian W
Pakistani W
Bangladeshi W
0 100 200 300
Mean income (£ pw)
Household Income % poor

Household Income and % Poor
Chinese W
Black Caribbean W
Black African W
0 10 20 30 40 50% poor
Chinese W
Black Caribbean W
Black African W
0 10 20 30 40 50% poor
Women with dependent children All Women
White British M
White British W
Indian W
Pakistani W
Bangladeshi W
0 100 200 300
Mean income (£ pw)
Household Income % poor
White British M
White British W
Indian W
Pakistani W
Bangladeshi W
0 100 200 300
Mean income (£ pw)
Household Income % poor

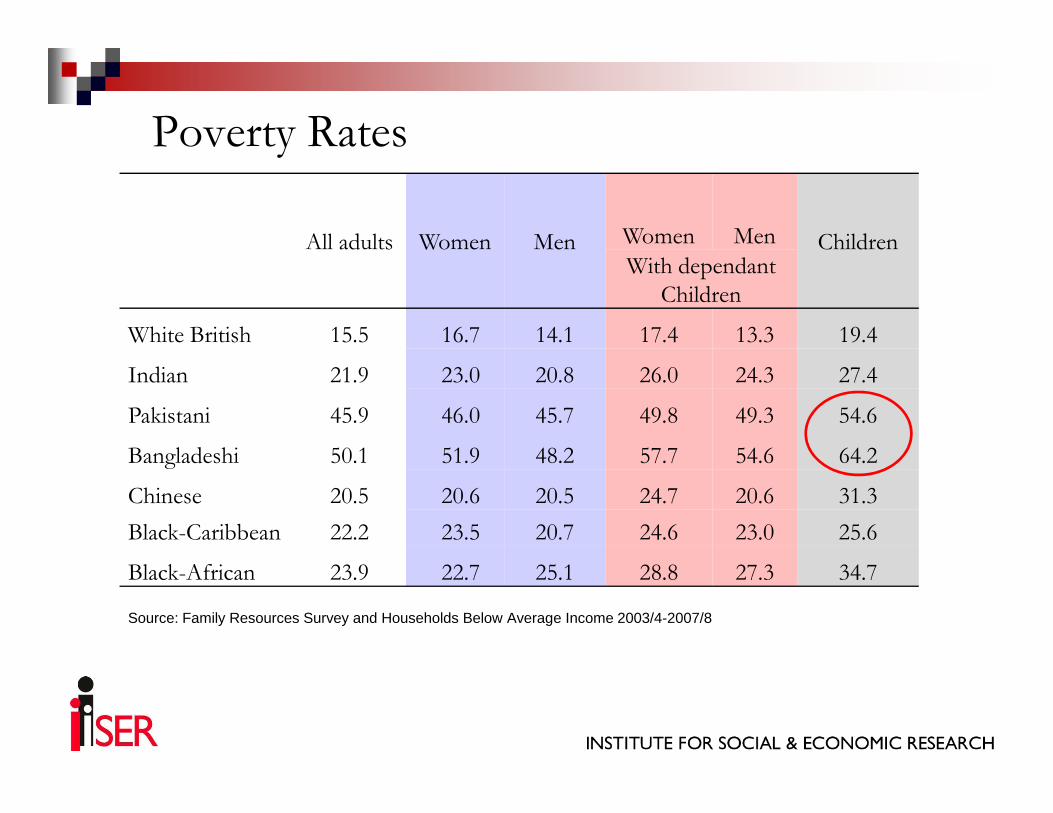
Poverty Rates
All adults Women Men Women Men ChildrenWith dependant
Children
White British 15.5 16.7 14.1 17.4 13.3 19.4
Indian 21.9 23.0 20.8 26.0 24.3 27.4
Pakistani 45.9 46.0 45.7 49.8 49.3 54.6
Child poverty rates are higher
than that of women or men in
the same ethnic group
Pakistani 45.9 46.0 45.7 49.8 49.3 54.6
Bangladeshi 50.1 51.9 48.2 57.7 54.6 64.2
Chinese 20.5 20.6 20.5 24.7 20.6 31.3
Black-Caribbean 22.2 23.5 20.7 24.6 23.0 25.6
Black-African 23.9 22.7 25.1 28.8 27.3 34.7
Source: Family Resources Survey and Households Below Average Income 2003/4-2007/8
Poverty Rates
All adults Women Men Women Men ChildrenWith dependant
Children
White British 15.5 16.7 14.1 17.4 13.3 19.4
Indian 21.9 23.0 20.8 26.0 24.3 27.4
Pakistani 45.9 46.0 45.7 49.8 49.3 54.6Pakistani 45.9 46.0 45.7 49.8 49.3 54.6
Bangladeshi 50.1 51.9 48.2 57.7 54.6 64.2
Chinese 20.5 20.6 20.5 24.7 20.6 31.3
Black-Caribbean 22.2 23.5 20.7 24.6 23.0 25.6
Black-African 23.9 22.7 25.1 28.8 27.3 34.7
Source: Family Resources Survey and Households Below Average Income 2003/4-2007/8
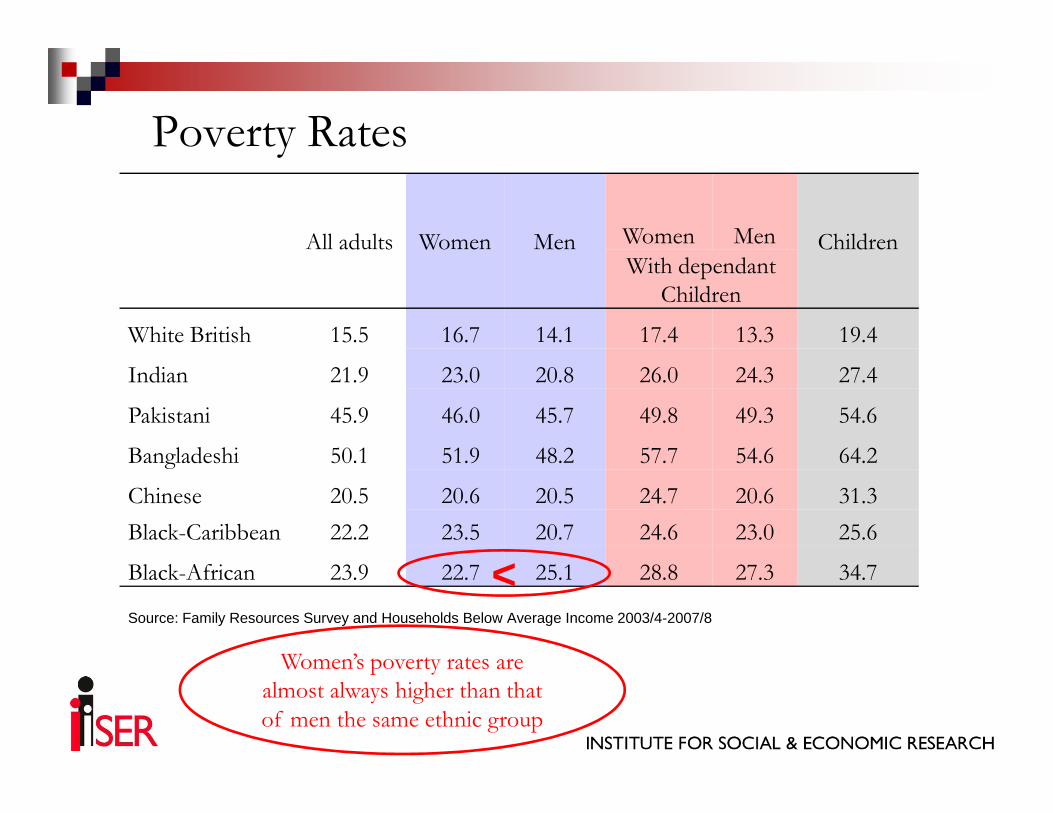
Women’s poverty rates are
almost always higher than that
of men the same ethnic group
<

Income composition

Individual income composition
Bangladeshi
Pakistani
Indian
White British
Women
0 20 40 60 80 100
Percent share
Black-African
Black-Caribbean
Chinese
Earnings Self-employment Pension incomeBenefits Tax credits as benefits Other income

Age composition of all women by ethnic groups
Chinese
Bangladeshi
Pakistani
Indian
White BritishOverall women in all non-white groups are more likely to be younger:more than
0 20 40 60 80 100
Percent (%)
Black-African
Black-Caribbean
Chinese
16-24 25-34 35-44 45-5455-64 65-74 75+
more than 75% are 54 years or less while only 59% of white women are 55 or less

Age composition of women with dependent children by ethnic groups
Bangladeshi
Pakistani
Indian
White BritishAs expected women with dependent children are relatively younger:
0 20 40 60 80 100
Percent (%)
Black-African
Black-Caribbean
Chinese
16-24 25-34 35-44 45-5455-64 65-74 75+
around 80% are 44 years or less

� Very little variation in income gaps between ethnic
groups for different age groups
� Except at very young or very old ages
Age-income profiles350
Individual Income (£ per week)
350
Equivalent Household Income (£ per week)
50100
150
200
250
300
350
16-24 25-34 35-44 45-54 55-64 65-74 75+
age in years
50100
150
200
250
300
350
16-24 25-34 35-44 45-54 55-64 65-74 75+
age in years
White British Pakistani Bangladeshi

Individual Income� Earnings
– important source for all, 50-60%– except for Bangladeshi & Pakistani women, 30-40% &
25-30% for women with dependent children
Women’s income composition
25-30% for women with dependent children
� Non-pension benefits and tax credits– Important for Bangladeshi & Pakistani women, 45-50%– Relatively important for Caribbean and Black African
women, 20-25% – Important for Pakistani & Bangladeshi women with
dependent children, 10% higher

Individual Income� Pension
– Important for White British women, 20%
� Other income and self-employment income– Important source for Chinese women
Women’s income composition
– Important source for Chinese women
Household Income� Labour income more important, and � Non-pension benefits & tax credits less
important

Individual income inequalities by ethnic group
Mean logarithmic
deviationGini
Mean logarithmic
deviationGini
With Dependent Children
All 0.45 0.42 0.49 0.43
Pakistani 0.88 0.51 0.79 0.50
Chinese 0.78 0.50 0.88 0.58
Bangladeshi 0.77 0.47 0.70 0.46
Indian 0.73 0.47 0.72 0.49
Black African 0.64 0.43 0.62 0.41
Black Caribbean 0.44 0.38 0.47 0.37
White British 0.41 0.41 0.44 0.42Inequality
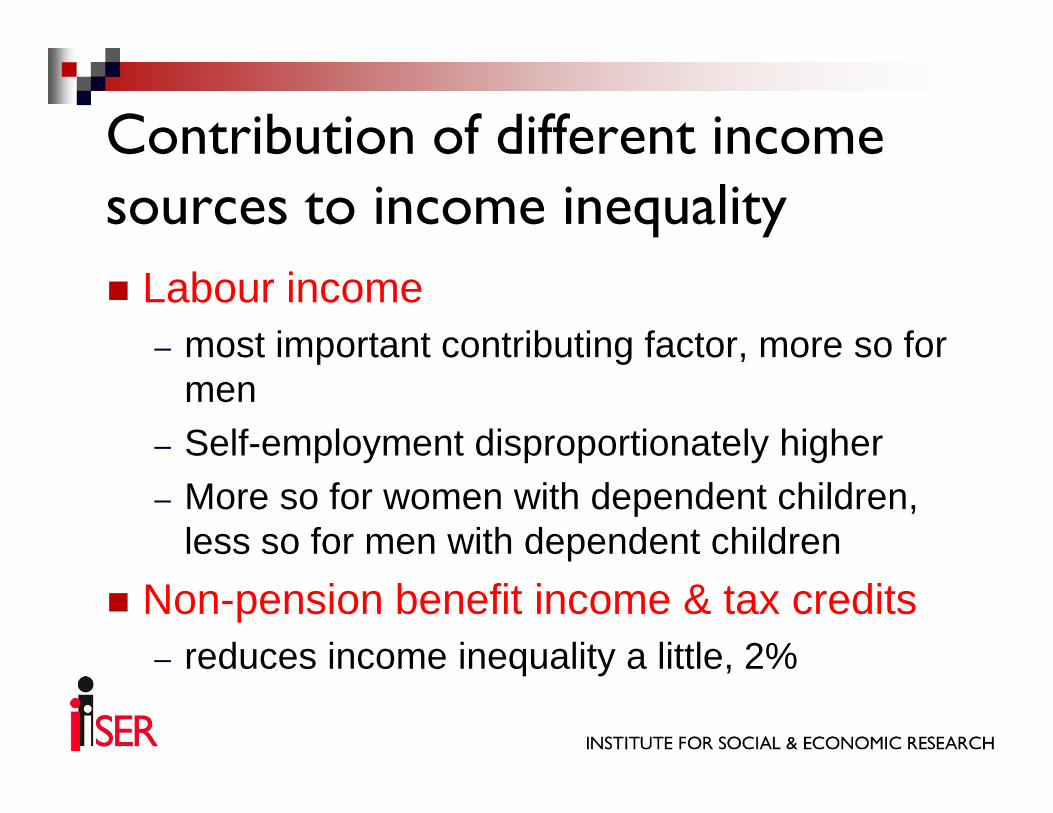
� Labour income – most important contributing factor, more so for
men
Contribution of different income sources to income inequality
men– Self-employment disproportionately higher– More so for women with dependent children,
less so for men with dependent children
� Non-pension benefit income & tax credits – reduces income inequality a little, 2%

Distribution of deprivation scores of women with children by ethnic groups
0.2
.4.6
.4.6
White British Indian Pakistani
Bangladeshi Chinese Black Caribbean
Pro
portio
n w
ith d
epriv
atio
n sc
ore
0.2
.40
.2.4
.6
0 50 100
0 50 100 0 50 100
Black African Total
Pro
portio
n w
ith d
epriv
atio
n sc
ore
Deprivation score

Distribution of deprivation scores of children by ethnic groups
0.5
.5White British Indian Pakistani
Bangladeshi Chinese Black Caribbean
Pro
port
ion
with
dep
rivat
ion
scor
e0
0.5
0 50 100
0 50 100 0 50 100
Black African Total
Pro
port
ion
with
dep
rivat
ion
scor
e
Deprivation score
Nearly half of Bangladeshi children have incomes < 70% of Median AND deprivation scores >25
All children: 16-17%

� Diversity of women’s income within and between ethnic groups
� But a substantial proportion of women are poor across different ethnic groups to varying degree
To conclude
across different ethnic groups to varying degree
� Women’s poverty is very closely related to poverty of children as most children live with at least one woman guardian

� Poverty is determined not just by women’s wages, or even their total income
� Who they live with matters: income pooling (sharing rule) and family size
To conclude
(sharing rule) and family size
� Different patterns of women’s own income and income pooling across groups
� We need to measure economic well-being directly

� Bangladeshi & Pakistani women: low own income, low income of spouses
� Black Caribbean and African women: high own income, relatively lower income of
To conclude
income, relatively lower income of spouses/partner, single mothers
� Indian and Chinese women: gain from income pooling on average, but high within group income inequality

Thank You!